sustainability and replicability of …ageconsearch.umn.edu/bitstream/208418/2/iwmi...collection...
TRANSCRIPT

--
SUSTAINABILITY AND REPLICABILITY
OF MULTIPLE-USE WATER SYSTEMS
(MUS)
Study for the Market Access and Water
Technology for Women project
Submitted to:
THE UNITED STATES AGENCY FOR INTERNATIONAL DEVELOPMENT (USAID)
Submitted by:
International Water Management Institute (IWMI)
In partnership with iDE, SAPPROS, Samjhauta and NTAG
IWMI - Nepal office, GPO 8975 EPC 416, Kathmandu, Nepal
12th March 2015
This publication was produced at the request of the United States Agency for
International Development. It was prepared independently by Floriane
Clement (IWMI), Paras Pokhrel and Tashi Yang Chung Sherpa

SUMMARY
The concept of multiple-use water services and systems (MUS) has received increasing attention in
international water and development fora and has emerged as a promising way to enhance the social
and gender equity and productivity of water systems designed for single use, e.g. for irrigation or water
supply. In Nepal, several MUS models have been piloted and implemented for more than a decade by
the International Development Enterprises (iDE) and a few other development organizations. Whereas
the short-term benefits of these systems on gender relationships, women’s empowerment, nutrition and
health have been documented, the sustainability and resilience of these systems has not yet been
analyzed. The latter is the focus of the research study presented in this report, which was conducted by
the International Water Management Institute (IWMI) in Western Nepal as part of the USAID-funded
Market Access and Water Technology for Women (MAWTW) project.
IWMI research team first conducted a rapid appraisal of 16 MUS, most of which were implemented
seven to ten years ago under the SIMI program to assess their sustainability. This led to an in-depth
comparative case study of two MUS to explore the social processes affecting equity and sustainability
of systems with different social-ecological characteristics. The study also examined the performance of
collection centers and marketing and planning committees (MPCs) as these are key components of the
value-chain approach associated with MUS for vegetable production and sale.
Research findings show that MUS are overall more sustainable than single-use systems in Nepal:
87.5% of the MUS surveyed are still fully functional or need minor repair versus 56.8% of the single-
use domestic supply systems surveyed in a recent study led by the Department of Water Supply and
Sanitation (DWSS).
A large majority of systems are still delivering water for multiple uses and have active formal
institutions. The cost benefit analysis for the systems surveyed indicates a cost-benefit ratio of 11
(excluding non-monetary benefits reported by water users such as enhanced nutrition and improved
health, better sanitation and time saved). The internal factors affecting sustainability were identified as
the inter-relationships of social capital (in particular, trust and reciprocity), characteristics of water
resources (water flow) and characteristics of the infrastructure (geographical extent of the system,
technological capacity to distribute water equitably). The economic returns generated by MUS
contribute to water users’ efforts to protect the source and their financial capacity to maintain the
system, but the study found that they can also threaten the systems’ sustainability if distributed
unequally and unfairly. Lack of formal linkages of the MUS/MPC to government agencies and high
rates of male out-migration were found to be the main external factors threatening the system’s
sustainability.
Recommendations to enhance the sustainability of MUS and of small-scale water systems in general
are: (1) to include an assessment of the level of social capital of the community and of existing
conflicts over water use in the feasibility study to inform the selection and design processes; (2) to
conduct both an engineering survey and a social survey where the latter would assess existing and
potential inequities in water use; (3) to conduct an assessment of the potential threats to local water
resources, including current and future uses and needs of the neighboring communities; (4) to provide
extended institutional support to systems in which inequities in water distribution cannot be fixed by
technological intervention and; (5) to develop linkages between water users, collection centers/MPCs
and local/line government agencies for enhanced synergy of resources use and service distribution.

TABLE OF CONTENTS
LIST OF BOXES I
LIST OF FIGURES I
LIST OF TABLES II
GLOSSARY III
I. INTRODUCTION 1
1. Context 1
2. Resilience, robustness and sustainability of social-ecological systems 2
3. Objectives and research questions 4
4. Limitations of the study 4
II. HISTORY AND RATIONALE FOR MUS 5
1. MUS in the world 5
2. SIMI project 6
III. ANALYTICAL FRAMEWORK FOR THE STUDY AND METHODOLOGY 7
1. Resilience and sustainability indicators 7
2. Methodology 9
IV. POTENTIAL FOR SUSTAINABILITY: A RAPID APPRAISAL 15
1. Setting the scene: local context 15
2. Sustainability indicators 18
3. Farmers’ perception of resilience 25
4. Potential for sustainability assessed by the study 25
5. Exploring the socio-economic factors affecting sustainability 29
V. CASE STUDY OF MUS WITH HIGH POTENTIAL FOR SUSTAINABILITY (LUMLE-I) 32
1. MUS setting 32
2. Equity 36
3. Vegetable commercialization 37
4. Sustainability/Aspirations for the future 38
VI. CASE STUDY OF MUS WITH LOW POTENTIAL FOR SUSTAINABILITY (BHANDAREKHOLA) 38
1. MUS Setting 38
2. Water distribution and equity 43
3. Vegetable commercialization 46
4. Sustainability/Aspirations for the future 47
VII. VEGETABLE COMMERCIALISATION 47
1. Performance of the collection centers and MPCs 47
2. Profile of farmers producing and selling vegetables 50
3. Expectations on the services and performance of collection centers 53
4. External factors affecting vegetable sale 53
VIII. DISCUSSION 54
1. Prioritization of water uses and negotiation over equity 54
2. Sustainability 55
3. Water use efficiency and drip irrigation 57
IX. CONCLUSION AND RECOMMENDATIONS 59
1. Sustainability of MUS 59
2. Vegetable production and commercialization 61
ACKNOWLEDGEMENTS 63
REFERENCES 64
i
List of boxes
Box 1. Types of land in Nepal................................................................................................... .................................6
Box 2. Design principles for robust institutions…...................................................................................................56
List of figures
Figure 1. Conceptual model of a social ecological system (Anderies et al., 2004) .................................................. 7 Figure 2. History of the 16 systems surveyed ......................................................................................................... 16 Figure 3. Evolution of the 16 systems surveyed since the SIMI construction ........................................................ 16 Figure 4. Characteristics of the water users in the 16 systems surveyed ............................................................... 17 Figure 5. Marketing context for the 16 MUS surveyed .......................................................................................... 18 Figure 6. Condition of the source of the 16 MUS surveyed ................................................................................... 18 Figure 7. Water users’ perception of equity in the 16 MUS surveyed ................................................................... 19 Figure 8. Type of institutions in place in the 16 MUS surveyed............................................................................. 19 Figure 9. Physical condition of the 16 MUS surveyed ........................................................................................... 20 Figure 10. Performance indicators for the 16 MUS surveyed ............................................................................... 21 Figure 11. Overall performance of the 16 MUS surveyed ..................................................................................... 21 Figure 12. Type of expenses covered by income from vegetable selling across the 16 systems surveyed.............. 22 Figure 13. Type of benefits from MUS reported by water users the 16 systems surveyed ..................................... 23 Figure 14. Farmers’ perception of the resilience of their system in the 16 MUS surveyed overall (left) and
disaggregated by system (right) ............................................................................................................................. 25 Figure 15. Indicators of sustainability for the 16 systems surveyed ...................................................................... 26 Figure 16. Systems assessed with a medium to high potential for sustainability ................................................... 27 Figure 17. Systems assessed with a low potential for sustainability ...................................................................... 29 Figure 18. Stacked column graph showing sustainability versus size of the water user group ............................. 30 Figure 19. Stacked column graph showing equity versus size of the water user group ......................................... 30 Figure 20. Stacked column graph showing equity versus number of ethnic groups in the water user group ........ 31 Figure 21. Stacked column graph showing equity versus level of security of the source ....................................... 31 Figure 20. Characteristics of the seven collection centers surveyed ..................................................................... 47 Figure 21. Gender representation in the seven MPCs surveyed ............................................................................ 48 Figure 22. Ethnic representation in the seven MPCs surveyed.............................................................................. 49 Figure 23. Outreach of the seven MPCs surveyed ................................................................................................. 49 Figure 24. Institutional arrangements in the seven MPCs surveyed ...................................................................... 50 Figure 25. Distribution of the quantity of vegetables sold per farmer in July-August 2014 .................................. 52

ii
List of tables
Table 1: List of previous studies on MUS implemented under SIMI in Nepal ....................................................... 10 Table 2: List of MUS studied for the first phase and their characteristics ............................................................ 12 Table 3: List of MPCs studied for the first phase and their characteristics ........................................................... 13 Table 4. Methods used during the first and second phases .................................................................................... 14 Table 5. Cost-benefit analysis (average of over 11 systems).................................................................................. 24 Table 6. Yearly cash flow projections (in NPR) ..................................................................................................... 24 Table 5. Main characteristics of the water users in Lumle-I at the time of the fieldwork ...................................... 33 Table 6. Main characteristics of the water users in Bhandarekhola at the time of the fieldwork .......................... 39 Table 7. Profile of farmers selling at the Syangja cooperative and Kaski collection center in the month of
Shrawan 2071 (Jul-Aug 2014) ............................................................................................................................... 51 Table 8. Farmers and traders’ perception of the constraints for vegetable production in Syangja and Kaski
districts ................................................................................................................................................................... 54 Table 9. Characteristics affecting equity and sustainability in the two case studies ............................................. 57
iii
Glossary
CPWF Challenge Program on Water and Food
DDC District Development Committee
DWAF Department of Water Affairs and Forestry
FMIS Farmer-manager irrigation system
HH Household
iDE International Development Enterprise
IFAD International Fund for Agricultural Development
IWMI International Water Management Institute
MASF Market Access for Smallholder Farmers
MAWTW Market Access and Water Technologies for Women
MPCs Market Planning Committees
MUS Multiple-use Water Systems
NRI Natural Resources Institute
SAPPROS Support Activities for Poor Producers of Nepal
SIMI Smallholder Irrigation Market Initiative
USAID Unites States Agency for International Development
VDC Village Development Committee
WHO World Health Organization

1
I. Introduction
1. Context
Using available water resources to meet domestic and irrigation needs throughout the year has been an
issue in Nepal. In hilly and mountainous areas, rivers, rivulets and springs are the main source of
water, and are managed through medium and small-scale irrigation systems and water supply schemes,
whereas in the plains surface and groundwater are managed through large and medium irrigation
systems as well as shallow and deep tube wells. Traditionally, water systems built by the government
have been designed and managed for a single use, for example either for drinking purpose or irrigation
and each use has fallen under the mandate of a different government agency. However, de facto, such
systems have often been used for multiple needs, which were not considered in the planning and
implementation of the system. For instance, in their study of Chhattis Mauja Irrigation Scheme,
Zwarteveen and Neupane (1996) report that many women used water from irrigation channels to wash
their clothes, clean the pots and for feeding and watering livestock because of the inadequacy of the
domestic water supply systems. However since these uses were not recognized by the (male
dominated) water user committee, women faced water scarcity problems to meet all their water needs.
The recognition of the shortcomings of single-use planning and design approaches has led to the
development of an alternative model for water service provision, known as Multiple Use water
Services (MUS1) (Van Koppen et al., 2006). This involves planning, finance and management of
integrated water services for multiple domestic and productive uses and is a consumer-oriented
approach that takes people’s multiple water needs as a starting point (Renwick et al., 2007).
MUS were developed with the view of providing people with drinking water and other domestic uses
as well as productive uses. It aims to uplift the living standard of poor people by the introduction of
appropriate and cost-effective technologies, which are particularly well suited for marginal and small
landholders. It focuses on irrigated production of high value crops (especially vegetables) as a way of
increasing smallholders' income (Eco-Tech Consult, 2004). A majority of Nepalese farmers are
dependent upon subsistence farming. This coupled with declining farm size per capita have resulted in
increased difficulties for farmers to solely rely on farming for their living, in turn contributing to male-
out migration outside the country. MUS, coupled with proper marketing of vegetable products, offers
an opportunity for smallholder farmers to develop an additional source of income, by intensively
cultivating high value crops on a small plot of land. MUS in Nepal especially targets women, as
women are those usually in charge of small-scale vegetable production.
It has been almost 10 years since the first MUS were established in Nepal with the initiation of the
Smallholder Irrigation Market Initiative (SIMI), a USAID-funded program led by international
development enterprises (iDE) in western Nepal. iDE then further refined MUS and out-scaled its
implementation with over 200 systems implemented in Nepal. Whereas a few studies have documented
the short term impact of MUS on income generation and livelihoods, so far no comprehensive effort
has looked at the sustainability of these systems and how the latter is affected by intra-household
characteristics, intra-community factors and broader contextual determinants. These were the
objectives of this study, which reviewed 16 schemes across three districts in the western region of
Nepal. A majority of these schemes were implemented under SIMI more than eight years ago.
The results of this study aims at informing the on-going Market Access and Water Technologies for
Women (MAWTW), a USAID funded project, led by iDE in partnership with the International Water
1 MUS has also been used as an acronym for multiple-water user systems. In this report we refer to ‘systems’
rather than services as it has been the term used by iDE in the MAWTW project documents

2
Management Institute (IWMI), NTAG, Samjhauta and Support Activities for Poor Producers of Nepal
(SAPPROS) in three districts of Far-Western Nepal (2013-2016). It also aims at guiding the design of
future iDE projects and, more generally, water, food security and gender programs in Nepal and
elsewhere.
2. Resilience, robustness and sustainability of social-ecological systems
Current studies on social-ecological systems, also called human-environment systems, have expanded
resilience and vulnerability studies of ecological systems to integrate social components. Resilience
has therefore always been a prominent topic of interest in the social-ecological system literature.
Another key concept is that of sustainability, which has been borrowed from the analysis of social
systems and applied beyond academic circles in the corporate world (Anderies et al., 2013). Resilience
describes “the ability of a system to experience shocks while retaining function, structure and feedback
capabilities”(Redman, 2014). Sustainability can be represented as a pathway in which “human well-
being is enhanced, social equity advanced and environmental integrity is protected” (Leach et al.,
2010). Lastly, Anderies et al. (2004) prefer to use ‘robustness’, a concept borrowed from engineering,
rather than resilience in the case of social-ecological systems that have been designed purposefully.
They argue that resilience is difficult to apply to such systems because one cannot easily measure the
costs/benefits of designing a system to enhance its adaptive capacity. Robustness refers to the
“maintenance of a system performance either when subjected to external, unpredictable perturbations
or when there is uncertainty about the values of internal parameters”(ibid) and is well-suited to
designed systems as it better allows considering trade-offs between performance and robustness
(Cifdaloz et al., 2010). However Anderies et al. also recognize that robustness is not easy to translate
to social-ecological systems as these are not as controllable and predictable as engineering systems
(ibid). In this study we will use resilience as it is more commonly used in the literature – while
acknowledging its limitations to adequately measure it when applied to designed systems.
One shall note that, although there are commonalities in the search for resilience and sustainability, a
resilient/robust system (e.g. a political dictatorship) is not necessarily sustainable and vice versa. In
addition, there are two major conceptual differences between sustainability and resilience assessments.
Sustainability analyses have a common interest with a resilience approach in understanding how
biophysical and social drivers might affect a system’s future, but better consider human decisions and
institutional dynamics (Redman, 2014). Another major distinction between resilience/robustness and
sustainability studies is that the former do not anticipate what outcomes might result from shocks and
stresses on the system. Sustainability studies on the other hand identify and evaluate the future
pathways the system might take according to certain normative values and designs strategies to achieve
these pathways (ibid). In that sense, sustainability should be considered as a goal and a framework to
guide decisions and actions rather than a set of management principles (Anderies et al., 2013).
The increased popularity and adoption of the concept of sustainability as a guiding framework for
development can be attributed to rising inequities between different social groups together with the
rapid degradation of natural resources and ecological systems. The core strength of sustainability
analysis is to propose to address these issues by linking social and biophysical factors and engage all
relevant stakeholders in sustainability assessments, as ultimately perceptions of sustainability are
contingent upon their values (Gibson, 2006).
In Nepal, farmer-managed irrigation systems and traditional water supply systems using springs,
streams and spouts have often been quoted as examples of both resilient and sustainable social-
ecological systems. They have been termed as resilient in the sense that they have been operated and
maintained for decades and even centuries despite very harsh environmental conditions and an
enduring civil war. They have been deemed as sustainable in the sense that they have over time
significantly contributed to livelihoods, supported social cohesion among water users (Lam, 1998)

3
without damaging or threatening the environment. The main causal factors for both their resilience and
sustainability have been identified as the fact that water users and infrastructure providers are the same
individuals who interact with the resource, infrastructure and among themselves on a daily basis
(Anderies et al., 2004). This allows for the development and adaptation of sustainable institutions,
including verbal agreements or written rules on water access, allocation and how to operate and
maintain the system (Lam, 1998). Other important factors are the capacity of these systems to be
maintained and repaired by farmers themselves with available skills and resources, the existence of a
strong leadership among water users and the regular maintenance required which in turn supports
social cohesion and collective action (Ostrom et al., 2011). Scholars interested in the determinants of
collective action to sustain irrigation systems have also identified group size, the characteristics of the
resource and the broader economic context in which such systems are located (Meinzen-Dick et al.,
2002).
On the other hand, external interventions in the irrigation and domestic water sectors in Nepal have
displayed both low resilience and sustainability (Ostrom et al., 2011, Rautanen et al., 2014). For
instance a study conducted by the Department of Water Supply and Sewerage in 2007-2008 across
more than 3800 VDCs found that whereas 80% of the population surveyed was covered by a water
supply system, around 18% of the population reported that these systems were functioning well, 39%
that these systems needed a minor repair and 43% that the systems needed either major repair to be
rehabilitated/reconstructed or could not be made refunctional (NMIP and DWSS, 2011). A joint review
mission conducted by the International Fund for Agricultural Development (IFAD) in 2011 to assess
the Western Uplands Poverty Alleviation Program – Phase II reported that around 1/5th of the water
supply and irrigation systems needed repair work (IFAD, 2011).
In the case of irrigation systems, scholars have highlighted that many interventions have failed because
they have been led by technico-managerial approaches with engineering as the dominant paradigm and
little consideration of the complexity of the interaction between technical, biophysical and social
components of the system (Ostrom et al., 2011, Vincent, 1994). Often these interventions have not
adequately considered neither the biophysical factors (e.g. hydrological dynamics, soil characteristics,
climatic extremes) nor the social factors (e.g. off-farm opportunities, intra-community power relations,
local governance system) affecting the system (Turner, 1994). Lastly, the lack of attention to notions of
social and environmental justice have also undermined the sustainability of many externally-supported
agricultural and water development interventions in Nepal and elsewhere (Venot and Clement, 2013,
Clement et al., 2015).
Many MUS in Nepal include traditional water supply systems that have been MUS de facto, e.g.
farmer-managed irrigation systems (FMIS) that have been used for livestock water needs and washing
clothes and utensils, or drinking water supply systems used for irrigating vegetable plots on homestead
land. However the MUS models advocated by the MUS group and its member organizations are
external interventions, to be implemented either by development organizations or government
agencies. It is therefore pertinent to ask the following: what are the conditions for these MUS to be
resilient and sustainable? Are these more resilient and sustainable than other types of systems? A
comparative analysis of MUS and other systems was beyond the scope of this study, but while
exploring the first research question, the analysis offers as well as few hints to the second question.
In Nepal, iDE has innovatively coupled MUS with the creation of commercial pockets to provide
marketing opportunities for vegetable products. The commercial pocket approach, implemented
through SIMI and other programs, consists of creating farmers groups, regrouped under a Marketing
and Planning Committee (MPC), which provides various services and support to farmers, including the
facilities of a collection center. The collection centers, managed by the MPC, were created to collect
the vegetable production of any quantity from all farmers in the area and to resell it to local traders.

4
The MPC, formed of voluntary elected/nominated local farmers, initially received trainings on how to
operate a collection center. In addition to managing the collection center, the MPC’s role was to offer
technical guidance and services to farmers’ groups.
This market-driven approach of MPC was envisioned to support farmers to increase their productivity
and engage in commercial production by facilitating the marketing process. The intervention was
therefore to enhance the resilience of MUS by making MUS the key tenet of a major source of income
for households – not only households would have more incentives to maintain the system but the
system would also help to generate the financial resources needed for its maintenance. Supporting
vegetable production was also to contribute to the sustainability of MUS by enhancing the impact of
MUS on health and nutrition, and therefore on well-being. For a comprehensive analysis of the
resilience and sustainability of MUS, we therefore also considered how MPCs were affecting vegetable
production and livelihoods in MUS study areas.
3. Objectives and research questions
This study on resilience and sustainability of MUS aims at advancing knowledge on the determinants
of the long-term sustainability of these schemes, from the perspective of human well-being, social
equity, and environmental integrity. Key research questions were: what are the key threats to the mid
and long-term performance of MUS? What are the factors affecting their resilience and sustainability?
What is the role of the local socio-economic context in MUS sustainability and replicability?
Because of the highly gendered division of roles and responsibilities related to water use in South Asia,
gender relationships is at the core of these issues. Earlier studies on MUS have reported high benefits
to women, notably reduced time and drudgery to fetch water (Eco-Tech Consult, 2004), additional
income source from homestead vegetable production (Mikhail and Yoder, 2008) and improved intra-
household gender relationships, where women have a greater say in decision-making related to crop
selection, sales of crop and control over income (de Boer, 2007). Although it considered gender issues,
this study however did not specifically focus on gender as women’s empowerment will be explored
through a separate study in 2015 for the on-going MAWTW project.
4. Limitations of the study
Because of the choice to study old systems, this research did not allow to consider factors related to
project implementation, e.g. level of involvement of users during planning and implementation of the
scheme, social and political dynamics related to such a process, or the type of training given to
different users and service providers. Although iDE staff and water users did remember the overall
process, the level of detail available was not sufficient to explore these factors in depth.
Secondly, there was an obvious compromise to make between quantity and quality of the data
collected. We first surveyed 16 MUS, which is one of the largest samples for a MUS study in Nepal.
This rapid appraisal relied on an experienced team2: one IWMI researcher and a consultant visited
seven MUS together across three districts and the consultant then visited the nine other MUS himself,
supported by a field assistant. We did not rely on enumerators to ensure the quality of the data as we
chose to collect qualitative rather than quantitative data. The process of interviewing therefore relied
on a process of engaging with the community and a process of observation which was very important
to analyze the data collected and to choose the two sites for the in-depth study. In social sciences, in
situ observations are a major component of the data used for the analysis. Given this, it was difficult
for such a small team to survey more sites. Beyond the data collection, the process for data compilation
2 The IWMI researcher holds a PhD (UK) in geography and political science and an engineering degree. The
consultant holds an MSc (UK) in Sustainable Environmental Management.

5
and analysis was very time consuming– again the analysis was done in house to ensure a sufficient
level of quality.
Even though attention was given to qualitative data during the first phase, the second phase of
fieldwork revealed some limitations of the rapid appraisal. For example, many issues regarding water
allocation in Bhandarekhola had not surfaced during our rapid appraisal and the latter had failed to
capture the diversity of reasons for the add-on MUS system to collapse. Ideally, we therefore should
have revisited all sites with a similar in-depth study as the one we conducted during the second phase,
but this was not possible in the time and budget given. We however believe that the two case studies
chosen have provided sufficient in-depth understanding of the social and biophysical factors, processes
and mechanisms which affect resilience and sustainability under different contexts, to allow drawing
useful conclusions and recommendations.
II. History and rationale for MUS
1. MUS in the world
Rationale for MUS
Agriculture-based livelihoods of rural communities are heavily dependent on water (Moriarty et al.,
2009). Many of the poor population have their livelihoods based on activities where adequate water
supply is a crucial source or is as an important element in improved health. Thus, water supply in these
households has a huge potential to reduce poverty (Moriarty et al., 2004).
Communities have developed water systems for multiple uses since ancient times (Rautanen et al.,
2014). In contrast, most government and donor-led interventions have been divided according to sector
and use, e.g. either on irrigation, drinking water supply or sanitation. Some water professionals, being
aware of the gaps between their professional single-use backgrounds and the real practices and needs
of the communities, recently started to acknowledge de-facto MUS observed on the ground and the
advantages of planning for multiple uses from the design phase of the system.
MUS emerged as a concept which recognizes the multiple uses of water of communities and the need
to plan, design and manage water services in order to meet these multiple water-demands (Van Koppen
et al., 2006). Interventions can take the form of new infrastructure development or
rehabilitation/expanding the scope of an infrastructure already in use. MUS proponents claim to
address issues of financial viability and sustainability by generating sufficient income through
productive uses of water to operate and maintain the system. The multiple services provided by the
system allow users – and particularly women - to be involved in productive activities such as
horticulture, staple food production, poultry and livestock rearing and fish farming with potentially
significant livelihood benefits (van Koppen et al., 2009).
Previous research on MUS
A growing group of development practitioners, researchers and water professionals began to
collaborate on MUS as they realized that an inclusive approach in the design and planning of new or
rehabilitated structures would support better services and system performance. This led to a an action
research project funded by the Challenge Program on Water and Food (CPWF) ‘Models for
implementing multiple-use water supply systems for enhanced land and water productivity, rural
livelihoods and gender equity’ and led by IRC International Water and Sanitation Center, IWMI and
iDE across eight countries. National partners from the domestic and irrigation sub-sectors that included
both research and implementing institutions were involved. Around 30 study areas were selected to
pilot or document MUS through innovation and learning-by-doing method (van Koppen et al., 2009).
6
The objective was to identify generic MUS models and upscale MUS through learning alliances at the
national and international levels. The project identified two models: homestead-scale and community-
scale MUS. Whereas homestead-scale MUS focuses on household use of domestic and productive
water, community-scale MUS take a holistic approach considering all sources, water systems and
multiple uses of water within a community (van Koppen et al., 2009). The research evidenced the
added benefits of MUS to livelihoods and women empowerment compared to conventional single use
systems. They also identified post-construction support as a key component of local government’s role.
Since project partners and other organizations have created an international MUS group
(http://www.musgroup.net) regrouping 14 international organizations and 350 individual members.
The group has notably advocated the development of mechanisms to support local governments in
adopting and implementing MUS through participatory planning.
MUS and sustainability
A key tenet of MUS is that they are more sustainable than single use systems because they better
integrate the economic value of the overall services provided: the economic benefits from productive
uses of water can be re-invested to protect and maintain the system, including the sources, and to
sustain its other non-productive uses (Smits et al., 2008, Rautanen and G.C., 2012). Furthermore, users
have more incentive to make the system sustainable because of the important health and livelihood
benefits it provides. Challenges to the system sustainability were identified as 1) the need to negotiate
and meet competing demands at household, community and watershed level; 2) the importance of
flexible and context-specific management structures; 3) a favorable policy environment recognizing
multiple benefits of MUS across sectors; 4) physical water availability (Tucker et al., 2009).
2. SIMI project
SIMI was launched in Nepal in 2003 and completed in 2009. The project was led by iDE Nepal and
WINROCK International with support from USAID and in partnership with the Center for Economic
Policy, Research, Extension and Development (CEPREAD), SAPPROS, Nepal and the Agriculture
Enterprise Center (AEC).
SIMI aimed at providing increased incomes to small landholder farmers through production and
marketing of high value commodities, including vegetables, spices, Non-Timber Forests Products
(NTFPs), small livestock, fish, tea and coffee.
A core tenet of SIMI’s approach was the
provision of affordable and locally appropriate
MUS and micro-irrigation technologies, the
value chain approach and partnerships with a
variety of stakeholders. MUS implemented in
SIMI are piped systems aimed at providing
water for domestic needs and for irrigation for
vegetable production on small plots of bari
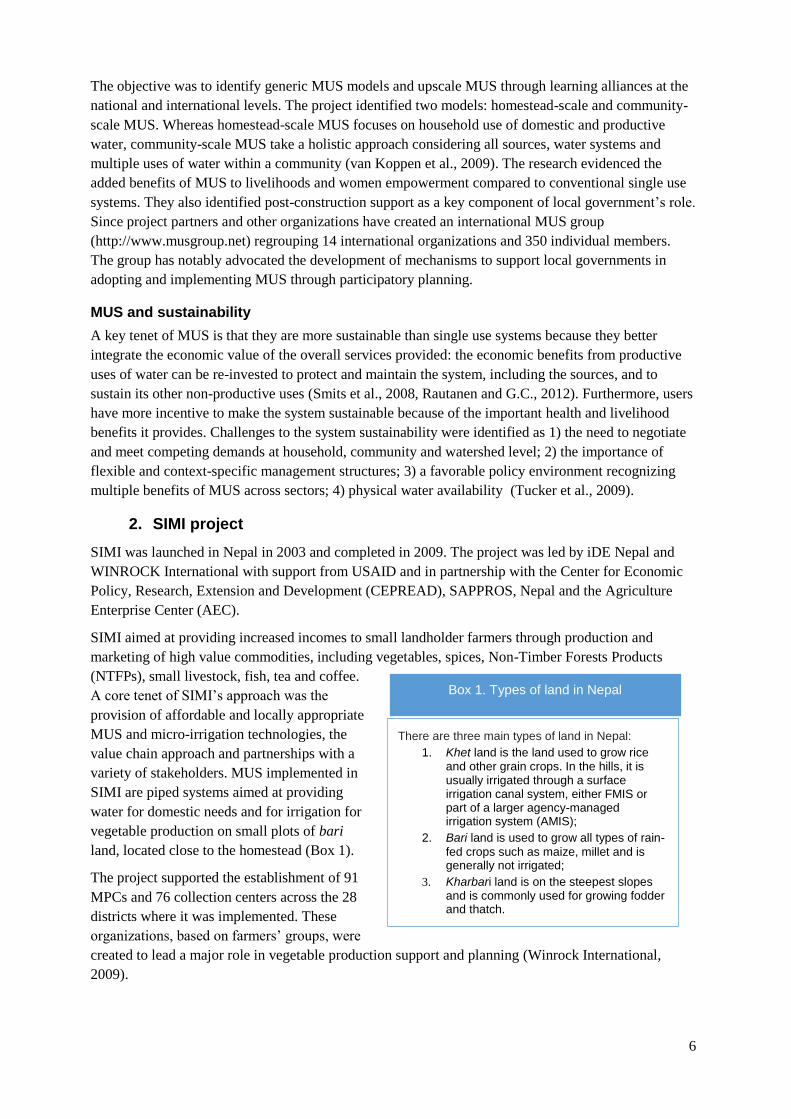
land, located close to the homestead (Box 1).
The project supported the establishment of 91
MPCs and 76 collection centers across the 28
districts where it was implemented. These
organizations, based on farmers’ groups, were
created to lead a major role in vegetable production support and planning (Winrock International,
2009).
Box 1. Types of land in Nepal
There are three main types of land in Nepal:
1. Khet land is the land used to grow rice and other grain crops. In the hills, it is usually irrigated through a surface irrigation canal system, either FMIS or part of a larger agency-managed irrigation system (AMIS);
2. Bari land is used to grow all types of rain-
fed crops such as maize, millet and is generally not irrigated;
3. Kharbari land is on the steepest slopes and is commonly used for growing fodder and thatch.
7
III. Analytical framework for the study and methodology
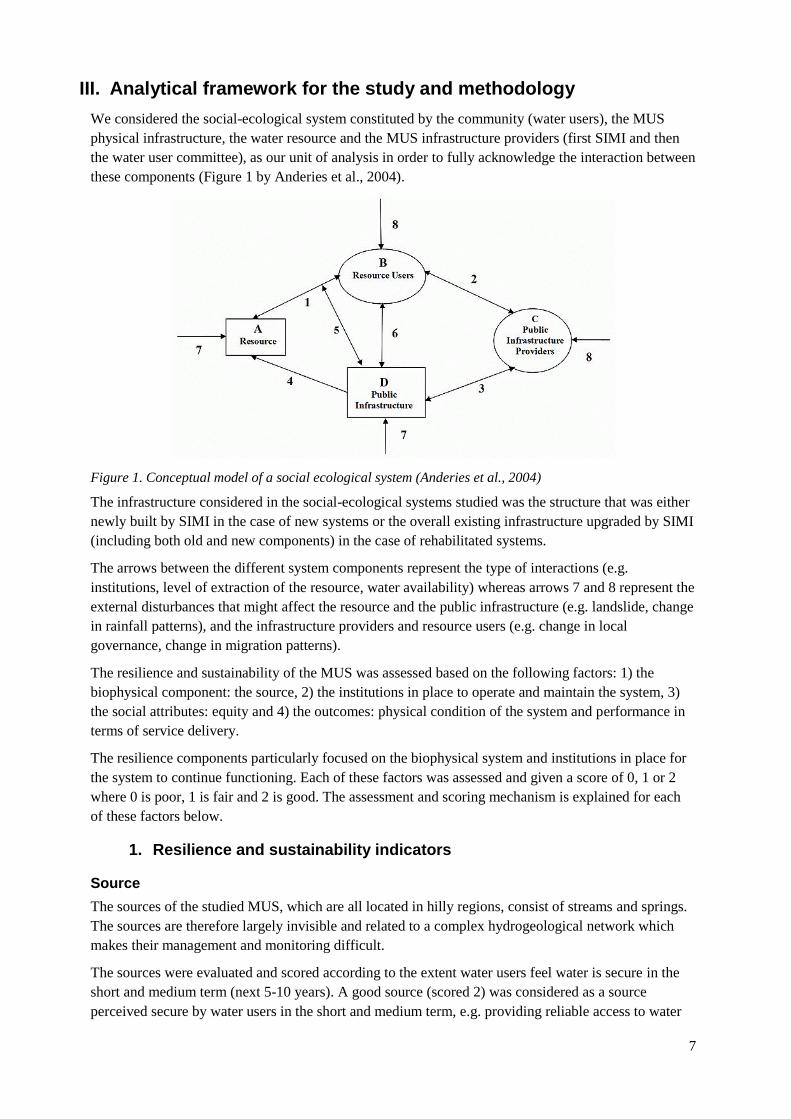
We considered the social-ecological system constituted by the community (water users), the MUS
physical infrastructure, the water resource and the MUS infrastructure providers (first SIMI and then
the water user committee), as our unit of analysis in order to fully acknowledge the interaction between
these components (Figure 1 by Anderies et al., 2004).
Figure 1. Conceptual model of a social ecological system (Anderies et al., 2004)
The infrastructure considered in the social-ecological systems studied was the structure that was either
newly built by SIMI in the case of new systems or the overall existing infrastructure upgraded by SIMI
(including both old and new components) in the case of rehabilitated systems.
The arrows between the different system components represent the type of interactions (e.g.
institutions, level of extraction of the resource, water availability) whereas arrows 7 and 8 represent the
external disturbances that might affect the resource and the public infrastructure (e.g. landslide, change
in rainfall patterns), and the infrastructure providers and resource users (e.g. change in local
governance, change in migration patterns).
The resilience and sustainability of the MUS was assessed based on the following factors: 1) the
biophysical component: the source, 2) the institutions in place to operate and maintain the system, 3)
the social attributes: equity and 4) the outcomes: physical condition of the system and performance in
terms of service delivery.
The resilience components particularly focused on the biophysical system and institutions in place for
the system to continue functioning. Each of these factors was assessed and given a score of 0, 1 or 2
where 0 is poor, 1 is fair and 2 is good. The assessment and scoring mechanism is explained for each
of these factors below.
1. Resilience and sustainability indicators
Source
The sources of the studied MUS, which are all located in hilly regions, consist of streams and springs.
The sources are therefore largely invisible and related to a complex hydrogeological network which
makes their management and monitoring difficult.
The sources were evaluated and scored according to the extent water users feel water is secure in the
short and medium term (next 5-10 years). A good source (scored 2) was considered as a source
perceived secure by water users in the short and medium term, e.g. providing reliable access to water

8
of acceptable quality and sufficient quantity to meet short and medium term water needs throughout
the year; a fair source (scored 1) was defined as a source perceived secure only during some period of
the year or perceived to be secure only for short-term future water needs. A poor source (scored 0) was
considered as a source perceived to be insecure throughout the year.
Although the score given to the source aims at capturing the biophysical component of the MUS, one
should note that it can also be affected by social factors, such as water rights, institutional
arrangements to share and protect the source, trust and social cohesion, etc.
Equity
Equity in distribution and allocation of water and benefits from access to water has been identified in
the literature as a key tenet of sustainability. A common equity issue found in water systems is rooted
in the asymmetrical situation between downstream and upstream users. Equity in water allocation does
not necessarily mean that all users should receive the same amount but rather that the amount of water
received is considered fair by everyone. In our study, the scoring system was the following: a MUS
where no conflict or complaints over water allocation was reported during our interviews was
classified as good (score 2). A MUS where no open conflict was reported but where some users
reported own or others’ complaints on water allocation was categorized as fair (score 1). A MUS
where open conflicts were reported was categorized as poor (score 0).
Institutions
By institutions, we mean rules, norms and strategies (Ostrom, 2005) which actors deliberately purse to
regulate collective behavior and actions. We thus distinguish as per the new institutional economics
perspective, the rules-in-use from the organizations that create, implement or enforce the rules (North,
1990). For this component of the study which was based on a rapid appraisal of the systems, we
focused on rules and norms.
The scoring system for the institutions is not normative, i.e. we did not assign a value of good, fair or
poor. We just distinguished between formal, informal and lack of institutions, with no value judgment
between formal and informal. A large body of literature on common pool resources indeed showed that
informal institutions can be as performant as or even more performant than formal ones (Yami et al.,
2009, Tang, 1992, Lam, 1998). A formal institution (with a score of 2) has been categorized as the one
with an active committee, regular meetings, fee collection and a set routine for maintenance (by water
users themselves or by a designated caretaker). An informal institution (with a score of 1) has been
categorized as the one that has a formal or informal committee which meets and performs activities
(fee collection and maintenance) as per need in an informal manner. A label of ‘no institutions’ was
given (with a score of 0) to the systems with no group of users acting formally or informally as a user
committee, no collection of fees and maintenance activities.
Physical condition of the system
The level of maintenance of the infrastructure of the MUS and its source reflects the level of collective
action and users’ involvement in sustaining the system. The conditions of the pipes, jars and tanks
were studied through visual observations, informal talks and interviews with water users and the
executive committee member. The physical condition of the system was categorized as follows: a
system with jars, tanks, chambers in good condition and well-functioning is given a score of 2; a
system with jars, tanks, chambers which are still functioning but require interventions on the medium
term is put under fair category with a score of 1 and the systems where these structures which are
either not functioning or still functioning but need immediate intervention are categorized as poor with
a score of 0.

9
Performance
A water service is sustainable when it provides the required quantity and quality of water (WHO and
IRC International Water and Sanitation Centre, 2000). To assess the performance of MUS, we
considered the services delivered in terms of water quality, quantity for domestic use and quantity for
irrigation. The condition of the physical system, e.g. jars, taps, tank and pipes) was not considered
here. The scores were based on water users’ perceptions.
A MUS with perceived good water quality throughout the year was categorized as good (score: 2). A
MUS with water quality perceived to be degraded only during some periods of the year (e.g. muddy in
the rainy season) was categorized as fair (1). A MUS with poor water quality throughout the year was
categorized as poor (0).
In case of domestic water quantity, a MUS perceived to provide sufficient water quantity to cover the
domestic water needs of all users throughout the year was categorized as good (score 2). A MUS with
perceived insufficient quantity during some time of the year (e.g. dry season) or with perceived
insufficient flow for some users was categorized as fair (score 1). A MUS with perceived insufficient
quantity throughout the year was categorized as poor (score 0)
Finally, the MUS that provided sufficient water quantity to meet water needs of all users for irrigation
of bari land throughout the year was categorized as good (2), those with insufficient water to meet
water needs for irrigation of bari land during some period of the year or for some users were
categorized as fair (1) and those that don’t provide sufficient water for irrigation throughout the year
were categorized as poor (0).
We assigned a weight to each of these three variables as follows: 0.5 for drinking water, 0.25 for
quality of water and 0.25 for irrigation water, to account for the quantity of drinking water to be the
most important criteria for water users and also considering that there were no major water quality
issues in the MUS surveyed. We calculate the overall performance score for each MUS accordingly.
The MUS were then divided into three groups: good, fair and poor according to the score obtained with
the following thresholds: good ≥1.5; 0.75<fair<1.5 and poor ≤0.75.
Resilience and sustainability
We assessed the resilience and sustainability of the systems using the following approach.
First, from the water users’ perspective: the three respondents in each system were asked directly about
their perception of resilience of their system. If the respondents gave a ‘no’ answer and ‘no if’ answer,
the system was categorized as ‘low resilience’. Similarly, if the respondents gave a ‘yes’ answer and
‘yes if’ answer, the system was categorized as ‘medium to high resilience’. Noticeably, there was no
discrepancy among the respondents’ answers within each system – all three respondents from one
system gave similar answers.
Second, a sustainability assessment was done using the score given to each indicator previously
described. The systems with at least one indicator equal to zero (poor) were categorized as low
potential for sustainability. Other systems were categorized as medium to high potential for
sustainability.
2. Methodology
As vegetable production and livelihood improvement critically depend on market linkage, the study
examined both MUS and MPCs established by iDE. The study on the commercial pocket approach
implemented by iDE was useful to explore the opportunities and constraints for MUS and vegetable
production to result in increased income for water users.

10
The study consisted of two distinct phases of data collection and analysis. First, the research team carried
out a study of 16 MUS and 7 MPCs across three districts, Kaski, Palpa and Syangja for a small-N
comparative study. The objective was to conduct a rapid appraisal on the performance and institutional
arrangements of both MUS and MPCs focusing on questions starting with: when, where, what and who.
The second phase was based on two case studies for MUS and two case studies for MPC in two districts,
Kaski and Syangja. The objective was to investigate the causal pathways and processes that had led to
today’s situation and to better locate the MUS and MPC into a broader social and environmental context.
The second phase therefore focused on questions starting with: why and how.
Selection
First phase
The main criterion for selecting the MUS for the first phase of analysis was their age in order to study
the system’s sustainability. Second, we chose the systems from one single project to be able to better
compare the factors external to the project that had affected their performance and sustainability. The
choice of the project was informed by discussions with IDE staff who indicated that the SIMI was the
first large-scale MUS project introducing a relatively robust MUS model (though the latter was refined
during the course of the project and in subsequent iDE projects). SIMI was also an interesting case study
because its implementation was informed by the CGIAR Challenge Program-MUS (CP-MUS)3, which
conducted action research in a few schemes implemented by SIMI. The CP-MUS later developed
guidelines for MUS based on the research conducted in five river basins. A few other research studies
were conducted on SIMI, including from Eco-Tech Consult (2004), Pant et al. (2005), Mikhail and Yoder
(2008) and the Government of Nepal (2012) (Table 1).
Table 1: List of previous studies on MUS implemented under SIMI in Nepal
Publication
year
Authors Objective of the
study
Area of
study
Number of
MUS visited
Methods used
2004 Eco-Tech
Consult
Document and
analyze the design
and implementation
process of MUS
Palpa and
Syangja
9 Interview of SIMI
staff, household
group discussion,
structured
questionnaire survey
2005 Pant, Gautam
and Shakya
Assess the potential
for upscaling MUS
in Nepal hills by
assessing the
impacts of these
Palpa,
Surkhet,
Syangja
9 Household
interviews and focus
group discussion
2008 Mikhail and
Yoder
Analysis of the
process of MUS
implementation and
concept
dissemination
Palpa,
Surkhet,
Syangja
3 Household
individual and group
interview, interview
with SIMI staff
2012 Government of
Nepal
Assess the benefits,
challenges and
institutional
situation of MUS
Kaski,
Kavre,
Lalitpur,
Palpa,
Syangja
7 Observation and
group discussion
3 The Global Lead partners on the CP-MUS project were the International Water Management Institute (IWMI);
IRC International Water and Sanitation Centre; International Development Enterprises (IDE); and Khon Kaen
University (KKU).

11
There were compromises made on the two criteria mentioned above in order to balance the number of
MUS considered for the study across small, medium and large size (i.e. number of beneficiaries). This
is because water user group size has been considered in the common-pool resource literature as a
potentially important factor affecting collective action and sustainability. Finally, 14 out of the 16 MUS
selected are more than eight years old and implemented under SIMI (Table 1). The two other systems
were chosen for their relatively large size (more than 70 household water users).
Second phase
For the second phase of the study, we selected one MUS who had a medium to high potential for
sustainability and one MUS who had a low potential for sustainability. We chose two systems who had
a collection center or cooperative nearby to couple the study of the MUS with that of MPCs and the
economic context for vegetable commercialization.

12
Table 2: List of MUS studied for the first phase and their characteristics
* Municipality
MUS Programme Year of
construction
(Nepali
/Western)
District Village Development
Committee (VDC) /
Settlement
Ward MPC located
in the same
VDC
Number of
households
using MUS
Ethnicity/caste of water users
Lakuribot SIMI-II 2062/ 2005 Kaski Dhikurepokhari/Lakuribot 3 Yes 16 Brahmin
Lumle-II MASF-add on 2068/ 2009 Kaski Lumle/Lumle 4,6 Yes 85 Brahmin, Gurung, Dalit
Lumle-I SIMI-V 2059/ 2002 Kaski Lumle/Lumle 6 Yes 22 Brahmin/Chettri, Gurung
Odare SIMI-III 2063/ 2006 Kaski Patnari/ Lekhnath* 1 Yes 113 Dalit, Janajati, Brahmin/Chettri
Bhandarakhola SIMI-II 2061/ 2004 Syangja Fedikhola/Merudanda 2 Yes 33 Brahmin/Chettri, Janajati
Majhkot MASF-add on 2070/ 2011 Syangja Jagatbhanjyang/Majhkot 8 Yes 91 Janajati, Dalit
Senthumka SIMI-II 2062/ 2005 Syangja Pelakot/Senthumka 9 Yes but
Inactive
35 Brahmin (Bhandari), Dalit
Senapuk SIMI-I 2063/ 2006 Syangja Pelakot/Senapuk 9 Yes but
Inactive
35 Brahmin
Katauje SIMI-III 2063/ 2006 Syangja Pelakot/Katauje 5 No 23 Brahmin, Janajati
Mulibas SIMI-IV 2064/ 2007 Syangja Pelakot/Mulibas 9 No 45 Brahmin (Pandey), Janajati (Thapamagar)
Dadakharka-I SIMI-V 2064/2007 Palpa Sirsekot/Dadakharka 1,2 No 85 Brahmin, Janajati (Magar), Dalit
Dadakharka-II SIMI-V 2064/ 2007 Palpa Sirsekot/Dadakharka 2 No 73 Janajati, Dalit
Dharagaire SIMI-III 2061/ 2004 Palpa Bhairabsthan/Ranithati 1 Yes 22 Brahmin/Chettri, Janajati
Takuragaire SIMI-III 2062/ 2005 Palpa Bhairabsthan/Ranithati 1 Yes 22 Brahmin/Chettri, Janajati
Chiskhola SIMI-I 2062/ 2005 Palpa Tahu/Chiskhola 6 Yes 14 Janajati (magar)
Somdip SIMI-IV 2063/ 2006 Palpa Devinagar/Somdip 8 Yes 15 Janajati
13
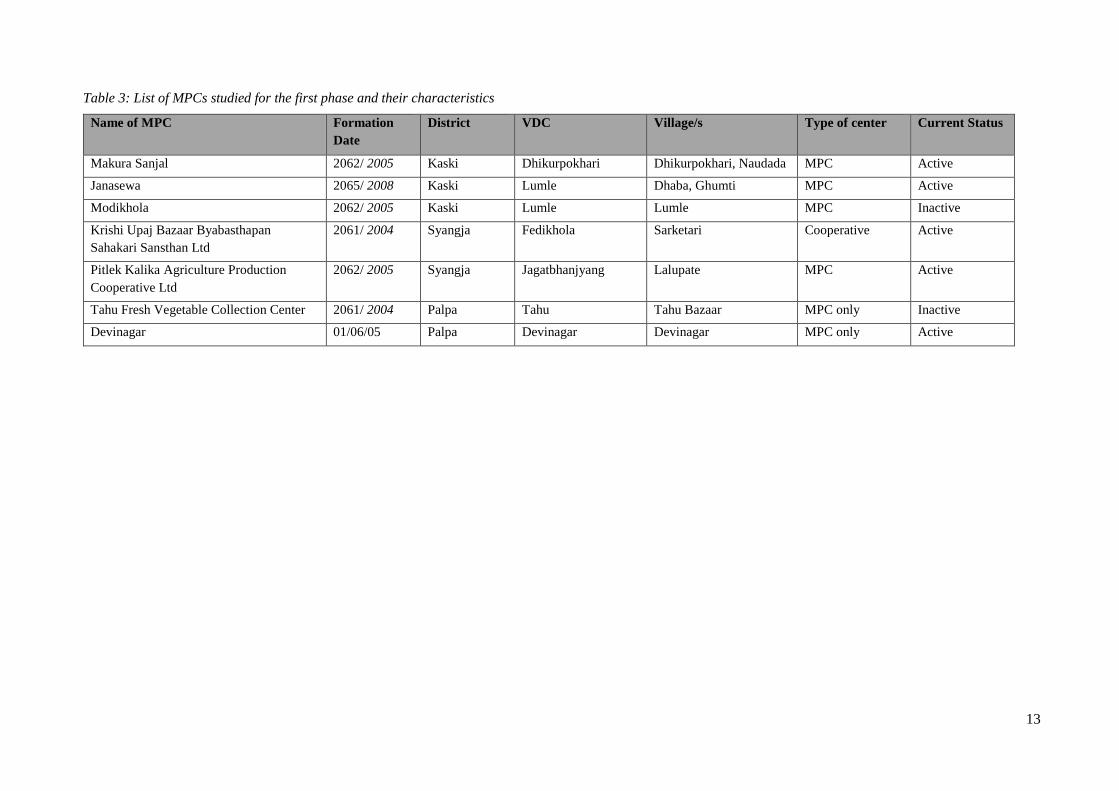
Table 3: List of MPCs studied for the first phase and their characteristics
Name of MPC Formation
Date
District VDC Village/s Type of center Current Status
Makura Sanjal 2062/ 2005 Kaski Dhikurpokhari Dhikurpokhari, Naudada MPC Active
Janasewa 2065/ 2008 Kaski Lumle Dhaba, Ghumti MPC Active
Modikhola 2062/ 2005 Kaski Lumle Lumle MPC Inactive
Krishi Upaj Bazaar Byabasthapan
Sahakari Sansthan Ltd
2061/ 2004 Syangja Fedikhola Sarketari Cooperative Active
Pitlek Kalika Agriculture Production
Cooperative Ltd
2062/ 2005 Syangja Jagatbhanjyang Lalupate MPC Active
Tahu Fresh Vegetable Collection Center 2061/ 2004 Palpa Tahu Tahu Bazaar MPC only Inactive
Devinagar 01/06/05 Palpa Devinagar Devinagar MPC only Active

14
Methods for data collection
The two studies on MUS and MPCs were conducted in parallel in each village development committee
(VDC). Both were divided into two phases with a first phase being a rapid appraisal of 16 MUS and 7
MPCs and collection centers across three districts and the second phase focusing on two case studies of
well-performing and less well performing MUS and MPCs across two districts. Table 4 provides an
overview of the methods used for the first and second phases of fieldwork.
Table 4. Methods used during the first and second phases
First phase Second phase
Methods Respondents Methods Respondents
MUS Structured interviews
Group discussion
Observations
2 water users (one
male and one
female or two
female
respondents)
Members of the
Executive
Committee
Semi-structured
interviews
Informal
interviews
Observations
All households in the
community
Lumle-I: 6 male and 16
female respondents
Bhandarekhola: 17 male,
10 female respondents
and 3 joint male and
female.
Key informants
MPC Structured interviews
Observations
1 member from
the MPC
executive
committee
1 member from
farmers’ group
1 non-member of
farmer group
Semi-structured
interviews
Observations
Secondary data
(records of
collection centers)
7 farmers selling at the
collection center (5 male
and 9 female)
7 farmers selling
vegetables but not to the
collection center (9 male
and 5 female)
2-3 traders (all male)
For MUS, the development of the interview structure during the first phase was informed by the literature
review on MUS, social-ecological systems and sustainability. The questions for the executive committee
member addressed general issues about the history of the area, land use and agricultural practices in the
community, institutions in place for the operation and maintenance of MUS, the composition of the
committee, its activities and community participation in decision-making. The questions for the water
users were set to collect individual views about the services and benefits of MUS, the institutions for its
operation and maintenance and perceptions of equity and sustainability (see Appendix I for executive
member questionnaire and Appendix II for water user questionnaire). Water user respondents were
chosen randomly when possible rather than designated by the members of the executive committee in
order to gather different views to a greater extent. During the second phase, all water users were
interviewed with either the male or female respondent of the household – or sometimes both (Table 4).
Household interviews focused on three themes, the research questions are detailed below for each theme:
1) Equity
How are water and MUS-related benefits distributed among beneficiaries?
How is 'equity' in distribution negotiated? ;
2) Context for vegetable commercialization:
What are the household determinants affecting the commercialization of vegetable production?

15
What are the external factors affecting the commercialization of vegetable production?
3) Sustainability and aspirations for the future
How do farmers see their future?
What are the opportunities and challenges as perceived by farmers to sustain their system?
For MPCs, the first phase consisted of a rapid appraisal aiming at evaluating the performance and
functioning of MPCs, collection centers and farmer groups that were initiated by iDE Data was
collected in all the VDCs where a MUS had been selected for study and where a MPC had been
created by iDE. Interviews focused on the composition and current performance of MPCs and
collection centers, the factors affecting their performance and the institutional arrangements related to
MPCs.
In the second phase, two MPCs- one with a good performance and one with a poor performance were
chosen4. These MPCs were chosen in the same district as the MUS to link the local economic context
in which MPCs work to the MUS. The respondents were: seven farmers who sell at the collection
center; seven farmers who grow vegetables but do not sell at the collection center and two to four
traders.
1) Farmers’ strategies
What are the determinants affecting farmers’ capacity and willingness to sell vegetables?
What is the profile of farmers selling vegetables at the collection center?
2) Context for vegetable commercialization
How has evolved vegetable production in the area for the past five years? Why?
What are the perceived constraints for vegetable production to increase in the area?
How does vegetable commercialization fit w the current socio-economic context?
What are the perceived external factors affecting the performance of the collection center in this
area?
IV. Potential for sustainability: a rapid appraisal
1. Setting the scene: local context
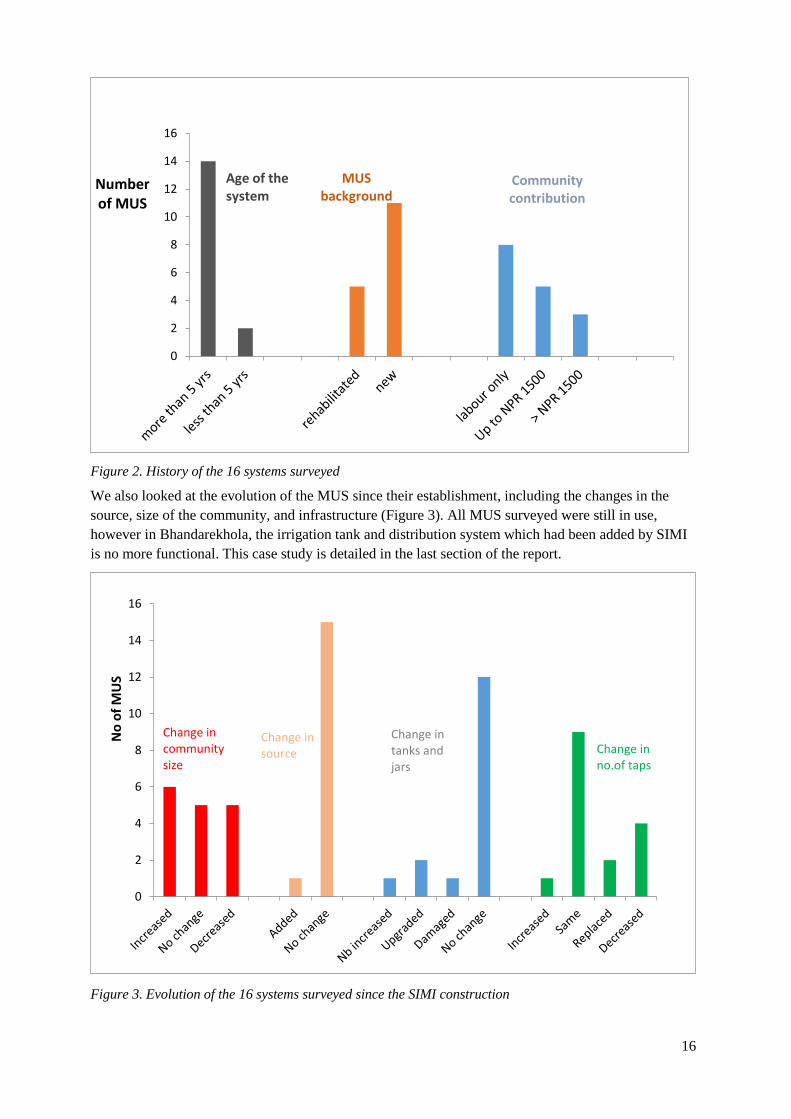
System history and evolution of the systems
Figure 2 gives an overview of the history of the system for the 16 MUS, including age of the systems,
whether it was a rehabilitated or new system and the level of community contribution.
Out of the 16 MUS surveyed, seven of the schemes were new systems built by SIMI while the
remaining 9 are rehabilitated ones. In the latter case, SIMI supported the community to upgrade
existing systems by redesigning them for multiple uses, which entailed adding new physical
infrastructure, e.g. a tank and a separate distribution system of pipes and taps. .
Most communities contributed with labor only while a few of them contributed with both labor and
cash.
4 The center selected for its poor performance had, at the time of the first phase of fieldwork in May 2014,
stopped functioning for one year because farmers preferred to sell their products directly to traders and local
shops. However when the research team came back there in August 2014, the center had restarted its activities.
16
Figure 2. History of the 16 systems surveyed
We also looked at the evolution of the MUS since their establishment, including the changes in the
source, size of the community, and infrastructure (Figure 3). All MUS surveyed were still in use,
however in Bhandarekhola, the irrigation tank and distribution system which had been added by SIMI
is no more functional. This case study is detailed in the last section of the report.
Figure 3. Evolution of the 16 systems surveyed since the SIMI construction
0
2
4
6
8
10
12
14
16
Number of MUS
Age of thesystem
MUS background
Communitycontribution
0
2
4
6
8
10
12
14
16
Change in source
Change incommunity size
Change in no.of taps
No
of
MU
S
Change intanks and jars

17
Only a few schemes reported changes in their system. Five schemes have seen a decrease in the
number of households since the SIMI construction/rehabilitation because some families have moved to
nearby cities.
Regarding the number and situation of tanks and jars, Chiskhola and Takuragaire have upgraded their
tank and Odare has added one tank. However, the upgraded tank in Takuragaire has been leaking since
and this still needs to be fixed.
In nine of the schemes, the survey could not capture whether the taps were replaced by individual
water users because the responsibility of replacing the taps lies with the tap users and we could not
survey all of them. In Odare and Chiskhola, it was reported that some of the main taps have been
replaced by the committee. In Bhandarekhola, although the household number has decreased, there
was an increase in the number of taps because of a household moving and adding a new tap.
Characteristics of the community
The characteristics of the community have been identified in the literature on common-pool
resource/social ecological system as important factors for the sustainability of the systems (Agrawal
and Goyal, 2001, Nagendra, 2007, Cox et al., 2010). In particular, we looked at the size of the user
group, the homogeneity of the community, extent of migration – which might affect the level of
reciprocity, and the reported impact of lack of manpower induced by migration in each community
(Figure 4).
Figure 4. Characteristics of the water users in the 16 systems surveyed
Half of the systems surveyed have a small number of water users (below 25 households). Three
quarters of them have less than two different ethnic groups in the village, so a large majority of the
communities are relatively homogenous. Because of the time constraints for the rapid appraisal
conducted during the first phase, it was difficult to evaluate the exact extent of migration with seven
communities having more than half of households with at least one member abroad. However in 11 out
of 16 systems surveyed, it was reported that migration and lack of manpower had had a negative
impact on farming and cropping. As a result, families have increasingly shifted from commercial to
subsistence vegetable production. Two communities also face difficulties in maintaining the
infrastructure of MUS because of a lack of manpower – the latter was reported to affect community
works in general. Reported social effects include the lack of young men to carry sick persons to the
hospital and to perform funerals where the dead bodies have to be carried to the river.
0
2
4
6
8
10
12
No. of
MUS
No. of
households
water users
Ethnic
heterogeneity
Proportion of
households with one
member abroad Impact of
the lack of
manpower

18
Marketing context
Out of 16 systems, five (Bhandarekhola, Katauje, Mulibas, Dadakharkha I & II) do not have a collection
center in the same VDC and two systems (Senthumka and Senapuk) had a collection center which is
now inactive (Figure 5). However, these MUS have access to a local market.
Figure 5. Marketing context for the 16 MUS surveyed
Nine of the MUS have access to a collection center but interestingly, only three of these reported to sell
their vegetables to the collection center only while six also sell their vegetables directly to local traders,
restaurants or on the local market.
2. Sustainability indicators
Source
There are five MUS where people feel the source is secure in providing sufficient and reliable quantity
of water in the short and medium term throughout the year. In four systems, the water users do not feel
secure about the source throughout the year and were categorized as poor and the remaining seven feel
secure only during specific periods of the year and were categorized as fair (Figure 6).
Figure 6. Condition of the source of the 16 MUS surveyed
Equity
In most systems, water users found the allocation of water equitable and fair (Figure 7). In general,
water users found it was fair that household with large families or livestock use more water than others
0
2
4
6
8
10
12Collection
centreEase of
access to
market
Marketing
No.
of
MUS
0
1
2
3
4
5
6
7
8
Good Fair Poor
No.
of
MUS

19
– even if everyone contributes equally to the system maintenance. However, in systems characterized
by water scarcity, some of the water users reported that other users were using too much water
although there were rarely open conflicts. Open conflicts were reported in two MUS (Lakuribot and
Dadakharkha-I). In Lakuribot, the downstream households diverted the pipes to their households,
leaving upstream households with very little water. One household downstream was accused of using
too much water for their poultry farm. In Dadakharkha-I, because of the structural design of the
system, the downstream households get water only when upstream users close their taps. During the
rapid appraisal of this system, it was observed that in many locations the pipes in the upstream area
had been cut by upstream households, therefore depriving downstream household from water.
Figure 7. Water users’ perception of equity in the 16 MUS surveyed
Institutions
Most sources are common property resources, except for five of the systems, where the sources are
private and are accessed and used as per agreement with the respective owners.
At the time of project implementation, SIMI initiated the formation of a construction committee, with
the objective to create a sustainable institutional basis for the operation and maintenance of the system.
The community was left free to design the rules they felt to be most relevant to allocate water among
users, operate and maintain the system. Figure 8 shows the status of the institutional arrangements that
are in place in the surveyed MUS.
Figure 8. Type of institutions in place in the 16 MUS surveyed
0
1
2
3
4
5
6
7
8
9
10
Good Fair Poor
No.
of
MUS
02468
101214
Fees
collected
System
of fines
Institutional
arrangements
for maintenance
Water user committee
meetingNo.
of
MUS
20
Most MUS still have a relatively active water user committee who collects fees for maintenance–
except in Lakuribot and Bhandarekhola. Half of them have a paid caretaker. Contrastingly, in a study
recently led by the DWSS in Nepal, it was found that across the 38,000 gravity flow water supply
schemes surveyed, 79% had no operation and maintenance fund and 75% had no paid caretaker (NMIP
and DWSS, 2011).
Apart from three systems (Majhkot, Odare and Lumle-I), all of them have kept the same committee as
the one formed for the construction. Whereas a majority of systems has formal institutions, a few MUS
have relatively more informal and flexible institutions, where meetings are held and fees collected only
as per needs. Only Majhkot, Dharagaire, Takuragaire and Mulibas have a provision for fines in case
the water users do not respect the rules in use (e.g. do not pay the fees on time).
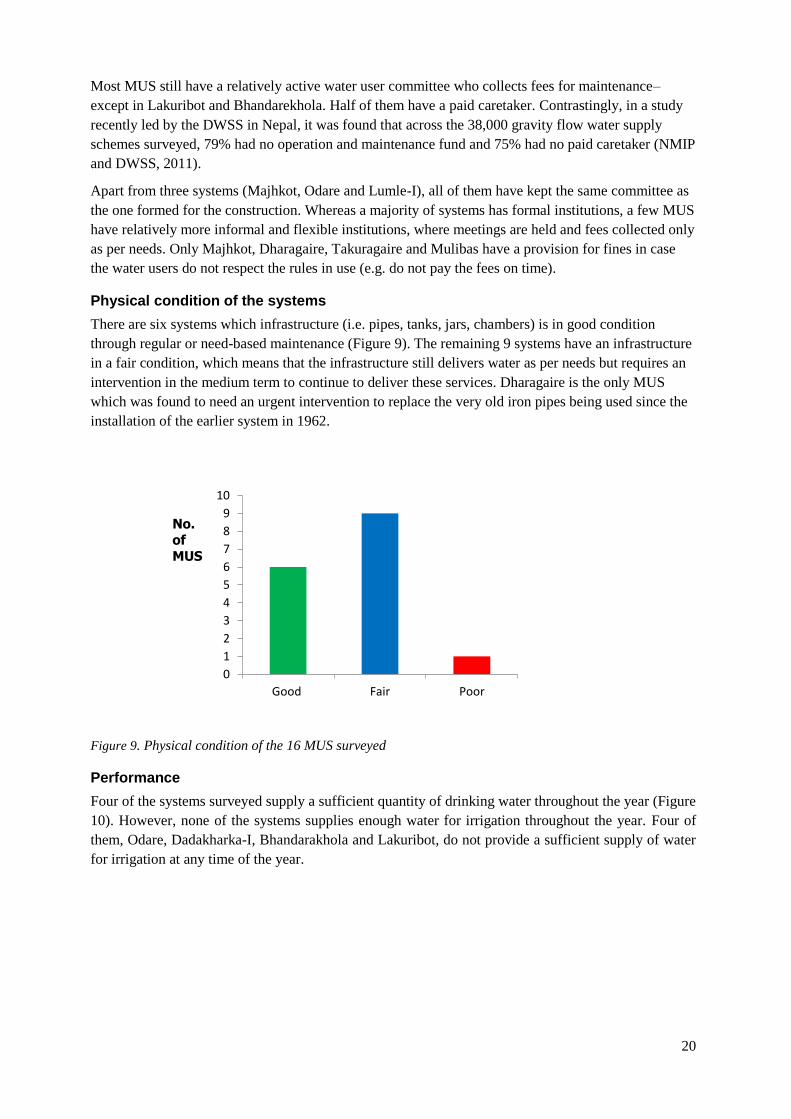
Physical condition of the systems
There are six systems which infrastructure (i.e. pipes, tanks, jars, chambers) is in good condition
through regular or need-based maintenance (Figure 9). The remaining 9 systems have an infrastructure
in a fair condition, which means that the infrastructure still delivers water as per needs but requires an
intervention in the medium term to continue to deliver these services. Dharagaire is the only MUS
which was found to need an urgent intervention to replace the very old iron pipes being used since the
installation of the earlier system in 1962.
Figure 9. Physical condition of the 16 MUS surveyed
Performance
Four of the systems surveyed supply a sufficient quantity of drinking water throughout the year (Figure
10). However, none of the systems supplies enough water for irrigation throughout the year. Four of
them, Odare, Dadakharka-I, Bhandarakhola and Lakuribot, do not provide a sufficient supply of water
for irrigation at any time of the year.
0
1
2
3
4
5
6
7
8
9
10
Good Fair Poor
No.
of
MUS
21
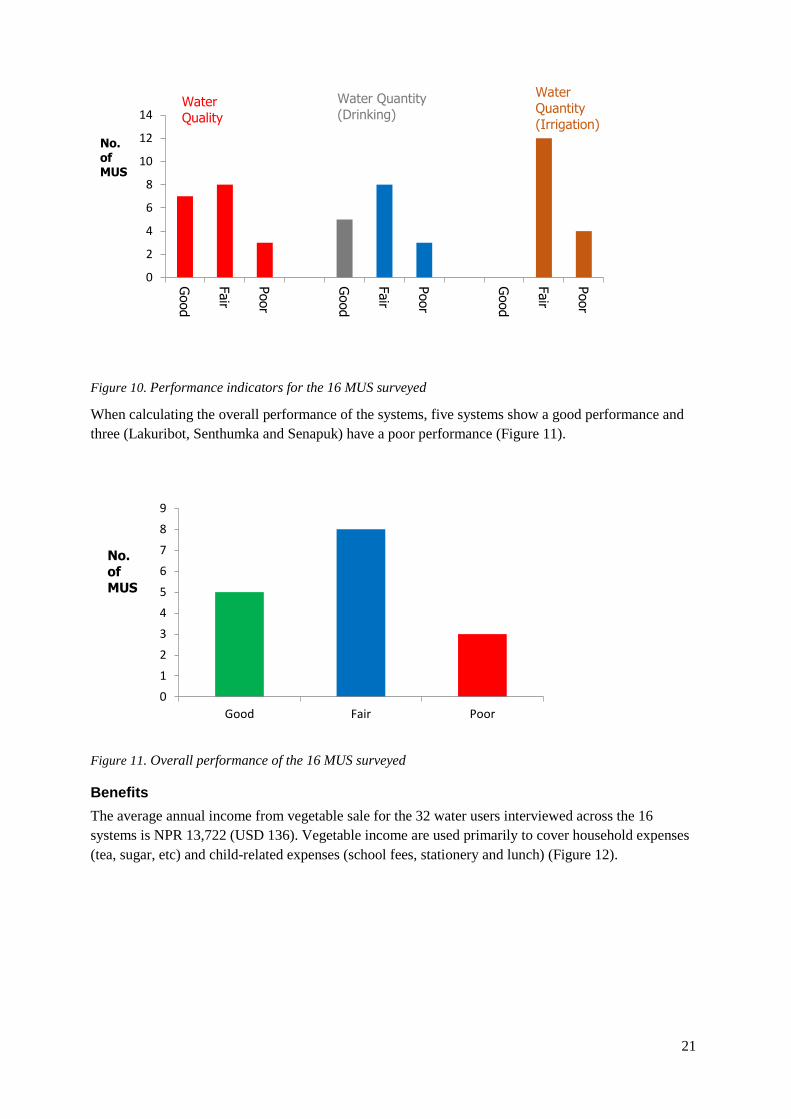
Figure 10. Performance indicators for the 16 MUS surveyed
When calculating the overall performance of the systems, five systems show a good performance and
three (Lakuribot, Senthumka and Senapuk) have a poor performance (Figure 11).
Figure 11. Overall performance of the 16 MUS surveyed
Benefits
The average annual income from vegetable sale for the 32 water users interviewed across the 16
systems is NPR 13,722 (USD 136). Vegetable income are used primarily to cover household expenses
(tea, sugar, etc) and child-related expenses (school fees, stationery and lunch) (Figure 12).
0
2
4
6
8
10
12
14
Good
Fair
Poor
Good
Fair
Poor
Good
Fair
Poor
No. ofMUS
Water
Quality
Water Quantity
(Drinking)
Water
Quantity
(Irrigation)
0
1
2
3
4
5
6
7
8
9
Good Fair Poor
No.
of
MUS

22
Figure 12. Type of expenses covered by income from vegetable selling across the 16 systems surveyed
Source: 32 water user respondents, fieldwork May 2014
Interestingly, no water user reported that vegetable income was used for the maintenance of the
system. The reason might be that the maintenance fees were not significant, with for 75% of the
systems where fees were regularly collected, a monthly fee per household below NPR 20 (USD 0.2).
The water users interviewed reported that the income from vegetable selling was used by men for 33%,
women for 58% and both for 8%.
Out of water 32 users surveyed across the 16 systems, 25% have never sold vegetables, 25% have
always sold vegetables since the SIMI intervention started, 6% started selling vegetables recently and
44% who were selling vegetables since the SIMI project, stopped selling.
Among those who have been selling vegetables since the SIMI intervention, most water users (62.5%)
reported an increase in production and income from sales, while others (37.5%) reported a decrease.
The 32 water users surveyed stated the lack of water was the main limiting factor for commercial
vegetable production (44%), followed by the lack of manpower (16%) and the inflow of remittance
(13%), which led some farmers to prefer cultivating vegetables for their own consumption rather than
for commercial purpose.
The 32 water user informants were also asked in an open question, what benefits they had received
from MUS. They mentioned, by higher to lower frequency of response: time saved, enhanced
knowledge on vegetable farming, income from vegetable sale, and improved health thanks to vegetable
consumption (Figure 13).
Household expenses
Child related expenses
Health expenses
Savings
Build a house
Farmers' group
0% 20% 40% 60% 80%Percentage of water users

23
Figure 13. Type of benefits from MUS reported by water users the 16 systems surveyed
Source: 32 water user respondents, fieldwork May 2014
iDE also conducted a cost-benefit analysis for 11 out of the 16 systems surveyed (tables 5 and 6), for
which sufficient information was available. Calculations were made with a discount rate / cost of
borrowing at 12%, inflation rate at 7.5% (January 2015 / World Bank Report) and a real interest rate of
4.2%. The analysis does not monetize the non-agriculture benefits.
The results show that the estimated payback period is approximately 8 months and a half and the
benefit cost ratio 11.
0% 10% 20% 30% 40% 50% 60% 70% 80% 90%
Time saved
Veg consumption
income from veg sale
Increased sanitation
Enhanced knowledge
More water for other activities
Bathing at home

24
Table 5. Cost-benefit analysis (average of over 11 systems)
INPUTS ITEMS Particular
(NPR)
Cost per
unit (NPR)
Item Cost
(NPR)
Annual
depreciation (NPR)
Useful
life (years)
Scrap
value (NRs)
Annual cost
(NPR)
Remarks
A) FIXED INPUTS 4,295,573 4,295,573 343,646 10 859,115 429,557
Total Fixed Cost 4,639,219
B) VARIABLE INPUTS
Annual Repair & Maintenance 473,160 0
Total Annual Operational / Variable Cost 429557
TOTAL INVESTMENT 5,068,776
NET INITIAL OUTLAY 4,725,130
C) OUTPUT ITEMS
Annual gross income from vegetable sale 7,328,300
Annual Operational Cost 429,557
Net annual income from vegetable sale 6,898,743
Source: data collected during IWMI fieldwork across 11 systems in May 2014, analysis conducted by Mr Bipin Pariyar
Table 6. Yearly cash flow projections (in NPR)
YEAR 0 1 2 3 4 5 6 7 8 9 10
Cash flows -4,725,130 6,898,743 6,898,743 6,898,743 6,898,743 6,898,743 6,898,743 6,898,743 6,898,743 6,898,743 6,898,743
Cumulative cash flows -4,725,130 6,898,743 13,797,485 20,696,228 41,392,456 34,493,714 41,392,456 48,291,199 55,189,942 62,088,684 68,987,427
Discount factor 1.000 0.960 0.921 0.884 0.849 0.815 0.782 0.750 0.720 0.691 0.664
Discounted cash flows -4725130 6621561 6355516 6100161 5855065 5619817 5394021 5177297 4969280 4769622 4577985
Cumulative discounted
cash flows
-4725130 6621561 12977077 19077238 24932303 30552120 35946140 41123437 46092717 50862338 55440323
Payback period (year) 0.7
Net present value 49,009,080
Internal rate of return 130%
Marginal cost ratio 472513030%
Benefit cost ratio 11
Source: data collected during IWMI fieldwork across 11 systems in May 2014, analysis conducted by Mr Bipin Pariyar
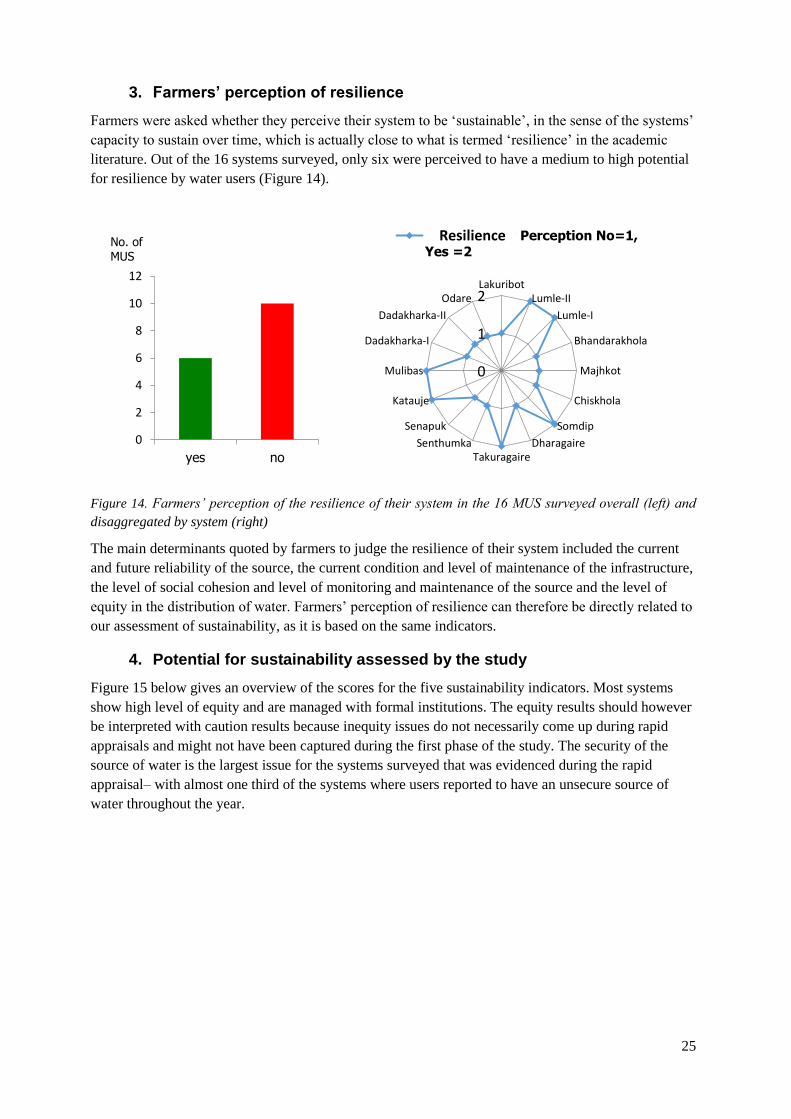
25
3. Farmers’ perception of resilience
Farmers were asked whether they perceive their system to be ‘sustainable’, in the sense of the systems’
capacity to sustain over time, which is actually close to what is termed ‘resilience’ in the academic
literature. Out of the 16 systems surveyed, only six were perceived to have a medium to high potential
for resilience by water users (Figure 14).
Figure 14. Farmers’ perception of the resilience of their system in the 16 MUS surveyed overall (left) and
disaggregated by system (right)
The main determinants quoted by farmers to judge the resilience of their system included the current
and future reliability of the source, the current condition and level of maintenance of the infrastructure,
the level of social cohesion and level of monitoring and maintenance of the source and the level of
equity in the distribution of water. Farmers’ perception of resilience can therefore be directly related to
our assessment of sustainability, as it is based on the same indicators.
4. Potential for sustainability assessed by the study
Figure 15 below gives an overview of the scores for the five sustainability indicators. Most systems
show high level of equity and are managed with formal institutions. The equity results should however
be interpreted with caution results because inequity issues do not necessarily come up during rapid
appraisals and might not have been captured during the first phase of the study. The security of the
source of water is the largest issue for the systems surveyed that was evidenced during the rapid
appraisal– with almost one third of the systems where users reported to have an unsecure source of
water throughout the year.
0
2
4
6
8
10
12
yes no
No. of MUS
0
1
2Lakuribot
Lumle-II
Lumle-I
Bhandarakhola
Majhkot
Chiskhola
Somdip
DharagaireTakuragaire
Senthumka
Senapuk
Katauje
Mulibas
Dadakharka-I
Dadakharka-II
Odare
Sustainability Perception No=1,Yes =2
Resilience

26
Figure 15. Indicators of sustainability for the 16 systems surveyed
Six systems were classified as holding medium to high sustainability, based on the five sustainability
indicators discussed earlier. These are represented below with the score for each indicator. These
systems categorized in this category are the ones where no sustainability indicator was classified as
‘poor’ and where institutions were not classified as inexistent.
Although the system of classification was set up independently of farmers’ perceptions, the six systems
we classified as sustainable match with the ones that the water users classified themselves as resilient:
Lumle-I, Lumle-II, Somdip, Takuragaire, Katauje and Mulibas (Figure 16).
0
2
4
6
8
10
12
No of MUS
Physical condition
InstitutionsSourceEquity Performance
0
1
2Source
Equity
PerformanceInstitution
PhysicalCondition
Lumle-I
0
1
2Source
Equity
PerformanceInstitution
Physical Condition
Lumle-II

27
Figure 16. Systems assessed with a medium to high potential for sustainability
Although some of these systems got a ‘fair’ score only for the indicators related to the source, equity,
physical condition of the structure and performance, all of them have formal institutions.
The 10 other systems with a low potential for sustainability are represented below. Lakuribot,
Dadarkha-II and Bandarekhola show the lowest scores (Figure 17).
0
1
2Source
Equity
PerformanceInstitution
Physical Condition
Somdip
0
1
2Source
Equity
PerformanceInstitution
PhysicalCondition
Takuragaire
0
1
2Source
Equity
PerformanceInstitution
PhysicalCondition
Katauje
0
1
2Source
Equity
PerformanceInstitution
Physical Condition
Mulibas

28
0
1
2Source
Equity
PerformanceInstitution
PhysicalCondition
Lakuribot
0
1
2Source
Equity
PerformanceInstitution
PhysicalCondition
Bhandarekhola
0
1
2Source
Equity
PerformanceInstitution
PhysicalCondition
Dharagaire
0
1
2Source
Equity
PerformanceInstitution
PhysicalCondition
Majhkot
0
1
2Source
Equity
PerformanceInstitution
PhysicalCondition
Senthumka
0
1
2Source
Equity
PerformanceInstitution
PhysicalCondition
Senapuk

29
Figure 17. Systems assessed with a low potential for sustainability
5. Exploring the socio-economic factors affecting sustainability
This research used a small-N comparative study mostly based on qualitative data converted into
categorical variables. This poses limitations in exploring correlations between sustainability and socio-
economic factors. Associations between pairs were explored using a two-way table of counts and
Fisher’s exact test to assess the significance of the relationships, as the chi-square test is inaccurate for
small numbers5.
The independent variables we tested for sustainability are:
Characteristics of the community: size of the water user group, ethnic heterogeneity, level of
initial contribution of the community towards the initial investment (as a proxy for financial
capacity of the community)
Economic context: distance to market, presence of an active collection center
We also explored associations between equity and other variables, including the level of security of the
source and the presence of a paid caretaker.
Size of the user group
The size of the user group has been often highlighted as a key determinant of successful common pool
resource management. A majority of systems with a medium to high level of sustainability have small
user groups (Figure 18).
5 Fisher’s exact test is usually used for 2*2 contingency tables but can be applied as well to larger tables. We
used for the 3*2 tables and 3*3 tables the online tool available on Vassar University stats online resource
http://vassarstats.net/
0
1
2Source
Equity
PerformanceInstitution
PhysicalCondition
Chiskhola
0
1
2Source
Equity
PerformanceInstitution
PhysicalCondition
Dadakharkha-I
0
1
2Source
Equity
PerformanceInstitution
PhysicalCondition
Dadakharkha-II
0
1
2Source
Equity
PerformanceInstitution
PhysicalCondition
Odare

30
Figure 18. Stacked column graph showing sustainability versus size of the water user group
The (two-tailed) p-value for Fisher’s exact test is not significant (0.66). The statistical test does not
allow to conclude that group size is a determinant of sustainability.
We also looked at the association of this variable with equity. A relatively high percentage of systems
characterized by a good level of equity are systems with a small group of water users (≤30 households)
(Figure 18). However, the p-value for Fisher’s exact test is not significant (0.31). The statistical test
does not allow to conclude that group size is a determinant of equity.
Figure 19. Stacked column graph showing equity versus size of the water user group
Ethnic heterogeneity
We then looked at the influence of ethnic heterogeneity on sustainability. The p-value for Fisher’s
exact test is not significant (1.00). The statistical test does not allow to conclude that ethnic
heterogeneity is a determinant of sustainability.
We also explored the relationship between ethnic heterogeneity and equity. Most systems with good
and fair levels of equity have two ethnic groups in their water user group (Figure 20).
0%
20%
40%
60%
80%
100%
Low Medium to high
Sustainability
≤30hh
>30hh
>50hh
0%
20%
40%
60%
80%
100%
poor fair good
Equity
≤30hh
>30hh
>50hh

31
Figure 20. Stacked column graph showing equity versus number of ethnic groups in the water user group
However, the statistical test does not show any significant correlation and does not allow to conclude
on any association between equity and ethnic heterogeneity (p-value= 0.27).
Level of initial contribution of the community
The influence of the level of initial contribution of the community on sustainability was not found to
be significant (p-value=0.21).
Presence of a paid caretaker
The influence of the level of the presence of a paid caretaker on sustainability and equity was not
found to be significant (p-value=0.30 and 0.86 respectively).
Economic context
Distance to market and presence of an active collection center were not found to be a determinant of
sustainability as the (two-tailed) p-values for Fisher’s exact test are not significant (0.36 and 1.00
respectively).
Level of security of the source
All the systems with a low level of equity have either a poor or fair source (Figure 21). However the p-
value for Fisher’s exact test is not significant (0.53).
Figure 21. Stacked column graph showing equity versus level of security of the source
0%
20%
40%
60%
80%
100%
poor fair good
Equity
1
2
3
0%
20%
40%
60%
80%
100%
poor fair good
Equity
poor
fair
good

32
Conclusion
To conclude, we did not find any significant association between sustainability and the socio-economic
variables selected. There was also no significant association between equity and the size and
homogeneity of the user group or between equity and the level of security of the source. The small
sample size has limited the potential to evidence significant relationships. However the case studies
that follow indicate that sustainability and equity depend on a combination of factors and their
interrelationships, which supports the absence of correlation found between pair of variables.
V. Case Study of MUS with high potential for sustainability (Lumle-I)
1. MUS setting
Community characteristics
The Lumle-I settlement in Gotane Tone, Ward 6. Lumle VDC (photography 1) is a very old settlement
with a majority of Brahmin/Chettri (15) and a few Gurung (7) households. The water user group in
MUS consists of 22 households, with around six persons per household. Although agriculture is the
main occupation, more than 80% of the households also have a non-farm income source (Table 5). The
soil in the area is black soil. The main crops cultivated are paddy, wheat and maize. Rice and wheat,
grown on khet land, are irrigated through a FMIS. Two households have more than 15 ropanis of khet
land and two are landless, the remaining households have around 5-10 ropanis with an average land
size of 7.4 ropanis (0.37ha).
Photography 1. Series of photos from Lumle 1: top left: overview of the settlement and bari land; top right,
drinking water distribution system; bottom left: a woman standing next to the Thai jar constructed by the
SIMI project in 2002; bottom right: an irrigation tap next to vegetable plot under plastic tunnel

33
Table 7. Main characteristics of the water users in Lumle-I at the time of the fieldwork
Characteristic Current status
Number of HH water users 22
Percentage of HH with education of respondent or head equal or greater than
class 10
27%
Percentage of HH engaged in vegetable cultivation 95%
Percentage of HH selling vegetables 91%
Percentage of HH selling vegetables in Lumle cooperative 91%
Percentage of HH using drip irrigation today 0%
Percentage of HH with a non-farming income source (pension, jobs, foreign
employment)
82%
Percentage of HH owning khet land 86%
Average khet land size 7.4 ropanis
(0.37 ha)
Percentage of HH raising livestock 91%
Percentage of HH engaged in commercial poultry farming 0%
Source: fieldwork, 22 respondents, August 2014
Characteristics of the resource
The source is relatively difficult to access. It is located on the land of a public agricultural research
centre, Lumle Agricultural Research Centre, which is part of the Nepal Agricultural Research Council
(NARC).
Economic context
The settlement is located 15mn walk from the highway and from the cooperative which is on the side
of the highway. It is around 1h drive from Pokhara, the district headquarter and one of the most
popular touristic hubs of Nepal.
System history
The MUS in Lumle-I is an upgraded system. A drinking water system with a tank and a few taps was
built by the government in 1989 in Lumle. All households of Lumle-I (and of other settlements) have
been using this system. When the SIMI program came in Lumle to propose to upgrade this system to a
MUS, only the 22 households from Lumle-I showed interest to grow vegetables using drip irrigation.
Drip irrigation was a pre-requisite for farmers to get water from the system. Households from other
settlements were hesitant and were not interested in engaging in vegetable production. Finally, the
MUS was established in 2002 in Lumle-I, with contribution of the community in labor and cash. SIMI
also contributed NPR 10,000 (around USD 100) cash for the intervention. As other households started
realizing the benefits of MUS, other MUS were built subsequently during SIMI and other iDE projects.
There are now nine MUS in Lumle VDC across wards no. 5 and 6.
Status of MUS
Lumle-I MUS is the only system surveyed which scored ‘good’ in all indicators of sustainability and
has formal institutions. The infrastructure includes 22 drinking water taps, six taps used for irrigating
bari land and one communal tap. MUS water was initially used for drinking water and irrigation of
bari land and is now used as well for domestic needs and livestock.
The benefits brought by MUS reported by the users include: financial autonomy of women for small
expenses thanks to income generated by vegetable production and improved diet thanks to increased

34
vegetable consumption for all households. There was no time saved for most of the households, who
already had an individual tap for drinking water. Those who got an individual tap reported that the time
saved allowed to send children to school, and for other household members to engage in productive
activities such as livestock raising and vegetable production and to rest.
Map 1 shows the water distribution and characteristics of the Lumle-I system. The socio-economic
condition of households was based on participatory wealth ranking and mapping.

35
Map 1. Water distribution system in Lumle-I
Overflow taken to the
river through a pipe
Y, VVV, B
Y, VVV, P
Y, V, F+P
Y, VV, J
Y, V, F
Y, V, F
Thai jar
SIMI
Y, V, F
Y, VV, J
Y, V, F
Y, V, F
Y, VVV, F
Y, V, F
Y, V, F
Lumle Agriculture
Centre
Source: Dharapani (used
during rainy season)
Y, V, F Y, VV, F Y, V, F N, V, B
Y, VVV, J Y, V, F
Y, C, F Y, N, F
Y, V, F
Deurali Tank
(built by government)
New tank (built by wager users with
external help and own funds)
Main source:
PaniKhalta
Indicators
Socio-economic condition of
households
High Medium Low
Agricultural land holding
No khet land
Inside the box
1. Use of drip at any point of time after
it was established: Y=yes, N=No
2. Status of vegetable production and
selling: VVV= high, VV= medium,
V= low, C= consumption only,
N= no cultivation
3. Sources of income apart from
farming: F= foreign employment,
J= job, B= business, P= pension
Overflow

36
Status of drip irrigation
Among the water users, 40% used the drip irrigation system for less than 2 years, 47% for 2-5 years
and 13% for 9-10 years. Those who stopped early were not interested from the beginning to use it (e.g.
did not have enough land or manpower or did not build a tunnel) but used it a few months because they
had to purchase the system to get water from the MUS. Those who used the system up to five years
found the system was not well adapted to larger plants or did not want to pay for replacing the pipes or
found it required too much work and preferred to turn back to piped irrigation or sprinkler.
All the households acknowledged the importance of drip in saving water but prefer not to use it as they
have sufficient water and do not have much interest in saving water, even though they are not able to
produce vegetables beyond their own needs during the dry season. Overall, farmers found it required
more time and was tiresome. They also complained that drip was time consuming and tiresome because
they still had to fetch water at the tap to fill the drum - filling of the drum of the drip kits is perceived
as laborious and strenuous, especially for women.
2. Equity
Water scarcity
Lumle-I users face few water scarcity problems even during the dry season. Their major concern is
storing more water to capture the current overflow and use it during the dry season when there is limited
water for irrigation. The vegetable production during the dry season is low and is limited to few
households whereas the rest of the year, all households are involved in production and selling.
Water users feel that the source is secure and they have kept improving the system, notably by adding
taps, with one tap for every of the 22 households. Initially, one tap was shared by 3-5 households. There
are no set rules for water allocation and everyone uses the water as per their need.
Intra-community equity
In the case of Lumle, equity is largely based on how technological interventions (taps, jars) have
mediated water allocation.
During the construction phase of the MUS, it was difficult to find a farmer willing to provide land to
build the jar. One household located upstream finally agreed to give some land but asked for a separate
tap for the house. Everyone agreed as other users thought it was fair and as nobody else was willing to
give some land.
During the initiation of the project, other water users had to share one tap between 5-6 households but
now each water user has a single tap. Also some households mentioned that the construction of a second
tank after the SIMI intervention greatly improved equitable water allocation among households, and
that since that time everyone has had access to sufficient water quantity for their needs.
The role of institutions in this case is minimal: there are no specific rules for water allocation in terms
of quantity. There is however an informal norm that households limit their use of irrigation water in the
dry season to subsistence production only. SIMI had initiated the creation of a water user committee
during the intervention and this group, called Pragati Samuha, is still active and meets once a month.
Their role is largely limited to collect the funds required for the maintenance of the MUS – although
they discuss water and other issues when needed.
Inter-community equity
There are eight other MUS in the VDC, which have a separate water user committee. All these systems
are overlooked by a main committee. Lumle-I receives water from two sources. The sources first feed

37
the main tank and water is then directed to the MUS tanks of Lumle I and II and distributed to the
households. No conflict on water allocation between the users of the different MUS has been reported
or observed.
Factors affecting equity
According to our study, the high level of perceived equity and fairness in Lumle-I is related to the
following factors.
Characteristics of the resource: there is a sufficient flow of water throughout the year to meet the needs
of everyone.
Characteristics of the infrastructure: The relatively compact settlement limits any unbalance in water
distribution between downstream and upstream users.
Characteristics of the water users: The group of water users is small (22 households) and has a good
social cohesion. This is related to a relative homogeneity in terms of size of bari land and use of water.
Nobody uses water disproportionately more than others – for instance, no household is engaged in
poultry farming, an activity which consumes a lot of water. Lastly, the water users have a relatively
high financial capacity. They donate to the collective funds during weddings and other religious
functions and the maintenance funds is today around USD 500. All 22 households have other sources
of income apart from agriculture, with remittance being the main contributor. A few households have a
house in Pokhara. This has significantly helped in collecting funds, maintaining and even upgrading the
system, e.g. by installing additional taps and building an additional tank. For instance, initially, two
households located quite downstream wanted to be part of the water user group. However, it was very
impractical as it would have required to take pipes throughout other houses, which are not part of the
MUS, to these two houses. The Lumle-I water user group finally decided to pay the cost for these two
houses to install pipes to get water from another source.
3. Vegetable commercialization
Strategies, capacity and benefits
All water users in Lumle-I are willing to cultivate and sell vegetables and 91% of them do sell
vegetables to the nearby cooperative. The average annual income from vegetable sale per household is
NPR. 11,885 (USD 120), ranging from NPR. 1,000 to NPR 40,000 (USD 10-404).
According to our study, the households who have a higher income from vegetable production are
those with sufficient manpower and area of bari land. Water was not found to be a limiting factor –
neither access to market / social network, since all households have to sell to the cooperative.
Considering the size of bari land farmers own, the labor investment required and the limited benefits
due to the low price they are getting for their products, farmers do not foresee vegetable cultivation as
a major income source for their household.
Context for vegetable commercialization
First, it is important noting that the cooperative in Lumle has established strict rules for selling
vegetables. Farmers are not allowed to sell their vegetables individually to local traders or nearby
hotels. This rule applies to all households who are using MUS in Lumle. Some households claim they
prefer to sell to the cooperative to keep it running whereas others complain about the low price they
get for their products and would like that the cooperative conducts a critical review of the pricing
system.

38
Most farmers felt the price they get for their products is not fair and that the traders were the ones
making most of the profit. Some mentioned that the cooperative was taking profit of the monopoly
situation it has created by forbidding farmers to sell directly to traders. They felt that the cooperative
was not negotiating well the prices with the traders and was forcing the farmers to sell their products to
a low price. Lumle vegetables are famous in the area for being organic and consumers are ready to pay
a high price for these.
Farmers feel that the government (the VDC or district line agency) should be more accessible and
proactive in providing new trainings and facilitating access to seeds, notably for organic farming.
4. Sustainability/Aspirations for the future
Farmers in Lumle are quite confident about the future, 57% of them see the future better than today, for
instance thanks to infrastructure and agricultural development. Around 14% think the situation will be
worse after 10 years because of the current trend of out-migration and only old people remaining in
villages. Others do not have an opinion. Among respondents, 80% have either elder children working
overseas or with a job or younger children who want to get a job. Only one respondent would like his
children to grow vegetables for commercial purpose. Farmers therefore do not see farming as a
sustainable livelihood option for the future, because it is not sufficient today to make a living for the
great majority of them.
In regard to the MUS, all water users underlined the need to build a new storage tank in order to capture
the water overflow and store it for the dry season. Farmers approached the VDC and district line
agencies to request for financial support. They are confident that even if they do not receive any external
support, they will be able to fund the new tank themselves.
VI. Case study of MUS with low potential for sustainability
(Bhandarekhola)
1. MUS Setting
Characteristics of the water users
The Bhandarekhola settlement in Ward 2, VDC Pelakot, Syangja district, is an old settlement with 33
Brahmin, Chettri and Janajati households. The average household size is around six persons.
Agriculture is the main occupation but, as in Lumle, around 80% of the households have a non-farm
income source (Table 6). The settlement is quite spread out on the side of a hill with a steep gradient.
It takes around 20mn to walk from the upper households to the lower ones. The households are spread
on the sides of a recently built road, a gravel road which is to be pitched but for the moment very
rough (only accessible to motorbikes and 4-wheelers in the dry season and not accessible to a 4-
wheeler in the rainy season). The main crops cultivated are paddy, wheat, maize and millet. There is
no canal system for irrigation, all the crops are rainfed.
Two households are women headed and are in the lowest economic group of the settlement.

39
Table 8. Main characteristics of the water users in Bhandarekhola at the time of the fieldwork
Characteristics * Current status
Total number of household water users 33
Percentage of HH with education of respondent or head equal or greater than class 10 40%
Percentage of HH engaged in vegetable cultivation 70%
Percentage of HH selling vegetables 33%
Percentage of HH selling vegetables in the co-operative
Percentage of HH using drip irrigation today 0%
Percentage of HH who never used the MUS 10%
Percentage of HH with a non-farming income source (pension, jobs, foreign
employment, business)
80%
Percentage of HH owning khet land 80%
Average khet land size** 9.48 ropanis (0.47 ha)
Percentage of HH raising livestock 93%
Percentage of HH engaged in commercial poultry farming 13%
Source: Fieldwork, August 2014
*Calculations have been done for 30 households as three households were not interviewed because of absence
or illness of the members during the fieldwork period
** Average khet size is calculated for 29 households as one of the household did not want to reveal its
landholding size
Characteristics of the resource
The source of the MUS is difficult to access, especially during the rainy season when there is a
landslide or blockage. It is a common property.
Economic context
The settlement is located 20mn walk from the highway and from Fedikhola market through a gravel
road, built in 2008. It then takes another 15mn by bus to reach the nearest cooperative, established by
SIMI. It is around 1h drive from Pokhara.
System history
The source for the system is under common property. A tank was built by the government in 1989 to
supply drinking water to the 33 households of Bhandarekhola and to a few households in Fedikhola,
another settlement located downstream by the highway. In 2000, CARE Nepal built a tank for
drinking water (called thereafter “CARE tank”), which has since been used by 24 households out of
33. Those users are located in the downstream part of the community (map 2)
CARE Nepal initially planned to use one of the sources flowing through Bhandarekhola to supply
drinking water to households located downstream in Fedikhola. As a result of the planning and
negotiation process, they agreed to build a tank for households in Bhandarekhola as a form of
compensation. The CARE tank receives water from another source as well as the overflow from the
government tank.
Map 2 shows the water distribution system in Bhandarekhola. To facilitate the discussion on water
distribution that follows, the water users using CARE tank were divided into two groups (B and C),
based on their location and the related water quantity received.

40
Overflow
Over flow
v
Map 2. Water distribution in Bhandarekhola system
15 HH (2000)
To Ward no.3 (2012)
Fedikhola near
highway (2000)
Reservoir to Fedikhola Chamber for
government tank
SIMI tank (2004)
Government tank
(1989)
CARE tank (2000)
Source:
Chaharekhola
Water Distribution
Drinking water tap Connection tap to HH
path road
Government tank (group A)
CARE Nepal tank (group B)
CARE Nepal tank (group C)
MUS source: Bhandarekhola

41
Over flow
Map 3. Household characteristics in Bhandarekhola system
Chamber for
government tank
SIMI tank
Government tank
CARE Nepal tank
Y, N,
J+F
Y, N, F
N, C, F
Y, C, N
Y, C, N
Y, C, J Y, VVV,
P
Y, N, F+J
Y, N, N
Y, VVV,
J
N, C,
J+P
Y, VVV,
F
Y, C, B Y, N, L
School
Y, VV,
J
Y, C, F
Y, V, F Y, V, J
Y, V, F
Y, VV,
J Y, VV,
N
Y, V, N
N, N, B
N, C, N
NI, N,
L+F
NI, C, F
N, N, J
N, C, N
NI, V,
F+P
Agricultural
road
Indicators
Socio-economic condition of the household
High Medium Low No information collected
No khet land: Engaged in poultry farming:
Inside the box
1. Used drip after it was established: Y=yes, N=No, NI=Not Involved in MUS
2. Level of vegetable production and selling: VVV= high, VV= medium, V= low, C=
consumption only, N= No cultivation
3. Non farming sources of income: F=foreign employment, J= job, B= business, P=
pension, L= labor
Y, N, P

42
One household and a school which are at the top of MUS households receive water directly from the
government tank.
In 2000, the water from the source used for the government tank was diverted to supply drinking water
to 15 households of a Dalit settlement located upstream of Bhandarekhola. In addition, two households
who used water from the CARE tank moved down to Fedikhola near the highway and taken the taps
and pipes with them. The number of households in Fedikhola using the CARE Nepal tank has now
increased to 15 households.
The system in Bhandarekhola was upgraded by SIMI to MUS in 2004 by adding a tank to store
irrigation water and a network of irrigation pipes and taps, with one tap serving one to five households.
The irrigation system provided water for 30 out of the 33 households of the settlement. Three
households were not part of the system because they could not contribute labor for the construction.
Households from groups B and C progressively stopped using irrigation water from 2007-2008
because the flow of water reduced and the road construction damaged some of the pipes. The system
totally collapsed when the pipe feeding the tank was damaged. All households then used the drinking
water system to irrigate their vegetables.
Lastly, in 2012, the water from a source upstream from and connected to the MUS source was diverted
to ward no. 3 further reducing the flow of water feeding the government and CARE tanks.
Photography 2. Series of photos from Bhandarekhola: top left: tank built by the government in 1989 for
drinking water supply; top right: tank built by the SIMI project in 2004 upstream of the government tank;
bottom left: view of the khet land; bottom right: the road which was built in 2007
43
Status of MUS
Today, nine households located upstream close to the government tank get water exclusively from the
government tank. All other households use the CARE Nepal tank. The irrigation tank built under SIMI
is empty and the irrigation pipe system dysfunctional.
Bhandarekhola MUS scored ‘fair’ in all indicators of sustainability but does not have a set of rules to
manage the system – although there are shared norms on water allocation. The construction committee
for the SIMI tank dissolved after completion of the works and there have been no water user committee
since. There is a mother group and an agricultural group where water issues are also discussed during
their meetings. Water users appointed a care taker before SIMI intervention for a period of two years,
but ultimately stopped as there were conflicts regarding the collection of funds for the caretaker salary.
The upstream households complained that the downstream households did not pay whereas downstream
households stated that the upstream households were not contributing because they knew they would
receive water no matter what. According to one respondent: ‘we can’t collect money. People just talk
about it but don’t do anything’. Today, households randomly go to clean the source as per needs – usually
the largest water users go more regularly than others.
The infrastructure includes 14 drinking water taps, used for drinking water, irrigation of bari land,
domestic needs and poultry/livestock.
The benefits brought by MUS reported by the users include: financial autonomy of women for small
expenses thanks to income generated by vegetable production and improved diet thanks to increased
vegetable consumption for all households. The intervention did not bring benefits in terms of time
saved as the households already had a tap for drinking water.
Status of drip irrigation in the community
The tree households who were not involved in MUS did not purchase a drip irrigation kit. Five other
households (one from group A and two each from group B and C) never used the drip irrigation system
they purchased.
Among the 25 households who used drip after SIMI intervention, 45% used it for one year, 40% used it
for 2 years and 15% used it for three to four years. The main reason for people stopping use drip was
that the water quantity supplied by the irrigation system and the irrigation pipes linking the taps to each
house got damaged by the road construction, so the irrigation system became dysfunctional. Those
cultivating vegetables now use pipes and buckets for irrigating their vegetables.
2. Water distribution and equity
Water distribution
Households from group A receive sufficient water for both their irrigation and drinking water needs
but are concerned about the future – a concern which has naturally grown as the source has been used
by an increasing number of settlements in the VDC. Households from group B receive sufficient water
for drinking water and domestic use. Some sell vegetables but only to a medium/small extent (what is
left from consumption). Three of them, located next to the tank also use large quantities of water for
poultry farming (map 3). Water users from group C face severe shortage for drinking water during the
dry season, and need to fetch water to another source or from the river. They even sometimes do not
get sufficient water for domestic and drinking needs during the rainy season when the source gets
blocked by stones and leaves. None of them is engaged in poultry farming or vegetable selling – a few
of them cultivate for home consumption.

44
History
In order to understand equity issues related to water distribution in the settlement today, one needs to
look back from the beginning of the system when the government tank was established in 1989. At that
time, downstream households (groups B and C) received less drinking water from the government tank
than upstream households (group A). When the CARE tank was established, all households who were
willing to receive water from this tank could join the scheme. All households from groups B and C did
so as they believed they would receive more water with the new scheme. However, the households from
group A managed to get the water distribution between the government tank and the CARE tank to their
benefit. Two small chambers were made to divert water to the nine households from group A. A pipe
was added in the government tank, which is placed higher than the pipe that takes water to the two
chambers. This higher placed pipe takes water to the CARE tank. So, whenever the water level is lower
than pipe, the CARE tank does not receive water from the government tank. The group A households
thought that if both the pipes were placed at the same height, the water would flow directly downwards
once the taps are opened there and they would not receive water unless those taps are closed. One of
them explains: ‘
There is a pipe in the government tank that takes water to the CARE tank but it is
placed higher than the pipe that supplies water to the nine households [group A]. This
is because if both the pipes were at the same level, the water would directly flow to the
CARE tank and we would receive less water. So, the CARE tank receives water from
our tank only once the water level rises to the height of that pipe. They get water from
another source, but for us this is the only source of water (household interview, August
2014)
The SIMI project came in four years later with the proposition to add a tank to the existing system,
specifically dedicated to irrigation for vegetable production. SIMI project staff initially planned to use
water from a reservoir used by households in Fedikhola to feed the new irrigation tank. The construction
went ahead. However, downstream water users from Fedikhola did not agree as they believed that they
would not get sufficient drinking water if water from their reservoir was used for irrigation by
Bhandarekhola users. SIMI project staff and Bhandarekhola households asked Fedikhola households to
extract water from the nearby river but they did not agree as it required pumping and filtering the water.
The matter went up to the VDC but no agreement was found as Fedikhola users defended that drinking
water use should get priority over irrigation use. The SIMI tank partially built had to find another source
of water: there was no other option than using the same chamber than the government tank. The chamber
would first fill the irrigation tank and then the government tank.
Some households from group C were against it as they thought that they would not receive enough
drinking water from the CARE tank anymore. The water would be allocated for irrigation before
feeding the CARE tank: ‘I was against using the same chamber for both purposes because we
downstream people wouldn’t get water even for drinking’. The personal connection of the SIMI staff
with a household located in group A might have also made some downstream households suspicious
about whether the project would benefit them. In order to address the downstream/upstream conflict
over water allocation, users agreed to close the inflow valve of the irrigation tank during the dry season
to ensure that drinking water needs would not be jeopardized by irrigation use.
The water supply in the irrigation system was sufficient for 1-2 years, except for two respondents who
said they never received water for irrigation from the SIMI tank. Three households who could not
contribute labor during the construction of the irrigation tank did not have access to the irrigation taps.
One household couldn’t give their time during the construction period: ‘I was working outside and my
kids were small. So, my wife didn’t have time to be involved in MUS. But now I realize that if she had
taken the training on vegetable production, it would have been useful because I have time now and can

45
see the benefits of vegetable production’. This household was not able to join the scheme later on as
they could not provide the financial equivalent of their labor contribution for the construction that was
requested to them by other households. The other two households learnt about the scheme and the
conditions to join only at a later stage.
After a couple of years, the water supply from the source decreased, a few pipes in the distribution
system were destroyed by the road construction and the water supply eventually totally stopped when
one of the pipes feeding the tank was damaged. Some households indicated that it was damaged by fire
whereas other households suspect that the irrigation pipes were destroyed by downstream households
who did not get enough water. The pipes have never been replaced.
Since then, households in group A have used the water from the government tank to continue irrigating
their vegetable plots. As a result, some of the downstream households do not receive sufficient water for
drinking water needs.
Water use priority
The inequity in water distribution was discussed by water users in meetings. Downstream users from
group C asked to get water for 1h. Upstream users promised they would use a minimum amount of water
for their needs, but the households located in group C still face serious water shortages:
We were equally involved in the construction and establishment of MUS. But now we
do not even receive enough drinking water. I do not understand how the system was
made. It was supposed to distribute water equally. But now after putting the same
effort, we get less and others get more. If my son who is abroad was here, he would
have taken the matter to the upstream people. They know our situation but do not do
anything to help us (household interview group C, August 2014)
Upstream households on the other hand claim that they do not have much water for their own use: ‘people
downstream don’t get enough water if the upstream households don’t close their taps. I also receive very
low flow of water from my tap although I am at the top of the MUS households and receive directly from
the government tank’ (household interview group A, August 2014).
Inter-community
The source has for the past 15 years been used by an increasing number of users. Our fieldwork findings
suggest that, in this area when the diversion was used to meet the drinking water needs of a community
who does not have other alternative, downstream users did not oppose it. This was the case when a
diversion was made in 2000 to the 15 households located upstream and there was no conflict. However,
when CARE Nepal planned to use the MUS source to provide water to the Fedikhola people,
Bhandarekhola households didn’t agree because they felt the latter could use other sources for drinking
water. To solve this disagreement, CARE Nepal finally built the CARE tank which they connected to a
different source.
When SIMI project staff came a few years later, they proposed to add a third water source to the existing
water supply system for irrigation. The idea was to use water from another reservoir used for drinking
water by a community located in Fedikhola. The latter however opposed it because they knew the water
diverted from their system was to be used for irrigation, and not for meeting basic domestic needs.
Bhandarekhola households mentioned that had they wanted to use the reservoir for drinking water,
Fedikhola users would have agreed. Lastly, in 2012, a source upstream from and connected to the MUS
source was diverted to ward no. 3. Bhandarekhola users opposed it and claimed ward no. 3 households
could use other sources but since the source was located on a private land, the decision ultimately lied
with the landowner.

46
Factors affecting equity
Characteristics of the resource: the water flow from the MUS source has been declining as it has been
being used by an increasing number of other groups for the past 15 years.
Characteristics of the resource users: the settlement is spread over a steep terrain. The users lack social
cohesion as illustrated earlier: they did not manage to keep a caretaker neither to repair/replace the
irrigation pipes damaged six years ago. The high rate of outmigration and local gender norms have also
reduced the ability of the water users to conduct collective actions. According to one female respondent:
‘we have been talking about maintenance but we have not been able to collect money for such activities.
No one takes initiatives as there are no males/sons in the houses. It is difficult for women to take the
lead’. Lastly, the water use is quite heterogeneous with three households engaged in commercial poultry
farming (between 300-600 chickens) and three engaged in commercial vegetable production (the latter
did not disclose their actual earnings).
Interaction between infrastructure providers and resource users: According to one of the respondents,
SIMI selected Bhandarekhola because of its ease of accessibility and personal linkage of one of SIMI
project staff with his family. When the SIMI project came, there was therefore already a high level of
mistrust between upstream-downstream water users. Downstream users mention that SIMI project staff
did not visit households from group C. The intervention revived a latent conflict. SIMI started to build
the tank for irrigation before understanding and resolving water allocation issues regarding the source.
3. Vegetable commercialization
Strategies, capacity and benefits
Eleven out of 30 households surveyed sold vegetables last year. However, most of these households,
except three from group A, sell the products left after home consumption. The average annual income
per household is NPR 1,357 (USD 14) ranging from NPR 1,200 to NPR 10,0006 (USD 12-101).
According to our findings, most of the households (18 out of 20) in group A and B cultivate vegetables
for consumption. In group C, however, there are only 4 out of 13 households who cultivate vegetable.
This underlines the importance of location in water distribution and in household capacity to engage in
vegetable production.
Only one household in group A doesn’t cultivate vegetables because the household head is engaged in
labor works and does not have time. The two households in group B who don’t cultivate vegetables have
old or disabled family members and get income from their sons who are jobholders or involved in foreign
employment.
For a great majority of households, the amount earned by selling vegetables is petty cash used for
household expenditures (e.g. salt, oil, tea, sugar) or for children school fees. Households also
acknowledged they build their skills and knowledge for vegetable production thanks to the trainings
organized by SIMI.
Context for vegetable commercialization
Apart from lack of water, farmers face difficulties to sell their products on the market. Farmers sell either
in the Fedikhola market or to Sarketari co-operative, created by SIMI, further away (15 minutes by bus).
They usually prefer Fedikhola as they get a better price and is located closer. However, there is no
guarantee that the traders in Fedikhola will buy the vegetables so farmers sometimes have to take their
vegetables to the co-operative, which buys irrespective of the amount of vegetable:
6 We however suspect that the three households from group A who are engaged in commercial vegetable
production did not report their actual earnings

47
We have been selling less every year. My house shares a tap with five other
households. Even after we cultivate the vegetables, we don’t get a good price for our
products. Fedikhola traders don’t always buy all the vegetables and they have set
their own price. On the other hand, we have to pay for transport to take to the co-
operative and sell there at a low price. We don’t have any other option (household
interview, August 2014).
Other issues raised by the respondents are difficulty in getting seeds, lack of new trainings or technical
knowledge about seeds and farming techniques.
4. Sustainability/Aspirations for the future
Farmers in Bhandarekhola have mixed feelings about the future, 47% of them see the future better than
today, for instance thanks to new infrastructure (pitched road and better irrigation facilities), while 53%
feel it will be more difficult to live in the village because of water scarcity and that agriculture will
collapse because most young people will work abroad or get jobs in cities.
Upstream households who get adequate water and are involved in vegetable cultivation are concerned
with new seeds, trainings, good price and a collection center for their vegetables. Downstream
households are worried about getting drinking water.
Only one respondent would like his children to grow vegetables for commercial purpose.
VII. Vegetable commercialisation
This section examines the current characteristics and performance of the market planning committees
and collection centers which were established under SIMI between 2004 and 2008.
1. Performance of the collection centers and MPCs
Collection centers
At the time of the first survey (May 2014), four out of the seven studied collection centers were still
active and three of these were upgraded to a cooperative. Two of them open every day while the other
two open twice a week (Figure 20).
Figure 22. Characteristics of the seven collection centers surveyed
4
3
2 2
3
4
0
1
2
3
4
5
Active Inactive 2Days/week
Every day Yes No
Collection centre Upgraded tocooperative
No
. of
MP
Cs
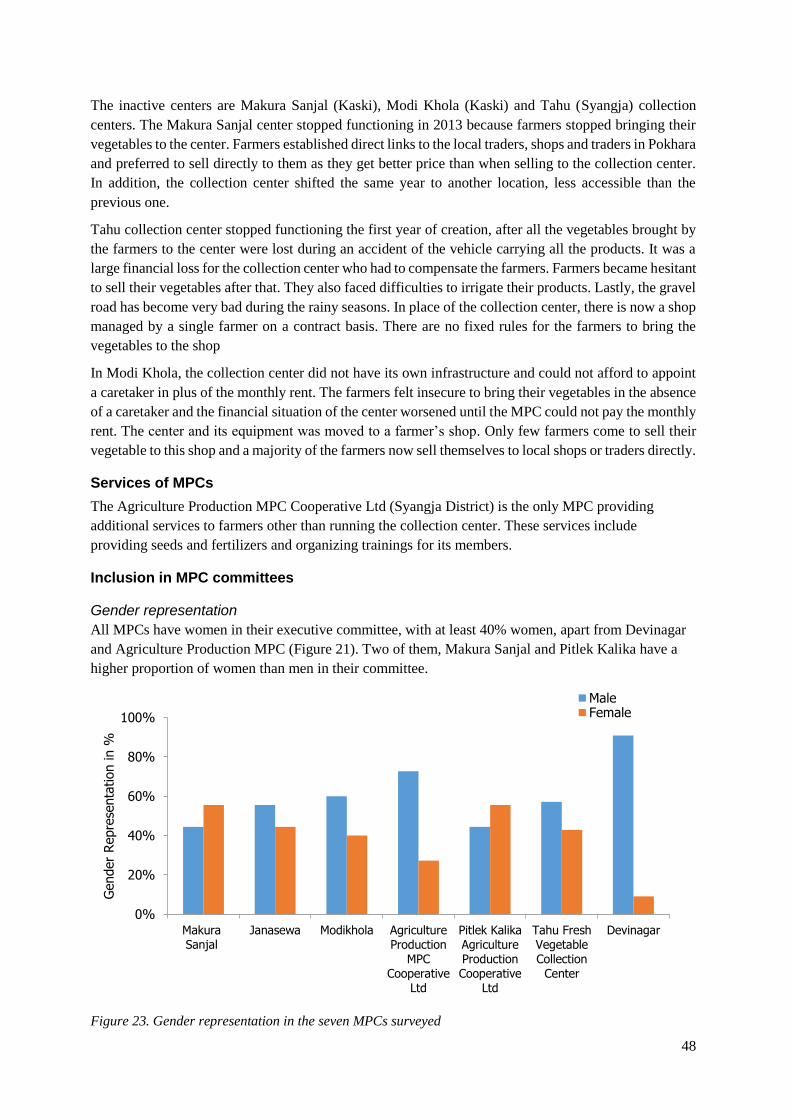
48
The inactive centers are Makura Sanjal (Kaski), Modi Khola (Kaski) and Tahu (Syangja) collection
centers. The Makura Sanjal center stopped functioning in 2013 because farmers stopped bringing their
vegetables to the center. Farmers established direct links to the local traders, shops and traders in Pokhara
and preferred to sell directly to them as they get better price than when selling to the collection center.
In addition, the collection center shifted the same year to another location, less accessible than the
previous one.
Tahu collection center stopped functioning the first year of creation, after all the vegetables brought by
the farmers to the center were lost during an accident of the vehicle carrying all the products. It was a
large financial loss for the collection center who had to compensate the farmers. Farmers became hesitant
to sell their vegetables after that. They also faced difficulties to irrigate their products. Lastly, the gravel
road has become very bad during the rainy seasons. In place of the collection center, there is now a shop
managed by a single farmer on a contract basis. There are no fixed rules for the farmers to bring the
vegetables to the shop
In Modi Khola, the collection center did not have its own infrastructure and could not afford to appoint
a caretaker in plus of the monthly rent. The farmers felt insecure to bring their vegetables in the absence
of a caretaker and the financial situation of the center worsened until the MPC could not pay the monthly
rent. The center and its equipment was moved to a farmer’s shop. Only few farmers come to sell their
vegetable to this shop and a majority of the farmers now sell themselves to local shops or traders directly.
Services of MPCs
The Agriculture Production MPC Cooperative Ltd (Syangja District) is the only MPC providing
additional services to farmers other than running the collection center. These services include
providing seeds and fertilizers and organizing trainings for its members.
Inclusion in MPC committees
Gender representation
All MPCs have women in their executive committee, with at least 40% women, apart from Devinagar
and Agriculture Production MPC (Figure 21). Two of them, Makura Sanjal and Pitlek Kalika have a
higher proportion of women than men in their committee.
Figure 23. Gender representation in the seven MPCs surveyed
0%
20%
40%
60%
80%
100%
MakuraSanjal
Janasewa Modikhola AgricultureProduction
MPCCooperative
Ltd
Pitlek KalikaAgricultureProductionCooperative
Ltd
Tahu FreshVegetableCollection
Center
Devinagar
Gender
Repre
senta
tion in %
MaleFemale

49
Ethnic representation
Brahmin/Chettri dominate five of the seven MPCs (Figure 22). Two MPCs have Dalit members.
Makura Sanjal and Tahu MPCs have single ethnic committee members- Brahmin/Chettri and Janajati
respectively. The only committee with representation from three ethnic groups is Devinagar.
Figure 24. Ethnic representation in the seven MPCs surveyed
Outreach
Agriculture Production MPC (Syangja) and Makura Sanjal (Kaski) have three and two collection
centers under their management respectively (Figure 23), whereas other MPCs manage one center.
There has been an increase in the number of farmers’ groups under three of the MPCs since their
formation. Two MPCs (Makura Sanjal and Devinagar) resell to local markets whereas the remaining
three also sell to markets outside of the district.
Figure 25. Outreach of the seven MPCs surveyed
0%
20%
40%
60%
80%
100%
MakuraSanjal
Janasewa Modikhola AgricultureProduction
MPCCooperative
Ltd
Pitlek KalikaAgricultureProductionCooperative
Ltd
Tahu FreshVegetableCollection
Center
Devinagar
Eth
nic
Repre
senta
tion in %
Dalit
Janajati
Bramin/Chettri
0123456
Sin
gle
Tw
o
Thre
e
None
Incr
ease
d
Decr
ease
d
No c
hange
Not
act
ive
loca
l
outs
ide d
istr
ict
Inact
ive
No.of CC No. of Farmer group market
No.
of
MPCs

50
Institutions
Fee collection is done regularly by four MPCs and irregularly by one (Figure 24). Similarly, two MPCs
(Janasewa and Makura Sanjal) established transparent processes on the decisions of the meetings and
financial transactions. Three of the MPCs have a provision of fines for their members.
Figure 26. Institutional arrangements in the seven MPCs surveyed
2. Profile of farmers producing and selling vegetables
Farmers’ profile was developed according to two sources of information: first the data collected from
the 14 farmers interviewed in each district (selling and not selling at the collection center) and second
the records of the transactions for the last month preceding our field visit. The latter informs us about
the amount of vegetable brought, monthly income generated from the sales for each farmer and the
gender and ethnic distribution of the farmers who bring their vegetables to the center.
Farmers selling at the collection center/cooperative
Table 7 provides an overview of farmers selling at the collection center and cooperative in Kaski and
Syangja districts respectively. The data used was collected in the book records of the center for one full
month (Shrawan, which is from around mid-July to mid-August). This is offseason for vegetable
production – major vegetables sold in the centers during this month were bitter gourds, tomatoes and
cucumbers.
The data collected indicate that both male and female farmers sell at the centers, with a predominance
of female farmers (71%) in Kaski. In terms of income, the average income per male farmer in the
cooperative in Syangja is 25% higher than for female farmer. However, this is not the case in Kaski.
An equal proportion of men and women farmers made multiple sales in the month in the two centers.
The ethnic distribution is markedly differentiated with a clear predominance of Brahmin/Chettri (85%
and 73% in Syangja and Kaski Districts respectively) in the number of farmers selling at the two
centers. Even if Brahmin/Chettri represent a majority of the population in Fedikhola and
Dikurepokhari VDC of Syangja and Kaski districts (54% and 64%) respectively, the figures still
indicate their prevalence compared to other ethnic groups in the sellers of the collection center. Dalit
farmers are almost absent from the sellers in Syangja cooperative but relatively well represented in the
0
1
2
3
4
5
6
Regular Irregular No Yes No Yes No Yes No
Meetings' Minutes Book Keeping
Fee Collection Transparency Fine/Penalty
No.
of
MPCs
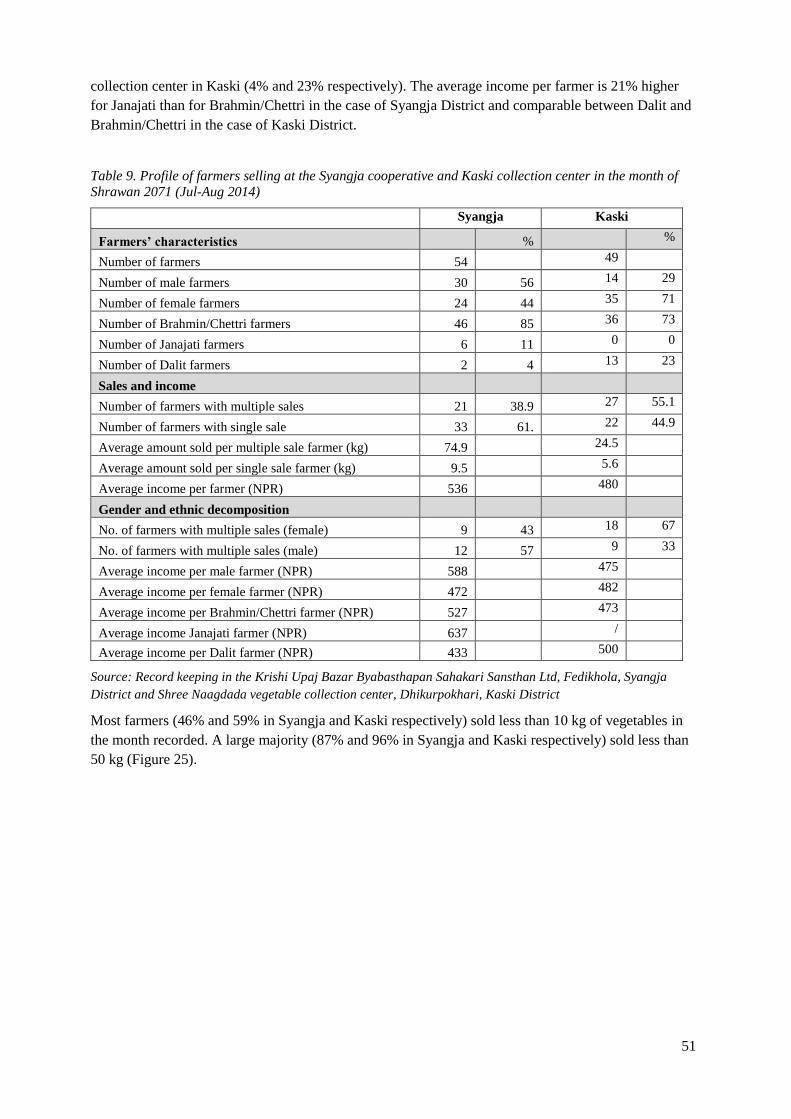
51
collection center in Kaski (4% and 23% respectively). The average income per farmer is 21% higher
for Janajati than for Brahmin/Chettri in the case of Syangja District and comparable between Dalit and
Brahmin/Chettri in the case of Kaski District.
Table 9. Profile of farmers selling at the Syangja cooperative and Kaski collection center in the month of Shrawan 2071 (Jul-Aug 2014)
Syangja Kaski
Farmers’ characteristics % %
Number of farmers 54 49
Number of male farmers 30 56 14 29
Number of female farmers 24 44 35 71
Number of Brahmin/Chettri farmers 46 85 36 73
Number of Janajati farmers 6 11 0 0
Number of Dalit farmers 2 4 13 23
Sales and income
Number of farmers with multiple sales 21 38.9 27 55.1
Number of farmers with single sale 33 61. 22 44.9
Average amount sold per multiple sale farmer (kg) 74.9 24.5
Average amount sold per single sale farmer (kg) 9.5 5.6
Average income per farmer (NPR) 536 480
Gender and ethnic decomposition
No. of farmers with multiple sales (female) 9 43 18 67
No. of farmers with multiple sales (male) 12 57 9 33
Average income per male farmer (NPR) 588 475
Average income per female farmer (NPR) 472 482
Average income per Brahmin/Chettri farmer (NPR) 527 473
Average income Janajati farmer (NPR) 637 /
Average income per Dalit farmer (NPR) 433 500
Source: Record keeping in the Krishi Upaj Bazar Byabasthapan Sahakari Sansthan Ltd, Fedikhola, Syangja
District and Shree Naagdada vegetable collection center, Dhikurpokhari, Kaski District
Most farmers (46% and 59% in Syangja and Kaski respectively) sold less than 10 kg of vegetables in
the month recorded. A large majority (87% and 96% in Syangja and Kaski respectively) sold less than
50 kg (Figure 25).

52
Figure 27. Distribution of the quantity of vegetables sold per farmer in July-August 2014
Among the seven respondents selling at the Makura Sanjal collection center in Kaski, all indicated that
they chose to sell their products in the center to sustain it. Their annual income from vegetables ranges
from NPR 30,000-200,000 (USD 303 to USD 2021) with an average income of NPR 59,000/year
(USD 598/year). Four of them have in addition non-farm income sources (remittance, pension and
business). They indicated that vegetable selling represented between 7 to 100 % of their total annual
income, on average 67%. All of them own khet land (6 to 15 ropanis) and livestock. Five of them know
about other marketing channels for their vegetables and two of them know only about the collection
center. Lastly, all are involved in at least one local group such as farmer’ group.
Among the seven respondents selling at the cooperative in Syangja, all indicated they preferred to sell
their products so that the cooperative could continue growing. Their annual income from vegetables
ranges from NPR 15,000-900,000 (USD 156 to 9,095) with an average of NPR 286,000/year (USD
2887/year). Three of them have in addition non-farm income sources (remittance and local jobs). They
indicated that vegetable selling represented between 50 to 100 % of their total annual income, on
average 85%. All of them own khet land (2 to 10 ropanis) and six of them have livestock. Six of them
know about other marketing channels for their vegetables. Lastly, six of them are involved in at least
one local group such as farmer’ group.
Farmers selling vegetables to other outlets
Among the seven respondents selling vegetables through another channel than the Makura Sanjal
collection center, they prefer not to sell to the collection center because of the low rate given to
products. They are selling their products to traders coming to their home or in the village and local
shops. Their annual income from vegetable selling ranges from NPR 12,000 to 70,000 (USD 121 to
707) with an average annual income of NPR 48,000 (USD 485). All of them have non-farm income
sources (remittance, pension, business, other jobs, wage labor) and vegetable selling represented
between 5 to 28% of their total annual income. All of them own khet land (one to 60 ropanis) and had
livestock. Lastly, all are involved in at least one local group such as farmer’ group.
Among the seven respondents selling vegetables through another channel than the cooperative in
Syangja, they prefer not to sell to the collection center because of the very low rate given to products
or the NPR 5/kg fee to pay for the services of the center. They are selling their products to traders
coming to their home or to households in the village and to local shops. Their income from vegetable
0
5
10
15
20
25
30
35
0-10 kg 10--50 kg 50-100 kg 100-200 kg >200 kg
Syangja
Kaski
Number of farmers

53
selling ranges from 07 to NPR 300,000 (USD 0 to 3032) and six of them have non-farm income
sources (remittance, pension, business, other jobs, wage labor). Vegetable selling represent between 0
to 40% of their total annual income. All of them own khet land (0.5 to 30 ropanis) and livestock.
Lastly, all are involved in at least one local group such as farmer’ group, women development groups
or saving groups.
3. Expectations on the services and performance of collection centers
In Syangja District, besides its role of collecting and reselling all the vegetables that are brought to the
center irrespective of the quantity, the collection center has been providing a few services: trainings
and seeds distribution to the associated farmers groups. The farmers who are members of these groups
would like this provision to be more regular. The center also provides low interest loans to the farmers.
Farmers’ main expectation is that the collection center is in a position to better negotiate the buying
price for their vegetables with traders, notably by making an end to the current monopoly situation.
They also expect the collection center to coordinate with the government and non-government
organizations (NGOs) to ensure regular provision of inputs and training programs.
In Kaski District, all respondents, including farmers selling and not selling at the collection center and
traders, expect a collection center to provide the following services and facilities:
- Advices and guidance to farmers during vegetable production season and off-season on how to
increase their production, e.g. through regular visits to monitor plant growth and production.
- Regular opening
- Organize transportation facilities to help farmers located far away from the center
- Offer storage facilities
- Financial support for training and capacity building programs
- Provide seeds and fertilizers
In addition, transparency in the management of the collection center was also a major expectation
4. External factors affecting vegetable sale
We examined the factors external to household characteristics which affect vegetable productions.
Farmers selling/not selling at the collection center had similar responses.
Constraints
In Syangja District, the traders interviewed observed a decrease in the production of vegetables in the
last 5 years. They indicated that although the demand of the market is high, the production is low.
Farmers selling at the collection center feel that the marketing conditions are not supportive as they get
a low price for their products (Table 8), well below the selling price on the retail market. They believe
this is due to the current monopoly of traders purchasing from the center. However, farmers do sell in
the collection center even though they have the knowledge and channels to other marketing modes.
Respondents feel that the collection center is well-suited to low income farmers who produce small
quantities, but not to farmers producing large quantities who can sell directly to traders. All farmers
highlighted that the lack of transportation facilities and low accessibility to the center are major
impediments to commercial production: some farmers stated they chose to do subsistence cultivation
only because the travelling time to the collection center is 45 minutes walk.
7 Those with 0 as income actually did not sell vegetables this year but were selling earlier to other outlets than the
cooperative/collection center
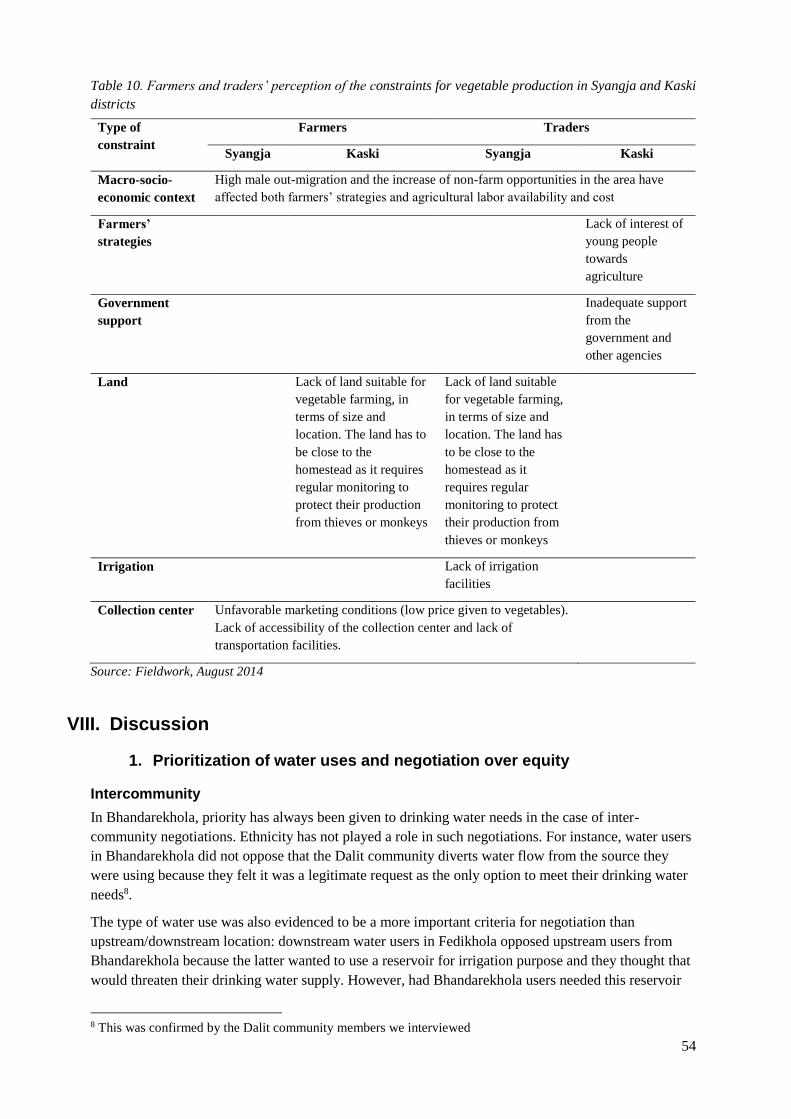
54
Table 10. Farmers and traders’ perception of the constraints for vegetable production in Syangja and Kaski
districts
Type of
constraint
Farmers Traders
Syangja Kaski Syangja Kaski
Macro-socio-
economic context
High male out-migration and the increase of non-farm opportunities in the area have
affected both farmers’ strategies and agricultural labor availability and cost
Farmers’
strategies
Lack of interest of
young people
towards
agriculture
Government
support
Inadequate support
from the
government and
other agencies
Land Lack of land suitable for
vegetable farming, in
terms of size and
location. The land has to
be close to the
homestead as it requires
regular monitoring to
protect their production
from thieves or monkeys
Lack of land suitable
for vegetable farming,
in terms of size and
location. The land has
to be close to the
homestead as it
requires regular
monitoring to protect
their production from
thieves or monkeys
Irrigation Lack of irrigation
facilities
Collection center Unfavorable marketing conditions (low price given to vegetables).
Lack of accessibility of the collection center and lack of
transportation facilities.
Source: Fieldwork, August 2014
VIII. Discussion
1. Prioritization of water uses and negotiation over equity
Intercommunity
In Bhandarekhola, priority has always been given to drinking water needs in the case of inter-
community negotiations. Ethnicity has not played a role in such negotiations. For instance, water users
in Bhandarekhola did not oppose that the Dalit community diverts water flow from the source they
were using because they felt it was a legitimate request as the only option to meet their drinking water
needs8.
The type of water use was also evidenced to be a more important criteria for negotiation than
upstream/downstream location: downstream water users in Fedikhola opposed upstream users from
Bhandarekhola because the latter wanted to use a reservoir for irrigation purpose and they thought that
would threaten their drinking water supply. However, had Bhandarekhola users needed this reservoir
8 This was confirmed by the Dalit community members we interviewed

55
for drinking water needs, they would not have opposed it - upstream/downstream location is therefore
a criteria that matters as well for negotiation.
Lastly, land and water rights are playing a key role: landowners have total control over the source
located on their land, regardless of the impact of their decision on downstream users.
Intracommunity
In Lumle I, priority has been given to drinking water needs for intra-community negotiation on water
distribution. All households limit their water use for irrigation during the dry season so that all
households get sufficient water for drinking needs.
In Bhandarekhola, priority is in principle given to drinking water needs. However, in practice,
negotiations and water access and distribution have been shaped by upstream/downstream location,
class and gender. First, despite the fact that upstream water users informally agreed during collective
meetings to limit their use to basic needs, some of them are still using the water for commercial
vegetable production or poultry farming, although they know that, as a result, some households have to
fetch water for drinking needs to far-away sources and are not able to grow vegetables even for their
own consumption.
Secondly, although it was not explicitly acknowledged, we observed that households with a high social
status (high education, pension/job) have better access to water than other users (e.g. single tap
although other users have to share water among up to five households). Lastly, gender was evidenced
as another determinant of access to water. The households whose male head was away during the
construction process of the MUS could not contribute to the construction of the tank and, as a result,
did not get access to the MUS.
Gender
Gender relationships and gender roles do not seem to influence prioritization of water uses in inter- and
intra-community negotiations, in the sense that men’s first priority is to have access to sufficient
quantity of drinking water throughout the year, even if fetching drinking water falls under women’s
role. Whether men are equally concerned as women that the source of drinking water is close to their
homestead was however not explored /evidenced during our interviews.
2. Sustainability
Economic return and sustainability
One of the key assumptions that supports claims of greater sustainability of MUS versus single-use
systems is that increased economic returns from homestead vegetable production provide incentives
for communities to protect water sources. conservation and environmental protection (Rautanen and
G.C., 2012). Our findings support this assumption. For instance, in Bhandarekhola, the households
who go more frequently to clean the source are those who get high economic benefits from water use
(commercial vegetable production and poultry farming).
However, whereas economic returns seem to support resilience, they do not necessarily support
sustainability. To assess the latter, one has to look at social equity and the distribution of the benefits
from MUS among water users. When the water system –whether it was designed as multiple or single
use - supports the economic activities of only a few households, these economic benefits can become a
threat to its sustainability as much as they support its resilience – that has been the case in
Bhandarekhola, where only a few users have derived substantial economic benefits from the system,
but by doing so have forced other households to look for alternative sources to meet their drinking
water needs.

56
Characteristics of the social-ecological system affecting equity and sustainability
Common property theory has identified a set of variables that affect the performance of local
institutions. Notably, Elinor Ostrom proposed eight design principles for robust institutions (rules-in-
use and norms) for managing common-
pool resources (Ostrom, 1990) (Box 2).
These principles have been well-tested
and supported empirically (Cox et al.,
2010). In this study, we were more
interested in the variables which affect
the design of robust institutions and the
sustainability of common-pool resource
management, such as group size,
individual leadership, characteristics of
the resource (e.g. spatial and temporal
heterogeneity) and costs/benefit ratio
for institutional design (Agrawal and
Goyal, 2001, Nagendra, 2007,
Meinzen-Dick, 2007, Wade, 1988,
Ostrom et al., 2011).
Although institutions do play a role, we consider that their design and the will and capacity of water
users to design effective institutions ultimately depends on other factors. For instance, the second
design principles (congruence between appropriation rules and local conditions) was observed in
Lumle-I were users agreed to reduce their water intake during the dry season for drinking water needs
and production at the subsistence level. This was not the case in Bhandarekhola, where upstream users
deliberately used large quantities of water for their economic activities, leaving downstream users
without sufficient water for drinking. However, the design of these norms was ultimately affected by
the characteristics of water users, such as the level of social cohesion and trust and the power
distribution among users.
The statistical analysis conducted over 16 sites visited did not suggest causal relationships between the
socio-economic variables selected (size of the water user group, ethnic heterogeneity, level of
contribution of the community towards the initial investment (as a proxy for financial capacity of the
community), distance to market, presence of an active collection center) and our assessment of equity
and sustainability levels. This might be due to the small size of the sample. Another reason, which is
supported by the case studies, is that rather than a single variable, it is the interrelationships of multiple
variables which influence equity and sustainability in such complex social-ecological systems, namely:
(1) the characteristics of the resource, characteristics of the infrastructure, characteristics of the water
users as characteristics of the social ecological system and (2) the governance system and economic
context as external factors affecting these characteristics and farmers’ decisions.
On the one hand, the governance system and economic context play an indirect role by affecting the
characteristics of the water users. For instance, opportunities for male out-migration are likely to affect
intra- and inter-household gender relationships among water users, their social cohesion and their
financial and technical capacity. On the other hand, they can also directly influence farmers’ decisions
over their system by shaping their range of permitted actions and their interests. For instance, security
of land tenure can affect farmers’ land use decisions and interest to invest in irrigation. Similarly
favorable marketing conditions for vegetables might provide incentives for farmers to design robust
institutions to sustain their irrigation system.
Box 2. Design principles for robust institutions
(Ostrom 1990) 1. Clearly defined boundaries; 2. Congruence between rules on the appropriation and
provision of common resources and local conditions; 3. Collective-choice arrangements that allow most
resource appropriators to participate in decision-making;
4. Effective monitoring by monitors who are part of or accountable to the appropriators;
5. A scale of graduated sanctions for resource appropriators who violate community rules;
6. Mechanisms of conflict resolution that are cheap and of easy access;
7. Self-determination of the community recognized by higher-level authorities (recognition of rights); and
8. In the case of larger common-pool resources, organization in the form of multiple layers of nested enterprises

57
For this study, we mostly focused on the characteristics of the social-ecological system due to time and
resource constraints. Also, since the study aims at informing a project led in the context of Nepal, these
seemed to us more relevant than the context to provide guidance that can help project designers and
implementers to design their interventions in a way which can address variables on which they can act
upon. We however looked at the potential impact of male out-migration and at the extent to which the
current governance system support conflict resolution mechanisms and recognizes indigenous water
use rights (design principles 6 and 7), notably in the case study of Bhandarekhola.
Lumle-I was a case study where all the characteristics of the social ecological system positively
interacted to support robust institutions and the sustainability of the system whereas in Bhandarekhola,
most characteristics were unfavorable (Table 9).
Table 11. Characteristics affecting equity and sustainability in the two case studies
Variable Lumle-I (Kaski District) Bhandarekhola (Syangja District)
Water resource Sufficient flow of water throughout the
year to meet the needs of all users for
drinking and vegetable production for
subsistence
Insufficient flow of water to meet the
drinking and irrigation needs of all
users
Infrastructure The relatively compact settlement
limits any unbalance in water
distribution between downstream and
upstream users
Very spread settlement located in a
hilly terrain with high gradient
Water users Small group
High level of social cohesion.
Relative homogeneity in terms of size
of bari land
Relatively high financial capacity
Small group
Low level of trust and social cohesion
at the time of SIMI intervention and
nowadays, notably due to past conflicts
over water*
Source: fieldwork, August 2014
* There might be other reasons but the time available for the fieldwork did not allow to explore these in detail
Using technology to address inequities in water distribution
Technology showed to play an important role in addressing inequities in water distribution. Even in
Lumle-I where inequities are small due to the physical and social characteristics of the social-
ecological system, households acknowledged that the addition of a tank after the SIMI project greatly
helped to reduce inequities in water distribution by allowing to store more water and address scarcity
problems during the dry periods.
However technologies can be as well used to reinforce/maintain inequities as evidenced in
Bhandarekhola. In this case, upstream users made sure that the water distribution system was designed
to that water from the government tank would flow to the CARE tank only after all their water needs
(both domestic and irrigation) are met. During the implementation of the SIMI intervention, water
users agreed that the tank inflow would be closed during the dry season so that drinking water needs of
all users are met.
3. Water use efficiency and drip irrigation
Drip irrigation was used for 3-10 years in Lumle by 60% of the water users and less than 3 years in
Bhandarekhola by 97% of the water users. Today, none of the 52 users interviewed uses drip irrigation.
The 12 water users surveyed during the first field visit in six other sites (Dadakharka-II, Katauje,

58
Dharagaire, Majhkot, Odare and Somdip) reported they stopped using drip as well. No information
was collected from the eight remaining systems on whether drip was still used or not.
In Bhandarekhola, water users stopped because the irrigation taps that were feeding the drip system did
not supply sufficient water and because the pipes in the distribution system were damaged by the road
construction. All households, except one located upstream, therefore stopped using the irrigation
component of the MUS and as a result stopped using drip as well. In Lumle, households stopped
because the pipes became too old or because it required too much time/labor. Filling of the drum of the
drip kits was perceived as laborious and strenuous. In other systems visited, the reasons for
abandonment included: pipes damaged, lack of time/labor or drip system became dysfunctional.
In these early systems reviewed, iDE was not developing input/equipment supply at the community
level. As a result, many farmers used drip systems until they wore out and then didn't have easy access
to buy new systems. In more recent projects, iDE has developed a supply chain for drip to the MUS
sites.

59
IX. Conclusion and recommendations
Are multiple-use systems more resilient and sustainable than single-use systems?
According to our findings, MUS are more resilient than single-use water supply systems in the context
of Nepal: 87.5% of the MUS surveyed are still fully functional or need minor repair versus 56.8% of
the single-use domestic supply systems surveyed in the NIMP and DWSS study. One should
acknowledge that the sample size is very different and the higher resilience of MUS might also partly
result from the selection process of the project beneficiaries. However, the MUS surveyed did show a
high level of resilience in a context where MUS does not have yet its institutional niche and where it
might be therefore more difficult for MUS water users to leverage external funds for repair,
maintenance and upgrade. For the systems surveyed, the payback period is less than a year (8 months
and a half) and the cost benefit ratio of 11 (excluding non-monetary benefits reported by water users
such as enhanced nutrition and improved health, better sanitation and time saved).
Factors affecting the resilience and sustainability of MUS
The major factor threatening the resilience and sustainability of the MUS surveyed is the security of
the water resource, with most of the systems facing decrease in water flow. Many communities in the
western hills of Nepal have reported that springs and sources have been drying up for the past years, as
a result of climatic change or due to other factors such as land use change and road construction.
Although we could not systematically assess in this study the reasons for the decrease in water flow,
water users reported that the installation of a pipe system has led them to increase their use of water for
both domestic and productive uses. Furthermore, this study suggests that, rather than the source alone,
it is the interaction of the source with other variables, namely the characteristics of the infrastructure
and of the water users, that ultimately determine the overall system resilience and sustainability.
Although the economic returns generated by MUS contribute to water users’ efforts to protect the
source and their financial capacity to maintain the system, they can also threaten the systems’
sustainability if distributed unequally and unfairly as illustrated in the case of Bhandarekhola.
1. Sustainability of MUS
Rethinking interventions: the concepts of sustainability and justice
Designing interventions in terms of multiple uses allows to identify and acknowledge potential trade-
offs between different types of uses and users. However it does not provide a normative approach to
inform decisions on how to better address these trade-offs. We recommend to explicitly identify and
acknowledge power differences between water users in water projects (single or multiple uses). This
entails recognising that all users have multiple water needs but hold different capabilities to negotiate
water distribution and access during the project intervention and to shape institutions after the
construction. Whereas sustainability offers a useful framework in term of long-term goals, the concept
of justice allows guiding decisions related to the design and implementation processes of water and
development interventions (Clement et al., 2015) through three lenses: distributive justice , i.e. the
distribution of ‘goods’ and ‘bads’ resulting from the interventions; procedural justice, i.e. the extent to
and perceived fairness in how ‘beneficiaries’ are represented in and can influence decision-making
processes; and recognition, which acknowledges the diversity of needs and values within a community,
according to lines of social differentiation such as gender, ethnicity, age and class.
Integrating the concept of sustainability and justice as key guiding principles for MUS and
water/food security projects could help to design, implement, monitor and evaluate projects in a
way which goes beyond tokenistic and naïve approaches to participation and inclusion.

60
Participatory planning: a pre-requisite for new MUS
Current interventions rely on a rapid appraisal of existing water sources and estimation of current and
future water uses within the community. Although community level meetings were conducted, public
meetings might not be suited to identify existing tensions and conflicts over water use. Furthermore,
sustainability will be increased if the planning stage allows assessing the needs and claims of
neighboring communities, as these might affect the water flow available to the beneficiaries in the
short and ling terms.
Two components, which have not yet been included in the planning and design process, form a critical element to inform MUS design: 1) an assessment of the level of social capital (trust,
reciprocity) and of inter-household equity in water distribution and use – a social survey which
would complement the engineering survey;
We acknowledge that trust and reciprocity are not necessarily easy to measure and we recommend to
use proxy indicators such as the existence of robust institutions to manage the current water system or
other resources (e.g. forest) or evidence of open conflicts.
2) an assessment of the current and future needs, sources and water uses of neighboring
communities; a planning approach that goes beyond the community targeted for the intervention
to be added in the engineering survey.
Fruitful synergies could be developed between MUS and the planning approach developed by Helvetas
in Nepal called the Water User Master Plan (WUMP). Such planning process could help anticipate
potential conflicts among communities and decrease in the water flow that feeds the MUS. Such a
participatory consultative process could also help to identify existing inequities, conflicts and tensions.
Lastly, the produced document (plan) could support the community in seeking for additional funds
from local government bodies and NGOs to maintain and upgrade their MUS once the project is over.
Such a process is however likely to be resource consuming and a balance needs to be found between
resources available and the level of community participation.
Technology/infrastructure design versus strong institutiona
Although both a well-designed infrastructure and strong institutions are desirable for the sustainability
of MUS, MUS and water /food security projects might have to prioritize where to target their
investment. We recommend a case-by-case approach which is adapted to the characteristics of the
social-ecological system, based on the social survey recommended in the previous point.
When the system selected is characterized by both a lack of reliability of the
source/insufficient water flow to meet everyone’s basic needs and a lack of trust and cohesion
among the water users, the ability of users to design robust and equitable institutions for water
provision and appropriation is likely to be low. We therefore recommend to invest in available
technologies and design so that the infrastructure can address/minimize potential inequities in
water distribution as much as possible. If technological options do not allow to address/minimize
inequities to a level acceptable to the most disadvantaged water users, we recommend not to
intervene in this system with a MUS as the intervention is likely to reinforce existing inequities in
water access and increase social conflicts. Alternative interventions in such contexts could focus on
building the capabilities of the most marginalized and building up the community’s social capital.
In other situations, the project field staff could focus on supporting the community to design
robust institutions. It is advisable to let water users come up with their own norms and rules, but
interventions could support them in this process, e.g. through a follow-up over a period of a year of
their institutions, by organizing farmer-to-farmer training for farmers to learn about different types of

61
rules and practices, by supporting women who desire to take leadership roles to build their capacity
and by helping farmers to strengthen social ties and build social capital (Ostrom et al., 2011).
Drip irrigation and MUS
In the SIMI project, only the households who accepted to invest in a drip irrigation kit could become
member of the MUS user group. The study shows however that not every farmer feels that drip
irrigation is suited to their human and biophysical assets (labour available in the household, type and
size of land, type of vegetables grown, level of water security). Furthermore, recent studies on drip
show that the conditions for efficiency gains need to be considered in different contexts and at different
scales (van der Kooij et al., 2013, Belder et al., 2007). Therefore, theoretical claims on the linkages
between drip irrigation and water efficiency, water savings and poverty alleviation need to be
examined and relocated within farmers’ actual practices (Venot et al., 2014).
We recommend to conduct a detailed study to explore the reasons of farmers’ abandonment
of drip irrigation, the conditions for gains in water efficiency at different scales and the context
in which drip irrigation is suited.
2. Vegetable production and commercialization
This section builds on the two studies led in the MPCs and on the questions on vegetable
commercialization that were included in the MUS second phase of the study.
Farmers’ profile
Men and women farmers are equally involved in offseason vegetable selling in the two districts as well
as in the executive committees of the MPCs surveyed. The proportion of men and women highly varies
geographically as shown in the difference between Syangja and Kaski cooperative and collection
center. The average income per male and female farmer is comparable in Kaski collection center but
25% higher for men in Syangja cooperative.
The farmers members of the executive committee of the MPC and farmers selling at the
cooperative/collection center in Syangja and Kaski are predominantly Brahmin/Chettri. However, in
the two centers surveyed in Syangja and Kaski, the average income per farmer from other ethnic
groups is equal or even higher. For a large majority of farmers, amounts sold were less than 50kg in
the month for which data were collected, but it was during vegetable off-season.
Interviews for the MPC second phase indicates that farmers selling at the collection center /
cooperative are those whose income proportion from vegetable selling is higher, with fewer of them
being engaged or having a household member engaged in non-farm activities. In the MUS second
phase, the respondents from Bandarekhola, in Kaski District, who are selling regularly at the collection
center are also farmers producing large amounts of vegetables. However, the center also offers useful
services to small producers when the latter are not able to sell their vegetables to traders.
Sustainability of MPCs and collection centers
Four out of seven of the MPCs visited were still functioning, but only one of them, in Syangja, offers
services to farmers other than the collection center facility. The reasons for the collection centers/MPC
to stop functioning are diverse, ranging from greater ability of farmers to sell directly to traders to lack
of financial viability. For the centers functioning, the main challenge is to sustain services to farmers
through voluntary work.
From our study, we identified two factors that might compromise the sustainability of collection
centers: 1) a lack of capacity of the MPC to propose other services such as provision of inputs,

62
transportation facilities, regular technical support and trainings; and 2) a lack of competitiveness of the
center for buying prices compared to individual traders. Despite these constraints, it is worth noticing
that the centers still provide useful services to farmers by buying any quantity of vegetables.
Collection centers offer a useful support to farmers who have small productions and lack
connections with traders. However to ensure their sustainability, development projects need to
develop ‘business models’ for the centers to enlarge their services and offer competitive prices to
farmers.
Vegetable production and commercialization: current constraints and ways forward
Farmer respondents from Syangja reported that the establishment of the cooperative has encouraged
some farmers in their communities to start vegetable production. However, traders indicated that as a
whole a high vegetable demand has not resulted in increased production in the district. The constraints
for vegetable production are mostly: availability of suitable land, access to irrigation facilities and lack
of technical support and of labor availability due to high rates of male out-migration. It is therefore
important to act on these factors simultaneously in order to support vegetable production. Although a
lot of land has become fallow because of farmers’ long term migration to overseas, it is not necessarily
accessible or meeting the criteria for vegetable cultivation (close to home).
An option to explore to support vegetable production in areas where homestead land is
scarce could be to create groups of vegetable producers and explore how available and suitable
fallow land can be pooled together and managed jointly.
The provision of technical support by the MPC to its members depends on farmers’ willingness to pay
for and the financial viability of such services, as MPC members currently work voluntarily and most
MPCs have not been able to hire even part-time staff.
From a marketing perspective, many of the farmers interviewed during the MPC and MUS second
phase of fieldwork highlighted the need to develop specific marketing channels for organic vegetables
so that the latter can be sold at higher prices than vegetables grown conventionally. Syangja
cooperative buys only organic vegetables, but it has not translated into higher prices.
Lastly, MPCs could consider additional support to farmers for marketing their products like
transportation facilities – although the question of financial viability and how much farmers are willing
to pay for these also needs to be considered.
Both MUS and MPC would benefit from a higher level of institutionalisation and recognition from
local government and state line agencies. The latter could support the development of synergies e.g.
between the District Agriculture Development Office (DADO) and MPCs for public service delivery
and the sustainability of MPCs and MUS through technical and financial support.
It is important for food security and water projects to establish formal linkages with local
government agencies at the time of the intervention, e.g. through registration of farmer groups,
MPC and of the source/water user groups. Organizing farmers into groups and building their
capacity to articulate their claims and advocate their needs would help to sustain farmers’
capacity to secure the support they need once the project is over.

63
Acknowledgements
The authors would like to deeply and warmly thank the iDE team in Nepal, and particularly Luke
Colavito, Raj Kumar GC, Komal Pradhan and Shailendra Shrestha in Kathmandu office and Ananda
Dahal, Bal Krishna Thapa and Rudra Bahadur Thapa in Pokhara and in Palpa District. They
contributed invaluable technical and organizational support, constructive feedback and a good dose of
friendliness.
The fieldwork was possible thanks to the invaluable support of Ramesh Tamang and of Shiva Bandhari
and Sahi Bhandari for field assistance and translation.
Our acknowledgements go as well to all the farmers who spent some of their time to provide us the
core of the data used in this study.
Last but not least, this study has greatly benefited from insightful exchanges with Barbara van Koppen,
Prachanda Pradhan and Bob Yoder who provided useful material and comments to guide the design of
the study. The drafting of the recommendations was informed by stimulating interaction with iDE
staff, representatives from government agencies, funding agencies, the civil society and researchers
who attended a presentation of the research findings on 6th February 2015 at iDE Nepal office,
Kathmandu.

64
References
Agrawal, A. and Goyal, S. (2001) 'Group Size and Collective Action', Comparative Political Studies,
34, (1), pp. 63-93.
Anderies, J. M., Folke, C., Walker, B. and Ostrom, E. (2013) 'Aligning Key Concepts for Global Change
Policy: Robustness, Resilience and Sustainability', Ecology and Society, 18, (2), pp. 8.
Anderies, J. M., Janssen, M. A. and Ostrom, E. (2004) 'A Framework to Analyze the Robustness of
Social-Ecological Systems From an Institutional Perspective', Ecology and Society, 9, (1), pp.
18.
Belder, P., Rohrbach, D., Twomlow, S. and Senzanje, A. (2007) Can drip irrigation improve the
livelihoods of smallholders? Lessons learned from Zimbabwe. Bulawayo, Zimbabwe:
International Crops Research Institute for the Semi-Arid Tropics (ICRISAT)
Cifdaloz, O., Regmi, A., Anderies, J. M. and Rodriguez, A. A. (2010) 'Robustness, vulnerability, and
adaptive capacity in small-scale social-ecological systems: The Pumpa Irrigation System in
Nepal', Ecology and Society, 15, (3), pp. 39.
Clement, F., Basnet, G., Sugden, F. and Bharati, L. (2015) 'Social and Environmental Justice in Foreign
Aid: A case study of irrigation interventions in Western Nepal', New Angle: Nepal journal of
social science and public policy, in press.
Cox, M., Arnold, G. and Villamayor Tomás, S. (2010) 'A review of design principles for community-
based natural resource management', Ecology and Society, 15, (4), pp. 38.
de Boer, J. (2007) Study on Costs and Benefits of Multiple Use Water Services in Nepal.
Eco-Tech Consult. (2004) Nepal Smallholder Market Initiative (NEPAL-SIMI). Lalitpur:
Gibson, R. B. (2006) 'Sustainability Assessment: Basic components of a practical approach', Impact
Assessment and Project Appraisal, 24, (3), pp. 170-182.
Government of Nepal. (2012) Multiuse Water System (MUS) : An Assessment. Kathmandu:
IFAD. (2011) Nepal. Western Uplands Poverty Alleviation Project (WUPAP) Loan: 576-NP Grant:
DSF-8010NP. Joint Review Mission: 1st – 19th December, 2011. Aide-Mémoire. IFAD, pp:
Lam, W. F. (1998) Governing Irrigation Systems in Nepal. Institutions, infrastructure, and collective
action. Oakland, CA: ICS Press.
Leach, M., Scoones, I. and Stirling, A. (2010) Dynamic sustainabilities: technology, environment, social
justice. London, UK: Earthscan.
Meinzen-Dick, R. (2007) 'Beyond Panaceas in Water Institutions', Proceedings of the National Academy
of Science in the United States of America, 104, pp. 15200–15205.
Meinzen-Dick, R., Raju, K. V. and Gulati, A. (2002) 'What Affects Organization and Collective Action
for Managing Resources? Evidence from Canal Irrigation Systems in India', World
Development, 30, (4), pp. 649-666.
Mikhail, M. and Yoder, R. (2008) Multiple Use Water Service Implementation in Nepal and India.
Experience and lessons for scale up. International Development Enterprises (IDE), the
Challenge Program on Water and Food (CPWF) and the International Water Management
Institute (IWMI)
Moriarty, P., Butterworth, J., Van Koppen, B. and Soussan, J. (2004) 'Water, poverty and productive
uses of water at the household level', in Moriarty, P., Butterworth, J. and Van Koppen, B.(eds)
Beyond Domestic, Case studies on poverty and productive uses of water at the household level.
Vol. Technical Paper Series 41 Delft, the Netherlands: IRC International Water and Sanitation
Centre.
Nagendra, H. (2007) 'Drivers of Reforestation in Human-dominated Forests', Proceedings of the
National Academy of Science in the United States of America, 104, (39), pp. 15218–15223.
National Management Information Project (NMIP) and Department of Water Supply and Sewerage
(DWSS). (2011) Nationwide Coverage and Functionality Status of Water Supply and Sanitation
in Nepal. Final report. Kathmandu:
North, D. C. (1990) Institutions, Institutional Change and Economic Performance. Cambridge:
Cambridge University Press.
Ostrom, E. (1990) Governing the Commons. The evolution of institutions for collective action.
Cambridge: Cambridge University Press.
Ostrom, E. (2005) Understanding Institutional Diversity. Princeton, NJ: Princeton University Press.

65
Ostrom, E., Lam, W. F., Pradhan, P. and Shivakoti, G. (2011) Improving Irrigation in Asia: Sustainable
Performance of an Innovative Intervention in Nepal. Cheltenham: Edward Elgar Publishing.
Pant, D., Gautam, K. R. and Shakya, S. D. (2005) Assessment of Multiple Use Schemes (mus)
Implemented under Smallholder Irrigation Market Initiative (SIMI). Unpublished Report. IWMI
Sama Bikas Abhiyan, pp:
Rautanen, S. L. and G.C., R. K. (2012) Multiple-use water services (MUS) – Nepal country paper. pp:
Rautanen, S. L., Van Koppen, B. and Wagle, N. (2014) 'Community-driven multiple use water services:
Lessons learned by the rural village water resources management project in Nepal', Water
Alternatives, 7, (1), pp. 160-177.
Redman, C. L. (2014) 'Should Sustainability and Resilience be Combined or Remain Distinct Pursuits?'
Ecology and Society, 19, (2), pp. 37.
Renwick, M., Joshi, D., Huang, M., Kong, S., Petrova, S., Bennett, G. and Bingham, R. (2007) Multiple-
use water services for the poor: Assessing the state knowledge. . Arlington, VA: Winrock
International
Smits, S., Renwick, M., Renault, D., Butterworth, J. and van Koppen, B. (2008) 'From practice to policy:
background paper for the symposium on multiple-use services', International Symposium on
Multiple-use water services. Addis Ababa, Ethiopia, 4-6 November 2008. From practice to
policy: background paper for the symposium on multiple-use services: MUSGroup, pp.
Tang, S. Y. (1992) Institutions and Collective Action: Self Governance in Irrigation. San Francisco: ISC
press.
Tucker, J., Faal, J. and Nicol, A. (2009) Multiple-use Water Services (MUS): Cost-effective water
investments to reduce poverty and address all the MDGs.
Turner, B. (1994) 'Small-scale Irrigation in Developing Countries ', Land Use Policy, 11, (4), pp. 251-
261.
van der Kooij, S., Zwarteveen, M., Boesveld, H. and Kuper, M. (2013) 'The Efficiency of Drip Irrigation
Unpacked', Agricultural Water Management, 123, pp. 103-110.
Van Koppen, B., Moriarty, P. and Boelee, E. (2006) Multiple-Use Water Services to Advance the
Millennium Development Goals. Colombo, Sri Lanka: International Water Management
Institute (IWMI)
van Koppen, B., Smits, S., Moriarty, P., Penning de Vries, F., Mikhail, M. and Boelee, E. (2009)
Climbing the water ladder: Multiple-use water services for poverty reduction. The Hague, the
Netherlands:
Venot, J.-P. and Clement, F. (2013) 'Justice in Development? An analysis of water interventions in the
rural South', Natural Resources Forum, 37, pp. 19-30.
Venot, J.-P., Zwarteveen, M., Kuper, M., Boesveld, H., Bossenbroek, L., Kooij, S. V. D., Wanvoeke, J.,
Benouniche, M., Errahj, M., Fraiture, C. D. and Verma, S. (2014) 'Beyond the Promises of
Technology: A review of the discourses and actors who make drip irrigation', Irrigation and
Drainage, 63, (2), pp. 186-194.
Vincent, L. (1994) 'Lost Chances and New Futures. Interventions and institutions in small-scale
irrigation', Land Use Policy, 11, (4), pp. 309-322.
Wade, R. (1988) Village Republics. Economic Conditions for Collective Action in South India. Oakland:
ICS Press.
WHO and IRC International Water and Sanitation Centre. (2000) Management of Operation and
Maintenance of Rural Water and Sanitation Programmes– A Training Package for Managers
and Planners. Geneva: WHO
Winrock International. (2009) Nepal SIMI Project Completion Report. Kathmandu: Winrock
International
Yami, M., Vogl, C. and Hauser, M. (2009) 'Comparing the Effectiveness of Informal and Formal
Institutions in Sustainable Common Pool Resources Management in Sub-Saharan Africa',
Conservation and Society, 7, (3), pp. 153-64.
Zwarteveen, M. Z. and Neupane, N. (1996) Free-Riders or Victims: Women’s nonparticipation in
irrigation management in Nepal’s Chhattis Mauja irrigation scheme. Colombo: International
Irrigation Management Institute