sustainability and financial performance of acute hospital ... · sustainability and financial...
TRANSCRIPT

Reportby the Comptroller and Auditor General
Department of Health
Sustainability and financial performance of acute hospital trusts
HC 611 SESSION 2015-16 16 DECEMBER 2015

Our vision is to help the nation spend wisely.
Our public audit perspective helps Parliament hold government to account and improve public services.
The National Audit Office scrutinises public spending for Parliament and is independent of government. The Comptroller and Auditor General (C&AG), Sir Amyas Morse KCB, is an Officer of the House of Commons and leads the NAO, which employs some 810 people. The C&AG certifies the accounts of all government departments and many other public sector bodies. He has statutory authority to examine and report to Parliament on whether departments and the bodies they fund have used their resources efficiently, effectively, and with economy. Our studies evaluate the value for money of public spending, nationally and locally. Our recommendations and reports on good practice help government improve public services, and our work led to audited savings of £1.15 billion in 2014.

Report by the Comptroller and Auditor General
Ordered by the House of Commons to be printed on 15 December 2015
This report has been prepared under Section 6 of the National Audit Act 1983 for presentation to the House of Commons in accordance with Section 9 of the Act
Sir Amyas Morse KCB Comptroller and Auditor General National Audit Office
11 December 2015
HC 611 | £10.00
Department of Health
Sustainability and financial performance of acute hospital trusts

This report examines the sustainability and financial performance of NHS trusts and NHS foundation trusts, particularly those providing acute healthcare services.
© National Audit Office 2015
The material featured in this document is subject to National Audit Office (NAO) copyright. The material may be copied or reproduced for non-commercial purposes only, namely reproduction for research, private study or for limited internal circulation within an organisation for the purpose of review.
Copying for non-commercial purposes is subject to the material being accompanied by a sufficient acknowledgement, reproduced accurately, and not being used in a misleading context. To reproduce NAO copyright material for any other use, you must contact [email protected]. Please tell us who you are, the organisation you represent (if any) and how and why you wish to use our material. Please include your full contact details: name, address, telephone number and email.
Please note that the material featured in this document may not be reproduced for commercial gain without the NAO’s express and direct permission and that the NAO reserves its right to pursue copyright infringement proceedings against individuals or companies who reproduce material for commercial gain without our permission.
Links to external websites were valid at the time of publication of this report. The National Audit Office is not responsible for the future validity of the links.
10856 12/15 NAO

The National Audit Office study team consisted of: Rosie Buckley, Gethin Davies-Knapp, Jemma Dunne, Stuart Galloway, Elizabeth Hogarth, Emily Hopkinson, Thomas Jordan, Amisha Patel and Philip Wherry, under the direction of Robert White.
This report can be found on the National Audit Office website at www.nao.org.uk
For further information about the National Audit Office please contact:
National Audit Office Press Office 157–197 Buckingham Palace Road Victoria London SW1W 9SP
Tel: 020 7798 7400
Enquiries: www.nao.org.uk/contact-us
Website: www.nao.org.uk
Twitter: @NAOorguk
Contents
Key facts 4
Summary 5
Part OneFinancial performance in the NHS 15
Part TwoFactors influencing the financial position of acute trusts 28
Part ThreeManaging financial distress and planning for long-term sustainability 38
Appendix OneOur audit approach 50
Appendix TwoOur evidence base 52
Appendix ThreeTechnical notes 54

4 Key facts Sustainability and financial performance of acute hospital trusts
Key facts
-£471mnet defi cit of NHS bodies (NHS England, clinical commissioning groups, NHS trusts and NHS foundation trusts) overall in 2014-15
-£843mnet defi cit of NHS trusts and NHS foundation trusts in 2014-15
61%of acute trusts (94 out of 155) reported a defi cit at the end of 2014-15
115 out of 240 (48%) NHS trusts and NHS foundation trusts in defi cit in 2014-15
-£958 million net defi cit of acute trusts in 2014-15 (those NHS trusts and NHS foundation trusts that provide acute healthcare services)
26 acute trusts in 2014-15 with defi cits that made up more than 5% of their income
83% of planned effi ciencies were achieved by acute trusts in 2014-15
£1.8 billion additional funding given to NHS trusts and NHS foundation trusts in fi nancial diffi culty as a cash injection, loan or other fi nancial support in 2014-15
181 out of 239 (76%) NHS trusts and NHS foundation trusts reporting defi cits in the fi rst 6 months of 2015-16

Sustainability and financial performance of acute hospital trusts Summary 5
Summary
1 In 2014-15, the Department of Health (the Department) allocated £98 billion of its £111 billion budget to its largest arm’s-length body, NHS England, to plan and pay for NHS services. The 211 clinical commissioning groups spent the greatest share of this, largely buying healthcare from 90 NHS trusts and 150 NHS foundation trusts. The Department spent the remainder of its £111 billion budget on the work of its other arm’s-length bodies, special health authorities, funding for public health, and its own functions.
2 There has been significant change in the NHS since the introduction of the Health and Social Care Act 2012. These changes have come at a time of increased financial pressures in government arising from austerity. Health is an area of public spending that the government has protected in recent years compared with most other areas of government spending. However, finances have become increasingly tight with health funding rising at a historically low rate of 1.8% in real terms between 2010-11 and 2014-15. The Department is ultimately responsible for securing value for money for this funding. In 2014-15, it came close to exceeding its £111 billion revenue expenditure budget authorised by Parliament, underspending by just £1.2 million or 0.001%.
3 The NHS Five Year Forward View, published in October 2014, set out proposed changes to the provision of healthcare services. NHS England expects that the NHS will need to continue to adapt in response to increasing patient demand, new treatments and technologies and funding constraints. The Five Year Forward View estimated there will be a £30 billion gap between resources and patient needs by 2020-21. It estimated that if the NHS had £8 billion more funding, the gap between resources and patient needs would be £22 billion by 2020-21. In November 2015, the government committed to increasing funding for the NHS by £8.4 billion by 2020, with £3.8 billion of this given to the NHS in 2016-17.
Our report
4 NHS trusts and NHS foundation trusts achieve financial sustainability when they are able to successfully manage activity, quality and financial pressures within the income they receive. In recent years, the growth in spending by NHS trusts and NHS foundation trusts has outpaced growth in their income (Figure 1 overleaf). This indicates that trusts are increasingly unable to keep their spending within budget.

6 Summary Sustainability and financial performance of acute hospital trusts
5 We have reported three times on financial sustainability in the NHS, most recently in November 2014.1 The subsequent Committee of Public Accounts report, published in February 2015, concluded that the financial health of NHS bodies had worsened in the previous two financial years. The Committee was concerned that the savings required across the NHS will be difficult to achieve solely by continuing with the same approach used in recent years.
1 Comptroller and Auditor General, The financial sustainability of NHS bodies, Session 2014-15, HC 722, National Audit Office, November 2014. Available at: www.nao.org.uk/report/financial-sustainability-nhs-bodies-2/
0
1
2
3
4
5
6
7
8
2011-12 2012-13 2013-14 2014-15
Figure 1Cumulative increase in NHS trusts’ and NHS foundation trusts’ income and spending since 2011-12
Percentage
Trusts’ total spending
Trusts’ total income
Notes
1 NHS trusts’ and NHS foundation trusts’ spending and income figures are adjusted to remove the effects of impairments, transfers of functions from, or, to other health bodies, and charitable funds.
2 Figures are adjusted for inflation using the GDP deflator, as used by HM Treasury in setting departments’ budgets.
Source: National Audit Office analysis of Department of Health annual accounts, NHS Trust Development Authority and Monitor data
Sustainability and financial performance of acute hospital trusts Summary 7
6 In this fourth report on financial sustainability in the NHS:
• We report the summarised financial position of NHS England, clinical commissioning groups, and the NHS trusts and NHS foundation trusts providing ambulance, acute, community, mental health and learning disability services. We take a closer look at the two-thirds of NHS trusts and NHS foundation trusts that are acute trusts providing acute healthcare services such as accident and emergency (A&E) services, inpatient and outpatient, and in some cases specialist, and, or, community care (Part One).
• We examine the factors affecting the financial sustainability of acute trusts (Part Two). Acute trusts received 78% of NHS trusts’ and NHS foundation trusts’ income in 2014-15. Due to its size, understanding the financial position of the acute trust sector is important for assessing risks to overall NHS financial sustainability.
• We consider the approaches taken by the Department, NHS England, Monitor and the NHS Trust Development Authority (NHS TDA) to support trusts to achieve financial sustainability (Part Three). In the medium- to long-term, the health service must be financially stable to be able to deliver high quality services for patients.
7 We set out our audit approach in Appendix One and evidence base in Appendix Two. Technical notes explaining how we have used financial data are in Appendix Three, including an explanation of how we have calculated the financial position of NHS trusts and NHS foundation trusts. The report does not look at primary care, social care, public health or similar services.
Key findings
The financial performance of NHS bodies
8 In 2014-15, NHS commissioners, NHS trusts and NHS foundation trusts together overspent for the first time, reporting an overall deficit of £471 million. In 2014-15, the surplus reported by commissioners was not enough to compensate for the deficit reported by NHS trusts and NHS foundation trusts together. The £471 million deficit was made up of:
• NHS England spending £30,808 million of the £30,998 million available for its national functions and centrally commissioned services, achieving an underspend of £190 million;
• clinical commissioning groups together spending £66,852 million of the £67,034 million available for locally commissioned services, achieving an underspend of £182 million; and
• NHS trusts and NHS foundation trusts reporting a combined deficit of £843 million against their total income of £74,539 million (paragraph 1.3 and Figure 7).

8 Summary Sustainability and financial performance of acute hospital trusts
9 The financial position of NHS bodies overall has continued to decline since 2012-13. The £471 million deficit reported by commissioners, NHS trusts and NHS foundation trusts together represents a worsening financial position from the £722 million surplus achieved in 2013-14 and the £2.1 billion surplus in 2012-13 (paragraph 1.3).
Performance of NHS trusts and NHS foundation trusts
10 The deterioration in the financial position of NHS trusts and NHS foundation trusts has been severe and worse than expected. Their £843 million net deficit in 2014-15 reflects a sharp decline from trusts’ £91 million deficit reported in 2013-14, and trusts’ £592 million surplus reported in 2012-13. Trusts’ deficit on 31 March 2015 was significantly greater than the forecast deficit (£512 million) set on 30 June 2014 (paragraphs 1.5 and 1.7, Figure 3).
11 The number of NHS trusts and NHS foundation trusts reporting a deficit rose by 80% between 2013-14 and 2014-15. Overall, 115 trusts were in deficit in 2014-15 compared with 64 in 2013-14 and 25 in 2012-13. The number of trusts with a surplus fell to 125 in 2014-15 from 181 in 2013-14 (paragraph 1.6 and Figure 3).
12 The average earnings before interest, tax, depreciation and amortisation (EBITDA) margin for existing NHS foundation trusts fell below the threshold used by Monitor to assess long-term financial sustainability. It is the government’s intention that all NHS trusts will become NHS foundation trusts that are financially robust. Monitor assesses that an EBITDA margin of 5% or greater demonstrates financial strength. It uses this measure to test whether an NHS trust is ready to be authorised as an NHS foundation trust. At the end of 2014-15, the average EBITDA margin for NHS foundation trusts was 3.7% and 99 NHS foundation trusts (66%) were below the 5% threshold (paragraph 1.11).
13 Monitor and the NHS TDA expect the number of trusts under strain to rise. The net deficit of NHS trusts and NHS foundation trusts together is forecast to rise further in 2015-16, to £2.2 billion by 31 March 2016. The number of trusts forecasting a deficit by the end of 2015-16 is 156. But halfway through the financial year at 30 September 2015, 181 trusts reported deficits. This is a 57% increase on the number of trusts that reported a deficit 6 months earlier on 31 March 2015 (paragraph 1.8).

Sustainability and financial performance of acute hospital trusts Summary 9
Pressures on the financial sustainability of acute trusts
14 Acute trusts are under financial stress, with 6 in 10 reporting a deficit in 2014-15. Acute trusts were more likely to report a deficit in 2014-15 (61%) than ambulance trusts (20%), community trusts (16%) or mental health and learning disability trusts (29%). Acute trusts together reported a net deficit of £958 million (equivalent to 1.6% of their total income). This was 3 times the size of acute trusts’ deficit in 2013-14 (£306 million or 0.5% of total income). A significant number of acute trusts face severe financial difficulties, with 26 reporting deficits that made up more than 5% of their income in 2014-15. Of these 26 acute trusts, 14 had deficits greater than £20 million, and 20 are planning to be in deficit for a third consecutive year in 2015-16 (paragraphs 1.15, 1.16 and 1.19, and Figure 7).
15 Some common features of acute trusts’ income and spending help to explain their performance. Acute trusts’ financial performance is affected by factors within the local area, and a combination of income and spending pressures, and their success in managing these. Our analysis shows:
• The growth in acute trusts’ spending outpaced the growth in their income between 2013-14 and 2014-15, with their total spending increasing by 5% and their income rising by 4% over this period.
• Acute trusts that received a greater share of their income from providing healthcare, including work funded by the national tariff, were more likely to be in deficit than acute trusts with proportionately more non-healthcare income.
• Acute trusts’ spending on non-permanent staff as a share of their total income increased by 24% between 2012-13 and 2014-15. Acute trusts have increasingly incurred the premium costs associated with using non-permanent staff, such as agency staff. Monitor has reported that a rise in spending on agency staff has been exacerbated by the difficulties of recruiting staff into permanent posts and by new requirements for safe staffing levels following the Keogh and Francis reviews.
• Acute trusts with private finance initiatives (PFI) spent an average of £28 million on interest, service and capital payments for their PFI commitments in 2014-15. PFI schemes provide new facilities and can lead to quality improvements. However, high levels of spending on PFI commitments can put at risk the financial sustainability of some trusts. For 11 acute trusts, spending on PFI commitments made up more than 10% of their yearly spending (paragraphs 2.5, 2.7 and 2.14 to 2.15).

10 Summary Sustainability and financial performance of acute hospital trusts
16 Acute trusts made significantly fewer efficiencies in 2014-15 than in 2013-14. They reported efficiencies of £2.2 billion in 2014-15, compared with £2.3 billion in 2013-14. Acute trusts achieved efficiencies by making cost savings and generating new income. Overall, acute trusts achieved 83% of their planned efficiencies in 2014-15. But if all trusts had achieved their planned efficiencies, the deficit for acute trusts together would have more than halved and 75 acute trusts rather than 93 would have ended the year in deficit (paragraphs 2.19 and 2.21).
17 Acute trusts’ have increasingly planned to make efficiencies that are unsustainable. Around 62% of the efficiencies reported by acute trusts in 2014-15 (£1.35 billion) were recurrent (permanent) cost savings. Trusts achieve recurrent savings by, for example, reducing the length of hospital stays. In 2014-15, trusts made £322 million of non-recurrent (one-off) cost savings, up from £317 million in 2013-14. These included savings from measures such as stopping recruitment. Where savings are one-off, the NHS will have to find more savings in future to replace them. Guidance by Monitor and the Audit Commission on delivering sustainable cost improvement programmes advised that trusts’ schemes to generate more income were not sustainable in the long-term. However, trusts’ planned efficiencies through such income generation schemes had risen to £507 million in 2014-15. This was up from £374 million in 2013-14 and £330 million in 2012-13 (paragraphs 2.19 and 2.20).
Managing financial distress
18 NHS trusts and NHS foundation trusts under financial stress continue to rely on cash support from the Department. The Department provides additional funding so that trusts in difficulty have the cash they need to pay creditors and staff and to fund building works considered essential to support patient services. In 2014-15, NHS trusts and NHS foundation trusts received £1.8 billion of additional financial support as a result of being in financial difficulty. More trusts received revenue-based support in 2014-15 than in 2013-14 (30 NHS trusts and 19 NHS foundation trusts, up from 21 and 10 respectively). Fifteen NHS trusts in financial distress received cash support (£176 million in total) that improved their reported financial position. Without this, the deficit for NHS trusts and NHS foundation trusts together would have been £1 billion (paragraphs 3.2 to 3.4).
19 The response by the Department, Monitor and the NHS TDA to cut trusts’ deficits might come too late to improve the 2015-16 financial position. In June 2015, the Department announced limits on some elements of trust spending in response to the worsening financial position of NHS trusts and NHS foundation trusts. However, some of these limits were not enforced by the Department, Monitor and the NHS TDA until halfway through the year. This reduces the scope of the spending limits to improve finances in 2015-16. Furthermore, it is not clear if the ‘stretch targets’ identified by the NHS TDA and Monitor for all NHS trusts and some NHS foundation trusts will reduce trusts’ forecast deficit for 2015-16 as intended (paragraphs 3.6, 3.7, 3.12 and Figure 17).
Sustainability and financial performance of acute hospital trusts Summary 11
20 Despite recent efforts to work together, interventions from the Department and arm’s-length bodies risk creating perceived or actual competing priorities for trusts. Trusts must manage central decisions on funding and spending, alongside maintaining operational standards and meeting guidelines. One area where advice to trusts could have created actual or perceived conflicts between meeting quality and safety standards, and improving finances, is on safe staffing. The Department’s interventions to reduce trusts’ spending on agency nursing staff came at a time when acute trusts were finding they needed to recruit more nurses to meet safe staffing guidelines. It is important that the Department and its arm’s-length bodies work together to provide timely and clear messages to trusts (paragraphs 3.15 to 3.17).
21 The revisions and restatements to trusts’ 2015-16 financial plans undermine effective financial planning. Following a review of NHS trusts and NHS foundation trusts draft plans, Monitor and the NHS TDA intended to review trusts’ final plans in April 2015. But this was delayed after the rejection of the 2015-16 national tariff by providers and subsequent negotiations with NHS England and Monitor. The introduction of stretch targets in July and August by the NHS TDA and Monitor meant that all NHS trusts and 57 NHS foundation trusts had to review their plans and restate their end of year forecast. NHS trusts’ financial plans were resubmitted to the NHS TDA in September 2015, 6 months into the financial year. NHS foundation trusts’ financial plans were still under review by Monitor in October 2015, 7 months into the financial year. This unsettled planning period might make it difficult for NHS trusts, NHS foundation trusts, the NHS TDA, and Monitor to set and agree targets, measure progress and ultimately manage resources effectively (paragraphs 3.8 to 3.12).
Achieving long-term financial sustainability
22 The Department and its arm’s-length bodies are taking steps to learn how trusts could reduce costs but the wider use of this learning is not clear. Monitor has looked at how NHS foundation trusts can find savings from planned healthcare services. In his review of hospital productivity and efficiency, Lord Carter of Coles examined a sample of 22 trusts and estimated that the NHS could save up to £5 billion each year to 2020 by making better use of staff, using medicines more effectively and getting better value from the products it buys. The productivity measures developed in this work are based on trusts’ reference costs from 2014-15. These were the average unit costs to the NHS of providing healthcare. However, there were concerns about the accuracy of the reference cost data in previous years. Concerns remain over the extent to which the cost savings identified apply to all trusts, and how the learning should be used by trusts in their financial planning (paragraph 3.20).
12 Summary Sustainability and financial performance of acute hospital trusts
23 The Department and its arm’s-length bodies agree there will be a £22 billion gap between resources and patient needs by 2020-21 but it is not clear how the NHS will close this gap. NHS England has estimated that demand and efficiency gains of 2%–3% a year are needed to make savings of £22 billion. However, the NHS has achieved a much lower rate of efficiencies in recent years. Expected financial savings from the Five Year Forward View will not help the immediate financial position of trusts, as estimates suggest these will not be realised until nearer the end of the five years. The Department told us that its Finance and Efficiency board is developing a plan that will be informed by funding decisions made by government in November 2015, and will allow the NHS to close the gap between resources and patient needs. But it is not yet clear how and when most of the £22 billion of savings will be made, or the contribution that individual organisations and sectors are expected to make. We would expect the Department and its arm’s-length bodies to develop and implement a coherent plan that shows how the gap between resources and patient needs will be closed by all parts of the NHS. This plan should be aligned with resources and requirements for patient care, and should be communicated so that trusts can plan for financial sustainability (paragraphs 3.19 and 3.21).
24 The redesigned models of healthcare are new and untested, and making savings through these will be challenging. The NHS new models of care aim to breakdown the boundaries between primary, hospital and community care, and integrate services around the needs of the patient. NHS England has made some assumptions about the savings it expects from the new models of care and when these will be realised. But achieving savings through redesigned healthcare is not easy. Acute trusts have fixed costs and, in many cases, large-scale changes requiring investment are needed for them to make savings. This suggests that closing the efficiency gap is ambitious. Furthermore, the Five Year Forward View makes the case for sustained social care services and a radical upgrade in public health and prevention as a way to reduce demand for acute services. But the cut in public health funding could make it even more challenging for local health economies to deliver efficiency improvements (paragraphs 3.22 to 3.27).
Conclusion on value for money
25 We said in our November 2014 report on NHS financial sustainability that the trend of NHS trusts’ and NHS foundation trusts’ declining financial performance was not sustainable.2 At that time, trusts overall, including acute trusts, were in a better financial position. But since then, acute trusts’ financial performance has deteriorated sharply. And their financial position is forecast to worsen. With financial problems endemic, we repeat our view that these trends are not sustainable.
2 See footnote 1.

Sustainability and financial performance of acute hospital trusts Summary 13
26 The Department, NHS England, Monitor and the NHS TDA have responded to trusts’ financial distress with measures to help improve financial performance. But trusts’ financial management has been undermined by a turbulent planning period and the multiple interventions by the Department, Monitor and the NHS TDA that seek to control trusts’ spending. Effective oversight by the Department and its arm’s-length bodies will become harder if the number of trusts in financial distress rises further.
27 Running a deficit seems to be becoming normal practice for acute trusts. And there is a risk that poor financial performance is not taken as seriously as poor healthcare provision. This weakens the effectiveness of market-style mechanisms designed to improve hospital productivity and efficiency. The government’s commitment to increase funding for the NHS could be a significant step towards acute trusts achieving financial balance. But this depends on how the funding is used and the impact of wider changes to healthcare services. The Department, NHS England, Monitor and the NHS TDA need to take a more holistic, coordinated approach to tackling trusts’ persistent financial problems and move beyond quick fixes to cut trusts’ spending. Until there is a clear pathway for trusts to get back to financial stability, we cannot be confident that value for money, defined as financial and service sustainability, will be achieved.
Recommendations
a The Department, NHS England, Monitor and the NHS Trust Development Authority (NHS TDA) should work together to improve the trust planning process and their oversight of financial risk. Unexpected delays in the 2015-16 planning process meant that financial plans were still being reviewed and restated more than halfway into the financial year. As a result, these plans were of limited use in monitoring risk to trusts’ finances.
• Monitor and the NHS TDA should work together to ensure that NHS trusts and NHS foundation trusts have financial plans in place at the start of the financial year.
• NHS trusts, NHS foundation trusts and commissioners should plan finances together to take account of the needs of the local health economy.3
• NHS England, Monitor and the NHS TDA should strengthen processes for testing and aligning the assumptions of commissioners and trusts.
• The Department, NHS England, Monitor and the NHS TDA should improve financial risk management by going beyond one-year planning time frames.
3 A local health economy includes all local NHS organisations such as GP practices, and voluntary and independent sector bodies involved in the commissioning, development and provision of health services for particular population groups.

14 Summary Sustainability and financial performance of acute hospital trusts
b When designing measures to control costs, the Department should consider how these measures will be implemented successfully. The Department has introduced a number of controls on trusts’ spending, but it is unclear how much impact they will have within trusts. The controls need to be introduced at the right time so they can be coordinated with trusts’ financial planning. Monitor and the NHS TDA should share best practice to highlight how interventions may be put into practice.
c The Department, NHS England, Monitor and the NHS TDA should put in place a clear plan for improving financial sustainability. It will take time to achieve savings from changes under the Five Year Forward View. Interventions to reduce trusts’ deficits create a constantly changing environment that could lead to ineffective financial management. The Department and its arm’s-length bodies should help create a period of financial stability to enable trusts and local health economies to make change while maintaining operational standards.
d The Department must move ambitiously and more thoroughly to set out savings goals to secure financial sustainability. In order to close the expected funding gap of £22 billion, it needs the NHS to make efficiency savings to 2020-21. The Department must set out how much it expects acute trusts to contribute towards this goal. It must work with Monitor, the NHS TDA and NHS England to set out clear plans for trusts to achieve this. Monitor and the NHS TDA should look in more detail at the ambition and achievability of trusts’ cost improvement plans.
e Price and tariff setters (NHS England and Monitor) should move faster to ensure that payment systems support change and promote financial sustainability. The different ways in which acute hospital trusts generate income affects their overall financial performance. Payment systems do not always support financial sustainability. This led to an increase in the amount of extra financial support in 2014-15. The Department, NHS England, Monitor and the NHS TDA should develop and share a clear pathway for stability which reduces the need for reactive financial support.

Sustainability and financial performance of acute hospital trusts Part One 15
Part One
Financial performance in the NHS
1.1 In this part of the report we examine the financial position of the NHS overall and the trends in the performance of NHS trusts and NHS foundation trusts. We also take a closer look at the financial position of acute trusts.
NHS funding and spending in 2014-15
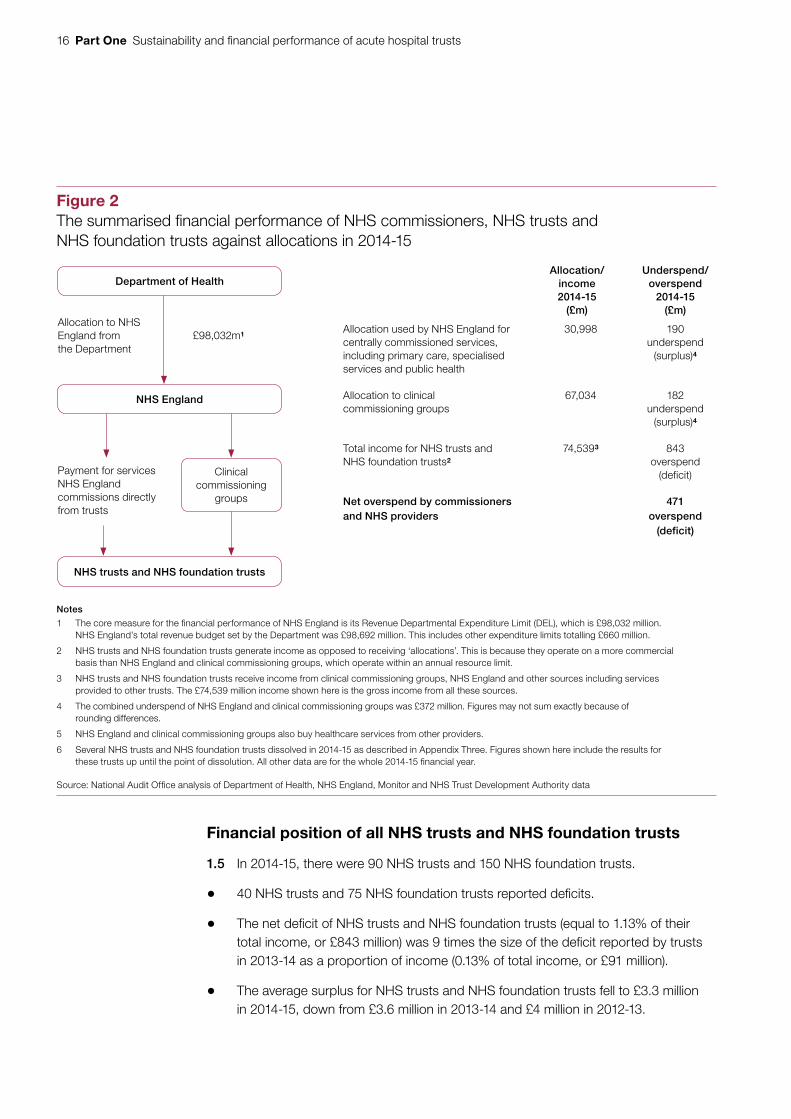
1.2 In 2014-15, the Department of Health (the Department) allocated £98.0 billion to NHS England to commission NHS services (compared with £95.2 billion in 2013-14). NHS England spent a significant proportion of this on primary care and specialised services. The greatest share of the budget was spent by 211 clinical commissioning groups, which largely bought healthcare from 90 NHS trusts and 150 NHS foundation trusts.4 These provide a range of hospital, community and mental health services. Figure 2 overleaf gives a summary of the financial performance of NHS commissioners, NHS trusts and NHS foundation trusts in 2014-15.
1.3 NHS bodies overall ended 2014-15 with a £471 million deficit. This was the first time NHS commissioners and trusts together were in deficit. It is a significant decline from the £722 million surplus achieved in 2013-14 and the £2.1 billion surplus in 2012-13. In 2014-15, the £471 million deficit was made up of:
• NHS England spending £30,808 million of the £30,998 million available for its national functions and centrally commissioned services, achieving an underspend of £190 million;
• clinical commissioning groups together spending £66,852 million of the £67,034 million available for locally commissioned services, achieving an underspend of £182 million; and
• NHS trusts and NHS foundation trusts reporting a combined deficit of £843 million.
1.4 The Department came close to exceeding its £111 billion revenue expenditure budget authorised by Parliament, underspending by just £1.2 million or 0.001%. Resources are tight across the NHS and the Department will struggle to cover any shortfalls should the NHS continue into further financial difficulty.
4 This report refers to 150 NHS foundation trusts in existence on 31 March 2015. This excludes Mid Staffordshire NHS Foundation Trust, which is an unlicensed NHS foundation trust that ceased to provide services on 1 November 2014.
16 Part One Sustainability and financial performance of acute hospital trusts
Financial position of all NHS trusts and NHS foundation trusts
1.5 In 2014-15, there were 90 NHS trusts and 150 NHS foundation trusts.
• 40 NHS trusts and 75 NHS foundation trusts reported deficits.
• The net deficit of NHS trusts and NHS foundation trusts (equal to 1.13% of their total income, or £843 million) was 9 times the size of the deficit reported by trusts in 2013-14 as a proportion of income (0.13% of total income, or £91 million).
• The average surplus for NHS trusts and NHS foundation trusts fell to £3.3 million in 2014-15, down from £3.6 million in 2013-14 and £4 million in 2012-13.
Figure 2The summarised fi nancial performance of NHS commissioners, NHS trusts and NHS foundation trusts against allocations in 2014-15
Department of Health
NHS England
NHS trusts and NHS foundation trusts
Clinical commissioning
groups
Notes
1 The core measure for the fi nancial performance of NHS England is its Revenue Departmental Expenditure Limit (DEL), which is £98,032 million. NHS England’s total revenue budget set by the Department was £98,692 million. This includes other expenditure limits totalling £660 million.
2 NHS trusts and NHS foundation trusts generate income as opposed to receiving ‘allocations’. This is because they operate on a more commercial basis than NHS England and clinical commissioning groups, which operate within an annual resource limit.
3 NHS trusts and NHS foundation trusts receive income from clinical commissioning groups, NHS England and other sources including services provided to other trusts. The £74,539 million income shown here is the gross income from all these sources.
4 The combined underspend of NHS England and clinical commissioning groups was £372 million. Figures may not sum exactly because of rounding differences.
5 NHS England and clinical commissioning groups also buy healthcare services from other providers.
6 Several NHS trusts and NHS foundation trusts dissolved in 2014-15 as described in Appendix Three. Figures shown here include the results for these trusts up until the point of dissolution. All other data are for the whole 2014-15 fi nancial year.
Source: National Audit Offi ce analysis of Department of Health, NHS England, Monitor and NHS Trust Development Authority data
£98,032m1
Allocation to NHS England from the Department
Payment for services NHS England commissions directly from trusts
Allocation/income2014-15
(£m)
Underspend/overspend
2014-15 (£m)
Allocation used by NHS England for centrally commissioned services, including primary care, specialised services and public health
30,998 190 underspend
(surplus)4
Allocation to clinical commissioning groups
67,034 182 underspend
(surplus)4
Total income for NHS trusts and NHS foundation trusts2
74,5393 843 overspend
(deficit)
Net overspend by commissioners and NHS providers
471 overspend
(deficit)
Sustainability and financial performance of acute hospital trusts Part One 17
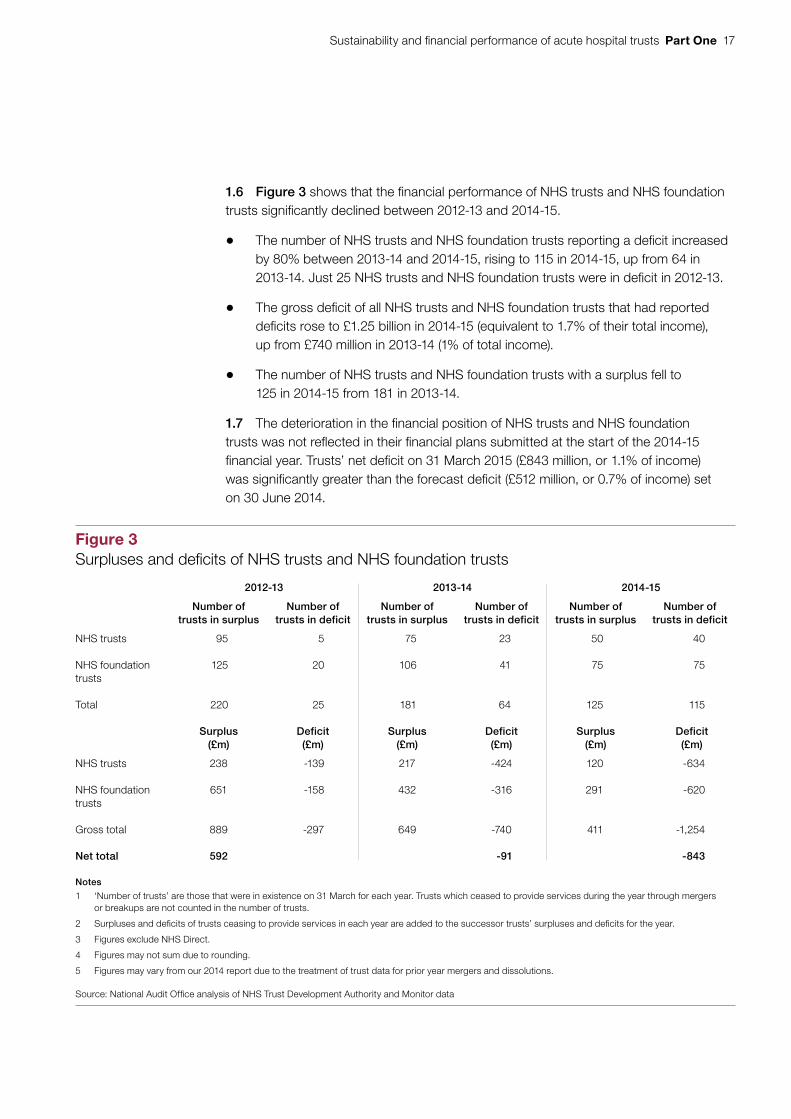
1.6 Figure 3 shows that the financial performance of NHS trusts and NHS foundation trusts significantly declined between 2012-13 and 2014-15.
• The number of NHS trusts and NHS foundation trusts reporting a deficit increased by 80% between 2013-14 and 2014-15, rising to 115 in 2014-15, up from 64 in 2013-14. Just 25 NHS trusts and NHS foundation trusts were in deficit in 2012-13.
• The gross deficit of all NHS trusts and NHS foundation trusts that had reported deficits rose to £1.25 billion in 2014-15 (equivalent to 1.7% of their total income), up from £740 million in 2013-14 (1% of total income).
• The number of NHS trusts and NHS foundation trusts with a surplus fell to 125 in 2014-15 from 181 in 2013-14.
1.7 The deterioration in the financial position of NHS trusts and NHS foundation trusts was not reflected in their financial plans submitted at the start of the 2014-15 financial year. Trusts’ net deficit on 31 March 2015 (£843 million, or 1.1% of income) was significantly greater than the forecast deficit (£512 million, or 0.7% of income) set on 30 June 2014.
Figure 3Surpluses and defi cits of NHS trusts and NHS foundation trusts
2012-13 2013-14 2014-15
Number of trusts in surplus
Number of trusts in deficit
Number of trusts in surplus
Number of trusts in deficit
Number of trusts in surplus
Number of trusts in deficit
NHS trusts 95 5 75 23 50 40
NHS foundation trusts
125 20 106 41 75 75
Total 220 25 181 64 125 115
Surplus(£m)
Deficit(£m)
Surplus(£m)
Deficit(£m)
Surplus(£m)
Deficit(£m)
NHS trusts 238 -139 217 -424 120 -634
NHS foundation trusts
651 -158 432 -316 291 -620
Gross total 889 -297 649 -740 411 -1,254
Net total 592 -91 -843
Notes
1 ‘Number of trusts’ are those that were in existence on 31 March for each year. Trusts which ceased to provide services during the year through mergers or breakups are not counted in the number of trusts.
2 Surpluses and defi cits of trusts ceasing to provide services in each year are added to the successor trusts’ surpluses and defi cits for the year.
3 Figures exclude NHS Direct.
4 Figures may not sum due to rounding.
5 Figures may vary from our 2014 report due to the treatment of trust data for prior year mergers and dissolutions.
Source: National Audit Offi ce analysis of NHS Trust Development Authority and Monitor data

18 Part One Sustainability and financial performance of acute hospital trusts
1.8 Figure 4 shows that, until 2013-14, NHS trusts and NHS foundation trusts together had achieved a surplus. The financial performance of NHS trusts and NHS foundation trusts is expected to worsen in 2015-16, with trusts forecasting a net deficit of £2.2 billion by 31 March 2016. The number of trusts forecasting a deficit by the end of 2015-16 is 156. However, halfway through the financial year on 30 September 2015, 181 trusts out of 239 reported a deficit. This is a 57% rise on the number of NHS trusts and NHS foundation trusts that reported a deficit 6 months earlier on 31 March 2015.
Figure 4Surplus/deficit of NHS trusts and NHS foundation trusts, 2010-11 to 2014-15, and forecast for 2015-16
Net surplus/deficit for the sector (£m)
There was a significant decline in the financial position of NHS trusts and NHS foundation trusts in 2014-15 and the forecast suggests the size of the deficit will grow
Note
1 The 2015-16 forecast figures are taken from: Monitor and NHS Trust Development Authority (NHS TDA) Quarterly report on the performance of the NHS foundation trusts and NHS trusts: 6 months ended 30 September 2015, November 2015.
Source: National Audit Office analysis of trusts’ financial data, and 2015-16 forecast data from Monitor and the NHS Trust Development Authority
Actual
Forecast
-2,500
-2,000
-1,500
-1,000
-500
0
500
1,000
2010-11 2011-12 2012-13 2013-14 2014-15 2015-16 (forecast)
-91
513 483592
-843
-2,201
Sustainability and financial performance of acute hospital trusts Part One 19
Underlying financial sustainability of NHS trusts and NHS foundation trusts
1.9 It is the government’s intention that all NHS trusts will become well-managed, financially robust NHS foundation trusts that deliver high-quality and safe services. NHS foundation trusts have more financial freedom and a short-term deficit is not necessarily evidence of financial weakness. However, the financial performance of NHS foundation trusts has significantly declined, raising concerns about their financial sustainability.
• The proportion of NHS foundation trusts in deficit almost doubled in 2014-15, rising to 50% of NHS foundation trusts in deficit (75 of 150 in 2014-15), up from 28% in 2013-14 (41 of 147) and 14% in 2012-13 (20 of 145).
• Together, NHS foundation trusts moved from a surplus position of £116 million in 2013-14 to a deficit of £328 million in 2014-15.
1.10 The performance of NHS trusts has also declined. The number of NHS trusts in deficit rose to 44% in 2014-15 (40 of 90), up from 23% in 2013-14 (23 of 98), and 5% in 2012-13 (5 of 100). NHS trusts’ deficit increased to £514 million in 2014-15 from £206 million in 2013-14.
1.11 Monitor uses a measure called the EBITDA margin (earnings before interest, tax, depreciation and amortisation, expressed as a percentage of income) as an indicator for operating efficiency and underlying financial sustainability. It assesses that an EBITDA margin of 5% or greater demonstrates financial strength. It uses this measure to test whether an NHS trust is ready to be authorised as an NHS foundation trust. Figure 5 overleaf shows that the average EBITDA margin for both NHS trusts and NHS foundation trusts has fallen over the past 5 years. In 2014-15, it was 3.5% for NHS trusts and 3.7% for NHS foundation trusts. At the end of 2014-15, 99 NHS foundation trusts (66%) were
below the 5% threshold.

20 Part One Sustainability and financial performance of acute hospital trusts
Achieving clinical targets
1.12 Financial sustainability is achieved when NHS trusts and NHS foundation trusts are able to manage their activity within their budget. There are signs that some NHS trusts and NHS foundation trusts are struggling to manage their activity.
• The target that 95% of patients should spend less than 4 hours in A&E was not met in September 2015, although this target was achieved in the month of July following 10 months of missed targets. The proportion of patients spending more than 4 hours from arrival to discharge, admission or transfer in all A&E departments was 5.8% between July and September 2015. This is the highest figure for these 3 months in more than a decade.
• The number of people on the elective care waiting list was at its highest in September 2015 since 2007, with 3.31 million people waiting. The waiting list has grown by 14% over the past 2 years. Nevertheless, in September 2015, 92.5% of those on the waiting list had been waiting for less than 18 weeks, which is above the 92% performance standard.
• The number of bed days lost to delayed transfers of care, where patients remain in a setting unsuited to their level of need, was 14% higher in the year to September 2015 than in the previous year. There has been a substantial increase in delays caused by patients awaiting a care package in their home.
Figure 5Average EBITDA margins for NHS trusts and NHS foundation trusts, 2010-11 to 2014-15
Average EBITDA margin (%)
NHS trusts 5.7 5.3 5.4 4.2 3.5
NHS foundation trusts 6.6 6.1 5.7 5.0 3.7
Source: National Audit Office analysis of NHS trusts and NHS foundation trusts accounts data, 2010-11 to 2014-15
The average EBITDA margin has fallen over the past 5 years and the gap between NHS foundation trusts and NHS trusts has closed
3.0
3.5
4.0
4.5
5.0
5.5
6.0
6.5
7.0
2010-11 2011-12 2012-13 2013-14 2014-15

Sustainability and financial performance of acute hospital trusts Part One 21
1.13 Assessing the relationship between financial and clinical performance is challenging because of the range of influences and the difficulty of attributing cause and effect. We reported in 2014 that trusts with similar clinical performance could have very different financial performance, and there is little evidence of a causal link between financial and clinical performance.5
Financial performance of different types of trust
1.14 Figure 6 overleaf shows the surpluses and deficits for the different types of NHS trusts and NHS foundation trusts as a proportion of their income. Each NHS trust and NHS foundation trust falls into one of the following categories:
• an acute trust providing healthcare services, such as A&E departments, inpatient and outpatient medicine and surgery, and, in some cases, community care, and, or, very specialist medical care;
• an ambulance trust providing emergency access to healthcare;
• a community trust providing universal and specialist out-of-hospital services; or
• a mental health and learning disability trust providing health and social care services for people with learning disabilities or mental health problems.
1.15 A larger proportion of acute trusts had deficits in 2014-15 compared with ambulance, community, and mental health and learning disability trusts. Acute trusts were more likely to report a deficit (61%, or 94 of 155) compared with 20% (2 of 10) of ambulance trusts, 16% (3 of 19) of community trusts and 29% (16 of 56) of mental health and learning disability trusts (Figure 7 on page 23).
Trends in the financial performance of acute trusts
1.16 In 2014-15, 55 acute NHS trusts and 100 acute NHS foundation trusts together received 78% of the total income for all NHS trusts and NHS foundation trusts. The financial position of these acute trusts deteriorated sharply in 2014-15.
• Together, acute trusts reported a net deficit of £958 million (equivalent to 1.6% of their total income). This was 3 times the size of the sector’s deficit in 2013-14 (£306 million or 0.5% of total income).
• The gross deficit of all those acute trusts that had reported deficits increased to £1.2 billion from £719 million in 2013-14.
5 Comptroller and Auditor General, The financial sustainability of NHS bodies, Session 2014-15, HC 722, National Audit Office, November 2014. Available at: www.nao.org.uk/report/financial-sustainability-nhs-bodies-2/

22 Part One Sustainability and financial performance of acute hospital trusts
Fig
ure
6Tr
usts
’ defi
cits
and
sur
plus
es a
s a
perc
enta
ge o
f inc
ome
Per
cent
age
No
tes
1 S
ever
al N
HS
trus
ts a
nd N
HS
foun
dat
ion
trus
ts d
isso
lved
in 2
014-
15 a
nd th
eir
serv
ices
wer
e ta
ken
over
by
othe
r tr
usts
as
des
crib
ed in
Ap
pen
dix
Thr
ee.
2 W
e ha
ve tr
eate
d th
ese
dis
solu
tions
as
if th
ey o
ccur
red
on 1
Ap
ril 2
014,
and
the
dat
a ab
ove
pre
sent
the
surp
luse
s an
d d
efici
ts fo
r th
ose
trus
ts t
hat
exis
ted
on 3
1 M
arch
201
5.
All
dis
solu
tions
and
take
over
tra
nsac
tions
occ
urre
d b
etw
een
acut
e tr
usts
.
3 D
ata
excl
ude
trus
ts’ c
harit
able
fund
s.
Sou
rce:
Nat
iona
l Aud
it O
ffice
ana
lysi
s of
NH
S T
rust
Dev
elop
men
t Aut
horit
y an
d M
onito
r d
ata
Acu
te t
rust
s ha
d la
rger
defi
cits
as
a p
rop
ort
ion
of
thei
r in
com
e th
an n
on-
acut
e tr
usts
-20
-15
-10-50510
Acu
te tr
ust
Am
bula
nce
trus
t
Com
mun
ity tr
ust
Men
tal h
ealth
and
lear
ning
dis
abilit
y tr
ust

Sustainability and financial performance of acute hospital trusts Part One 23
Fig
ure
7S
urpl
uses
and
defi
cits
of a
cute
, am
bula
nce,
com
mun
ity, a
nd m
enta
l hea
lth a
nd le
arni
ng d
isab
ility
trus
ts, 2
014-
15
Tru
st t
ype
Nu
mb
er
of
tru
sts
Tota
l in
com
e in
201
4-1
5
(£m
)
Tru
sts
in s
urp
lus
at t
he
end
of
2014
-15
(%)
Gro
ss s
urp
lus
at t
he
end
of
2014
-15
(£m
)
Tru
sts
in d
efic
it
at t
he
end
of
2014
-15
(%)
Gro
ss d
efic
it
at t
he
end
of
2014
-15
(£m
)
Net
su
rplu
s o
r d
efic
it
2014
-15
(£m
)
Acu
te N
HS
trus
ts55
22,8
90
3553
65-6
19-5
66
Acu
te N
HS
foun
datio
n tr
usts
100
35,3
18
4219
158
-584
-393
Tota
l acu
te t
rust
s15
558
,208
39
244
61-1
,202
-958
Am
bula
nce
NH
S tr
usts
51,
233
100
110
011
Am
bula
nce
NH
S fo
unda
tion
trus
ts5
946
607
40-5
2
Tota
l am
bu
lan
ce t
rust
s10
2,17
980
1820
-513
Com
mun
ity N
HS
trus
ts16
2,51
1 88
2212
-10
12
Com
mun
ity N
HS
foun
datio
n tr
usts
354
867
433
-22
Tota
l co
mm
un
ity
tru
sts
193,
059
8426
16-1
214
Men
tal h
ealth
and
lear
ning
dis
abili
ty N
HS
trus
ts14
2,32
586
3414
-529
Men
tal h
ealth
and
lear
ning
dis
abili
ty
NH
S fo
unda
tion
trus
ts42
8,76
867
8833
-29
59
Tota
l men
tal h
ealth
and
lear
ning
dis
abili
ty t
rust
s56
11,0
9371
122
29-3
488
Tota
l for
all
NH
S tr
usts
9028
,959
5612
044
-634
-514
Tota
l for
all
NH
S fo
unda
tion
trus
ts15
045
,580
5029
1 50
-620
-329
Tota
l fo
r al
l tru
sts
240
74,5
3952
411
48-1
,254
-843
No
tes
1 Fi
gure
s in
clud
e tr
ansa
ctio
ns b
etw
een
trus
ts (fi
gur
es a
re g
ross
, not
net
ted
off f
or tr
ansa
ctio
ns b
etw
een
trus
ts).
2 Fi
gure
s m
ay n
ot s
um d
ue to
rou
ndin
g.
3 D
ata
excl
ude
trus
ts’ c
harit
able
fund
s.
4 S
ever
al N
HS
trus
ts a
nd N
HS
foun
dat
ion
trus
ts d
isso
lved
in 2
014-
15 a
nd th
eir
serv
ices
wer
e ta
ken
over
by
othe
r tr
usts
as
des
crib
ed in
Ap
pen
dix
Thr
ee. W
e ha
ve tr
eate
d th
ese
dis
solu
tions
as
if th
ey
occu
rred
on
1 A
pril
201
4, a
nd th
e d
ata
abov
e p
rese
nt th
e su
rplu
ses
and
defi
cits
for
thos
e tr
usts
that
exi
sted
on
31 M
arch
201
5. A
ll d
isso
lutio
ns a
nd ta
keov
er tr
ansa
ctio
ns o
ccur
red
bet
wee
n ac
ute
trus
ts.
Sou
rce:
Nat
iona
l Aud
it O
ffi ce
ana
lysi
s of
NH
S T
rust
Dev
elop
men
t Aut
horit
y an
d M
onito
r d
ata
24 Part One Sustainability and financial performance of acute hospital trusts
1.17 The balance of net current assets held by NHS trusts and NHS foundation trusts indicates how much capital trusts are generating or using through day-to-day activities. If net current assets are negative, a trust may have difficulty financing its day-to-day operations. In 2014-15:
• net current assets held by acute NHS trusts moved to a negative balance of £410 million, from a negative balance of £309 million in 2013-14, and £375 million in 2012-13; and
• net current assets held by acute NHS foundation trusts fell to £936 million, down from £1,128 million in 2013-14, and £1,293 million in 2012-13.
1.18 Figure 8 shows that cash balances for acute NHS trusts and acute NHS foundation trusts continued to reduce in 2014-15, suggesting acute trusts have increasingly fewer reserves that could be easily drawn upon in times of need.
• The total amount of cash held by acute NHS trusts fell to £475 million in 2014-15, down from £695 million in 2013-14, and £825 million in 2012-13.
• Acute NHS foundation trusts’ cash balance reduced by 21% over this period, falling from £3,294 million in 2012-13 to £2,615 million in 2014-15.
Acute trusts in financial distress
1.19 A significant number of NHS trusts and NHS foundation trusts face severe financial pressures. In 2014-15, 19 of 155 acute trusts reported a deficit of more than £20 million. There is a wide variation in the size of acute trusts and so to understand the financial position of acute trusts under the most stress we looked at those with a deficit that made up more than 5% of their income. Figure 9 on pages 26 and 27 shows that in 2014-15 there were 26 acute trusts with deficits that made up more than 5% of their income. The deficits of these 26 trusts ranged from £7.4 million to £79.6 million. Of these 26 trusts:
• 14 were NHS foundation trusts (out of 100) and 12 were NHS trusts (out of 55);
• 14 had deficits greater than £20 million; of these, 7 had deficits greater than £30 million for 2014-15;
• 9 were in deficit in 2012-13, 2013-14 and 2014-15;
• 20 are planning to be in deficit for a third consecutive year in 2015-16; and
• all 26 trusts are forecasting a deficit in 2015-16.

Sustainability and financial performance of acute hospital trusts Part One 25
Fig
ure
8C
ash
and
othe
r cu
rren
t ass
ets
and
liabi
litie
s at
the
end
of th
e fi n
anci
al y
ear,
acut
e tr
usts
, 20
12-1
3, 2
013-
14 a
nd 2
014-
15 2012
-13
2013
-14
2014
-15
Cas
h an
d c
ash
equ
ival
ents
(£m
)
Oth
er
curr
ent
asse
ts(£
m)
Cu
rren
t lia
bili
ties
(£m
)
Net
cu
rren
t as
sets
(£m
)
Cas
h an
d c
ash
equ
ival
ents
(£m
)
Oth
er
curr
ent
asse
ts(£
m)
Cu
rren
t lia
bili
ties
(£m
)
Net
cu
rren
t as
sets
(£m
)
Cas
h an
d c
ash
equ
ival
ents
(£m
)
Oth
er
curr
ent
asse
ts(£
m)
Cu
rren
t lia
bili
ties
(£m
)
Net
cu
rren
t as
sets
(£m
)
NH
S tr
usts
825
1
,426
-2
,627
-3
75
695
1
,907
-2
,911
-30
9 4
75
1,9
54
-2,8
39
-410
NH
S fo
unda
tion
trus
ts 3
,294
1
,995
-3
,996
1
,293
2
,944
2
,581
-
4,39
7 1
,128
2
,615
3
,004
-4
,682
9
36
Tota
l 4
,120
3
,421
-6
,623
9
18
3,6
38
4,4
88
-7,
308
818
3,0
90
4,9
58-7
,521
526
No
tes
1 C
urre
nt a
sset
s an
d cu
rren
t lia
bili
ties
incl
ude
bala
nces
bet
wee
n tr
usts
(fi g
ures
are
gro
ss, n
ot n
ette
d of
f for
tran
sact
ions
bet
wee
n tr
usts
).
2 Fi
gure
s m
ay n
ot s
um d
ue to
rou
ndin
g.
3 D
ata
excl
ude
trus
ts’ c
harit
able
fund
s.
4 D
ata
are
take
n fr
om tr
usts
’ sta
tem
ents
of fi
nan
cial
pos
ition
on
31 M
arch
in e
ach
year
; bal
ance
s of
trus
ts th
at d
isso
lved
in-y
ear
are
incl
uded
in th
e ba
lanc
es o
f the
su
cces
sor
trus
ts fo
r th
at y
ear.
Bal
ance
s of
trus
ts th
at b
ecam
e N
HS
foun
dat
ion
trus
ts d
urin
g th
e fi n
anci
al y
ear
are
incl
uded
in th
e N
HS
foun
dat
ion
trus
t fi g
ures
for
that
yea
r.
Sou
rce:
Nat
iona
l Aud
it O
ffi ce
ana
lysi
s of
NH
S T
rust
Dev
elop
men
t Aut
horit
y an
d M
onito
r d
ata

26 Part One Sustainability and financial performance of acute hospital trusts
Figure 9Acute trusts with defi cits greater than 5% of their income, 2014-15
A significant number of NHS trusts and NHS foundation trusts face severe financial pressure
Trust Type of trust
Type of acute trust
2012-13 surplus
or deficit
(£m)
2013-14 surplus
or deficit
(£m)
2014-15 surplus
or deficit
(£m)
2014-15 deficit as a percentage
of total income
(%)
2015-16 surplus
or deficit forecast in
trusts’ plans (£m)
Peterborough and Stamford Hospitals NHS Foundation Trust
NHS foundation trust
Medium acute -39.0 -36.8 -38.5 -15.5 -38.8
Milton Keynes Hospital NHS Foundation Trust
NHS foundation trust
Small acute -8.8 -16.8 -24.9 -13.9 -36.2
Medway NHS Foundation Trust
NHS foundation trust
Medium acute -1.8 -10.4 -34.0 -13.6 -22.5
Hinchingbrooke Health Care NHS Trust1
NHS trust Small acute – – -14.0 -12.6 -11.4
Sherwood Forest Hospitals NHS Foundation Trust
NHS foundation trust
Medium acute -15.5 -23.5 -32.6 -12.3 -44.5
Bedford Hospital NHS Trust NHS trust Small acute 1.2 -8.7 -19.8 -12.0 -16.2
Mid Essex Hospital Services NHS Trust
NHS trust Medium acute 1.1 -19.3 -33.4 -11.9 -35.9
Tameside Hospital NHS Foundation Trust
NHS foundation trust
Small acute 0.7 -3.6 -18.5 -11.8 -25.8
St George’s University Hospitals NHS Foundation Trust
NHS foundation trust
Teaching acute
6.3 6.0 -14.1 -11.8 -46.2
The Princess Alexandra Hospital NHS Trust
NHS trust Small acute 0.1 -16.4 -22.0 -11.5 -28.6
Croydon Health Services NHS Trust
NHS trust Medium acute 0.2 -19.7 -27.5 -11.2 -22.5
University Hospitals of Morecambe Bay NHS Foundation Trust
NHS foundation trust
Medium acute -23.2 -18.8 -27.1 -9.9 -23.5
The Queen Elizabeth Hospital King’s Lynn NHS Foundation Trust
NHS foundation trust
Small acute -0.8 -12.9 -14.8 -8.9 -13.9
Colchester Hospital University NHS Foundation Trust
NHS foundation trust
Medium acute 9.0 -1.5 -22.2 -8.3 -30.0
London North West Healthcare NHS Trust2
NHS trust Large acute – – -55.9 -8.2 -88.3

Sustainability and financial performance of acute hospital trusts Part One 27
Trust Type of trust
Type of acute trust
2012-13 surplus
or deficit
(£m)
2013-14 surplus
or deficit
(£m)
2014-15 surplus
or deficit
(£m)
2014-15 deficit as a percentage
of total income
(%)
2015-16 surplus
or deficit forecast in
trusts’ plans (£m)
Basildon and Thurrock University Hospitals NHS Foundation Trust
NHS foundation trust
Medium acute 0.2 -8.7 -23.7 -8.1 -38.8
Barking, Havering and Redbridge University Hospitals NHS Trust
NHS trust Large acute -39.5 -37.8 -38.0 -7.9 -34.0
Worcestershire Acute Hospitals NHS Trust
NHS trust Large acute 0.0 -14.2 -25.9 -7.1 -31.3
Barnsley Hospital NHS Foundation Trust
NHS foundation trust
Small acute 1.3 -7.3 -11.8 -6.8 -11.1
North Cumbria University Hospitals NHS Trust
NHS trust Medium acute 0.2 -27.1 -16.4 -6.3 -40.5
Yeovil District Hospital NHS Foundation Trust
NHS foundation trust
Small acute 0.5 0.0 -7.4 -6.2 -18.4
Northampton General Hospital NHS Trust
NHS trust Medium acute 0.4 0.2 -16.5 -6.1 -20.4
Barts Health NHS Trust NHS trust Teaching acute
0.4 -38.3 -79.6 -6.0 -134.9
Northern Lincolnshire and Goole Hospitals NHS Foundation Trust
NHS foundation trust
Medium acute -0.3 -5.2 -19.6 -5.9 -29.2
Burton Hospitals NHS Foundation Trust
NHS foundation trust
Small acute -2.8 -1.7 -10.4 -5.7 -20.0
Walsall Healthcare NHS Trust NHS trust Small acute 3.9 0.6 -12.9 -5.4 -16.7
Notes
1 Hinchingbrooke Health Care NHS Trust ran a defi cit in 2012-13 and 2013-14. This was covered by £4.8 million in payments from Circle as part of their franchise agreement with the trust.
2 London North West Healthcare NHS Trust formed from the merger of North West London Hospitals NHS Trust and Ealing Hospital NHS Truston 1 October 2015.
3 Several NHS trusts and NHS foundation trusts dissolved in 2014-15 and their services were taken over by other trusts as described in Appendix Three. We have treated these dissolutions as if they occurred on 1 April 2014, and the data above present the surpluses and defi cits for those trusts that existed on 31 March 2015. All dissolutions and takeover transactions occurred between acute trusts.
4 NHS trusts that became NHS foundation trusts in-year are treated as NHS foundation trusts for the whole fi nancial year.
5 Trusts’ 2015-16 planned surplus or defi cit fi gures were taken from information submitted to the NHS TDA in September 2015 and Monitor in May 2015.
Source: National Audit Offi ce analysis of trusts’ fi nancial returns and trusts’ plans for 2015-16
Figure 9 continuedAcute trusts with defi cits greater than 5% of their income, 2014-15
28 Part Two Sustainability and financial performance of acute hospital trusts
Part Two
Factors influencing the financial position of acute trusts
2.1 An acute trust’s financial performance is affected by conditions in the local health economy, a combination of income and spending pressures and its success at balancing these. In this part of the report we use data on financial performance to help explain the factors that influence the financial sustainability of acute trusts.
Local factors
2.2 Patients’ expectations have increased over time; they want to be seen quickly and at a time that suits them. The demand for healthcare has risen in the last decade. Hospital Episodes Statistics (HES) data show that between 2006-07 and 2012-13 the number of people admitted to acute hospitals rose by 16% in England from 12.6 million to 14.6 million.6
2.3 Between 2001 and 2011, the number of people aged 85 and over in England increased at three and a half times the rate of the rest of the population.7 Recent academic research suggests that if admission rates to acute hospitals continue to increase, the growing and ageing population alone means that the NHS will need at least an additional 6.2 million bed days for overnight stays by 2022.8 This is equivalent to approximately 17,000 beds, equating to about 22 hospitals with 800 beds each.
2.4 In our 2014 report, we found that the strength of leadership and the strength of the relationship between the healthcare commissioner and provider were essential to a trust’s ability to tackle financial issues.9 Relationships between providers and commissioners are particularly important when difficulties relate to underlying issues in the local health economy.
6 Nuffield Trust, NHS hospitals under pressure: trends in acute activity up to 2022, October 2014. Available at: www.nuffieldtrust.org.uk/sites/files/nuffield/publication/ft_hospitals_analysis.pdf
7 Comptroller and Auditor General, Emergency admissions to hospital: managing the demand, Session 2013-14, HC 739, National Audit Office, October 2013. Available at: www.nao.org.uk/report/emergency-admissions-hospitals-managing-demand/
8 See footnote 6.9 Comptroller and Auditor General, The financial sustainability of NHS bodies, Session 2014-15, HC 722, National Audit
Office, November 2014. Available at: www.nao.org.uk/report/financial-sustainability-nhs-bodies-2/

Sustainability and financial performance of acute hospital trusts Part Two 29
Acute trusts’ income and spending
2.5 In 2014-15, acute trusts spent £59 billion providing healthcare services. Figure 10 shows that:
• between 2013-14 and 2014-15, total spending by acute trusts increased by 5%, while their income increased by 4%;
• the difference between income and spending was greatest for specialist and small acute trusts, followed by medium acute trusts. For large and teaching acute trusts, increases in income almost matched the rate of increases in spending;
• acute trusts in surplus increased their income by 4.7%, while the income of those in deficit grew by a lower rate of 3.4%; and
• the difference between changes in income and spending was much greater for trusts in deficit (-2%) than for those in surplus (0.1%).
Figure 10Changes in income and spending for acute trusts
Number of trusts
Change in income, 2013-14
to 2014-15(%)
Change in spending,
2013-14 to 2014-15(%)
Difference between the change in income and
change in spending(%)
Small acute trusts 36 2.6 4.8 -2.2
Medium acute trusts 38 5.3 7.0 -1.7
Large acute trusts 36 3.6 4.4 -0.8
Teaching trusts 27 3.8 4.4 -0.5
Specialist trusts 18 4.6 6.8 -2.3
Total acute trusts 155 3.9 5.0 -1.1
Of which:
Trusts in deficit 94 3.4 5.4 -2.0
Trusts in surplus 61 4.7 4.5 0.1
Notes
1 Classifi cations of trust type are based on NHS Trust Development Authority’s and Monitor’s classifi cations, and are presented in each trust’s account.
2 Income and spending includes transactions between trusts (fi gures are gross, not netted off between trusts).
3 Adjustments have been made to income and spending fi gures as described in Appendix Three.
4 Figures may not sum due to rounding.
Source: National Audit Offi ce analysis of NHS Trust Development Authority and Monitor data

30 Part Two Sustainability and financial performance of acute hospital trusts
Income and funding
2.6 Figure 11 shows that on average acute trusts received most of their income from NHS England and clinical commissioning groups to provide NHS healthcare (84% of income). Acute trusts also received income for other activities such as providing education, training and research (6%), providing care for overseas patients (0.1%), and providing care for private patients (0.9%).
2.7 We found a relationship showing that acute trusts that received a greater share of their income for providing healthcare in 2014-15 were more likely to be in deficit than acute trusts with proportionately more non-healthcare income.
2.8 Acute trusts are financially sensitive to national payment arrangements. They receive income for patient care activities through a contract for either a fixed-block or variable level of activity, through a tariff payment. For example, part of the income acute trusts received in 2014-15 was for emergency admissions. Higher volumes of emergency admissions generally resulted in trusts receiving more income from clinical commissioning groups. However, where volumes of emergency admissions were above a baseline established in 2008-09, commissioners typically paid acute trusts at a marginal rate of 30% of the tariff for these emergency admissions.10 In November 2014, we reported that for many acute trusts emergency admissions had an adverse impact on their income because demand was rising.11 Acute trusts told us that the tariff arrangements did not cover the cost of admitting emergency patients, and therefore intensify the already difficult financial challenges the acute hospital sector faces.
2.9 In 2014-15, clinical commissioning groups were expected to invest the remaining 70% of the tariff for emergency admissions to improve patient care outside hospital settings, and to help reduce the number of inappropriate hospital admissions. However, alternatives to hospital care, including enhanced primary care services and community care following discharges from hospital, are not always available. Emergency admissions continued to rise in 2014-15, increasing by 4%.12
2.10 For 2015-16, the majority of NHS trusts and NHS foundation trusts opted for new tariff funding arrangements designed to reduce the pressures on acute trusts. For these trusts, these arrangements included changes to the marginal rate trusts are paid for extra emergency admissions; this increased from 30% to 70%, and commissioners manage the remaining 30% of the tariff.13
10 Clinical commissioning groups could make adjustments to the marginal rate for local demand levels.11 See footnote 9.12 NHS England, Quarterly A&E activity and emergency admissions statistics, NHS and independent sector organisations
in England, July 2015. Available at: www.england.nhs.uk/statistics/statistical-work-areas/ae-waiting-times-and-activity/statistical-work-areasae-waiting-times-and-activityae-attendances-and-emergency-admissions-2015-16-monthly-3/
13 NHS England and Monitor, Guide to the Enhanced Tariff Option for 2015/16, March 2015. Available at: www.england.nhs.uk/wp-content/uploads/2015/05/eto-guidance-15-16.pdf

Sustainability and financial performance of acute hospital trusts Part Two 31
0102030405060708090100
All
acut
e tr
usts
Larg
e ac
ute
trus
tsM
ediu
m a
cute
trus
tsS
mal
l acu
te tr
usts
Spe
cial
ist t
rust
sTe
achi
ng tr
usts
Fig
ure
11
Inco
me
sour
ces
for
acut
e tr
usts
, 201
4-15
Per
cent
age
of t
otal
op
erat
ing
inco
me
for
trus
t gr
oup
s
Sp
ecia
list
trus
ts a
nd t
each
ing
tru
sts
rece
ived
a s
mal
ler
shar
e o
f th
eir
inco
me
fro
m N
HS
Eng
land
and
clin
ical
co
mm
issi
oni
ng g
roup
s an
d a
larg
er s
hare
fro
m o
ther
so
urce
s co
mp
ared
with
oth
er t
ypes
of
acut
e tr
ust
In
com
e fro
m N
HS
Eng
land
and
clin
ical
8
4 8
6 8
8 8
7 8
0 76
com
mis
sion
ing
grou
ps (%
)
O
ther
inco
me
stre
ams
(%)
8
8
7
7
9 11
Ed
ucat
ion,
trai
ning
and
rese
arch
inco
me
(%)
6 4
4
3
9
5
P
rivat
e an
d ov
erse
as in
com
e (%
) 1
0
0
0
1 6
In
com
e fro
m tr
usts
and
loca
l aut
horit
ies
(%)
1
1
1
2
1 1
Tota
l op
erat
ing
inco
me
(£m
) 58
,064
12
,228
14
,635
6,
578
21,3
74
3,24
8
No
tes
1 ‘T
otal
op
erat
ing
inco
me’
as
defi
ned
by tr
usts
in t
heir
acco
unts
.
2 ‘O
ther
inco
me
stre
ams’
cov
ers
othe
r no
n-N
HS
sou
rces
for
patie
nt c
are
inco
me,
and
oth
er n
on-a
ctiv
ity-b
ased
inco
me.
3 Fi
gure
s m
ay n
ot s
um d
ue to
rou
ndin
g.
Sou
rce:
Nat
iona
l Aud
it O
ffice
ana
lysi
s of
NH
S tr
usts
’ and
NH
S fo
und
atio
n tr
usts
’ fina
ncia
l ret
urns
, 201
4-15

32 Part Two Sustainability and financial performance of acute hospital trusts
Acute trusts’ costs
2.11 Costs for different trusts, such as the balance between fixed and variable costs, vary substantially. For example, they depend on whether trusts manage property and maintenance services using their own employees or have negotiated contracts with external suppliers.
2.12 We tested whether there is a correlation between acute trusts’ financial positions and different cost pressures. The indicators we looked at included: type of acute trust (small, medium, or large trust; teaching trusts; or specialist trust); consultancy fees; drugs costs; clinical negligence premiums; staff costs; and estate and private finance initiative (PFI) commitments. We found statistically significant correlations between acute trusts’ surplus or deficit and some cost pressures (agency costs and PFI commitments). But there was little evidence of a statistically significant relationship between acute trusts’ financial position and the other cost pressures we tested.
Staffing
2.13 On average, in 2014-15, acute trusts spent 61% of their income on staff costs (Figure 12). In 2014-15, 10.3% of acute trusts’ spending on staff was for non-permanent staff. This was an increase from 9.8% in 2013-14 and 8.2% in 2012-13.
0
10
20
30
40
50
60
70
2011-12 2012-13 2013-14 2014-15
48.6
3.8
56.2
5.0
55.1
6.0
54.3
6.2
Figure 12Acute trusts’ spending on permanent and non-permanent staff as a proportion of income, 2011-12 to 2014-15
Percentage of total income
Acute trusts’ spending on non-permanent staff has risen since 2011-12
Source: National Audit Office analysis of trusts’ accounts returns
Spending on permanent staff
Spending on non-permanent staff

Sustainability and financial performance of acute hospital trusts Part Two 33
2.14 Monitor has reported that a rise in spending on agency staff has been exacerbated by the difficulties of recruiting staff into permanent posts and by new requirements for safe staffing levels following the 2013 Keogh and Francis reviews.14 We found that:
• acute trusts’ spending on non-permanent staff as a share of total income increased by 24% between 2012-13 and 2014-15;
• there was a statistically significant relationship between spending on agency staff and the size of acute trusts’ deficits in 2014-15; and
• acute trusts that had the largest deficits (19 of 155 acute trusts with deficits greater than £20 million) spent a greater share of their staff costs on non-permanent staff (12.9%) compared with all acute trusts (10.3%).
Private finance initiative (PFI) costs
2.15 The costs of managing the physical estates of acute trusts can influence financial performance. PFI schemes provide new facilities and can lead to quality improvements. Twenty-two of 61 acute trusts that ended 2014-15 in surplus had a PFI scheme (36%), compared with 40 of 94 acute trusts in deficit (43%). In 2014-15, acute trusts that had a PFI scheme spent on average £28 million on interest, service and capital payments for their PFI commitments. This was equivalent to 6% of their total spend. We found that 11 acute trusts spent more than 10% of their yearly spending in 2014-15 on PFI commitments. This was in addition to premises costs (such as business rates, and the costs of operating the trust site), which averaged a further 4% for all acute trusts. High levels of spending on PFI commitments can put at risk the financial sustainability of some trusts, particularly those in deficit. Eleven out of the 19 acute trusts that had a deficit greater than £20 million had a PFI scheme.
2.16 Long-term PFI commitments can create a lack of flexibility that makes it harder for trusts to achieve new efficiencies. In November 2014 we reported that Northumbria Healthcare NHS Foundation Trust had refinanced its PFI scheme to help improve financial sustainability.15 The trust arranged a loan with Northumberland County Council to buy out its PFI scheme. Since our November 2014 report no other trust has refinanced its PFI scheme. Although, NHS England provided £81 million of PFI financial support to 8 NHS trusts and NHS foundation trusts in 2014-15.
14 Monitor, NHS foundation trusts: consolidated accounts 2013-14, July 2014. Available at: www.gov.uk/government/uploads/system/uploads/attachment_data/file/331166/Consolidated_Accounts_2013-14.pdf
15 See footnote 9.

34 Part Two Sustainability and financial performance of acute hospital trusts
Balancing income and spending pressures
2.17 One way trusts can bring their income and spending in balance is to make efficiency savings. Financial sustainability relies on trusts making efficiencies that are recurrent (year-on-year), rather than non-recurrent (one-off). Otherwise, in addition to the savings they have already planned for future years, acute trusts will have to find new savings to replace non-recurrent (one-off) savings. Examples of non-recurrent savings include income generated from selling surplus buildings or savings from leaving posts temporarily vacant.
2.18 Long-term sustainability requires trusts to make not only recurrent efficiencies but to increase cost savings and to rely less on generating new income. Understanding how acute trusts have made efficiency savings in the recent past through cost improvement programmes (CIPs) provides an indication of how acute trusts might fare in the future.
Trends in making efficiency savings
2.19 In 2014-15, acute trusts made significantly fewer recurrent (year-on-year) cost savings than in previous years, but more non-recurrent (one-off) savings. For acute trusts in 2014-15:
• recurrent cost savings fell to £1.35 billion or 62% of total efficiencies (down from £1.47 billion or 63% of total efficiencies in 2013-14, and £1.45 billion or 66% of total efficiencies in 2012-13); and
• non-recurrent cost savings rose to £322 million or 15% of total efficiencies (up from £317 million or 14% of total efficiencies in 2013-14, and £265 million or 12% of total efficiencies in 2012-13).
2.20 Acute trusts have increasingly relied on schemes to generate income to make efficiencies. In 2014-15, trusts planned to make efficiencies from generating income worth £507 million, up from £374 million in 2013-14 and £330 million in 2012-13. Monitor and the Audit Commission reported that these efficiencies are unsustainable because in the long-term acute trusts are unlikely to generate significant increases in income to reduce the need for savings.16
16 Monitor and Audit Commission, Delivering sustainable cost improvement programmes, January 2012. Available at: www.gov.uk/government/uploads/system/uploads/attachment_data/file/285845/CIP_final_18_Jan_v2_0.pdf

Sustainability and financial performance of acute hospital trusts Part Two 35
Acute trusts’ performance against planned savings
2.21 In 2014-15, acute trusts achieved 83% of the efficiencies they had planned to make (achieving £2.2 billion of £2.6 billion planned efficiencies). This is a smaller proportion than in previous years (acute trusts achieved £2.3 billion or 90% of planned efficiencies in 2013-14 and £2.3 billion or 89% in 2012-13). Figure 13 overleaf shows that fewer acute trusts are managing to meet their planned efficiencies each year. We found that:
• the number of trusts achieving 100% of their planned efficiencies fell to 39 in 2014-15, from 50 in 2013-14 and 58 in 2012-13; and
• if all trusts had achieved 100% of their planned efficiencies in 2014-15, 75 acute trusts rather than 93 would have ended the year in deficit. Acute trusts’ deficit would have almost halved to £472 million compared with the £958 million deficit reported.
Differences between acute trusts
2.22 We have analysed acute trusts’ cost improvement plans and found differences in trusts’ ability to make efficiencies. In 2014-15:
• specialist trusts made more efficiencies through generating income (35% of their total efficiencies, compared with 23% for all acute trusts);
• specialist trusts made fewer one-off non-recurrent savings (8% of their total efficiencies, compared with 15% for all trusts); and
• small and large acute trusts made more recurrent pay savings (33% and 36% of their total efficiencies, compared with 29% for all acute trusts).
2.23 Figure 14 on page 37 shows that in 2014-15 acute NHS trusts and acute NHS foundation trusts achieved fewer efficiencies than planned.

36 Part Two Sustainability and financial performance of acute hospital trusts
050100
150
200
250
Fig
ure
13
Acu
te tr
usts
’ per
form
ance
aga
inst
pla
nned
effi
cien
cies
in 2
014-
15, 2
013-
14 a
nd 2
012-
13
Per
cent
age
of p
lan
achi
eved
Few
er a
cute
tru
sts
are
mee
ting
the
ir p
lann
ed e
ffici
enci
es e
ach
year
No
tes
1 E
ffici
enci
es in
clud
e in
com
e ge
nera
tion
as w
ell a
s co
st s
avin
gs.
2 W
e ha
ve r
emov
ed d
ata
anom
alie
s. T
hese
wer
e la
rgel
y tr
usts
tha
t exp
erie
nced
sig
nific
ant c
hang
e in
-yea
r (su
ch a
s a
mer
ger
or a
mov
e to
NH
S fo
und
atio
n tr
ust s
tatu
s). T
he a
ffect
ed tr
usts
are
Bed
ford
H
osp
ital N
HS
Tru
st, S
outh
Lon
don
Hea
lthca
re T
rust
, Wes
tern
Sus
sex
Hos
pita
ls N
HS
Fou
ndat
ion
Trus
t, K
ings
ton
Hos
pita
l NH
S F
ound
atio
n Tr
ust,
and
Mid
Sta
fford
shire
NH
S F
ound
atio
n Tr
ust.
Sou
rce:
Nat
iona
l Aud
it O
ffice
ana
lysi
s of
acu
te N
HS
trus
ts a
nd N
HS
foun
dat
ion
trus
ts’ c
ost i
mp
rove
men
t pro
gram
me
dat
a p
rovi
ded
by
Mon
itor,
the
NH
S T
rust
Dev
elop
men
t Aut
horit
y an
d th
e D
epar
tmen
t of H
ealth
Acu
te N
HS
tru
sts
and
acu
te N
HS
foun
dat
ion
trus
ts
2014
-15
2013
-14
2012
-13
Indi
cato
r of
100
% o
f pla
n ac
hiev
ed

Sustainability and financial performance of acute hospital trusts Part Two 37
0
1
2
3
4
5
6
Acute NHS foundation trusts
3.4%
4.4%
Acute NHS trusts
5.2%
4.2%
Figure 14Planned and achieved efficiencies of acute trusts in 2014-15
Percentage (%)
Acute NHS trusts and acute NHS foundation trusts made fewer efficiencies than planned
Notes
1 Cost improvement efficiencies include income generation as well as cost savings.
2 We have removed Mid Staffordshire NHS Foundation Trust from our analysis. Its services were transferredout to other trusts during the year.
Source: National Audit Office analysis of acute NHS trusts and NHS foundation trusts’ cost improvement programme and financial data, provided by Monitor, the NHS Trust Development Authority and the Department of Health
Achieved efficiencies as a percentage of total spending
Planned efficiencies as a percentage of planned spending

38 Part Three Sustainability and financial performance of acute hospital trusts
Part Three
Managing financial distress and planning for long-term sustainability
3.1 This part considers the support the Department of Health (the Department) and its arm’s-length bodies give to NHS trusts and NHS foundation trusts in financial difficulty, and the steps they are taking to ensure the future sustainability of the wider NHS.
Additional financial support
3.2 Financial sustainability is becoming increasingly out of reach for many acute trusts. In 2014-15, the Department and NHS England provided more cash support to trusts than in 2013-14. In total, NHS trusts and NHS foundation trusts received £1.8 billion of additional financial support as a result of being in financial difficulty (Figure 15 on page 40), compared with £0.8 billion in 2013-14, an increase of £1 billion (125%).
3.3 Historically, the Department provided NHS trusts and NHS foundation trusts in financial difficulty with injections of cash in the form of public dividend capital (PDC) so that trusts had the money they needed to pay creditors and staff and to fund building works considered essential to support patient services. In 2014-15, the main form of cash injection was revenue PDC. Since March 2015, the Department has introduced interest-bearing loans and fee-bearing PDC for trusts in distress, on a short-term basis, while trusts developed a recovery plan. Figure 15 sets out the different types of financial support provided by the Department and NHS England in 2014-15 for trusts in financial difficulty. In 2014-15:
• The Department provided trusts in financial difficulty with £960 million of revenue-based support to help trusts meet their day-to-day operating expenses. This included cash injections in the form of short-term PDC (£661 million), planned-term PDC (£132 million) and short-term loans (£167 million). Almost all (99.8% or £958 million) of the Department’s revenue-based support was given to acute trusts.
• The Department provided trusts in financial difficulty with £308 million of capital support for essential building works. This was given to trusts as short-term PDC (£113 million), planned-term support PDC (£129 million), and as loans (£67 million). The total amount of capital support provided to trusts in financial difficulty was more than double what was provided as capital support in 2013-14 (£95 million).

Sustainability and financial performance of acute hospital trusts Part Three 39
• The Department and NHS England together provided £554 million of financial support as income to trusts in financial difficulty. This included £176 million that was provided to 15 NHS trusts specifically to alleviate their financial distress. This gave these trusts a cash uplift, which also improved their reported financial performance. If these payments had been issued as PDC or loans, instead of as additional income, the reported deficit for NHS trusts and NHS foundation trusts in 2014-15 would have been £1 billion.
3.4 In 2014-15, more trusts received revenue-based support from the Department, with 30 NHS trusts and 19 NHS foundation trusts receiving this support, up from 21 and 10 respectively in 2013-14. Figure 16 on page 41 shows the acute trusts that received revenue-based support in the form of short-term PDC, planned-term support PDC or short-term loans from the Department in 2014-15. Twenty-two of the 48 acute trusts that received revenue-based support in 2014-15 were receiving it for the first time, and 26 acute trusts that received revenue-based support in 2014-15 had received it before.
Identifying risk
3.5 Monitor and the NHS Trust Development Authority (NHS TDA) use financial information to measure risk among the bodies they oversee.
• At the end of 2014-15, Monitor rated 24% of NHS foundation trusts as having a continuity of service risk rating of 2 or below (on a 4-point scale). This rating suggests their services are likely to be experiencing a material level of risk. In 2013-14, 14% of NHS foundation trusts were rated at this level.
• Using Monitor’s continuity of service risk rating, the NHS TDA rated 51% of NHS trusts at level 2 or below in 2014-15. To be considered ready to become an NHS foundation trust, NHS trusts are expected to achieve and maintain a risk rating of 3 or better.
• In August 2015, Monitor updated its risk assessment framework to reflect the growing number of NHS foundation trusts in deficit.17 The new framework re-introduced measures of financial risk that Monitor had used before: tracking financial deficits; and accurate planning. It also introduced a requirement for NHS foundation trusts to submit information to Monitor monthly.
17 Monitor, Risk Assessment Framework, August 2015. Available at: www.gov.uk/government/publications/risk-assessment-framework-raf

40 Part Three Sustainability and financial performance of acute hospital trusts
Figure 15Financial support provided to NHS trusts and NHS foundation trusts in fi nancial diffi culty in 2014-15
Type of support Oversight Purpose Total amount (£m)
Number of trusts
Revenue-based support1
Interim revenue-based PDC funding3
Department of Health
Short-term support for trusts in financial difficulty, to meet day-to-day operating expenses
661.2 33
Interim revenue-based loans3 Department of Health
Short-term loans for trusts in financial difficulty to meet day-to-day operating expenses
167.0 11
Planned-term support revenue-based PDC funding
Department of Health
Planned revenue support given to trusts in financial difficulty, and who have developed a recovery plan
132.1 9
Capital-based support1
Interim capital-based PDC funding3
Department of Health
Short-term support for trusts in financial difficulty to meet the cost of essential capital investment costs
112.8 18
Interim capital-based loans3 Department of Health
Short-term loans for trusts in financial difficulty to meet the cost of essential capital investment costs
66.8 15
Planned-term support capital-based PDC
Department of Health
Planned capital support given to trusts in financial difficulty, and who have developed a recovery plan. This includes support to those trusts who have taken over other trusts in 2013-14 and 2014-15
128.7 13
Income support2
Transaction-related support NHS England Support provided by NHS England relating to historic mergers and other agreed support
120.1 14
Private finance initiative (PFI) support
NHS England Historically agreed support to trusts with PFI schemes
81.0 8
Income support Department of Health
Support in the form of income issued to trusts
176.3 15
Project Diamond Department of Health and NHS England
Income provided to specialist acute trusts to support the additional cost of highly specialised treatments for patients with complex conditions
176.8 19
Total support for trusts in financial difficulty 1,822.8
Notes
1 Revenue-based and capital-based loans and PDC funding is provided to trusts as cash rather than income, and does not affect the reported surplus or defi cit.
2 Income support funding is provided to trusts as income, and affects the reported surplus or defi cit.
3 Interim support is short-term support for trusts in fi nancial diffi culty, and is issued to support the trust’s day-to-day operations pending the trust’s development of a recovery plan. Once a recovery plan is agreed, interim support amounts are eligible to be converted (via an application to the Independent Trust Financing Facility) into planned-term support PDC funding or loans, if they are still required by the trust. Since March 2014-15, interest-bearing loans and fee-bearing PDC replaced revenue PDC (non-repayable cash) as the default method of providing short-term support to trusts pending the development of a recovery plan.
4 This fi gure includes all trusts in fi nancial diffi culty that received fi nancial support in 2014-15.
Source: National Audit Offi ce analysis of Department of Health and NHS England data

Sustainability and financial performance of acute hospital trusts Part Three 41
0 10 20 30 40 50 60 70 80 90 100
Royal National Hospital for Rheumatic Diseases NHS Foundation TrustRoyal United Hospitals Bath NHS Foundation Trust
Barnet and Chase Farm Hospitals NHS Trust
Walsall Healthcare NHS Trust
Mid Yorkshire Hospitals NHS TrustWeston Area Health NHS Trust
Ealing Hospital NHS Trust
The Whittington Hospital NHS Trust
Burton Hospitals NHS Foundation TrustIpswich Hospital NHS Trust
Kettering General Hospital NHS Foundation Trust
West Middlesex University Hospital NHS Trust
Lewisham and Greenwich NHS TrustHinchingbrooke Health Care NHS Trust
Basildon and Thurrock University Hospitals NHS Foundation TrustUnited Lincolnshire Hospitals NHS Trust
Buckinghamshire Healthcare NHS TrustUniversity Hospitals of North Midlands NHS Trust
Tameside Hospital NHS Foundation TrustFrimley Park Hospital NHS Foundation Trust
Northampton General Hospital NHS Trust
The Queen Elizabeth Hospital King’s Lynn NHS Foundation Trust
Heatherwood and Wexham Park Hospitals NHS Foundation TrustSouth Tees Hospitals NHS Foundation Trust
North Cumbria University Hospitals NHS Trust
Barnsley Hospital NHS Foundation Trust
Shrewsbury and Telford Hospital NHS Trust
The Princess Alexandra Hospital NHS TrustBedford Hospital NHS Trust
University Hospitals of Morecambe Bay NHS Foundation TrustUniversity Hospitals Coventry and Warwickshire NHS Trust
London North West Healthcare NHS TrustMedway NHS Foundation Trust
West Hertfordshire Hospitals NHS Trust
Croydon Health Services NHS TrustMilton Keynes Hospital NHS Foundation Trust
Derby Hospitals NHS Foundation TrustMid Essex Hospital Services NHS Trust
Peterborough and Stamford Hospitals NHS Foundation Trust
Sherwood Forest Hospitals NHS Foundation Trust
Royal Free London NHS Foundation Trust
Leeds Teaching Hospitals NHS Trust
North West London Hospitals NHS Trust
Mid Staffordshire NHS Foundation Trust
Barking, Havering and Redbridge University Hospitals NHS Trust
Worcestershire Acute Hospitals NHS Trust
University Hospitals of Leicester NHS TrustBarts Health NHS Trust
2.0
4.0
8.6
9.7
10.6
12.3
13.0
13.1
18.5
19.2
20.3
20.7
21.0
21.2
21.5
22.5
22.7
28.8
29.0
30.6
32.1
90.0
33.2
34.2
35.7
37.4 38.0
43.9
46.0
23.3
25.3
14.7
15.2
15.2
16.8
17.6
17.7
17.9
4.9
5.0
5.0
5.7
6.3
7.1
7.4
7.9
4.5
1.0
Figure 16Revenue-based support issued to acute trusts, 2014-15
48 acute trusts received revenue-based support in 2014-15
Note
1 This figure includes all acute trusts that received revenue-based support in 2014-15.
Source: National Audit Office analysis of Department of Health data
£ millionNHS trust NHS foundation trust

42 Part Three Sustainability and financial performance of acute hospital trusts
Controlling trusts’ spending
3.6 The Department, Monitor and the NHS TDA set limits on certain areas of trust spending in 2015-16 (Figure 17). The limits are in addition to:
• the public sector pay cap that restrains wage increases for all NHS workers to 1% each year for 4 years from 2016-17; and
• Monitor directives for NHS foundation trusts to stop recruiting non-essential staff.
3.7 The Department aims for these cost-saving measures to help the NHS achieve financial balance. But it is unclear what impact these measures will have on the forecast deficit in 2015-16 given that they were introduced part-way through the year. The Department announced spending controls on agency staff on 2 June 2015, but trusts were not informed of their annual limit for spending on nursing agency staff until 3 months later on 1 September 2015. They were told the control would come into effect on 1 October 2015.
Figure 17Limits on trust spending
Cost-saving measure Date announced Date of implementation
Aim Applies to
Recruitment of nursing agency staff must be from frameworks (unless otherwise authorised by Monitor and the NHS TDA)
2 June 2015 19 October 2015 Reduce agency costs All NHS trusts, and those NHS foundation trusts in receipt of financial support or in breach of their licence
Annual ceiling on the level of nursing agency spend
2 June 2015 1 October 2015 Reduce agency costs All NHS trusts, and those NHS foundation trusts in receipt of financial support or in breach of their licence
A shift-based or day/hourly rate-cap for agency staffing
2 June 2015 23 November 2015 Reduce agency costs All NHS trusts, and those NHS foundation trusts in receipt of financial support or in breach of their licence
All professional services consultancy contracts above £50,000 will require sign-off from Monitor or the NHS TDA
2 June 2015 2 June 2015 Reduce consultancy costs
All NHS trusts, and those NHS foundation trusts in receipt of financial support or in breach of their licence
Expectations on the remuneration of very senior managers
2 June 2015 June 2015 Reduce staff pay costs
All trusts (some variation on rules)
Capital spending controls 31 July 2015 (in NHS TDA letter)
Right to implement controls reserved for NHS foundation trusts
Reduce capital costs NHS trusts and NHS foundation trusts
Source: National Audit Offi ce analysis of Monitor and NHS Trust Development Authority documents
Sustainability and financial performance of acute hospital trusts Part Three 43
Assurance of acute trusts’ financial plans for 2015-16
3.8 Monitor and the NHS TDA review and risk-assess trusts’ financial plans. Ahead of the 2015-16 planning period, NHS England, Monitor, and the NHS TDA worked together to develop a joint assurance process by encouraging commissioners and trusts to produce plans that reflected local needs. Monitor and the NHS TDA had intended to review trusts’ final plans in April 2015. This followed an early look at NHS trusts’ plans by the NHS TDA. But the rejection of the proposed 2015-16 national tariff by NHS providers meant that the timetable for reviewing plans shifted. Monitor and the NHS TDA reviewed trusts’ final plans in May 2015 following their reviews of trusts’ draft plans and their provision of feedback to trusts.
3.9 Trusts submitted their draft financial plans in April 2015. The NHS TDA has previously required NHS trusts to submit draft financial plans and in 2015 Monitor also made this a requirement for NHS foundation trusts.
3.10 The draft plans in April showed that acute NHS trusts forecast a deficit for 2015-16 of £1.1 billion. Acute NHS foundation trusts forecast a deficit for 2015-16 of £0.96 billion. In response, Monitor carried out a programme of two-day site visits to 46 trusts with forecast deficits of more than £10 million. It followed these visits with a challenge session with trust board members and senior figures at Monitor. The NHS TDA used its regular monthly delivery meetings with NHS trusts to review and challenge financial plans.
3.11 The period for financial planning was extended further following the review of plans in May 2015. The forecast deficits for 2015-16 in acute trusts’ May 2015 plans had not improved significantly and deficits were £1.18 billion for acute NHS trusts and £0.93 billion for acute NHS foundation trusts. All NHS trusts and those NHS foundation trusts in deficit were asked to review their financial forecasts and to plan to reduce their overall deficit further. NHS trusts’ financial plans were re-submitted to the NHS TDA in September 2015, 6 months into the financial year. NHS foundation trusts’ financial plans were still under review by Monitor in October 2015, 7 months into the financial year.
3.12 In July 2015, the chief executive of the NHS TDA wrote to all NHS trusts giving them a personalised ‘stretch target’ (a target that trusts should work towards to improve their financial position) for their 2015-16 financial position. NHS trusts were expected to respond in August 2015 with a revised financial plan. At the same time, the chief executive of Monitor wrote to all NHS foundation trusts asking them to find further efficiency savings. Monitor provided stretch targets to 57 trusts and asked these to respond with a revised financial plan. Monitor and the NHS TDA have not publicly reported the extent to which stretch targets will reduce trusts’ forecast deficit.
3.13 For 2015-16, trusts were required to produce a one-year financial plan. For 2016-17, the Department and its arm’s-length bodies aim to align their planning processes further and to continue to publish joint planning guidance. Trusts will be asked to produce a one-year financial plan for 2016-17, and a multi-year plan to show how the Five Year Forward View will be implemented within a local health economy.

44 Part Three Sustainability and financial performance of acute hospital trusts
Joined-up working
3.14 Figure 18 shows the bodies that are responsible for regulating and overseeing acute trusts and the areas they focus on.
3.15 The Department and its arm’s-length bodies are working closely in some areas.
• This includes the ongoing joint responsibility held by NHS England and Monitor for defining and setting national tariff pricing, including annual efficiency expectations for NHS trusts and NHS foundation trusts.
• As part of the 2014-15 planning process, Monitor, NHS England and the NHS TDA came together to provide additional support to 11 challenged health economies.18
• Monitor, NHS England and the NHS TDA are working with the Care Quality Commission (CQC) to oversee a new ‘success regime’ in 2015-16. The regime is working across health economies to identify deep-rooted challenges and help implement the changes needed to address them.
• From April 2016, Monitor and the NHS TDA will become a jointly led organisation, NHS Improvement.
18 Monitor, NHS Trust Development Authority and NHS England, Making Local Health Economies work better for patients, December 2014. Available at: www.gov.uk/government/publications/making-local-health-economies-work-better-for-patients
Figure 18Bodies with responsibility for the oversight and regulation of acute trusts
Monitor is the sector regulator for health and also licenses and regulates NHS foundation trusts, focussing on governance and financial viability
The Care Quality Commission regulates the quality and safety of health and adult social care services
The NHS Trust Development Authority oversees the performance of NHS trusts and supports them to achieve NHS foundation trust status
Note
1 Clinical commissioning groups and NHS England are responsible for holding providers to account for delivering high-quality services that are value for money.
Source: National Audit Offi ce
Regulators and oversight bodies
Finance
An organisation’s ability to deliver essential services on a sustainable basis
Governance
Whether the organisation is well led and accountable
Quality
Whether services are safe, caring, effective, responsive and well led

Sustainability and financial performance of acute hospital trusts Part Three 45
3.16 It is important for the Department and its arm’s-length bodies to work together to coordinate their activities. If they do not, there is a risk that trusts receive mixed messages or are faced with unnecessary competing priorities. For example, advice to trusts on safe staffing in recent years could have created actual or perceived conflicts for trusts between meeting quality and safety standards and maintaining long-term financial sustainability.
• Acute trusts sought to prioritise safety and quality of care following the Department’s 2013 Francis Inquiry report that examined the serious failures at Mid Staffordshire NHS Foundation Trust.19
• The National Institute for Health and Care Excellence (NICE) published guidelines for the safe staffing of adult nursing in July 2014,20 and a guide for midwifery staffing in February 2015.21 But NICE’s process was halted by NHS England in summer 2015. NHS England, Monitor and the NHS TDA are now working together to develop minimum staffing guidelines.
• Trusts must meet the quality and safety standards set by the CQC including that providers must have enough suitably qualified, competent and experienced staff to make sure they can meet these standards.22
• When setting limits on trusts’ agency costs in June 2015 (Figure 17) the Department was explicit that the “focus is on saving money”; but that there should be no “compromise” on patient safety. Monitor wrote to NHS foundation trusts in August 2015 asking them to adopt safe staffing guidance in a “proportionate and appropriate way”, ensuring “that rosters are rigorously managed to deploy substantive staff efficiently”.
3.17 In October 2015, NHS England, Monitor, the NHS TDA, NICE and the CQC wrote to all trusts recognising the need for clarity and consistency. These arm’s-length bodies told trusts that the NICE guidance was “not a requirement”. The bodies made clear that financial considerations were as important as the safety and quality of care for patients, asking hospitals “to take a rounded view of staffing” that shows they are “making the best use of resources” as well as providing safe care.
19 Sir Robert Francis QC, Final report of the Mid Staffordshire NHS Foundation Trust public inquiry, February 2013. Available at: www.midstaffspublicinquiry.com/report
20 National Institute for Health and Care Excellence, Safe staffing for nursing in adult inpatient wards in acute hospitals, July 2014. Available at: www.nice.org.uk/guidance/sg1
21 National Institute for Health and Care Excellence, Safe midwifery staffing for maternity settings, February 2015. Available at: www.nice.org.uk/guidance/ng4
22 Care Quality Commission, The fundamental standards, June 2015. Available at: http://www.cqc.org.uk/content/fundamental-standards
46 Part Three Sustainability and financial performance of acute hospital trusts
Strategic oversight and governance
3.18 The Five Year Forward View is a vision for the future of the NHS.23 The Five Year Forward View estimated there will be a £30 billion gap between resources and patient needs by 2020-21. It estimated that if the NHS had £8 billion more funding, the gap between resources and patient needs would be £22 billion by 2020-21. In November 2015, the government committed to increasing funding for the NHS by £8.4 billion by 2020, with £3.8 billion of this given to the NHS in 2016-17. The NHS Five Year Forward View board oversees the delivery of the Five Year Forward View. The board is made up of the chief executive officers of 7 of the Department’s arm’s-length bodies. It is supported by 8 programme-specific boards, including the Finance and Efficiency board, which was established to oversee delivery of the efficiency savings needed to close the £22 billion gap. Since it was established in June 2015, it has had met 3 times by 30 November 2015.
3.19 The Department told us that the Finance and Efficiency board is developing a plan that will be informed by funding decisions made by government in November 2015, and will allow the NHS to close the estimated £22 billion gap. But it is not yet clear how and when most of the £22 billion of savings will be made, or the contribution that individual organisations and sectors are expected to make. The core management cycle in our guidance, A short guide to structured cost reduction, shows the importance of strategy, planning and implementation in achieving sustainable cost reduction.24 We would expect the Department and its arm’s-length bodies to develop and implement a plan that shows clearly how the gap between resources and patient needs will be closed at all levels of the NHS. This plan should be aligned with resources and quality requirements. Good programme management needs to be in place to monitor progress. The Department and its arm’s-length bodies need to communicate their plans so that trusts can undertake long-term planning and be held to account for delivering their part of the plan.
3.20 Although there is no detailed plan for closing the £22 billion efficiency gap, preliminary work is being carried out to identify where acute trusts can make savings.
• The Department’s team led by Lord Carter of Coles examined a sample of 22 acute trusts to identify opportunities for savings. His interim report found the NHS could save up to £5 billion every year by 2020 by making better use of staff, using medicines more effectively and getting better value from the products it buys.25 The report concluded that there is significant scope for hospitals to become more productive by making better use of comparative data. However, it is not clear how accurate these data are, as they are primarily based on reference costs – the average unit cost to the NHS of providing healthcare. The quality of reference cost data relies on accurate data being submitted by trusts. A recent audit by Monitor of reference costs for 2013-14 found that 49% of trusts sending these data
23 NHS England, Monitor, NHS Trust Development Authority, Care Quality Commission, Public Health England and Health Education England, Five Year Forward View, October 2014. Available at: www.england.nhs.uk/wp-content/uploads/2014/10/5yfv-web.pdf
24 National Audit Office, A short guide to structured cost reduction, June 2010. Available at: www.nao.org.uk/report/a-short-guide-to-structured-cost-reduction-4
25 Lord Carter of Coles, Review of Operational Productivity in NHS providers – Interim report, June 2015. Available at: www.gov.uk/government/uploads/system/uploads/attachment_data/file/434202/carter-interim-report.pdf

Sustainability and financial performance of acute hospital trusts Part Three 47
had made “materially inaccurate” submissions.26 Lord Carter’s work used reference costs from 2014-15. Monitor is leading work to improve cost reference data for future years.
• Lord Carter’s work is a positive step towards supporting trusts to make efficiencies, but it is not clear how far this work can be applied to all 155 acute NHS trusts and NHS foundation trusts. In October 2015, Lord Carter began to share with 137 acute trusts (excludes specialist acute trusts) analysis that shows how and where they can improve patient care and become more efficient.27
• In October 2015, Monitor published a report on opportunities for NHS trusts and NHS foundation trusts to find savings from elective (planned) care services.28 The report states that trusts could achieve 13% to 20% productivity savings on elective ophthalmology and orthopaedic care if they adopted 9 good practices identified in the report. It found that ophthalmology and orthopaedic care together account for around 30% of total provider expenditure on elective admitted patient care.
3.21 The Five Year Forward View states it is possible for the NHS to achieve annual efficiency savings of 2% across its funding base each year for the rest the decade, rising to some 3% over time. The NHS has historically achieved annual efficiency savings of 0.8%, which have increased to 1.5%–2% in recent years, against a target of 4% set by Monitor and NHS England. We have found that trusts are already finding it difficult to make their planned efficiency savings (paragraphs 2.18 to 2.21). The Department’s initial estimates suggest financial savings from implementing the Five Year Forward View are likely to come towards the end of the 5 years. The NHS will therefore need to prioritise its investments to make early savings to close the funding gap in 2016-17 and 2017-18.
Redesigning health and care services and reducing demand
3.22 Redesigning health and care services is seen as another route to closing the £22 billion gap between resources and patient needs. The Committee of Public Accounts has recognised that radical change is needed to the way healthcare is provided, including making better use of community and primary care services to reduce pressure on hospitals.29 However, making this change will require significant upfront investment, but the money available for this is reducing as the number of trusts in deficit increases.
3.23 Figure 19 overleaf shows the 7 new models of care outlined in the Five Year Forward View. The models aim to breakdown the boundaries between primary care, hospitals and community care, and integrate services around the needs of the patient.
26 Monitor, Reference cost assurance programme: Findings from the 2014-15 audit, September 2015. Available at: www.gov.uk/government/uploads/system/uploads/attachment_data/file/466112/Reference_cost_audit_report_final_v2.pdf
27 Department of Health, Lord Carter: reducing variation in care could save NHS £5 billion, press release, 21 October 2015. Available at: www.gov.uk/government/news/lord-carter-reducing-variation-in-care-could-save-nhs-5-billion
28 Monitor, Helping NHS providers improve productivity in elective care, October 2015. Available at: www.gov.uk/government/uploads/system/uploads/attachment_data/file/466895/Elective_care_main_document_final.pdf
29 HC Committee of Public Accounts, Financial sustainability of NHS bodies, Thirty-fifth Report of Session 2014-15, HC 736, February 2015. Available at: www.parliament.uk/business/committees/committees-a-z/commons-select/public-accounts-committee/news/report-financial-sustainability-of-nhs-bodies/

48 Part Three Sustainability and financial performance of acute hospital trusts
3.24 Elements of the new models of care, seen by the Department as innovative, are emerging in some parts of the country. NHS England has made some assumptions about the savings that will be made through new care models. But because these models are new and untested, there is limited evidence to show that they will make savings and improve care for patients effectively. Making savings through redesigned healthcare will be challenging. For example, some of the new care models involve integration between healthcare services. Our report on Planning for the Better Care Fund raised concerns about the effectiveness of integrated care in saving money.30
30 Comptroller and Auditor General, Planning for the Better Care Fund, Session 2014-15, HC 781, National Audit Office, November 2014. Available at: www.nao.org.uk/report/planning-better-care-fund-2/%20
Figure 19The new models of care outlined in the Five Year Forward View
Multi-specialty community providers GP practices expand, bringing in nurses and community health services, hospital specialists and others to provide integrated out-of-hospital care. The practices would aim to shift the majority of outpatient consultations and ambulatory care out of hospitals.
Primary and acute care systems Hospital and primary care providers come together to provide NHS list-based GP and hospital services, together with mental health and community care services.
Urgent and emergency care services Urgent and emergency care services are redesigned to provide better integration between A&E departments, GP out-of-hour services, urgent care centres and other services.
Viable smaller hospitals New ways of achieving sustainable cost structures for smaller hospitals, such as by using new models of medical staffing, forming ‘hospital chains’ or allowing for some services to be offered by specialised providers on satellite sites.
Specialised care Services will be consolidated in specialist centres where there is strong evidence for concentrating care. The establishment of specialist centres for rare diseases will also be considered to improve the coordination of care for patients.
Modern maternity services A new care model for maternity services will be developed, drawing on the recommendations of a review of how to sustain and develop maternity units across NHS England.
Enhanced health in care homes The NHS will work with care home providers and local authority social services departments to develop new shared models of care and support. This will cover medical reviews, medication reviews and rehabilitation services.
Source: NHS England, Monitor, NHS Trust Development Authority, Care Quality Commission, Public Health England and Health Education England, Five Year Forward View, October 2014.
Sustainability and financial performance of acute hospital trusts Part Three 49
3.25 The NHS Five Year Forward View board intends to build evidence of the effectiveness of the models through its vanguard programme. This will include using a common set of national metrics to monitor progress in addressing gaps in health and well-being, care and quality and efficiency. In December 2014, NHS England announced that it would support ‘leading edge’ NHS providers and local authorities to develop the new models of care, which could be replicated elsewhere. These organisations, known as the ‘vanguards’, will have access to a share of a £200 million transformation fund, as well as sponsorship from one of the chief executives of the Department’s arm’s-length bodies. Between March 2015 and September 2015, NHS England announced the first 50 vanguard sites. A subsequent phase of the programme will focus on rolling out the models to other areas of the country, including some of the more challenged health economies.
3.26 NHS England told us that it has estimated the savings it expects to be realised from the new care models and the timing of these. It has used the assumptions from the business cases for the vanguard programme as the basis for these estimates. NHS England’s guidance says that unless the vanguards demonstrate “quantified changes” in 2016-17, it will be hard to justify national investment.31 It may, however, take time for trusts to deliver any savings, for example, if they are unable to reduce their spending in the short term due to fixed costs. Most costs are for staff and facilities, which do not rise or fall steadily in response to changes in activities. For example, falling numbers of inpatients will only significantly reduce costs for an acute trust when the fall is large enough to allow the trust to reduce staff numbers and close beds and wards.
3.27 The Five Year Forward View makes the case for sustained social care services and a radical upgrade in public health and prevention as a way of improving the population’s health and curbing the growing demand for services. Improvements to public health come from national and local interventions. Since April 2013, local authorities have had a statutory duty to improve the health of their population. But the pressures on local authority spending could make it more challenging to improve public health.
• Local authority spending is under increasing pressure as the government reduced funding to local authorities by some 37% in real terms between 2010-11 and 2015-16.32
• The government announced in June 2015 that the ring-fenced public health grant to local authorities for 2015-16 would be cut by £200 million.
31 NHS England, The Forward View into Action: New Care Models: Update and initial support, July 2015. Available at: www.england.nhs.uk/wp-content/uploads/2015/07/ncm-support-package.pdf%20
32 Comptroller and Auditor General, Financial sustainability of local authorities 2014, Session 2014-15, HC 783, National Audit Office. Available at: www.nao.org.uk/report/financial-sustainability-of-local-authorities-2014/

50 Appendix One Sustainability and financial performance of acute hospital trusts
Appendix One
Our audit approach
1 This study examines the financial sustainability of NHS trusts and NHS foundation trusts, particularly those providing acute healthcare services. We reviewed:
• the headline financial performance of the NHS overall;
• trends in the performance of acute trusts between 2010-11 and 2014-15 for key financial indicators such as surplus/deficit and earnings before interest, tax, depreciation and amortisation (EBITDA), and trends between 2012-13 and 2014-15 for other financial indicators such as cash and other current assets;
• performance data to help identify and explain the factors that influence the financial sustainability of acute trusts such as income and expenditure, demand pressures, and the ability of acute trusts to achieve planned efficiency savings;
• the financial support provided to NHS trusts and NHS foundation trusts in financial difficulty in 2014-15; and
• the assurance process during the financial and operational planning round for 2015-16, and other measures the Department of Health and its arm’s-length bodies have taken to ensure the future financial sustainability of the wider NHS.
2 In reviewing these issues, we applied an analytical framework with evaluative criteria, to consider what arrangements would be optimal for financial sustainability. By ‘optimal’ we mean the most desirable possible, while acknowledging expressed or implied constraints. We used mainly output-based criteria (for example, performance against key financial indicators is stable or deteriorating, or NHS bodies are receiving the same or more cash support than in previous years).
3 Our audit approach is summarised in Figure 20. Our evidence base is described in Appendix Two.

Sustainability and financial performance of acute hospital trusts Appendix One 51
Figure 20Our audit methods
The Department of Health and NHS England’s objective
Our study framework What are the trends in the
financial position of NHS trusts and NHS foundation trusts, and particularly acute trusts?
What are the approaches taken by the Department, NHS England, Monitor and the NHS TDA to support trusts to achieve financial sustainability?
What factors influence the financial sustainability of acute trusts?
Our evidence
(see Appendix Two for details)
Financial analysis of data from existing trust accounts, including key performance data such as surplus/deficit and EBITDA by:
• time trend analysis; and
• analysis by types of trust.
Analysis of additional financial support.
Examination of financial plans and the associated assurance process.
Document review and interviews with stakeholders, including control measures, oversight and future planning.
Financial analysis of income and expenditure data from existing trust accounts.
Review of demand pressures.
Document review and interviews with key stakeholders.
Analysis of trusts’ performance in achieving planned efficiencies.
To ensure that healthcare services in England provide high quality care to patients in a sustainable way to achieve value for money.
How this will be achieved
The Department is ultimately responsible for securing value for money for spending on health services. It fulfils its stewardship responsibility in part by setting objectives for the NHS through an annual mandate to NHS England.
NHS England allocates money to 211 clinical commissioning groups to commission acute hospital services. NHS trusts and NHS foundation trusts manage their expenditure against the income they receive from clinical commissioning groups and other sources such as research and development funding.
Our studyIs the financial position of NHS trusts and NHS foundation trusts sustainable, particularly the financial position of acute trusts?
Our conclusionsWe said in our November 2014 report on NHS financial sustainability that the trend of NHS trusts’ and NHS foundation trusts’ declining financial performance was not sustainable. At that time, trusts overall, including acute trusts, were in a better financial position. But since then, acute trusts’ financial performance has deteriorated sharply. And their financial position is forecast to worsen. With financial problems endemic, we repeat our view that these trends are not sustainable.
The Department, NHS England, Monitor and the NHS TDA have responded to trusts’ financial distress with measures to help improve financial performance. But trusts’ financial management has been undermined by a turbulent planning period and the multiple interventions by the Department, Monitor and the NHS TDA that seek to control trusts’ spending. Effective oversight by the Department and its arm’s-length bodies will become harder if the number of trusts in financial distress rises further.
Running a deficit seems to be becoming normal practice for acute trusts. And there is a risk that poor financial performance is not taken as seriously as poor healthcare provision. This weakens the effectiveness of market-style mechanisms designed to improve hospital productivity and efficiency. The government’s commitment to increase funding for the NHS could be a significant step towards acute trusts achieving financial balance. But this depends on how the funding is used and the impact of wider changes to healthcare services. The Department, NHS England, Monitor and the NHS TDA need to take a more holistic, coordinated approach to tackling trusts’ persistent financial problems and move beyond quick fixes to cut trusts’ spending. Until there is a clear pathway for trusts to get back to financial stability, we cannot be confident that value for money, defined as financial and service sustainability, will be achieved.

52 Appendix Two Sustainability and financial performance of acute hospital trusts
Appendix Two
Our evidence base
1 We reached our independent conclusions on the financial sustainability of the current financial performance of acute NHS trusts and acute NHS foundation trusts after analysing evidence we collected between May and October 2015. Our audit approach is outlined in Appendix One.
2 We analysed existing financial data from NHS accounts:
• a time series analysis of the overall financial position of the NHS;
• a time series analysis of the financial position of NHS trusts and NHS foundation trusts against two key indicators – surplus/deficit and EBITDA with a breakdown by the types of trust;
• a time series analysis of acute NHS trust and NHS foundation trust performance against key indicators, including surpluses and deficits, EBITDA, and current assets and current liabilities; and
• analysis of income and spending from trust account returns with further analysis of components of income (including the income to provide healthcare) and expenditure (including staffing costs and PFI commitments).
3 We analysed existing data on acute NHS trusts and NHS foundation trusts to identify and explain the variation in trusts’ financial performance:
• a time series analysis of performance by acute trusts in achieving their planned efficiencies (detailed in their cost improvement programmes) for 2014-15 compared with previous years with a breakdown by the types of trusts;
• analysis of additional financial support, such as revenue-based public dividend capital for 2014-15 compared with previous years;
• analysis of continuity of service risk ratings; and
• analysis of trusts’ 2015-16 plan data.

Sustainability and financial performance of acute hospital trusts Appendix Two 53
4 We analysed existing data on acute NHS trusts and NHS foundation trusts to identify and explain the variation in trusts’ financial performance.
• We performed a correlation analysis to compare acute trusts financial performance to aspects of their income and spend for 2014-15, including patient care income as a share of total income, agency and private finance initiative (PFI) payments, and other factors.
5 We conducted detailed reviews of the 2015-16 financial planning process.
We reviewed planning guidance and associated documents in order to:
• evaluate the process of producing one-year operational plans;
• assess the causes and consequences of delays in the planning process for 2015-16; and
• understand the actions taken by the arm’s-length bodies in an attempt to control the predicted deficit.
We interviewed those involved in the central planning processes at Monitor and the NHS TDA. For 8 trusts (4 NHS trusts and 4 NHS foundation trusts) we reviewed the plans submitted and supporting documentation as well as interviewing the staff at Monitor and the NHS TDA responsible for overseeing these trusts.
6 We interviewed key stakeholders including the Department, NHS England, Monitor and the NHS Trust Development Authority.
This work was designed to understand:
• whether the factors that influence financial sustainability are understood by the arm’s-length bodies and are being managed and addressed; and
• the impact of the Five Year Forward View on future NHS financial sustainability.
We also interviewed other stakeholders including The King’s Fund, NHS Providers, The Health Foundation, NHS Confederation and Nuffield Trust.
7 We reviewed internal and external documents produced by the main stakeholders.
• Documents reviewed included: correspondence from the Department of Health and its arm’s-length bodies to NHS trusts and NHS foundation trusts detailing spending controls; information on the Lord Carter of Coles efficiency and productivity review; the Five Year Forward View; and board papers where available.

54 Appendix Three Sustainability and financial performance of acute hospital trusts
Appendix Three
Technical notes
1 In preparing and analysing the data used throughout this report, we have made a number of assumptions and adjustments.
2 Information on NHS trusts and NHS foundation trusts may differ to that reported by Monitor and the NHS Trust Development Authority due to the way we have treated trusts which changed their status in-year.
Presentation of figures
3 Except where otherwise noted, figures are presented in nominal terms and have not been adjusted for inflation.
4 Where possible, income and expenditure figures are presented on a basis consistent with the underlying trusts’ published accounts.
5 Income figures for both NHS trusts and NHS foundation trusts include:
• income from patient care activities; and
• other operating income (including income for training activities, rental income and income from other miscellaneous sources).
6 Expenditure figures for both NHS trusts and NHS foundation trusts include:
• staff costs, except those capitalised as part of the costs of non-current assets;
• operating costs, including purchase of healthcare services from other organisations, expenditure on medical supplies including drugs and other consumables, and transport costs;
• premises costs, including depreciation and amortisation and support services;
• net interest and other finance costs;
• PDC dividends payable;
• other gains and losses, including shares of profit or loss of associates and joint arrangements, gains and losses on disposals of assets, and other movements in fair values of assets;
Sustainability and financial performance of acute hospital trusts Appendix Three 55
• corporation tax expense; and
• premiums payable for clinical negligence liabilities.
NHS trusts’ and NHS foundation trusts’ income and expenditure figures have also been adjusted for the effects of organisational changes, to report underlying performance by excluding the effects of one-off transactions.
Adjusting for the effects of organisational changes during 2014-15
7 Six NHS trusts became NHS foundation trusts during 2014-15:
• Bridgewater Community Healthcare NHS Foundation Trust, Derbyshire Community Health Services NHS Foundation Trust and Royal United Hospitals Bath NHS Foundation Trust, on 1 November 2014;
• St George’s University Hospitals NHS Foundation Trust on 1 February 2015; and
• Kent Community Health NHS Foundation Trust and Nottingham Healthcare NHS Foundation Trust, on 1 March 2015.
8 We have included these trusts in the totals for NHS foundation trusts. This has the effect of treating them as though they had been a foundation trust all year.
9 Several mergers between trusts occurred during 2014-15:
• Barnet and Chase Farm NHS Trust was taken over by the Royal Free NHS Foundation Trust on 1 July 2014;
• Heatherwood and Wexham Park Hospitals NHS Foundation Trust was taken over by Frimley Park Hospitals NHS Foundation Trust on 1 October 2014, at which point the trust was renamed Frimley Health NHS Foundation Trust;
• two NHS trusts, Ealing Hospitals NHS Trust and North West London Hospitals NHS Trust, merged on 1 October 2014, creating a new trust, London North West Healthcare NHS Trust; and
• Royal National Hospital for Rheumatic Diseases NHS Foundation Trust was taken over by Royal United Hospitals Bath NHS Foundation Trust on 1 February 2015.
10 For all of these transactions, we have added the demising trusts’ income, expenditure and surplus/deficit arising between 1 April 2014 and the date of the merger and added it to the income, expenditure and surplus/deficit of the post-transaction trust. This has the effect of treating the merger as if it had occurred on 1 April 2014.

56 Appendix Three Sustainability and financial performance of acute hospital trusts
11 One NHS foundation trust broke up during 2014-15: Mid Staffordshire NHS Foundation Trust ceased to provide services on 1 November 2014, and its services and assets were split between 2 successor trusts, The Royal Wolverhampton NHS Trust and University Hospital of North Staffordshire NHS Trust. University Hospital of North Staffordshire NHS Trust was subsequently renamed University Hospital of North Midlands NHS Trust. In calculating figures for 2014-15, we have divided Mid Staffordshire NHS Foundation Trust’s income, expenditure and surplus/deficit for the period 1 April 2014 to 31 October 2014 between the 2 successor trusts in the same proportions that they received asset and liability balances on 1 November: University Hospital of North Midlands NHS Trust received 73% and The Royal Wolverhampton NHS Trust received 27%. This has the effect of treating the break-up as if it had occurred on 1 April 2014.
12 In the first 6 months of 2015-16 there were further organisational changes. We have treated these in the same way as we have trust data for 2014-15, and therefore report 239 trusts (88 NHS trusts and 151 NHS foundation trusts) at the end September 2015. The changes were:
• Bradford District Care NHS Foundation Trust, which became an NHS foundation trust on 1 May 2015; and
• West Middlesex University NHS Trust which merged with Chelsea and Westminster Hospital NHS Foundation Trust on 1 September 2015.
Adjustments to NHS trusts’ figures
13 NHS trusts’ figures are adjusted to report the underlying performance of trusts by excluding the effects of one-off transactions, and to be consistent with figures used by the Department of Health. Figures for NHS trusts’ income, expenditure and surplus/deficit are reported:
• before net impairments;
• before the impact of absorption accounting for bodies that merged or were acquired by other organisations;
• before additional charges associated with bringing private finance initiative (PFI) assets onto the balance sheet due to the introduction of IFRS accounting in 2009-10 (IFRIC 12);
• before the impact of changes in accounting for donated assets and government grant reserves;
• before the consolidation of trusts’ charitable fund subsidiaries; and
• after the effects of any income support provided by the Department of Health and NHS England.
Sustainability and financial performance of acute hospital trusts Appendix Three 57
14 All figures are presented on a gross basis; no adjustments are made to remove the effects of transactions between NHS trusts and NHS foundation trusts.
Adjustments to NHS foundation trusts’ figures
15 NHS foundation trusts’ figures are adjusted to report the underlying performance of trusts by excluding the effects of one-off transactions, and to be consistent with figures used by the Department of Health and to be on the same basis as Monitor reports them in the NHS Foundation Trusts: Consolidated Accounts. Income, expenditure and surplus/deficits for NHS foundation trusts are reported:
• before net impairments;
• before the impact of absorption accounting for bodies that merged or were acquired by other organisations;
• after additional charges associated with bringing private finance initiative (PFI) assets onto the balance sheet due to the introduction of IFRS accounting in 2009-10 (IFRIC 12);
• after the impact of changes in accounting for donated assets and government grant reserves;
• before the consolidation of trusts’ charitable fund subsidiaries; and
• after the effects of any income support provided by the Department of Health and NHS England.
16 All figures are presented on a gross basis; no adjustments are made to remove the effects of transactions between NHS trusts and NHS foundation trusts.

This report has been printed on Evolution Digital Satin and contains material sourced from responsibly managed and sustainable forests certified in accordance with the FSC (Forest Stewardship Council).
The wood pulp is totally recyclable and acid-free. Our printers also have full ISO 14001 environmental accreditation, which ensures that they have effective procedures in place to manage waste and practices that may affect the environment.

£10.00
9 781786 040190
ISBN 978-1-78604-019-0
Design and Production by NAO Communications DP Ref: 10856-001