sustainability 2016 - repsol · pdf file10 11 high importance-+ importance for repsol +...
TRANSCRIPT

Sustainability report 2016

2 3
20-23
Contents
1. Company profile
4. Ethics and compliance
7. Climate change
2. Materiality and stakeholders
5. People
8. Resource and impact management
3. Governance
6. Safety
Repsol in figuresOur activities
Value chain Supply chain
Circular economy Water and waste
BiodiversityHydraulic fracturing operation
Employees Community relations Human rights
About this report1 The sustainability report describes our performance in 2016. It presents overall indicators of the activities we have carried out in the countries with significant operations where we have a social, environmental or economic impact, and the management of which is under our control.
With the aim of transparency, clarity, traceability and efficiency, we have prepared the sustainability report seeking the spread of Repsol’s performance in sustainability to all stakeholders. We have thus published this executive report showing the Company’s work with links to other reports and online content that includes the details of our management, our indicators and our best practices in managing the sustainability issues.
This report is completed with an appended document, published on our webpage, which contains all the
key performance indicators for 2016, reported exhaustively according the recommedations of the Global Reporting Initiative (GRI), version G4, comprehensive option. The reported indicators may include information from previous years that we deemed relevant for understanding information from the current year. The table of GRI contents with the references to the indicators reported in other public reports is included in the appendix of indicators and on our webpage, www.repsol.com.
The figures and indicators in this report have been calculated in accordance with corporate standard that set out the criteria and common methodology to be applied in social, safety and environmental matters. In general, this information includes 100% of the data of companies in which we have a majority holding or operating control. Regarding safety matter, we include data relating to 100% of the employees
of the subsidiary companies where a contract of service is in place. Likewise, energy consumption and emissions figures are subjected to an independent verification that is completed after the preparation of this report. Final values will be available in www.repsol.com.
The calculation of the economic and workforce figures and indicators are disclosed in the Consolidated Management Report.
3-9
14
10-11
15-17
12-13
18-19
24-27
At Repsol, we are resolutely committed to sustainability. It is essential to generate value today and in the future to society and, therefore, to our company” –Josu Jon Imaz
Message from our CEO
“
Repsol in figures
0.31 MtCO2e reduced
10 Mtreused water
256 MGJenergy consumption
24,532staff
35% women
11,764 M€tax paid
84 different nationalities
41 h. training per employee
1.46 TRIRTotal Recordable Incident Rate
19.8 M€Voluntary social investment
78 M€invested in R&D
Upstream 45%
Foresight activities36%
Downstream19%
Africa 0.01
Southeast Asia 0.49
America 8.09
Europe 11.25
Europe 17,833
Latin America 3,803
Oceania 64North America 1,589
Africa 148Asia 1,095
Translation of a report originally issued in Spanish. In the event of a discrepancy, the Spanish language version prevails.
Disclaimer
Staff by Region
Consolidated Management Report 2016

4 5
Upstream
Downstream
Both
Presence of indigenous communitiesin activity areas
AlgeriaAruba
SpainIraq
Indonesia
Mexico
Canadá
USA China
Peru
Portugal
Gabon
Angola
Morocco
Ireland
United Kingdom
Bulgaria
PapuaNew Guinea
Malaysia
Vietnam
Romania
Italy
Norway
Ecuador
Germany
France
Canada
Colombia
Exploration and Production. ONSHORE
Exploration and Production. HYDRAULIC FRACTURING
Exploration and Production. OFFSHORE
Refining
LNG
Gas & Power
Logistic and transport
Chemical
LPG
Marketing1
Lubricants
Australia
Non operated
Non operated
Joint operation
Millions of euros
Economic value generated and distributed
Include subsidies received by public administrations in the countries or regions where we operate.
reserve replacement ratio in 2016103%
BoliviaBolivia
Sales and otherincomes from
exploitation35,679 Operational costs
23,699
Employee wages and benefits2
2,488
Payments to providers of capital 999
Accrued tax6,960
Community investments20
36,815Direct economic value generated
34,166Economic value distributed
2,649Economic value obtained
25
Financialincome
176
Profits and losses from disposal of
non-current assets
960
Non activity
Non activity
Non activity
Non activity
Federación RusaRussian Federation
Non operated
Singapore GuyanaNon activity
BrazilNon operated
Trinidad and TobagoNon operated
Non operated
VenezuelaLybia
GAS75% 2,382 Mboe
net proven reserves
0.7 Mboe/dayUpstream production
43 Mtprocessed crude oil in our refineries
1 Mboe/dayrefining capacity
4,715service stations
3 boe: barrels of oil equivalent.Subsidies received
2Include executives’ remunerations, compensations and travel expenses.
1This includes service stations, direct sales and aviation.
3
Our activities2016 Repsol activities worldwide.
Sustainability Report 2016 / Our activities Sustainability Report 2016 / Our activities

6 7
UPSTREAM DOWNSTREAM
water withdrawn
1.9 Mtwater withdrawn
50 Mt
SUPPLY CHAIN1TRIR: Total Recordable Incident Rate.2PSIR: Process safety incident rate (Tier 1 + Tier 2 included).3 Direct emissions (Scope 1): Emissions from sources where we have ownership or control.
12.7electric car charging stations
859Autogas supply points
745More information at www.repsol.com
1.17TRIR1
1.69TRIR1
< UPSTREAM DOWNSTREAM>
< UPSTREAM DOWNSTREAM>
DOWNSTREAM
DOWNSTREAM
EXPLORATIONoffshore
onshore
DEVELOPMENToffshore
onshore
PRODUCTIONoffshore
onshore
6. REFINERY
Engineering and construction services and countless maintenance services.
Using physical and chemical processes, we transform crude oil and other raw materials into higher quality and higher added-value products for the market.
Maintenance of oil and gas pipe lines and contracting of oil and LPG tankers.
emissions derived from use of sold products
146 Mt CO2e
10. LUBRICANTS, ASPHALTS AND SPECIALTY PRODUCTSDevelopment, production and marketing of lubricants, oil-derived specialty products and asphalts.
Agreements with producers across the world; engineering, logistics, transportation and distribution services.
4. STORAGE AND TRANSPORTATIONWe optimize our logistics system to make it more efficient and increase our competitiveness. Crude oil and products are traded and transported to refineries for processing.
Repsol markets fuels and services for private individuals and professionals, directly or through a network of sales distributors and service stations; it offers its own payment methods and customer loyalty plans.
9. MARKETING
Construction, operation and maintenance of service stations.
Engineering services and construction services.
2. DEVELOPMENTDevelopment of areas where exploration has been a success by incorporating the reserves and preparing for their exploitation.
We drill wells and build collection systems as well as processing plants for the deposit's production; and we always follow sustainability and transparency policies to ensure that the project is carried out appropriately.
We determine the type of development and quantify the investment volume (CAPEX).
3. PRODUCTIONNecessary extraction and processing to be able to market crude oil and gas.
We produce hydrocarbons (oil and gas). We extract the deposit's reserves, collect the wells' reserves and separate oil from gas and water.
We also perform maintenance, control and transportation tasks.
Premise operation and maintenance services.
7. CHEMISTRYOur chemical activity generates and markets a wide variety of products; it ranges from basic petrochemistry to derivative petrochemistry.
Engineering and construction services; countless maintenance, operational logistic, transportation and distribution services.
Engineering and construction services; countless maintenance, operational logistics, transportation and distribution services.
8. LPGWe distribute Liquefied Petroleum Gas (LPG) in containers, in bulk, through the network and as AutoGas.
Maintenance of distribution fleet: purchase and maintenance of gas containers (cylinders) and maintenance services for LPG factories.
Geology services, seismic data and onshore and offshore drilling services.
1. EXPLORATIONExploration of mineral deposits both onshore and offshore.
Identification of possible deposits of oil and gas. We conduct geological and geophysical studies on the location and potential volume of hydrocarbon deposits.
If the results are positive, we perform exploratory drills. Around 31% of our explorations are successful. They can either be onshore or offshore.
5. LNGTransportation, marketing, trading and regasification of liquefied natural gas.
PSIR2
0.77PSIR2
0.58Mt CO2e3
12.2Mt CO2e3
11%more accesible service stations
Sustainability Report 2016 / Value chain
Value chainRepsol is an integrated energy company that operates across the world in various business areas.
Sustainability Report 2016 / Value chain

8 9
total purchases3,022 M€
of contracts include human rights, anticorruption and environmental clauses100%
suppliers worldwide14,754
88% 82%
rating audit in place
33
performance evaluation to 1,542 suppliers
3,526
breaches of contract for safety reasons
2
Bolivia53%50
Angola
41%77Algeria
97%31Lybia
36%10Aruba
12%18Guyana
96%264Trinidad and Tobago
83%7,509Spain
90%21Iraq
100%16Indonesia
94%294Bolivia
50%277Brazil
97%107Colombia
91%188Canada
97%446USA
100%5Mexico
98%159Russian Federation
% of purchases to local suppliers
Nº of local suppliers
Country name
94%1,467Peru
86%1,202Portugal
4%8Gabon
71%2France
99%56United Kingdom
100%1Japan
19%3Italy
82%86Norway
84%207Venezuela
93%847Ecuador
Goods suppliers qualified
Disqualified(2 provisionally)
Full qualificationsFull qualifications
Renewed qualifications
Renewed qualifications
Services suppliers qualified
24381
463
620
11
1,376
Provisional qualifications1
Provisional qualifications1
311Non-accepted
2Non-accepted104
18
Europe
South America
9,721
3,306
North America
Caribe
963
321
Asia
Africa
248
Oceania
177
EuropeSouth AmericaNorth America
CaribeAsia
AfricaOceania
1,855822
2384934230.55
qualification processes3,211
Human rightsSocial (Anti-corruption)
LaborEnvironmental
Nº of evaluations including topics of:
3,522 3,522
2,7762,203
1 A supplier may be "provisionally qualified" when it is found that it does not meet a minor requirement.2 Repsol Oil and Gas Canada Inc. is not included.
of new suppliers examined in accordance to human rights, social, labor and environmental criteria
100%
8
Sustainability Report 2016 / Supply chain
Supply chain2016 Repsol’s purchases and contracting to suppliers and contractors2.
9
Sustainability Report 2016 / Supply chain
Further information on Supply Chain
10 11
High importance
-
+
+Importance for Repsol
Influ
ence
on
stak
ehol
ders
dec
ision
s
Medium importance
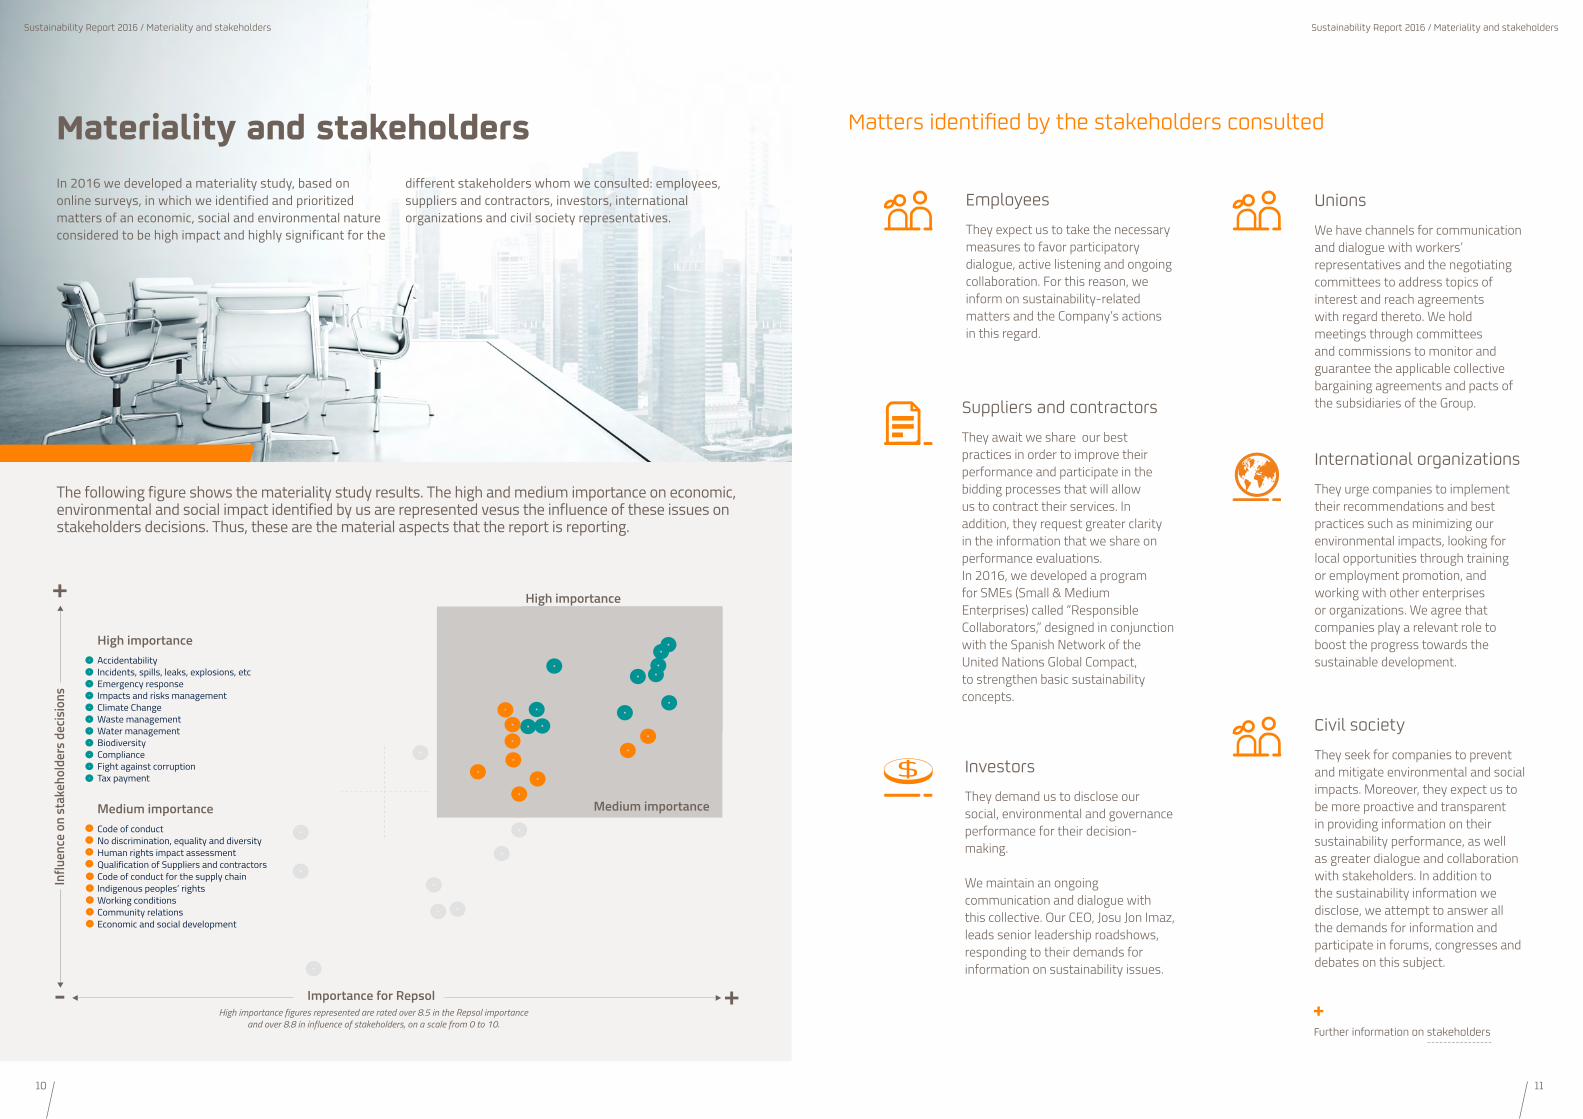
High importanceAccidentabilityIncidents, spills, leaks, explosions, etcEmergency responseImpacts and risks managementClimate ChangeWaste managementWater managementBiodiversityComplianceFight against corruptionTax payment
Medium importanceCode of conductNo discrimination, equality and diversityHuman rights impact assessmentQualification of Suppliers and contractorsCode of conduct for the supply chainIndigenous peoples’ rightsWorking conditionsCommunity relationsEconomic and social development
High importance figures represented are rated over 8.5 in the Repsol importance and over 8.8 in influence of stakeholders, on a scale from 0 to 10.
The following figure shows the materiality study results. The high and medium importance on economic, environmental and social impact identified by us are represented vesus the influence of these issues on stakeholders decisions. Thus, these are the material aspects that the report is reporting.
Matters identified by the stakeholders consulted
Investors They demand us to disclose our social, environmental and governance performance for their decision-making.
We maintain an ongoing communication and dialogue with this collective. Our CEO, Josu Jon Imaz, leads senior leadership roadshows, responding to their demands for information on sustainability issues.
Sustainability Report 2016 / Materiality and stakeholders
Employees They expect us to take the necessary measures to favor participatory dialogue, active listening and ongoing collaboration. For this reason, we inform on sustainability-related matters and the Company’s actions in this regard.
International organizations They urge companies to implement their recommendations and best practices such as minimizing our environmental impacts, looking for local opportunities through training or employment promotion, and working with other enterprises or organizations. We agree that companies play a relevant role to boost the progress towards the sustainable development.
Civil societyThey seek for companies to prevent and mitigate environmental and social impacts. Moreover, they expect us to be more proactive and transparent in providing information on their sustainability performance, as well as greater dialogue and collaboration with stakeholders. In addition to the sustainability information we disclose, we attempt to answer all the demands for information and participate in forums, congresses and debates on this subject.
Suppliers and contractors They await we share our best practices in order to improve their performance and participate in the bidding processes that will allow us to contract their services. In addition, they request greater clarity in the information that we share on performance evaluations.In 2016, we developed a program for SMEs (Small & Medium Enterprises) called “Responsible Collaborators,” designed in conjunction with the Spanish Network of the United Nations Global Compact, to strengthen basic sustainability concepts.
Unions We have channels for communication and dialogue with workers’ representatives and the negotiating committees to address topics of interest and reach agreements with regard thereto. We hold meetings through committees and commissions to monitor and guarantee the applicable collective bargaining agreements and pacts of the subsidiaries of the Group.
Sustainability Report 2016 / Materiality and stakeholders
Materiality and stakeholdersIn 2016 we developed a materiality study, based on online surveys, in which we identified and prioritized matters of an economic, social and environmental nature considered to be high impact and highly significant for the
different stakeholders whom we consulted: employees, suppliers and contractors, investors, international organizations and civil society representatives.
Further information on stakeholders

12 13
of Board of Directors are women
6.25% of independent directors
50% of Board of Directors are foreigners
18.75%
Board of Directors’ specialized committee, responsible for staying abreast of and orienting the Group’s policy, objectives, and guidelines in relation to social, environmental and safety matters. In 2016, the committee met three times and examined, discussed and approved proposals on matters within its sphere of competence, including:
2015 Sustainability Report.
Report on indicators of the personal, process and environmental accident rates.
Case study on circular economy. Approach and plan.
Case study on climate change: International Context (COP21); company GHG emissions; emissions-reduction map and plans; and climate change initiatives: Oil & Gas Climate Initiative (OGCI), Climate & Clean Air Coalition (CCAC) and Zero Routine Flaring.
Community relations and human rights management global framework.
New Code of Ethics and Conduct and new Repsol Ethics and Compliance Channel.
2017 proposed sustainability goals.
New internal control and compliance model.
The Company’s global risk map.
Our sustainability model identifies, systematizes and starts up actions which contribute to sustainable development. In addition, we have the support and involvement of senior management who defines objectives, action plans and practices of the company relative to sustainability.
Sustainability Committee
Sustainability Report 2016 / Governance
Governance
5% of the CEO’s annual variable compensation and 10% of his multiyear variable compensation are linked to sustainability goals
1
2
STAKEHOLDERS
ESG Investors and analysts
Media Communitties Employees and Unions
Public and International Organizations
Civil society
BUSINESS AND CORPORATE AREAS
3
4
Compliance and Ethic Committe
Audit and Control
Committee
Sustainability Committee
Board of Directors
Corporate Executive Committee
Chairman
Secretary of the Board of Directors
ComplianceOfficer
CEO
IndependentPropietaryExecutiveExternal
LEYENDA
Sustainability matter flow
Senior level deliberative body with autonomous powers of initiative and control. Its function is to manage the system for the monitoring of and compliance with the Repsol Group’s Code of Ethics and Conduct. This committee is a multidisciplinary nature. It has a channel, managed by an independent third party, through which any consultation or possible breaches regarding Repsol’s Code of Ethics and Conduct may be sent.
Its functions include:
Submitting recommendations for safeguarding, implementing and complying with the Code of Ethics and Conduct.
Proposing the modifications of and implementations to the Code of Ethics and Conduct that the Committee considers appropriate.
Board of Directors’ specialized committee. Its objective is to support the Board of Directors in its supervision duties, through the periodic review of the financial information process. Its executive controls, the independence of the external auditor, the review of compliance with all the legal provisions and internal regulations applying to the Repsol Group.
In particular, it also has the following functions:
To ensure that the Code of Ethics and Conduct is complied with.
To examine the plans for the codes of ethics and conduct and the amendments thereto. Likewise, to ensure that they are in keeping with regulatory requirements and are appropriate for the Company.
Sustainability Report 2016 / Governance
Audit and Control Committee Ethics and Compliance Committee
1
2
STAKEHOLDERS
ESG Investors and analysts
Media Communitties Employees and Unions
Public and International Organizations
Civil society
BUSINESS AND CORPORATE AREAS
3
4
Compliance and Ethic Committe
Audit and Control
Committee
Sustainability Committee
Board of Directors
Corporate Executive Committee
Chairman
Secretary of the Board of Directors
ComplianceOfficer
CEO
IndependentPropietaryExecutiveExternal
LEYENDA
Sustainability matter flow
Board of Directors
Further information on 2016 Annual Corporate Governance Report
Further information on www.repsol.com

14 15
We understand that the code of ethics is inseparable from integrity and good judgment. We take ethical behavior beyond strict compliance with the law; hence, in addition to complying with the letter of the law we also respect the spirit of the law.
Ethics and compliance
We promote integrity and ethical behavior in all of our actions.
Objective 2017: Training for all employees on the new Code of Ethics and
Conduct
In 2016, the new Code of Ethics and Conduct took effect, replacing Repsol’s Ethics and Conduct Regulation and Talisman’s Code of Ethics and Conduct. The main change is the use of more straightforward and readily understandable language, so as to provide guidelines of professional and personal conduct.
In order to properly disseminate the content of the new Code of Ethics and Conduct, we have worked on developing mandatory training actions for all employees, which are to take place throughout 2017.
In 2016, the Ethics and Conduct course was completed by 2,483 employees.
In addition, we have a new Ethics and Compliance Channel, available 24 hours a day, 7 days a week, managed by an external provider, which allows employees and any external stakeholder to send, in fully confidentially, queries and information on possible breaches of the Code of Ethics and Conduct and of the Crime Prevention Model.
In 2016, 32 communications have been received through the new Ethics and Compliance Channel.
Sustainability Report 2016 / Ethics and compliance
Compliance FunctionWe have a global action framework and procedures, allowing us to identify and comply with all of our obligations, both internal and external and in all regulatory spheres.
Nevertheless, we have strengthened our compliance and control mechanisms by appointing a Chief Compliance Officer and creating the new Compliance Processes Department, to strengthen oversight of compliance risks, foster the preventive nature of the compliance function, disseminate a greater compliance culture, and promote the proper management of risks of ethics and conduct.
Code of Ethics and Conduct at repsol.com
Evolution and resizing We try to reconcile the Company’s short-, medium- and long-term capacity needs with people’s opportunities for development, on the basis of leadership, values and meritocracy. 2016 stood out from the standpoint of people management given that this is a critical element to bring about the Company’s integration and transformation.
This process has entailed a responsible and phased-in resizing of our workforce, taking into account the organizational needs of the businesses and countries. Union organizations, with which we have reached important agreements, have taken part in this process.In Spain, the process of incentivized retirement began in
August and is expected to conclude on December 31, 2018. The level of acceptance of the process has allowed us to avoid mandatory retirement at any company, with the exception of Repsol Butano S.A., at which several factories were shuttered as a result of the Company’s industrial plan.
Sustainability Report 2016 / People
People
Equal opportunitiesWe are committed to equal opportunity as an element that sets us apart as an integrated, diverse and inclusive company. To this end, for years we have deployed programs and tools that take into account the diversity of employees, with visible results.
We foster balance between men and women in positions of responsibility and leadership.
Regarding work-life balance, we should highlight the programs that allow us to attain flexibility and work-life balance. Telecommuting is one of the most accepted and valued programs by our employees. At Repsol 1,8111
people have elected telecommuting.
In addition, we support direct entry into the labor market of people with disabilities, above the legal requirements. This year, we have 586 employees with disabilities, 2.4% of our workforce.
Among our management teams there is a significant presence of people originally from the local community, allowing us to be more attuned to the needs of the communities in which we operate to foster development of local employees in countries in which the company has an important presence is key.
Europe941
Latin America1,090
Asia155
North America424Oceania13Africa 12
0
20
40
60
80
100
Boliv
ia
Braz
il
C olo
mbi
a
Ecua
dor
Indo
nesi
a
Mal
aysi
a
Peru
V ene
zuel
a
Viet
nam
86
53 50
9184
6571
76
36
Leadership positions occupied by local employees by country (%)
Staff down-sizing by geographical area1
New Code of Ethics and Conduct
New Ethics and Compliance Channel
Further information on Annual Corporate Governance Report
New Ethics and Compliance Channel at Repsol Ethics & Compliance Channel
26.7% women in leadership positions
8% from 2015
1 Inorganic operations and resizing
Further information on www.repsol.com andConsolidated Management Report 2016

16 17
Sustainability Report 2016 / People
People
Our responsibility: respect and remedyWe use all available means to ensure that our activities and decisions will not have negative consequences on human rights, and we do everything possible to address the damage of any such impacts that do occur.
of 8 impacts assessments carried out during 2016 have included social and human rights matters
100%
of our major operations take into consideration development plans, human rights impact assessments, or stakeholder participation for managing the risks and opportunities of our activities
100%
We are present in more than 40 countries, and on many occasions, in highly sensitive social, political and cultural contexts. We continue to implement the commitments
As part of the process of integration with Talisman, we reviewed and strengthened the framework to manage community relations and human rights. We defined the roadmap for developing the capacities of the personnel involved, directly and indirectly, in our
assumed in our Community Relations and Human Rights Policy, which is aligned with the United Nations Framework on Business and Human Rights and its guiding principles.
relationship with local communities and in this manner to ensure a systematic approach. For this, we carried out nine training workshops on this framework focusing on risk management, impact management, opportunity management, and participatory dialogue.
Human rights and community relations Progress in the community relations and Human Rights management framework
Attending to the grievance, concerns and complaints of communities helps us to anticipate and respond potential disagreements that might affect the development of our activities. The nature of these mechanisms is particular and unique for each context.
We have taken part in the Forum on Business and Human Rights held by United Nations, in which we participated on the operational-level grievance mechanism panel, sharing the good practices developed.
Over this course, we reviewed the social performance indicators and metrics according to the new Community Relations Policy and the Human Rights Policy.
We will focus, in 2017, on monitoring and measuring the evolution of our performance in social risks stemming from the context, in grievance management and in participatory dialogue with the communities.
Sustainability Report 2016 / People
Best practice
Community Engagement- Papua New Guinea Thanks to the Community Needs Assessment (CNA) program, we have established an open dialogue to address some of the concerns of the communities.
Through a trust-based, win-win relationship, we have implemented numerous local development projects, including: an organic vegetable farm; the installation of portable-water tanks; the installation of a computer laboratory; as well as the development of plans and the use of financial resources for family sustenance.
human-rights grievances were made through 13 grievance mechanisms in 7 countries. 119 were resolved and 29 are being processed
148We are members of the Voluntary Principles on Security and Human Rights Initiative, which aims to ensure the security of our operations in sensitive areas and conflict zones through work procedures that guarantee respect for human rights.
of internal security staff received human rights training
90%
Plan to implement the Voluntary Principles of Human Rights Over this course, we undertook the actions contained in the Plan, which was launched in 2015. In addition, we have carried out a series of internal audits to determine the evolution and the degree of implementation of the plan in Bolivia, Colombia, Ecuador, Peru and Venezuela. To this end, we conducted several interviews with the directors of the business unit, the heads of the contractors of private security, and the heads of the public security forces responsible for the operations.
The scores obtained in these audits have allowed us to classify countries according to the degree of implementation of the plan and to define additional action to continue implementing those principles, which will be evaluated in 2017.
Security and Human Rights
Operational-level grievance mechanisms
Implementation of social indicators
Further information on Human Rights Further information on Community Relations

18 19
Sustainability Report 2016 / Safety
Safety
It is a set of initiatives focused on process safety, which helps us keep risks under control and properly managed. We apply this program in Exploration and Production, Refining, Chemicals and LPG operations, which are
the operations that could lead to large-scale industrial accidents. To manage all the elements that may avoid a process accident and/or to control any such incidents that arise, we focus on three main elements:
We do not settle for the decrease in our incident rate indicators. Going beyond safety is our challenge. We have established actions to reduce both process accident rates as well as personal accident rates within the company. To this end, we have implemented a long-term safety strategy with two main focuses: reducing the accident
Strengthening foresight
SMArt keys: preventive safety program
People. In 2016 we performed several assessments of the safety culture at our facilities, and we implemented various training actions to reduce the accident rate resulting from human factors.
Processes. We are strengthening the principle of safety integrated into operations. In 2016, we carried out actions to manage critical processes, which, because of their hazardous nature, must be performed with greater care.
Plants. Preventive maintenance and inspection plans; the verification of our safety systems; the improvement of our protection barriers; and the identification of the most critical elements have been the objectives of our actions in 2016.
2 31
To reduce the personal accident rate, in 2016 we launched these 10 rules to be applied by employees and contractors. The safety begins with each one of us, and these rules can be the final barrier to avoid an accident.
1Safe driving
6Mobile Equipment
2Work permits
7Work at height
3Isolation and lockout
8Lifting operations
4Entry to confined space
9Dropped objects
5Excavation
10Prevention of leaks
Sustainability Report 2016 / Safety
In 2016, an oil tanker truck accident provoked a significant spill of fuel in the Peru marketing business area. The amount spilled was 31 tons of 84 octane gasoline, and the driver was slightly injured in the accident. The spill did not affect waterways, and remediation measures were undertaken afterwards.
As a preventive measure, we have activated the campaign named Plan to Get There Alive – The 10 Steps, to train and raise awareness among employees regarding transportation safety.
Prevention of and response to environmental incidents
10 Basic safety rules
This year, regretfully, we had two fatalities at our contractors:
oil spills >1bbl reaching the environment
11oil spilled > 1bbl reaching the environment
40t
Prevention of spills
Emergency management
Early spill detection
Visit our virtual trainning: www.10basicrules.com
Relevant facts
A robust safety management minimizes the likelihood and consequences of our spills to the environment. We work in three phases:
Goal 2020:
0 accidents
TRIR 2016: 1.46 - Total Recordable Incident Rate: lost work day cases and restricted work day cases recorded over the year, per million work hours.
35%from 2015 36%
from2015
PSIR 2016: 0.65 - Process Safety Incident Rate
At the Sakajemang 3D seismic project (Indonesia), a worker died as a result of injuries sustained after a tree fell on him. After an exhaustive investigation and to avoid a recurrence of this type of accident, improvement actions have been taken to identify risks and training actions and to raise awareness among workers.
During the periodic and voluntary inspection work at the LPG facility of a client in Madrid (Spain), a worker died, allegedly as a result of gas inhalation. An investigation has been conducted, and an action plan is being drawn up to adopt measures to ensure that this type of event will not happen again.
LTIF 2016: 0.69 - Lost Time Injury Frecuency Rate: lost time injuries recorded over the year, per million work hours.
25%from 2015
rate indicators and systematically applying a series of anticipatory actions to avoid major industrial accidents. Safety targets weighten between 10 and 15% on the unit targets. These targets have a direct impact on our employees with variable compensation.Further information on Safety

20 21
Climate change
We actively work on climate change mitigation
Our emissions1
Scope 1 (Direct emissions). Scope 2 (Indirect emissions associated with purchasing electricity and steam).
Sustainability Report 2016 / Climate change
20
At Repsol, we share society’s concern over the effect that human activity is having on climate. We recognize that the current trend of greenhouse gas emissions is greater than the required to limit the increase of the average global temperature to no more
than 2ºC above preindustrial levels. As signatories of the Paris Pledge for Action, we support the Paris Agreement and we are working to ensure that our company is an active part of the solution to climate change.
We work on solutions that allow society to enjoy a sustainable future with low emissions of greenhouse gases.
We promote a greater role of natural gas in the world energy mix. We consider gas as the most efficient solution to promote a structured transition to a future of low emissions.
Moreover, we consider that all energy sources have their importance in the energy mix. Renewable energies have to play a prominent role once their technological maturity allows them to be competitive.
However, the objective consistent on 2ºC scenario will only be possible
through technological innovation. This will help us deepen the carbon capture, use and storage, an alternative that emerges as the most plausible to reach the ambition of zero emissions by 2050. To prove its feasibility is therefore a must.
And all this without forgetting the current contribution of energy efficiency, which will be the main driving force behind the reduction of emissions until around mid-century. In this sense, there are already numerous technologies in which our sector has worked in recent years, helping us optimize the design of the processes and the operation of the facilities.
Society increasingly requires more energy as the population grows and economies develop. This energy must be supplied in a safe, efficient and sustainable manner, along with a reduction in greenhouse gas emissions (GHG).
Scope 1 Scope 20.6 Mt24.9 Mt CO2e
Total Repsol
Direct emissions CO2eScope 1
Indirect emissions CO2eScope 2
10.4 Mt
124 kt 218 kt 159 kt 57 kt
12.7 MtCH4CO2
CH4 N2OCO2
CH4CO2 CH4CO2 CH4CO2
1.8 Mt 0.025 Mt
97% 0.9% 2.1%98.8% 0.4% 0.8%60.9% 38.8% 0.3% 97.5% 0.7% 1.8%
N2O N2O N2O N2O
Upstream DownstreamRefining Chemical Others2
Sustainability Report 2016 / Climate change
Target 2020: reduce
1.9 Mt CO2e
Mt CO2e reduced
0
-0.5
-1.0
-1.0
-2.0
-2.5
-3.0
-3.5
-4.0
-4.5
-5.0
2006 2007 2008 2009 2010 2011 2012 2013 2014 2015 2016 2017 2018 2019 2020
2006-2013 Target: -2.5 Mt CO2e
2006-2013 Reached: -3.1 Mt CO2e
Emissions in a business as usual scenario
Situation with reduction actions performed2014-2016 Progress:-1.2 Mt CO2e
2014-2020 Target:-1.9 Mt CO2e
-0.58
-0.27-0.16
-0.20
-0.38
-0.62
-0.44
-0.44
-0.51
-0.38
-0.31
Working for a low-emissions future
21
1 Figures subjected to an independent verification that is completed after the preparation of this report.2 It includes LNG, LPG, lubricants and marketing.
Repsol has been a part of this initiative along with nine other leading sector companies to collaborate on climate action, sharing best practices and technological solutions. In 2016 a fund was created to invest US$1 billion over 10 years to develop and accelerate the commercial deployment of low-emission technologies.
Mt CO2e reduced 2006-2016
4.3 invested in reduction actions out of 500 M€ committed until 2020
357 M€
www.oilandgasclimateinitiative.com
Further information on Climate change
22 23
Sustainability Report 2016 / Climate change
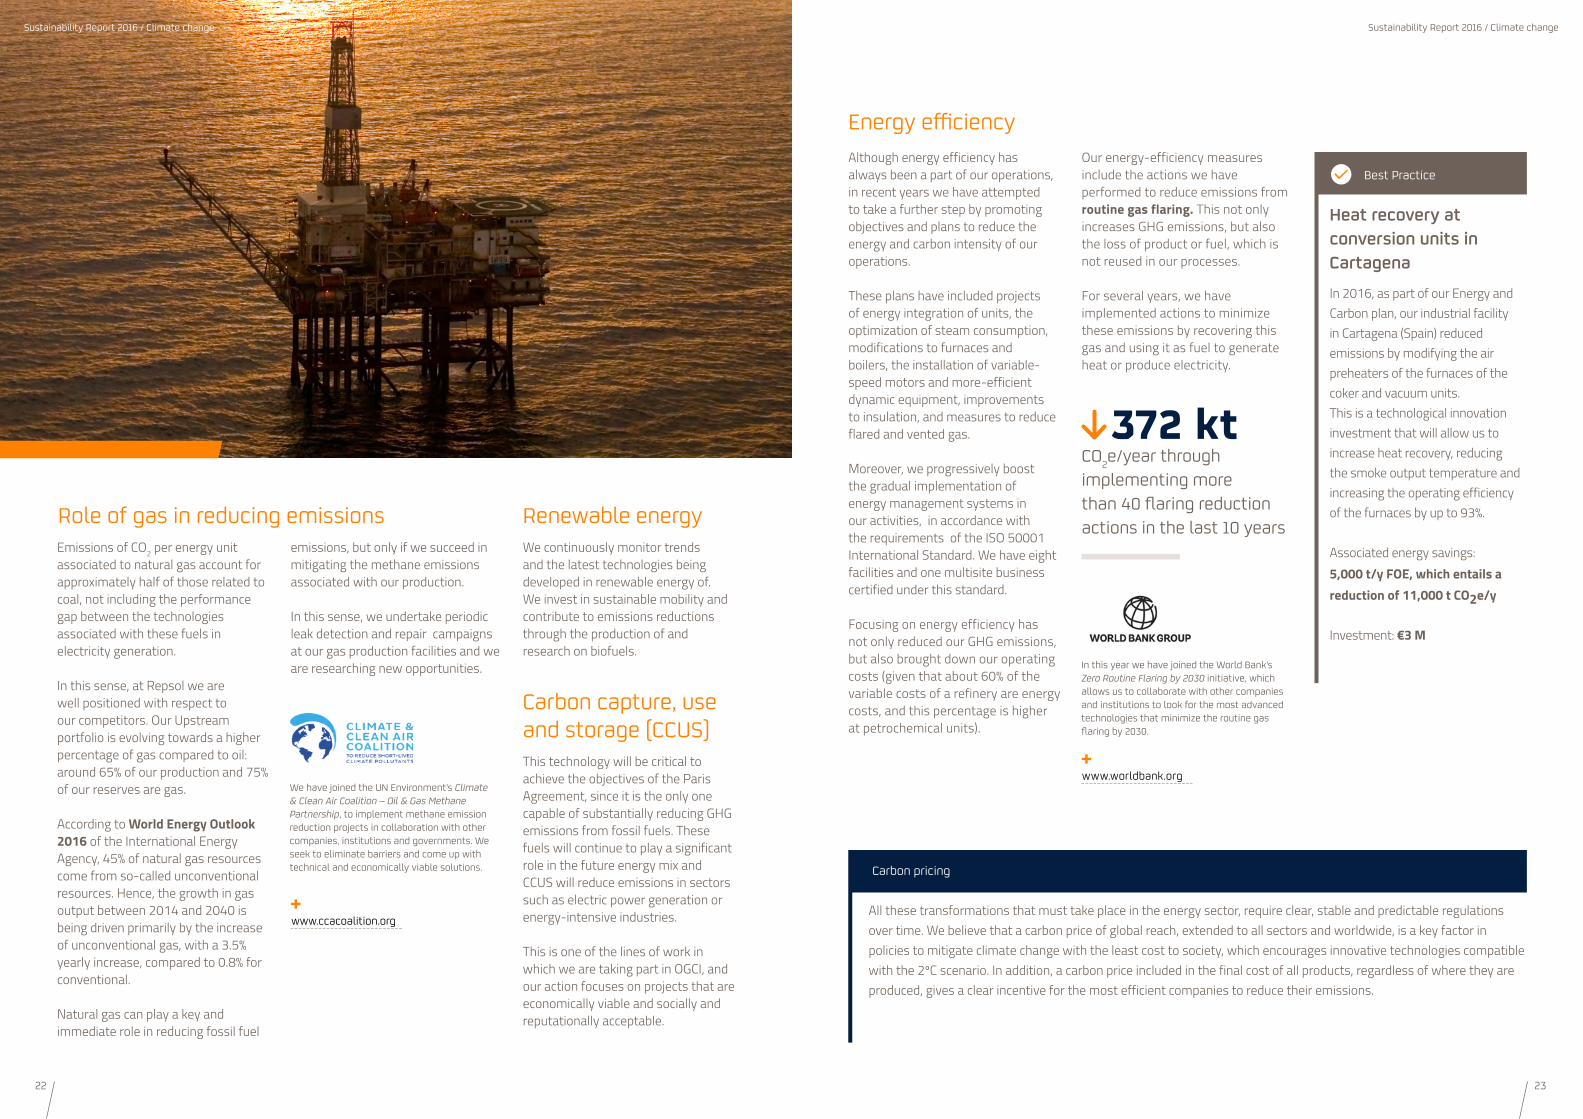
Energy efficiencyAlthough energy efficiency has always been a part of our operations, in recent years we have attempted to take a further step by promoting objectives and plans to reduce the energy and carbon intensity of our operations.
These plans have included projects of energy integration of units, the optimization of steam consumption, modifications to furnaces and boilers, the installation of variable-speed motors and more-efficient dynamic equipment, improvements to insulation, and measures to reduce flared and vented gas.
Moreover, we progressively boost the gradual implementation of energy management systems in our activities, in accordance with the requirements of the ISO 50001 International Standard. We have eight facilities and one multisite business certified under this standard.
Focusing on energy efficiency has not only reduced our GHG emissions, but also brought down our operating costs (given that about 60% of the variable costs of a refinery are energy costs, and this percentage is higher at petrochemical units).
Carbon capture, use and storage (CCUS)This technology will be critical to achieve the objectives of the Paris Agreement, since it is the only one capable of substantially reducing GHG emissions from fossil fuels. These fuels will continue to play a significant role in the future energy mix and CCUS will reduce emissions in sectors such as electric power generation or energy-intensive industries.
This is one of the lines of work in which we are taking part in OGCI, and our action focuses on projects that are economically viable and socially and reputationally acceptable.
Renewable energyWe continuously monitor trends and the latest technologies being developed in renewable energy of. We invest in sustainable mobility and contribute to emissions reductions through the production of and research on biofuels.
Emissions of CO2 per energy unit associated to natural gas account for approximately half of those related to coal, not including the performance gap between the technologies associated with these fuels in electricity generation.
In this sense, at Repsol we are well positioned with respect to our competitors. Our Upstream portfolio is evolving towards a higher percentage of gas compared to oil: around 65% of our production and 75% of our reserves are gas.
According to World Energy Outlook 2016 of the International Energy Agency, 45% of natural gas resources come from so-called unconventional resources. Hence, the growth in gas output between 2014 and 2040 is being driven primarily by the increase of unconventional gas, with a 3.5% yearly increase, compared to 0.8% for conventional.
Natural gas can play a key and immediate role in reducing fossil fuel
Role of gas in reducing emissionsemissions, but only if we succeed in mitigating the methane emissions associated with our production.
In this sense, we undertake periodic leak detection and repair campaigns at our gas production facilities and we are researching new opportunities.
www.ccacoalition.org
Sustainability Report 2016 / Climate change
Heat recovery at conversion units in Cartagena
In 2016, as part of our Energy and Carbon plan, our industrial facility in Cartagena (Spain) reduced emissions by modifying the air preheaters of the furnaces of the coker and vacuum units. This is a technological innovation investment that will allow us to increase heat recovery, reducing the smoke output temperature and increasing the operating efficiency of the furnaces by up to 93%.
Associated energy savings: 5,000 t/y FOE, which entails a reduction of 11,000 t CO2e/y
Investment: €3 M
All these transformations that must take place in the energy sector, require clear, stable and predictable regulations over time. We believe that a carbon price of global reach, extended to all sectors and worldwide, is a key factor in policies to mitigate climate change with the least cost to society, which encourages innovative technologies compatible with the 2ºC scenario. In addition, a carbon price included in the final cost of all products, regardless of where they are produced, gives a clear incentive for the most efficient companies to reduce their emissions.
In this year we have joined the World Bank’s Zero Routine Flaring by 2030 initiative, which allows us to collaborate with other companies and institutions to look for the most advanced technologies that minimize the routine gas flaring by 2030.
www.worldbank.org
Our energy-efficiency measures include the actions we have performed to reduce emissions from routine gas flaring. This not only increases GHG emissions, but also the loss of product or fuel, which is not reused in our processes.
For several years, we have implemented actions to minimize these emissions by recovering this gas and using it as fuel to generate heat or produce electricity.
Carbon pricing
Best Practice
We have joined the UN Environment’s Climate & Clean Air Coalition – Oil & Gas Methane Partnership, to implement methane emission reduction projects in collaboration with other companies, institutions and governments. We seek to eliminate barriers and come up with technical and economically viable solutions.
CO2e/year through implementing more than 40 flaring reduction actions in the last 10 years
372 kt

24 25
Target 2020: reducing
50,000 tons of waste produced
Spheres of circularity
Raw material redefinition 1.Inclusion of alternative raw materials in the production of our products.
Example: Biological raw material in theproduction of fuels and plastics
New services and products
5.Searching for new business opportunities.
Example: corporate car-sharing based on renewable electricity.
Redefinition of waste
Efficiency and innovation in the processes
2.
3.
Maximizing the water reused, minimizing the water dischargedand increasing energy efficiency.Example: Recirculation in the process of treated wastewater and recovery of steam condensates.
Valuing waste as a raw material, product or energy.
Example: Use of wastewater treatment plants’ muds in process units.
ECODESIGN
Reconsideration of the value chain
4.
Search for new business opportunities.
Example: Use of products from pyrolysis of plastics from dumps for chemical recycling.
Development of more sustainable productsin terms of their production, use or end of life.
Example: Reformulation of bitumens for the development of self-repairing asphalt .
ECODESIGN
Focus on
Products Processes Services
Vectors
Water Energy Raw Mat. Waste
Resource and impact management
The circular economy, our roadmapWe work on developing our company’s strategy relative to circular economy. We apply this new production and consumption model based on “closing the lifecycle” of products, services, waste, materials, water and energy as an alternative to the current linear economy of extracting, manufacturing and eliminating.
Sustainability Report 2016 /Resource and impact management
24
We want to have a catalog of circular economy projects according to the following criteria:
Supply assurance (sufficient quality and quantity)
Technological scalability (from laboratory to pilot plant or to industrial plant)
Profitability
Crosscutting with other companies
Impact on society
water reused versus withdrawn
20%
Sustainability Report 2016 / Resource and impact management
25
We are carrying out a specific water management improvement action plan from 2015 to 2020 for each facility. Thanks to the multidisciplinary work force at each center, we have succeeded in meeting nearly 95% of the defined lines, surpassing the 85% target set forth for 2016.
In addition, in 2016 we undertook studies on the purification of the production water from our Upstream wells in order to be reused for agricultural purposes in the communities.
Water
We have reduced waste produced by 15,508 tons, of the target of 50,000 tons for between 2015 and 2020. In the first two years, we thus reached nearly 50% of the target.
In addition, we implemented 100% of the EPPs (Environmental Performance Practices, company common standards in environmental issues) planned for drilling muds and cuttings management in Upstream.
Likewise, we also developed an extended waste map for the entire company, which includes characterization, current disposal and new options to improve our waste management.
Looking ahead to 2017, we have identified 11 opportunities to value waste, which will be developed by order of priority throughout the year.
Waste
Caso de éxito
Water use optimization in Puertollano
In 2016, at the Puertollano (Spain) refinery, we conducted a pilot project on optimizing water use at refineries, reviewing in detail the types of water used at each unit, identifying improvements, and proposing recommendations for water use optimization. In addition, following the analysis of the sector best practices, we have proposed actions for further optimization.
From this analysis improvement proposals have emerged and are focused on measures to reduce water consumption, increase water quality, optimize wastewater treatment and promote energy improvements. Moreover, to disseminate the knowledge acquired, we developed a general list of best improvements practices in the use of water and the reduction of the pollutant load of the internal water currents to be analyzed by the remaining refinery centers in Spain and by Chemicals.
Best Practice
Mt water discharged
42
water withdrawn 52 Mt in 2016
9%from2015
hydrocarbons in water discharged 245 t in 2016
36%from2015
Waste produced1
hazardous waste non-hazardous waste
56,920 t 217,552 t
1In addition, our Upstream operations generated a total of 169,372 tons of drilling muds and cuttings waste.
Further information on Water management
Further information on Waste management
26 27
Governance Stakeholders Baseline Impacts identification
Impacts management KPI’s
Global habitatsIn conjunction with the Smithsonian Institute, we have identified indicators species in the main habitats of the planet.
MethodologyWe disclosed the methodologies we have used to stablish the biodiversity baseline in six offshore operations.
Incorporate BES in both governance function and business processes
Understand and include stakeholders’ expectations about BES
Understand BES’ baseline
Assess dependencies and potential impacts in BES
Mitigate and manage impacts and identify opportunities in BES
Select, measure and make public the BES indicators
Repsol ArubaIn the offshore seismic campaign in Aruba, we worked to mitigate the impact on sea turtles.
MITIGATION HIERARCHY
More information at:IPIECA and csbi.org.uk
ANALYZE IMPACT AVOIDMINIMIZERESTOREOFFSET
Preserving biodiversity and ecosystem services
We are committed to mitigate potential impacts on biodiversity and the resources that biodiversity provides (ecosystem services) during the planning and development of
our projects and operations. To this end, we are guided by the United Nations principles on sustainable development.
Sustainability Report 2016 / Resource and impact management
26
The benchmark forums on biodiversity management, such as IPIECA or CSBI, propose mitigation hierarchy as a good practice, and at Repsol we work in accordance with this recommedation. The three examples presented above are part of the phases to identify, avoid and minimize impact.
Resource and impact management
assets with risk assessment and management of BES (Repsol Oil and Gas Canada Inc. Not included)
100%
We have been the first oil and gas company to put into practice the IPIECA and IOGP management framework on biodiversity and ecosystem services (BES). This framework is centered on six interrelated management practices:
Moreover, we participate in reference forums like IPIECA, IOGP or the Cross-Sector Biodiversity Initiative.
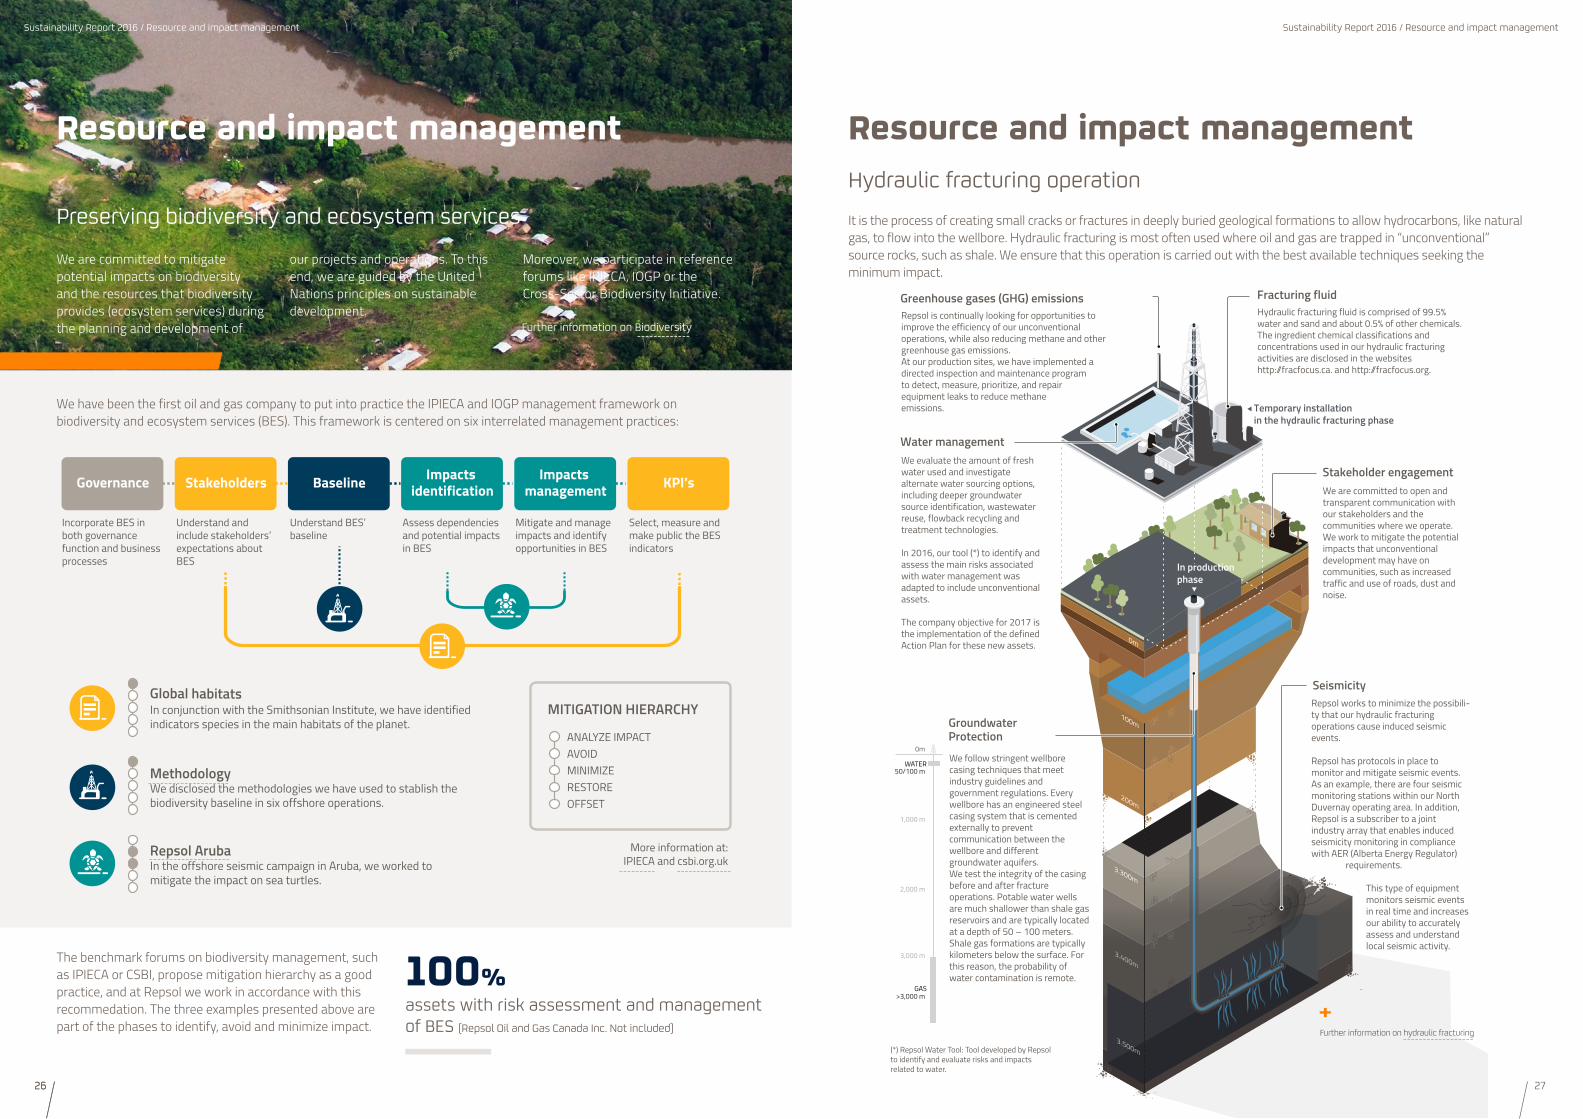
Hydraulic fracturing operation
It is the process of creating small cracks or fractures in deeply buried geological formations to allow hydrocarbons, like natural gas, to flow into the wellbore. Hydraulic fracturing is most often used where oil and gas are trapped in “unconventional” source rocks, such as shale. We ensure that this operation is carried out with the best available techniques seeking the minimum impact.
Water management
Fracturing fluid
Stakeholder engagement
Temporary installation in the hydraulic fracturing phase
Hydraulic fracturing fluid is comprised of 99.5% water and sand and about 0.5% of other chemicals.The ingredient chemical classifications and concentrations used in our hydraulic fracturing activities are disclosed in the websites http://fracfocus.ca. and http://fracfocus.org.
We evaluate the amount of fresh water used and investigate alternate water sourcing options, including deeper groundwater source identification, wastewater reuse, flowback recycling and treatment technologies.
In 2016, our tool (*) to identify and assess the main risks associated with water management was adapted to include unconventional assets.
The company objective for 2017 is the implementation of the defined Action Plan for these new assets.
Greenhouse gases (GHG) emissionsRepsol is continually looking for opportunities to improve the efficiency of our unconventional operations, while also reducing methane and other greenhouse gas emissions. At our production sites, we have implemented a directed inspection and maintenance program to detect, measure, prioritize, and repair equipment leaks to reduce methane emissions.
Groundwater Protection
We follow stringent wellbore casing techniques that meet industry guidelines and government regulations. Every wellbore has an engineered steel casing system that is cemented externally to prevent communication between the wellbore and different groundwater aquifers. We test the integrity of the casing before and after fracture operations. Potable water wells are much shallower than shale gas reservoirs and are typically located at a depth of 50 – 100 meters. Shale gas formations are typically kilometers below the surface. For this reason, the probability of water contamination is remote.
We are committed to open and transparent communication with our stakeholders and the communities where we operate. We work to mitigate the potential impacts that unconventional development may have on communities, such as increased traffic and use of roads, dust and noise.
100m
0m
200m
3.400m
3.300m
3.500m
2,000 m
3,000 m
>3,000 m
1,000 m
50/100 m
0m
GAS
WATER
SeismicityRepsol works to minimize the possibili-ty that our hydraulic fracturing operations cause induced seismic events.
Repsol has protocols in place to monitor and mitigate seismic events. As an example, there are four seismic monitoring stations within our North Duvernay operating area. In addition, Repsol is a subscriber to a joint industry array that enables induced seismicity monitoring in compliance with AER (Alberta Energy Regulator)
requirements.
This type of equipment monitors seismic events in real time and increases our ability to accurately assess and understand local seismic activity.
In production phase
(*) Repsol Water Tool: Tool developed by Repsol to identify and evaluate risks and impacts related to water.
Resource and impact management
Sustainability Report 2016 / Resource and impact management
Further information on Biodiversity
Further information on hydraulic fracturing
