survival estimation in bats: historical overview, critical...
TRANSCRIPT
There are more than 1,100 species of bats, representing nearly20% of all species of mammals (Simmons, in press). Bats occur on everycontinent except Antarctica, and although they occur in greatest diversityin the tropics, their distribution extends at least to tree line at high lati-tudes. Given this wide distribution and high species richness, it is not sur-prising that bats display a large number of feeding specializations and playkey functional roles in ecosystems. Insectivorous bats are best known totemperate zone biologists, but at lower latitudes other species are frugivo-rous, nectarivorous, piscivorous, carnivorous, or even sanguivorous (blood-feeders). Bats play important ecological roles as pollinators and dispersersof fruit seeds in warm climates and as major consumers of insects in mostterrestrial ecosystems. These attributes are of significant economic andecological benefit, but some bats can also be detrimental to human affairs.In the neotropics vampire bats negatively affect livestock health, and batsmay play an as yet poorly understood role in disease transmission cycles.
In light of their importance, bats are also of global conservation concern.Many species of bats are endangered or are considered “sensitive” speciesin the United States, and several nations provide legal protection to bats.Negative impacts on bat populations have stemmed from a variety of fac-tors. These include habitat loss, declines in roost availability, disturbance to
15
Survival Estimation in Bats:
Historical Overview, Critical
Appraisal, and Suggestions
for New Approaches
Thomas J. O’Shea, Laura E. Ellison,
and Thomas R. Stanley
297
Ch15 (297-336) 10/18/04 1:00 PM Page 297

E S T I M AT I N G A B U N D A N C E , D E N S I T Y, A N D O T H E R PA R A M E T E R S298
roosts (especially at winter hibernacula in caves), intentional killing of batsin vulnerable aggregations, hunting for food (particularly Old World fruitbats), and mortality due to environmental contaminants.
Considering the high diversity, wide distribution, ecological signifi-cance, economic importance, and conservation issues of bats, surprisinglylittle attention has been given to the application of modern approachestoward understanding their population biology. This is particularly truefor estimation of survival. Some of this inattention has been a result oflogistic difficulties. Most species of bats are difficult to observe becausethey are active at night and roost during the day in secretive or inaccessi-ble places. All bats fly and thus can be highly mobile. However, crypticbehavior, mobility, and logistic difficulties are common to many of theother problematic groups of animals that are discussed in this book. Thelack of detailed information on survival in bats may also be in part due topast lack of widespread recognition of their importance, particularly incomparison with other groups of mammals such as large herbivores,marine mammals, and economically important predators, furbearers, andcrop pests. In addition to logistic challenges, thorough study of the popu-lation biology of bats can require a long-term commitment. Bats are long-lived for mammals of their size and reproduce slowly. Maximum longevi-ties of several species of bats of temperate zones have been documented atmore than 25 years (e.g., Ransome 1995; Keen and Hitchcock 1980) and insome cases at more than 30 years (reviewed by Barclay and Harder 2003).Bats typically give birth to single young (or much less frequently twins)just once annually (Tuttle and Stevenson 1982).
Our objectives in this chapter are to provide an overview of past sam-pling aimed at estimation of survival in bats, a parameter critical to under-standing their population biology. We then point out some of the deficien-cies of past work in comparison with the potentially more reliableinferences that may be possible through the application of new and pow-erful tools that are rapidly developing for the analysis of survival inwildlife populations. In highlighting deficiencies we do not cast aspersionson past efforts. In most cases these investigations provided very hard-earned results; they were as thorough and allowed as much inference aswas possible given the limitations of the methods available. Instead weseek to emphasize to researchers the potential benefits of taking new direc-tions using techniques that have only recently become practical for appli-cation to bats. We provide examples of such approaches from the recent lit-erature and from our own nascent work on big brown bats (Eptesicus
Ch15 (297-336) 10/18/04 1:00 PM Page 298

fuscus) in Colorado. We hope this review will serve not only to stimulatebat biologists to consider new approaches in their studies of survival, butalso to stimulate thought toward designing new applications for samplingthis intriguing group of mammals.
Bat BandingPast research on bat survival relied heavily on banding for marking of indi-viduals. We therefore provide an overview of the history and range of find-ings from bat-banding studies, emphasizing those in the United States.
History and Overview of Banding Studies in Bats
Allen (1921) first applied bands to bats. He placed numbered aluminumbird bands on the legs of four female eastern pipistrelles (Pipistrellus sub-flavus) from a roost at a residence in Ithaca, New York in 1916. He recov-ered three of the banded bats at the same location in 1919. A second studywas completed soon thereafter, documenting returns of banded Eptesicusfuscus in California (Howell and Little 1924). Allen (1921:55) noted, “Thevaluable results that are now being obtained by banding birds could nodoubt be duplicated with bats if only enough persons would cooperate inthe project of banding.”
Banding of bats did indeed grow over the next half-century. Managingand coordinating bat banding was an official function within the U.S. Fishand Wildlife Service (USFWS) beginning in 1932, but it had no legislativemandate and the work never achieved a scale comparable to that of band-ing birds. From the 1930s through the mid-1960s, the USFWS and itspredecessors issued about 1.5 million numbered metal bands for placementon bats (Greenhall and Paradiso 1968; estimated at 1.9 million by 1982 inHill and Smith 1984). Banding of bats in the United States grew slowly inthe 1930s (Mohr 1952) but intensified during the 1950s and 1960s. Mostbanding efforts were aimed at local or regional studies carried out inde-pendently by field biologists, particularly those interested in bats that usecaves (Mohr 1952; Greenhall and Paradiso 1968). Modifications to designand techniques were made during this period (Barclay and Bell 1988;Greenhall and Paradiso 1968). Banding also took place in at least 14 Euro-pean nations, Mexico, Japan, and Australia, involving additional hundredsof thousands of bats (Greenhall and Paradiso 1968; Hill and Smith 1984;Kuramoto et al. 1985).
Survival Estimation in Bats 299
Ch15 (297-336) 10/18/04 1:00 PM Page 299

E S T I M AT I N G A B U N D A N C E , D E N S I T Y, A N D O T H E R PA R A M E T E R S300
Banding provided previously unattainable information on the naturalhistory of bats. In addition to investigations of survival, recaptures ofbanded individuals revealed patterns in reproduction (Pearson et al. 1952),migration (see below), longevity (Ransome 1995; Keen and Hitchcock1980), growth (see review by Tuttle and Stevenson 1982), energetics andphysiology (Kurta et al. 1989, 1990), and aspects of behavior such as sitefidelity (Rice 1957; Tinkle and Patterson 1965), social organization (Dwyer1970; Bradbury and Vehrencamp 1976), and homing (Davis 1966a; Wilsonand Findley 1972). A prime example of discoveries made about bat migra-tions stems from banding of Mexican free-tailed bats (Tadarida brasilien-sis mexicana). These bats form huge colonies in the southwestern UnitedStates that are the largest aggregations of mammals on Earth. Bandingallowed discovery of seasonal migrations between these locations andMexico, with documentation of some stopover points and movementsamong caves (Constantine 1967; Cockrum 1969; Glass 1982). Recovery ofbanded Mexican free-tailed bats was low, but outlines of migratory pat-terns emerged from compilations of anecdotal case records. Cockrum(1969) reported banding 162,892 free-tailed bats at 71 localities in Arizonaand adjacent regions during 1952–1967. Only 539 (0.3%) were recoveredat locations other than the point of banding (just 3,240 [2%] were recov-ered at the original banding sites), and nearly all of these were recapturedjust once. Nonetheless, one-way migratory journeys of 1,600–1,800 kmwere documented (Villa-R. and Cockrum 1962; Constantine 1967; Cock-rum 1969; Glass 1982). Serendipitous recoveries of a few bats in migrationrevealed travel rates of at least 64 km per night. Banding records of thisspecies also showed complex geographic patterns in migratory tendenciesin the western United States (Cockrum 1969) that prompted speculationabout genetic distinctiveness in these areas. Such distinctiveness was notborn out by subsequent genetic studies (McCracken et al. 1994;McCracken and Gassel 1997; Svoboda et al. 1985).
Findings from banding studies also documented other aspects of natu-ral history, the annual cycle of reproduction and movements, and regionalmigrations to hibernacula of bats in the eastern United States, particularlyin New England and New York (Griffin 1945). Davis and Hitchcock (1965)banded about 71,000 little brown bats (Myotis lucifugus) in this region.They noted movements between hibernacula and nurseries of up to 320km and rates of travel of at least 43 km per night. Banding studies alsoshowed that in certain locations, some species of bats make only local sea-sonal movements (e.g., Corynorhinus townsendii, Pearson et al. 1952,
Ch15 (297-336) 10/18/04 1:00 PM Page 300

Humphrey and Kunz 1976; Macrotus waterhousii, Cockrum et al. 1996).Banding studies also provided information on seasonal migrations ofEuropean bats over various distances, ranging from local movements (e.g.,1–64 km; Hooper 1983) to longer distances (e.g., 250–300 km in Myotisdasycneme; Sluiter et al. 1971). Distances of movements away from band-ing localities ranging up to 120 km were recorded for several species of batsin Japan (Kuramoto et al. 1985), and Dwyer (1966) reported complex sea-sonal movement patterns of nearly 600 km for banded Miniopterusschreibersii in Australia.
Critical Appraisal of Bat Banding
Although much was learned about the natural history of bats from band-ing studies, the technique poses problems. Chief among these are injuriesand infections from banding, and obliteration of numbers on bands bychewing or by overgrowth of tissues on the forearm (bat biologistsswitched from banding legs to using wing bands in the late 1930s [Trapidoand Crowe 1946]). These problems varied by species, with some more sen-sitive than others. Among U.S. bats, Corynorhinus townsendii, for exam-ple, was reported to be very sensitive to injury from bands (Humphrey andKunz 1976), whereas Pipistrellus subflavus was not thought to be sensitive(Davis 1966b). Partial rectification was sought by shifting from bird bandsto a lipped design made specifically for bats based on modifications devel-oped by a few European bat banders (Hitchcock 1957), but injuries contin-ued to be reported. About 42% of the Mexican free-tailed bats tagged withbird bands had visible irritation, wing tears, embedding in bone, or fleshyoutgrowths with evidence of infection by about 300 days post-banding;73% of those tagged with lipped bat bands had injuries, although thesewere described as less severe than those caused by bird bands (Herreid etal. 1960). Skeletal damage also occurred (Perry and Beckett 1966). In con-trast, Happold and Happold (1998) reported less injury in Pipistrellusnanus marked with lipped bands in Malawi and concluded that the effectswere not serious. Injuries to wings due to banding were also apparent fromstudies of some European bats (e.g., Sluiter et al. 1971).
In Australia, Baker et al. (2001) provided perhaps the most thoroughdocumentation of injurious effects of bands on bats. Their records andanalyses showed that injury rates and severity varied with species (17species of insectivorous bats were banded with different types of bands andrecaptured over multiple years), person applying bands, band type (bird
Survival Estimation in Bats 301
Ch15 (297-336) 10/18/04 1:00 PM Page 301

E S T I M AT I N G A B U N D A N C E , D E N S I T Y, A N D O T H E R PA R A M E T E R S302
bands were less injurious to some species than bat bands), band material,and size of band (Baker et al. 2001). Bats also may suffer marked prema-ture tooth wear from chewing at bands (Young 2001), which could resultin shortened longevity.
In addition to direct injury, much of the banding of bats in the UnitedStates and Europe took place at winter hibernacula in caves or mines (Mohr1952). The energetic cost of arousal from hibernation due to disturbance(that is, banding activities) can be extreme. The amount of energy mobilizedfrom fat for a single arousal can cost as much as 68 days of the supply a batneeds for hibernation (Thomas et al. 1990). Thus, bats disturbed duringhibernation for banding have a reduced capability of surviving over winterand lower prospects of countering starvation if faced with food shortagesduring uncertain spring conditions. Banding of bats at hibernacula verylikely drove population declines of bats at some sites in the United States(e.g., Tinkle and Patterson 1965; Keen and Hitchcock 1980). Daan (1980)suggested that marked declines in counts of six of eight species of bats in 16limestone caves in The Netherlands during 1940–1979 also were likely aresult of banding, perhaps due to very high adult mortality. Daan(1980:101) noted that banding as a source of mortality “is certainly seriousenough to affect the conclusions obtained with the technique.”
In the United States, attitudes moved from a formal resolution of theAmerican Society of Mammalogists in favor of bat banding in 1964(Greenhall and Paradiso 1968) to an official policy to cease issuing of batbands by the USFWS in 1973, primarily because of disturbance (Jones1976). Similarly, Australia began an official bat banding program in 1960(Young 2001). Subsequently, a permanent moratorium on banding easternhorseshoe bats (Rhinolophus megaphyllus) was instituted in Australia inthe 1970s following recognition that up to 88% of banded bats had mod-erate to severe injuries (Young 2001). In 1996 Australia extended themoratorium on banding to all microchiropteran bats in three families(Baker et al. 2001). Recommendations to curtail banding also were made inEurope (e.g., Rybar 1973; Hooper 1983).
Suggestions for Future Studies
Biologists continue to band bats for various purposes. The use of bat bandsin studies of survival should be eschewed unless investigators can empiri-cally determine that resulting injuries and biases are very minor. Furtherresearch is needed on alternative methods of permanently marking bats.
Ch15 (297-336) 10/18/04 1:00 PM Page 302

Barclay and Bell (1988) list a number of possible alternatives. Necklaces andear tags have been used on bats (Appendix 15.1; Mohr 1952). However,injuries can result from necklaces (Barclay and Bell 1988) and ears have verycritical functions in orientation and prey detection. Tag loss also may be aproblem with these methods. Necklaces were lost in five of 73 (6.8%) dou-bly marked (bands and necklaces) Jamaican fruit bats, Artibeus jamaicensis(Gardner et al. 1991) and in 6.5% of short-tailed fruit bats, Carollia perspic-illata (Fleming 1988). Loss of ear tags also has been reported (Hoyle et al.2001). Freeze-branding is another possible method of permanent markingthat has only recently been explored in bats (Sherwin et al. 2002).
Participants at a 1999 workshop on monitoring bat populations recom-mended exploring various potential new marking techniques such as micro-taggants and passive integrated transponders (PIT tags) (Working Group Areport in O’Shea and Bogan 2003). PIT tags are small (ca. 0.1 g, 11 mmlength), long-lasting implant devices that have been extensively used in fish-eries and to identify pets. They are passive, and instantaneously emit aunique binary ultrasonic code only when activated and simultaneouslyreceived by reader devices at very close range. PIT tags have been used tomark big brown bats in captivity (Barnard 1989) and in field studies of activ-ity patterns, social structure, and genetics of a few species of bats (Brooke1997; Horn 1998; Kerth et al. 2002). They have not yet been applied to esti-mation of survival in bats, although we provide a case example below thatsuggests some promise. There also is a need for a clearinghouse for informa-tion about such techniques and to coordinate contacts for ongoing studies ofmarked bats (e.g., when remote recoveries are made), including bandingstudies (Working Group C report in O’Shea and Bogan 2003).
Estimation of SurvivalThere have been two previous reviews of the study of survival in bats.Keen (1988) provided a critical appraisal of the literature through 1984,and Tuttle and Stevenson (1982) reviewed those studies appearing through1982. Here we provide an updated chronological review, critique, and sug-gestions for future approaches.
History and Overview of Survival Studies in Bats
We surveyed the literature on survival estimation in bats published since1950 (Appendix 15.1). We found 42 studies with information relevant to
Survival Estimation in Bats 303
Ch15 (297-336) 10/18/04 1:00 PM Page 303

E S T I M AT I N G A B U N D A N C E , D E N S I T Y, A N D O T H E R PA R A M E T E R S304
estimating survival in 36 species of bats in the Americas, Europe, Asia, andAustralia. Earlier efforts in the 1930s and 1940s (summarized by Mohr1952) simply expressed the percentage of banded bats recaptured at siteswhere originally banded. To our knowledge, the first published attempts atcalculating survival estimates for bats were those of Beer (1955) for hiber-nating big brown bats in Minnesota (Appendix 15.1). As pointed out byKeen (1988), these estimates were based on an incorrect application ofHickey’s (1952) ad hoc (Williams et al. 2002) procedures for estimatingsurvival from recoveries of bands from dead birds.
Soon afterward, a series of papers appeared based on banding of thou-sands of bats of several species at winter hibernacula in The Netherlandsover many years. This work provided survival estimates based on the“method of Bezem” (Sluiter et al. 1971:7; Sluiter et al. 1956; Bezem et al.1960). This was a life table approach that pooled recaptures of unagedcohorts. Bezem’s technique involved calculating the proportion of batscaught in any one year out of those bats caught the previous year, andplotting the logarithm of the proportion against the number of years sincebanding. Under unlikely assumptions of constant rates of survival andconstant capture probabilities, the coefficient of regression of a straightline fitted to these points was taken as the annual survival estimate for thestudy period and the y-intercept was taken as the capture probability.Sluiter et al. (1956) gave a detailed mathematical rationale for thisapproach and provided justification via simulation. They acknowledgeddrawbacks to their methods and assumptions but noted that without usingthe regression technique, “the computational labour [for estimatingannual survival and capture probabilities] rapidly becomes enormous asthe number of years increases” and “therefore we have turned to a methodwhich, though it may lead to slightly erroneous results, has the advantagethat the necessary calculations are very easy” (Sluiter et al. 1956:74). Thiswork was done a half-century ago when this justification was perhapsunderstandable.
Bezem’s approach (with modifications), coupled with life table analysesderived from the slopes of the regression lines under an assumption ofconstant survival, prevailed in survival estimation in bats for the next 30years (Appendix 15.1). This was despite the appearance of Cormack’s(1964) paper and others on maximum-likelihood-based methods, theincreasing availability of electronic computing techniques, and the specificrejection by Caughley (1966) of the assumptions (particularly constantrate of survival) made by Bezem. Maximum-likelihood methods, intro-
Ch15 (297-336) 10/18/04 1:00 PM Page 304

duced by R. A. Fisher (1922), provide the means for estimating parame-ters from sample data given an appropriate model and are “the backboneof statistical inference used in nearly every area of science” (White2001:37). For descriptions of properties and methods of maximum-likelihood estimation, particularly as they relate to capture-recapturemodels, see White et al. (1982), Burnham and Anderson (2002), andWilliams et al. (2002).
Studies that relied on regression varied in their methods of computa-tions of the proportions that formed the regression points, which in somestudies are not clearly specified. Bezem and coworkers (1960) included allobservations of any banded bat 1 year apart as survival 1 year after mark-ing; thus, each banded bat could be counted several times in the estimateof each regression point (Keen 1988). The “intuitive regression” (Keen1988:167) method employed by most workers used a minimum-number-known-alive (MNA) approach in calculating the proportions in the regres-sion points (a bat not seen between successive captures was calculated aspresent or alive at the intervening periods when it was not captured). Somestudies made study-specific modifications to computations; for example,Davis (1966a) used an ad hoc computation to correct percentage recapturedby the estimated number alive but not recaptured. However, justificationfor the form of the correction was not provided and properties such as biaswere unknown. Data used for both Bezem’s and the intuitive regressionmethods were not appropriate for regression because they were not statis-tically independent (Keen 1988).
Of the 42 studies of bats we reviewed (Appendix 15.1), 7 (17%) used themaximum-likelihood-based Cormack-Jolly-Seber (CJS) model to estimatesurvival of bats, whereas 35 (83%) used ad hoc methods. The CJS model isa preferred, maximum-likelihood method based on open populations thatallows estimation of survival and capture probabilities, and conditions onthe capture, marking, and release of individuals at each of several timesduring a study (Williams et al. 2002). The ad hoc methods included simplereporting of recapture percentages by time period (about 20% of all stud-ies); some form of “intuitive regression,” often on pooled unaged cohortswith life tables derived by assuming constant rates of survival (about50%); life tables of known age cohorts (2%); and other ad hoc methods(about 13%). Accordingly, estimates of variance for survival rates weremade only in a small number of cases. A few studies used combinations ofanalytical approaches (e.g., Boyd and Stebbings 1989; Fleming 1988; Keenand Hitchcock 1980). Most studies of survival in bats were primarily
Survival Estimation in Bats 305
Ch15 (297-336) 10/18/04 1:00 PM Page 305

E S T I M AT I N G A B U N D A N C E , D E N S I T Y, A N D O T H E R PA R A M E T E R S306
descriptive reporting of estimates (about 76%); a few studies involved sta-tistical null hypothesis testing, usually regarding sex (Appendix 15.1).These generally involved tests of differences in slopes of the regressionlines or χ2 tests of proportions recaptured at various time periods in ageand sex categories.
Application of more useful modern approaches to estimating survivalin bats occurred in two phases: (1) the first CJS-based estimates of sur-vival appeared during 1980–1990 (Keen and Hitchcock 1980; Hitchcock etal. 1984; Boyd and Stebbings 1989; Gerell and Lundberg 1990); and (2)three very recent studies that used CJS estimators to evaluate specifichypotheses about survival in bats in Australia and Germany. Baker et al.(2001) reported that survival estimates of banded bats varied by type ofband in Nyctophilus geoffroyi but not in two other species of Australianbats. Hoyle et al. (2001) adopted the information-theoretic approach(Burnham and Anderson 2002) to model selection and evaluated biologi-cal hypotheses about survival in the large Australian ghost bat, Macro-derma gigas. The preferred model included sex, season, and rainfall as fac-tors or covariates influencing survival in this species (Hoyle et al. 2001).Sendor and Simon (2003) also used the information-theoretic approach toselect models for the effects of age, time, sex, season, and winter severityon annual survival in pipistrelles (Pipistrellus pipistrellus) captured withmist nets and banded at a site in Germany that was used both as a hiber-naculum and in summer. Based on the most parsimonious models, age hadthe strongest effect on survival in the pipistrelles: survival was lower inbats in their first year than in adults. No differences in survival of thesexes were apparent, and there was no effect of winter severity, time, orseason on survival.
Although methods to estimate survival from most past studies hadflaws, some generalizations about the life history of bats emerged fromthese efforts. Survival and longevity are higher in bats than in most othermammals of similar size, and survival through the first year of life (or firstyear of banding in unaged cohorts) is usually lower than in subsequentyears. Survival estimates for juvenile male bats often seem lower than injuvenile females, but this may in part be due to emigration and differen-tial dispersal from natal roosts. It is difficult to draw many other reliableconclusions about survival in bats; accuracy and precision of most esti-mates are unknown, despite the tremendous efforts that have beeninvolved in acquiring past recapture data.
Ch15 (297-336) 10/18/04 1:00 PM Page 306

Critical Appraisal of Survival Studies in Bats
Most previous studies of survival in bats suffer from shortcomings in atleast one of three areas. The first of these was failure to specify the popu-lation of interest, or target population (defined in sampling theory as a col-lection of elements about which we wish to make inferences; Cochran1977; Scheaffer et al. 1986), and to employ a sampling design that allowsvalid inferences to be made from the sample population (a collection ofsample units drawn from a sample frame; Cochran 1977, Scheaffer et al.1986) to the target population. For example, some study sites were likelychosen on the basis of convenience sampling (Anderson 2001:1294), wherelocations were based on prior knowledge that certain sites had bats andperhaps were closer to the researchers or less difficult to work in than oth-ers. This was not problematic insofar as the investigator limited inferencesto the study sites actually sampled (assuming appropriate sampling at thesites). However, in past studies survival estimates were sometimes taken toapply to some larger population or even the entire species. A related prob-lem was that much of the past estimation of survival was based on studiesin which banding may have been carried out with multiple objectives (suchas determining ranges of movements) and marking was not designedspecifically for survival estimation. Consequently, the sample populationwas not representative of the target population, and this prevented validinferences about survival.
A second shortcoming was the use of field methods that reduced survivalin the sample population so it was no longer representative of the targetpopulation or that introduced biases of unknown magnitude into the sam-ple data. For example, potentially injurious banding was used in 34 of the36 studies that involved marked bats (Appendix 15.1), and 17 (40%) of the42 studies estimated survival but involved sampling bats in hibernaculawhere disturbance-induced arousals can be a major source of overwintermortality (11 of the 16 [68%] studies of marked bats in the United Statesand Canada involved sampling at hibernacula). Thus, the majority of sur-vival studies based on recaptures of bats used field methods known or sus-pected to cause injury and reduced survival in marked individuals. Conse-quently, survival estimates for marked individuals in these studies couldnot represent survival rates for the unmarked portion of the population.Other sources of bias in the sample data included effects due to tag loss,inconsistent sampling efforts, and heterogeneity in responses to past cap-
Survival Estimation in Bats 307
Ch15 (297-336) 10/18/04 1:00 PM Page 307

E S T I M AT I N G A B U N D A N C E , D E N S I T Y, A N D O T H E R PA R A M E T E R S308
ture and handling. Tag loss problems include effective tag loss, in caseswhere numbers on bands are obliterated from chewing or overgrowth oftissues on the forearm, or physical tag loss. Physical tag loss has also beenreported for the two alternative marking methods (necklaces and ear tags)employed thus far (Gardner et al. 1991; Fleming 1988; Hoyle et al. 2001).The end result of tag loss was that, on average, fewer recoveries were likelyrecorded than actually occurred, and this likely biased survival estimatesnegatively. Stevenson and Tuttle (1981) pointed out other sources of biasfrom field methods in studies of survival in bats. These included unequaleffort at recapturing bats among years and locations; widely varying char-acteristics of roosts and locations of bats within roosts that affected accessi-bility and capture probabilities; and differential segregation and accessibil-ity of age and sex classes at capture sites. Individuals of some species of batsalso have been shown to avoid recapture within hibernacula based on theirexperience from captures in previous years (Stevenson and Tuttle 1981).
The third shortcoming of many of the bat studies we surveyed was theuse of ad hoc procedures for estimating survival, many of which invokedbiologically unrealistic assumptions (such as constant rates of survival,despite year-to-year environmental stochasticity) or failed to state theirassumptions. This included the use of life table approaches (Appendix 15.1),which are now considered ad hoc and circular (Anderson et al. 1981;Williams et al. 2002). Ad hoc estimators of survival are undesirable for thesimple reason that they have no underlying theoretical justification or prob-abilistic framework in which to derive variance estimators or to evaluateimportant properties such as unbiasedness, efficiency, or consistency. Conse-quently, it is unknown if the calculated quantity is actually estimating theparameter of interest or if it is better in some sense than other ad hoc pro-cedures. This leads to the problem described in Tuttle and Stevenson(1982:122) that “The student of chiropteran survival analyses will be consid-erably frustrated in attempting to compare the results of various studies.”Obstacles to comparison occur because different estimators may be estimat-ing different quantities and have no associated measures of precision.
Suggestions for Future Studies of Survival in Bats
Future research should avoid the shortcomings so prevalent in past stud-ies. As a starting point, investigators must strive to clearly define theirpopulation of interest and then make every effort to construct an appro-priate sample frame (a complete list of sample units; Thompson et al.
Ch15 (297-336) 10/18/04 1:00 PM Page 308

1998). In some cases it may not be possible to construct a sample framethat exactly matches the target population. For example, if an investigatorwishes to make inferences about the population of bats that roosts in a par-ticular geographic area (the target population), then he or she must firstlocate all the roosts in that area so as to choose a probability sample fromthat population. However, in constructing the sample frame, some roostsmay be missed because they contain few bats, whereas roosts containinglarge numbers of bats will be less likely to be missed. In such cases, thesample frame will be a size-biased representation of the target populationand inferences drawn from a sample of roosts will be applicable only toroosts in the sample frame, not to the population of roosts in the geo-graphic area of interest.
Once an appropriate sample frame has been developed, well-establishedsampling procedures such as simple random sampling, stratified randomsampling, or perhaps cluster sampling should be used to select the samplepopulation. In the example above, one might first stratify roosts on thebasis of size and then select a simple random sample of roosts from eachstratum. Of course, once a roost has been selected for sampling, it is desir-able to obtain a representative sample of individuals from each roost. Thiscan sometimes be difficult to accomplish for bats, though certain measurescan be taken to minimize potential biases. For instance, one might ensurethat capture efforts are distributed equally among all parts of a roost (e.g.,a cave) rather than just the most accessible parts. If there are multiple exitsfrom a roost, one might attempt to capture individuals at all of these exitsinstead of just a single exit.
Methods used to acquire and mark individuals must be improved. Usingbands to mark bats for survival studies is unacceptable without empiricaldetermination of the effects of bands on the species or situation of inter-est, nor is it acceptable to disturb bats on a large scale in hibernacula tomark individuals or acquire recapture information. Alternative markingtechniques need to be developed that allow permanent identification ofindividuals without causing injury and potentially biasing estimates (seeabove section on banding; preliminary results from application of PIT tagsas a marking alternative are provided in the case study described below).In addition, marking efforts should be applied away from hibernacula toavoid the effects of disturbance-induced arousals on overwinter survivaland should instead focus at alternative locations where bats occur in sum-mer or at the mouths of caves during swarming in autumn prior to hiber-nation. Improved methods of acquisition and marking that do not reduce
Survival Estimation in Bats 309
Ch15 (297-336) 10/18/04 1:00 PM Page 309

E S T I M AT I N G A B U N D A N C E , D E N S I T Y, A N D O T H E R PA R A M E T E R S310
survival of the sample population or introduce biases into the sample datawill yield more informative and reliable estimates of survival that can bemore confidently applied to the unmarked portion of the population.
Our final suggestion is to abandon the ad hoc procedures used in paststudies to estimate survival. Inferior approaches should not be followedsimply as a legacy of precedent. Instead, we recommend that survival esti-mators be based on well-founded probabilistic models and a sound theoret-ical foundation, such as maximum likelihood theory, and that assumptionsupon which models are built be stated explicitly. In particular, we believethe CJS open population capture-recapture model shows great promise forestimating survival in bats, as previously stressed by Keen (1988). Thislikelihood-based model conditions on first captures, allows inferences to bemade to the marked population, and is based on the following assumptions(from Williams et al. 2002:422):
(1) every marked animal present in the population at sampling period i hasthe same probability pi of being recaptured or resighted; (2) every markedanimal present in the population immediately following sampling inperiod i has the same probability φi of survival until sampling period i+1;(3) marks are neither lost nor overlooked and are recorded correctly; (4)sampling periods are instantaneous (or in reality they are very short peri-ods), and recaptured animals are released immediately; (5) all emigrationfrom the sampled area is permanent; and (6) the fate of each marked ani-mal with respect to capture and survival probability is independent of thefate of any other animal (see Williams et al. 2002:422–423 for a discussionof these assumptions and consequences of their violation).
Generalizations to the CJS model allow survival, capture, and transition-state probabilities to be modeled as functions of individual or group covari-ates, and powerful software exists for estimating parameters under user-defined models (White and Burnham 1999). Transition-state probabilitiesare computed based on generalized CJS models that allow individuals to bedistributed across multiple sites or phenotypic states, under the assumptionthat transitions among states follow a stochastic Markovian process(Williams et al. 2002). Furthermore, because the CJS model and its general-izations are likelihood based, the weight of evidence in favor of or against a particular candidate model can easily be evaluated using information-theoretic model selection procedures (Burnham and Anderson 2002). Weanticipate that application of the CJS model in future bat studies will allow
Ch15 (297-336) 10/18/04 1:00 PM Page 310

for more rapid advances in understanding bat population biology and inapplication of findings for management.
Big Brown Bats in Fort Collins: A Case Study Combining New ApproachesIn 2001 we began a study of the ecology of rabies transmission in bigbrown bats that roost in human-occupied buildings in Fort Collins, Col-orado. One facet of the study was to estimate survival and transition-stateprobabilities of marked bats as they related to exposure to rabies. Rabies istransmitted through biting. In addition to determining the influence ofrabies exposure and other factors on survival of bats, understanding rabiestransmission dynamics in our study population also required an under-standing of various transition-state probabilities that may influence possi-ble contact among bats. Transition states may include movements of batsamong roosts, shifts in exposure histories and immune status of bats basedon serology, or transitions from noninfective to infective (virus shedding)phases.
Our study differed from most previous efforts to estimate survival, cap-ture, and transition-state probabilities by combining several differentmarking, recapture, and analytical approaches. We employed a PIT tagmethod of marking bats rather than bands, we studied bats at maternitycolonies rather than hibernacula, and we “resighted” bats using passivePIT tag readers placed at roost entrances rather than repeatedly capturingand handling bats to read tags. Our objective was to evaluate a number ofhypotheses about survival and transition-state probabilities using a gener-alized CJS model (after Lebreton et al. 1992). Specifically, we developedcompeting models for survival, capture, or transition-state probabilitiesand then obtained the maximum-likelihood estimates for these parame-ters. Models were constructed a priori to evaluate the influence of selectcategorical variables and individual covariates of likely biological impor-tance, such as age, sex, time, body condition, ectoparasite burdens, and ecological aspects of principal roosting sites. We used the information-theoretic approach (Burnham and Anderson 2002) to rank and selectamong competing models (hypotheses). In this section we provide resultsfrom three examples of our preliminary studies that involved estimationof short-term survival, capture, and movement probabilities of bats.Results cover only 2 years of marking and recapture (2001–2002), so
Survival Estimation in Bats 311
Ch15 (297-336) 10/18/04 1:00 PM Page 311

E S T I M AT I N G A B U N D A N C E , D E N S I T Y, A N D O T H E R PA R A M E T E R S312
findings regarding longer term annual estimates based on theseapproaches are not yet available.
Methods Employed in the Fort Collins Study
The study of big brown bats in Fort Collins involved selection of roosts forsampling without prior knowledge of roost locations, uniquely markingindividuals using technology not previously applied to studies of survivalin bats, and using maximum-likelihood-based analytical methods. Thiswork attempted to address some (but not all) of the deficiencies identifiedin many of the earlier studies of survival in bats.
Selection of Roosts for Sampling
Nearly all records of public exposure to rabid bats in Colorado are fromencounters in and around buildings and parks in towns during summer(Pape et al. 1999). Therefore, we focused our sampling on summer mater-nity colonies (adult females and juveniles, adult males are widely dis-persed) in buildings in Fort Collins (Figure 15.1). Selection of colony siteswas not truly random. We located roosts for sampling by first capturingbats in mist nets at night as they flew over water for foraging or drinkingin parks and open spaces. Thus individuals caught for tagging were proba-bly encountered haphazardly. We then radio-tagged adult females andreleased them on site and drove the streets during the day to find coloniesby tracking radio signals. For a more representative sample of bats, we alsointentionally selected initial capture sites so that we included sections ofthe city spanning a range of ages of buildings. We radio-tagged 122 batsduring summers 2001–2002 and located 54 buildings with colonies of atleast 20 bats (some were occupied by bats for only a few days). Within thissample frame, we chose roosts for PIT tagging and biological samplingbased on logistic considerations (equipment limitations, accessibility,potential cooperation). We also included a few colony sites in this total of54 based on citizen knowledge. However, we did not select colony sitesbased on our own prior knowledge, and this differed from most previousstudies of survival of bats.
Capturing, Marking, and Resighting Bats at Roosts
We captured bats as they exited from roosts at evening emergence, andthus captured only adults and volant juveniles (juveniles born that sum-mer but probably at least 30 days old). In our examples below we did not
Ch15 (297-336) 10/18/04 1:00 PM Page 312

disturb bats by attempting to capture them within roosts. We used stan-dard techniques and equipment for capturing flying or emerging bats, asdescribed in detail in other sources (Greenhall and Paradiso 1968; Kunzand Kurta 1988; Kunz et al. 1996). Depending on locations of the exitpoints, we caught bats in harp traps (approximately 2 × 2 m frames withtaut, closely spaced fine monofilament lines that flying bats collided with,then fell to collecting receptacles below) or in mist nets set on poles if exitswere up to 5 m above ground. We captured exiting bats in mist nets sus-pended by pulleys from heights of 5–10 m in cases where exit points werehigh on the sides of buildings. We sometimes supplemented these with
Survival Estimation in Bats 313
Figure 15.1. Fort Collins, Colorado, where big brown bats were sampled aspart of a study of the ecology of rabies transmission in urban bats. Each squarerepresents a one-square-mile section (2.6 km2) of developed land in the city (population 120,000 people) bounded by major thoroughfares. Building symbols denote locations of structures used as roosts by big brown bats in2001 and 2002, as discovered by radio-tracking adult females captured whileforaging in parks and open spaces (capture locations denoted by stars).Abbreviations (LT, HF, CR40) correspond to specific roosts mentioned in tablesand text of this chapter.
Ch15 (297-336) 10/18/04 1:01 PM Page 313

E S T I M AT I N G A B U N D A N C E , D E N S I T Y, A N D O T H E R PA R A M E T E R S314
handheld nets and with funnel traps (custom-made, enclosed nylon tubesup to 10 m in length extending to the ground, see Kunz and Kurta 1988)placed over roost entrances.
We transported bats to the laboratory (isolated from each other in indi-vidual cotton specimen bags placed in disposable drink cups with lids) forbiological sampling and for marking by subdermal injection of PIT tags.We followed transport, marking, and biological sample collection proce-dures described by Wimsatt et al. (in press) and then released the markedbats near the roost within 6 hours of capture. We PIT tagged 2,073 bigbrown bats at multiple sites in Fort Collins during 2001–2002. In 2002 wealso marked newly PIT-tagged bats with small (3 mm diameter) circularfreeze-brands over the left scapula. These spots were expected to grow outas small tufts of white pelage in the late summer moult (Sherwin et al.2002). By August 2003 we reexamined 185 bats recaptured with white hairtufts, and just three lacked functional PIT tags (1.6%), suggesting that PITtag loss was not a major problem.
In 2002 we installed 19 PIT readers at roosts in 14 different buildings.PIT readers are 15 or 30 cm diameter activating and receiving hoops thatare each connected to a separate data logger and powered by 12 V automo-tive batteries (we used readers and PIT tags manufactured by AVID, Inc.,Norco, California). PIT readers were installed over crevice openings wherebats typically crawled over them upon emerging or entering. Data loggersstored the date, time, and identification number for every detection, andthese were downloaded to a laptop computer three times each weekthroughout the summer. Tens of thousands of records were reduced todaily presence/absence for short-term survival studies.
Data Analysis
We used Program MARK (White and Burnham 1999) to generate esti-mates for parameters of interest. Encounter history files were created thatincluded a listing of each individual bat, coded for every time period aseither a “1” (captured), or “0” (not captured). We modeled data sets as “liverecaptures,” in which animals are reencountered only when recapturedalive on succeeding occasions. Two of our parameters of interest were cap-ture probability (p, the conditional probability that a marked animal willbe seen over a specified time interval given that it is alive and in the studypopulation; Cormack 1964; Williams et al. 2002) and apparent survival (φ).Apparent survival cannot distinguish emigration from mortality, but is theprobability that the animal is alive, remains on the study area, and is avail-
Ch15 (297-336) 10/18/04 1:01 PM Page 314

able for recapture (White and Burnham 1999). The identification of mod-els followed the notation of Lebreton et al. (1992). For example, a modelincorporating a group effect (such as age or reproductive status) on appar-ent survival and capture probabilities was coded as {φ (g), p (g)}. A modelincluding time effects on survival and capture probabilities was coded {φ (t), p (t)}. We also calculated a 1-year return rate (r = [number recap-tured at time t +1]/[number released at time t]) and confidence intervalsbased on simple binomial probability.
Example 1: Comparisons of Estimates from Conventional Captures vs. PIT Readers
We hypothesized that daily probabilities of capture would be higher anddaily survival would be more precisely estimated using passive PIT read-ers placed at roost entrances than by using conventional methods of cap-turing bats to read marks by hand. Individual bats probably vary in theirsusceptibility to capture in nets and traps and may learn to avoid them. Wepredicted that survival estimates would be comparable using the twomethods because CJS-based survival estimators are typically robust to het-erogeneity in capture probabilities (Nichols and Pollock 1983). However,PIT readers can sample continuously whereas conventional captures mustbe conducted sparingly because of effort requirements, possible abandon-ment of roosts, and animal welfare considerations. Thus the larger numberof samples obtainable by PIT readers should result in more precise esti-mates. We also predicted that estimates of overwinter return rates from2001 to 2002 would be higher using reader records than estimates obtainedby hand captures.
We created separate encounter history files for conventional capturesand for PIT readers at roosts in three buildings. Conventional captureswere conducted at least five times during summer 2002; PIT readers wereoperational over the intervals between first and last conventional capturesat each of these three buildings. We analyzed samples separately by build-ing because each differed in degree of difficulty in capturing bats. We didnot use samples that occurred after mid-August because of postbreedingdispersal. We used Program MARK to adjust differing intervals betweenoccasions and then converted these to daily rates. Capture events were typ-ically 2 weeks apart (Table 15.1). We generated estimates of daily survivaland capture probabilities for the two different techniques using a modelincorporating age as a group effect (adult females and juveniles of both
Survival Estimation in Bats 315
Ch15 (297-336) 10/18/04 1:01 PM Page 315

E S T I M AT I N G A B U N D A N C E , D E N S I T Y, A N D O T H E R PA R A M E T E R S316
sexes). (These daily survival rates should not be converted to estimateannual rates because sampling may have included early dispersal; differ-ences in severity of seasonal mortality were also likely and these estimateswere made only in summer.) Several PIT reader input files were truncatedfrom daily encounters to encounters for every 48-hour period to allow themodel to reach numerical convergence in Program MARK.
Capture probabilities at all three roosts (Table 15.1) were up to 10-foldhigher when estimated from PIT readers than when estimated from con-ventional techniques. Capture probabilities also varied more widely amongroosts for conventional captures than for PIT readers. The probability ofcapturing bats was highest at roost CR40 and lowest at HF. The CR40 roostopening was within 5 m of the ground and most bats that emerged to for-age were easily captured, whereas emergence points at HF were less pre-
Table 15.1.
Daily capture probability (p) and apparent survival estimates (ϕ) for big brown bats at three different roosts in Fort Collins, Colorado (seeFigure 15.1), during the summer of 2002. Estimates were compared
using conventional capture techniques (mist nets and traps, with tagreading during handling) and PIT reader records collected passively
between the first and last conventional capture events.
p(95% CI) ϕ (95% CI)
Method Roost (n occasions) Adults Juveniles Adults Juveniles
HFa
Conventional 0.091 0.064 0.974 Inestimableb
captures (5) (0.034–0.219) (0.035–0.115) (0.917–0.992)
PIT readers (30) 0.862 0.678 0.989 0.967(0.851–0.872) (0.637–0.716) (0.987–0.991) (0.955–0.976)
CR40c
Conventional 0.494 0.447 0.987 0.987captures (5) (0.365–0.623) (0.221–0.697) (0.975–0.993) (0.975–0.993)
PIT readers (30) 0.743 0.938 0.986 0.976(0.717–0.768) (0.876–0.970) (0.980–0.990) (0.948–0.989)
LTd
Conventional 0.204 0.334 0.984 0.985captures (5) (0.115–0.335) (0.158–0.572) (0.954–0.994) (0.874–0.998)
PIT readers (21) 0.858 0.860 0.988 0.973(0.842–0.872) (0.806–0.900) (0.984–0.991) (0.954–0.985)
a Conventional captures occurred on 14, 28 June, 12, 26 July, and 12 August 2002.b Incalculable due to low capture probability of juveniles during conventional captures.c Conventional captures occurred on 10, 24 June, 8, 22 July, and 8 August 2002.d Conventional captures occurred on 11, 26 June, 10, 24 July, and 6 August 2002.
Ch15 (297-336) 10/18/04 1:01 PM Page 316

dictable and were located 10 m above ground. Estimates of apparent sur-vival were similar but confidence intervals were more precise when esti-mates were derived from PIT readers in comparison with conventionalcaptures (Table 15.1).
Return rates of females from 2001 to 2002 were high when bats wereresighted by PIT readers, and most of these individuals were never detectedusing conventional methods. We PIT tagged 404 adult females at sevenroosts during 2001 that were monitored by readers in 2002; 81.9% [95%CI = (78–86%), n = 331] returned in 2002. This is higher than most ratesreported in the literature for this species based on other methods (Appen-dix 15.1). Return rates of juvenile females (103 of 163, or 63%; 95% CI =56–70%) also were higher. Two hundred fifty-two of 434 (58%) bats ofboth age groups combined that were detected by PIT readers during 2002were never recaptured by hand at roosts, despite multiple conventional cap-tures to obtain biological samples and compare capture techniques.
Example 2: Effects of Biological Sampling Techniques on Survival
We used techniques developed and described by Wimsatt et al. (in press) tosample blood of anesthetized big brown bats to obtain serum for rabiesantibody determination. Obtaining blood samples from large numbers ofbats under anesthesia and releasing them in the field was not common inmost studies of bats, and this was the most invasive aspect of our biologi-cal sampling. Therefore, in this example we summarize findings of Wim-satt et al. (in press), who sought to determine if these procedures affectedshort-term survival of big brown bats.
Wimsatt et al. (in press) used a random number table to randomlyassign individuals captured by hand during summer 2002 to a treatment(handled and sampled for several biological attributes, anesthetized, andblood sampled through intravenous puncture) or a reference group (han-dled and sampled, but not anesthetized and no blood taken). Bats were helduntil all were processed and released simultaneously near their roosts eachnight when sampling was completed. We obtained daily PIT reader recordsat roosts where the readers were operational for 14 consecutive days aftercapture. Separate encounter history files were created for adults and juve-niles. We sampled adult females from six roosts (n = 179 treatment, 86 ref-erence group) and juveniles from five roosts (n = 87 treatment, 92 refer-ence group). We estimated daily survival over the 2 weeks following the
Survival Estimation in Bats 317
Ch15 (297-336) 10/18/04 1:01 PM Page 317

E S T I M AT I N G A B U N D A N C E , D E N S I T Y, A N D O T H E R PA R A M E T E R S318
first capture, handling, and bleeding of the season (some individuals werebled more than once during the summer). We used Program MARK toestimate survival and capture probabilities for the two groups of bats andgoodness-of-fit Test 1 in Program RELEASE (Burnham et al. 1987) to testfor differences between the groups. We also attempted to assess possiblelonger term impacts of multiple sampling sessions by comparing returnrates in 2002 of female bats (most males do not use maternity roosts) thathad been captured, handled, and bled once or twice in 2001.
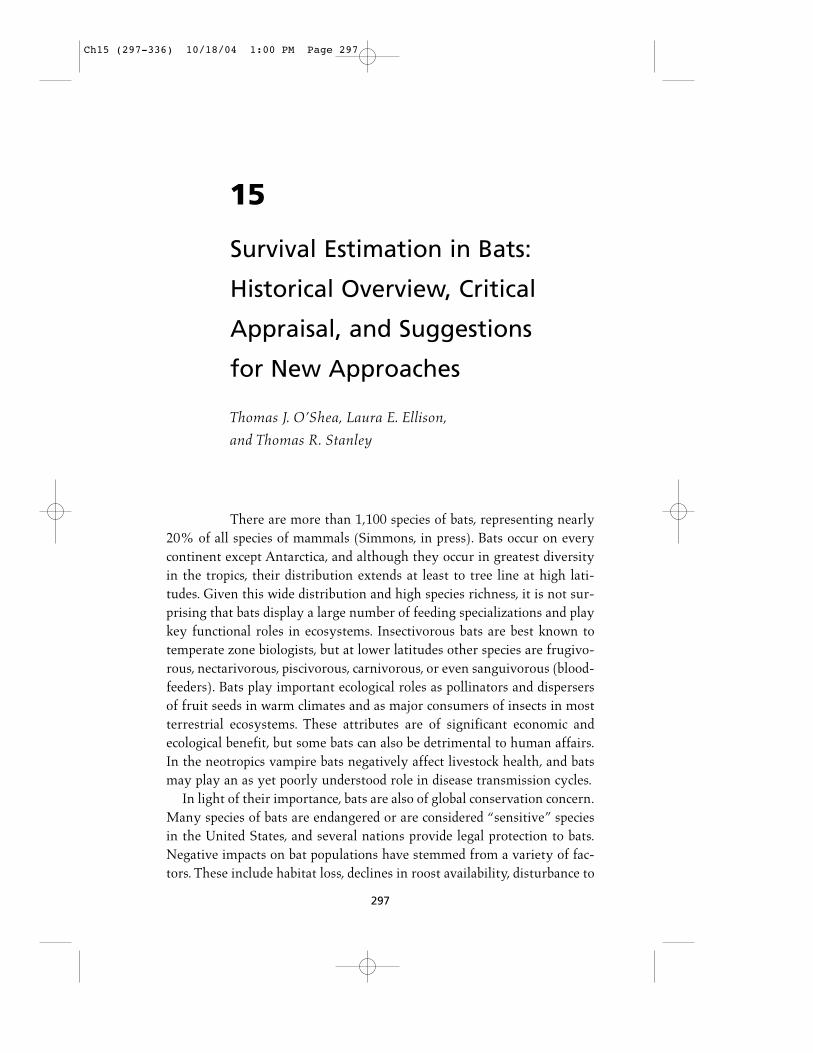
We did not detect a difference in 14-day daily survival and captureprobabilities (Table 15.2; Wimsatt et al., in press) of bats that were sampledfor blood under anesthesia and those that were not (χ2 = 22.2,df = 27,P = 0.73 for juveniles; χ2 = 9.7, df = 18, P = 0.94 for adults). Return ratesin 2002 for bats bled once or twice during the summer of 2001 were highand confidence intervals overlapped widely with estimates of return ratesfor bats not bled in 2001 (Table 15.3). These results provide some assur-ance that the most invasive aspects of the biological sampling did notstrongly bias our estimates of apparent survival.
Example 3: Feasibility of Using PIT Marking to EstimateTransition-State Probabilities
This third example was a preliminary study in which we had two objec-tives. Our first objective was to estimate daily probabilities of movement
Table 15.2.
Maximum likelihood estimates of short-term apparent survival (φ)and capture probabilities (p) for adult female and juvenile big
brown bats by treatment (anesthetized and bled) and reference (not anesthetized, not bled) groups. Estimates were based on
passive detection by PIT tag readers placed over roost entrances(see also Wimsatt et al., in press; reproduced with permission
of the Journal of Wildlife Diseases).
Adults Juveniles
Treatment φ (95 % CI) p (95 % CI) φ (95 % CI) p (95 % CI)
Anesthetized and bled 0.984 0.757 0.968 0.636 (0.977–0.989) (0.738–0.775) (0.954–0.978) (0.604–0.668)
Not anesthetized, 0.958 0.757 0.956 0.660 not bled (0.942–0.978) (0.725–0.785) (0.940–0.968) (0.626–0.692)
Ch15 (297-336) 10/18/04 1:01 PM Page 318
based on PIT reader records. Our second objective was to use model selec-tion procedures (Burnham and Anderson 2002) to evaluate a priorihypotheses about factors that may influence daily movements of batsamong roosts.
Many studies using radio-tagging and other observational methodshave shown that individuals of many species of bats (including big brownbats in maternity colonies) switch roosting sites from day to day (seeLewis 1995 for a review). However, probabilities and variances associatedwith such movements have never been estimated. Hypotheses in the liter-ature suggest that movements of bats among roosts may be explained bya number of factors. Two prominent factors proposed to influence theprobability of movement among roosts are day-to-day microclimatic shiftsand ectoparasite infestations. To our knowledge, Lewis (1996) conductedthe only field study that investigated the relative importance of these twopossible explanations. Based on daily radio-tracking, she reported thatindividual pallid bats (Antrozous pallidus) with higher ectoparasite loadsswitched roosts more often (based on an ANOVA approach), but thatchanges in roost use did not appear to be in response to daily changes intemperature.
We used the model of Brownie et al. (1993) and Hestbeck et al. (1991),which generalized the CJS model to allow animals to move among multi-ple strata by modeling transition probabilities (ψ). To meet the first objec-tive of this example we calculated ψ for members of a maternity colony of
Survival Estimation in Bats 319
Table 15.3.
First year (2001–2002) return rates (r ) for female big brown batshandled, but not anesthetized and bled, or sampled for blood underanesthesia once or twice during 2001 (after Wimsatt et al., in press;reproduced with permission of the Journal of Wildlife Diseases).
Treatment
Age Not sampled Sampled once Sampled twice
Adults 58/72 227/276 42/50r = 0.806 r = 0.822 r = 0.840SÊ(r) = 0.0466 SÊ(r) = 0.0230 SÊ(r) = 0.051895% CI (0.698–0.881) 95% CI (0.773–0.863) 95% CI (0.711–0.918)
Juveniles 16/29 75/113 12/17r = 0.552 r = 0.664 r = 0.706SÊ(r) = 0.0924 SÊ(r) = 0.0444 SÊ(r) = 0.110595% CI (0.372–0.719) 95% CI (0.572–0.745) 95% CI (0.458–0.872)
Ch15 (297-336) 10/18/04 1:01 PM Page 319

E S T I M AT I N G A B U N D A N C E , D E N S I T Y, A N D O T H E R PA R A M E T E R S320
big brown bats that used four locations within one large building (HF);each location was monitored with a PIT tag reader at its opening. The loca-tions were designated as northeast (NE), northwest (NW), southeast (SE),and southwest (SW). We assumed that bats roosted within walls nearthose locations. To meet the second objective we hypothesized that move-ment probabilities among these locations would be higher with more pro-nounced shifts in ambient temperature ranges. We also hypothesized thathigher numbers of ectoparasites would increase movement probabilities.
We used multi-strata “live recaptures only” models in Program MARKto examine daily transition probabilities in relation to change in tempera-ture the previous day (delta temperature [∆t], which we defined as themaximum temperature the previous day minus the minimum tempera-ture that evening/morning) and total number of ectoparasites (mites of thegenus Steatonyssus) counted on standard portions of the wings and bodyof each bat. We limited the analysis to those adult females captured in handduring 15–28 June 2002 at one stage of reproduction (lactation, n = 43;juveniles were not yet volant). We modeled number of ectoparasites as anindividual covariate and ∆t as an environmental covariate. The ∆t spanned11–23° C units over the 2-week period. Counts of ectoparasites rangedfrom 1 to 562 Steatonyssus sp. per bat [
–X = 130.6 (SD = 156.5)]. We con-sidered only models in which apparent survival was constant over the 2-week period. We estimated overdispersion (where sampling varianceexceeds the theoretical, model-based variance; Burnham and Anderson2002) by dividing the deviance of the most general model by its number ofparameters. Deviance is the difference in –2 log (likelihood) of the currentmodel and –2 log (likelihood) of the saturated model (the saturated modelis the model with the number of parameters equal to the sample size;McCullagh and Nelder 1989; Lebreton et al. 1992). The most parsimoniousmodels were selected using QAICc (Akaike’s Information Criterion cor-rected for overdispersed data) (Burnham and Anderson 2002).
Our results show that resightings from PIT readers in nearby alternativeroosting locations can be used in multi-strata models to estimate movementprobabilities and to model associated environmental and individual covari-ates (Tables 15.4 and 15.5). Estimated movement rates from the north to thesouth (that is, NE to SE and NW to SE) were generally higher over theperiod of analysis than movements from the south to the north (that is, SEto NE and SE to NW; Table 15.4). Estimated movement rates also were gen-erally higher from the north to the south than between points on the sameside of the building (that is, NE to NW and NW to NE). Movement rates
Ch15 (297-336) 10/18/04 1:01 PM Page 320

Table 15.4.
Estimates of transition probabilities (ψ) and corresponding 95% confidence intervals for female, lactating big brown bats
during 15–28 June 2002 at the HF building, Fort Collins, Colorado. NE,NW, SE, SW were the four strata (roost locations) used.
Model {p All (.), ψ All (.)} was used to estimate probability of transitioning(see Table 15.5). Read across rows for probabilities
of movement between strata (e.g., daily probability of moving from NE to SE was 0.438).
Stratum
Stratum NE NW SE SW
NE – 0.047 (0.012–0.169) 0.438 (0.297–0.590) 0.058 (0.014–0.204)NW 0.101 (0.042–0.225) – 0.308 (0.195–0.450) 0.068 (0.023–0.186)SE 0.005 (0.001–0.036) 0.030 (0.014–0.063) – 0.219 (0.169–0.279)SW 0.022 (0.004–0.102) 0.092 (0.052–0.157) 0.255 (0.165–0.371) –
Table 15.5.
Results from Program MARK for multi-strata modeling of roost-switching by lactating female big brown bats within
HF building, Fort Collins, Colorado. For each model we list themodel name (p is capture probability and ψ is transition
probability), the Akaike Information Criterion corrected foroverdispersion (QAICc), the ∆ QAICc , QAICc weight, and
number of parameters (K). Overdispersion (c ) was estimated tobe 2.5. Strata were NE, NW, SE, and SW locations of building.
Apparent survival (φ) was assumed to be constant for all models.
Model ∆ QAICc QAICc QAICc Weight K
{p All (.), ψ All (∆ t )}a,b 481.49 0.00 0.38 21{p All (.), ψ All (.)} 481.60 0.11 0.36 20{p All (.), ψ All (Steat)}c 483.70 2.21 0.13 21{p All (.), ψ All (Steat + ∆ t )} 483.71 2.22 0.13 22{p All (time), ψ All (.)} 521.48 39.99 0.00 68{p All (time), ψ All (∆ t)} 523.00 41.51 0.00 69{p All (time), ψ All (Steat)} 523.72 42.23 0.00 69{p All (time), ψ All (Steat + ∆ t)} 525.30 43.81 0.00 70{p All (.), ψ All (time)} 839.14 357.66 0.00 164{p All (time), ψ All (time)} 1086.25 604.77 0.00 212a “All” in model name means each of the four strata were modeled the same.b ∆t is high temperature minus low temperature the day before transition.c Steat is the count of individual mites (Steatonyssus sp.) on each bat.
Ch15 (297-336) 10/18/04 1:01 PM Page 321

E S T I M AT I N G A B U N D A N C E , D E N S I T Y, A N D O T H E R PA R A M E T E R S322
between SE and SW roosting sites also were generally higher than thosebetween NE and NW (Table 15.4). These changes may have reflected the dif-ferential exposure of the roosts to the sun on north and south sides and apreference of bats to be on warmer south-facing sides as lactation progresses.
The best model in our example (Table 15.5) included constant captureprobabilities and an effect of ∆t on the transition probabilities. That is,probability of movement of bats varied on a daily basis and co-varied withthe scope of temperature change the previous day. Based on the top fourmodels, our results also showed some support for the hypothesis that thenumber of ectoparasites may have influenced whether a bat moved toanother roost site. Models incorporating a time effect on the transitionprobabilities were less parsimonious than models incorporating the indi-vidual covariate (ectoparasites) and the environmental variable (∆t).Future applications in our study will include larger samples of bats androosts and will consider additional biological hypotheses, locations, timeframes, and alternative covariates (e.g., direct temperature measurementswithin roosts, counts of other ectoparasites) that may better represent thehypotheses under consideration. Although results from this exampleshould be considered preliminary, they illustrate the potential uses of com-bining new marking approaches in a more rigorous analytical frameworkthan those previously used in most studies of bat survival and movements.
ConclusionsMost studies of survival in bats used ad hoc procedures for estimation ofsurvival rates. However, recent innovations in modeling of survival usingmaximum-likelihood-based analytical methods and new software applica-tions provide better opportunities to obtain more reliable estimates. A fewrecent studies of bats have taken such a probabilistic approach to survivalestimation (e.g., Baker et al. 2001; Boyd and Stebbings 1989; Hoyle et al.2001; Sendor and Simon 2003). Future researchers should follow theserecent examples, rather than repeat the ad hoc intuitive regression, lifetable, and other approaches more widely used in the past. Additionally,most previous studies of survival in bats had drawbacks in that methods ofmarking and recapturing individual bats had the potential to cause injury,decrease survival, or involved other possible biases. We recommend thatalternative marking methods continue to be explored for studies of sur-vival in bats. Recent case examples combining an alternative marking tech-nology (PIT tags) with modern analytical approaches from our own work
Ch15 (297-336) 10/18/04 1:01 PM Page 322

suggest that advances in estimating survival in bats are indeed feasible. Wealso recommend that future research on survival and transition rates inbats strive to construct biological hypotheses about these critical traits andthat hypotheses be evaluated using freely available modern software suchas Program MARK (available at http://www.cnr.colostate.edu/~gwhite/mark/mark.htm) and its embedded model selection procedures that areparticularly well suited to the study of these probabilities.
Acknowledgments
We thank D. Anderson for key guidance to the Fort Collins study, G. Whitefor tutelage in Program MARK, and R. Bowen for overarching support anddatabase development. We thank the above as well as R. Reich, C. Rup-precht, V. Shankar, and J. Wimsatt for input to study planning; and M.Andre, T. Barnes, M. Carson, K. Castle, L. Galvin, D. Grosblat, B. Iannone,J. LaPlante, G. Nance, D. Neubaum, R. Pearce, V. Price, S. Smith, and T. Tor-coletti for assistance in fieldwork in 2001 and 2002. J. Horn and T. Kunzgave advice in use of PIT tags. R. Pearce provided ectoparasite data. TheFort Collins bats and rabies study is supported by a grant from the jointNSF/NIH Ecology of Infectious Diseases Program to Colorado State Uni-versity and by the U.S. Geological Survey. M. Dodson and L. Lucke helpedobtain references. Manuscript drafts were improved by comments from W.Thompson, P. Cryan, and an anonymous reviewer.
References Allen, A. A. 1921. Banding bats. Journal of Mammalogy 2:53–57.Anderson, D. R. 2001. The need to get the basics right in wildlife field studies.
Wildlife Society Bulletin 29:1294–1297.Anderson, D. R., A. P. Wywialowski, and K. P. Burnham. 1981. Tests of the assump-
tions underlying life table methods for estimating parameters from cohort data.Ecology 62:1121–1124.
Baker, G. B., L. F. Lumsden, E. B. Dettmann, N. K. Schedvin, M. Schulz, D. Watkins,and L. Jansen. 2001. The effect of forearm bands on insectivorous bats(Microchiroptera) in Australia. Wildlife Research 28:229–237.
Barclay, R. M. R., and G. P. Bell. 1988. Marking and observational techniques. pp.59–76 in T. H. Kunz, ed., Ecological and Behavioral Methods for the Study ofBats. Smithsonian Institution Press, Washington, D.C.
Barclay, R. M. R., and L. D. Harder. 2003. Life histories of bats: Life in the slow lane.pp. 209–253 in T. H. Kunz and M. B. Fenton, eds., Bat Ecology. University ofChicago Press, Chicago.
Barnard, S. M. 1989. The use of microchip implants for identifying big brown bats(Eptesicus fuscus). Animal Keepers Forum 16:50–52.
Beer, J. R. 1955. Survival and movements of banded big brown bats. Journal ofMammalogy 36:242–247.
Survival Estimation in Bats 323
Ch15 (297-336) 10/18/04 1:01 PM Page 323

E S T I M AT I N G A B U N D A N C E , D E N S I T Y, A N D O T H E R PA R A M E T E R S324
Bezem, J. J., J. W. Sluiter, and P. F. Van Heerdt. 1960. Population statistics of fivespecies of the bat genus Myotis and one of the genus Rhinolophus, hibernating inthe caves of S. Limburg. Archives Neerlandaises de Zoologie 13:511–539.
Boyd, I. L., and R. E. Stebbings. 1989. Population changes of brown long-eared bats(Plecotus auritus) in bat boxes at Thetford Forest. Journal of Applied Ecology26:101–112.
Bradbury, J. W., and S. L. Vehrencamp. 1976. Social organization and foraging inemballonurid bats. I. Field studies. Behavioral Ecology and Sociobiology 1:337–381.
_____. 1977. Social organization and foraging in emballonurid bats. IV. Parentalinvestment patterns. Behavioral Ecology and Sociobiology 2:19–29.
Brenner, F. J. 1968. A three-year study of two breeding colonies of the big brown bat,Eptesicus fuscus. Journal of Mammalogy 49:775–778.
_____. 1974. A five-year study of a hibernating colony of Myotis lucifugus. The OhioJournal of Science 74:239–244.
Brooke, A. P. 1997. Social organization and foraging behaviour of the fishing bat,Noctilio leporinus (Chiroptera:Noctilionidae). Ethology 103:421–436.
Brownie, C., J. E. Hines, J. D. Nichols, K. H. Pollock, and J. B. Hestbeck. 1993. Capture-recapture studies for multiple strata including non-Markovian transitions.Biometrics 49:1173–1187.
Burnham, K. P., and D. R. Anderson. 2002. Model Selection and Multimodel Inference:A Practical Information-Theoretic Approach, 2nd ed. Springer-Verlag, New York.
Burnham, K. P., D. R. Anderson, G. C. White, C. Brownie, and K. P. Pollock. 1987.Design and analysis of methods for fish survival experiments based on release-recapture. American Fisheries Society Monograph 5:1–437.
Caughley, G. 1966. Mortality patterns in mammals. Ecology 47:906–918.Cochran, W. G. 1977. Sampling Techniques, 3rd ed. Wiley, New York.Cockrum, E. L. 1969. Migration in the guano bat, Tadarida brasiliensis. pp. 303–336
in J. K. Jones, Jr., ed., Contributions in Mammalogy. Museum of Natural History,University of Kansas Miscellaneous Publications 51.
Cockrum, E. L., B. Musgrove, and Y. Petryszyn. 1996. Bats of Mohave County,Arizona: Populations and movements. Occasional Papers The Museum Texas TechUniversity 157:1–72.
Constantine, D. G. 1967. Activity patterns of the Mexican free-tailed bat. Universityof New Mexico Publications in Biology 7:1–79.
Cormack, R. M. 1964. Estimates of survival from the sighting of marked animals.Biometrika 51:429–438.
Daan, S. 1980. Long term changes in bat populations in The Netherlands: A summa-ry. Lutra 22:95–103.
Davis, R. 1966a. Homing performance and homing ability in bats. EcologicalMonographs 36:201–237.
Davis, R. B., C. F. Herreid II, and H. L. Short. 1962. Mexican free-tailed bats in Texas.Ecological Monographs 32:311-346.
Davis, W. H. 1966b. Population dynamics of the bat Pipistrellus subflavus. Journal ofMammalogy 47:383–396.
Davis, W. H., and H. B. Hitchcock. 1965. Biology and migration of the bat, Myotislucifugus, in New England. Journal of Mammalogy 46:296–313.
Dwyer, P. D. 1966. The population pattern of Miniopterus schreibersii (Chiroptera) innorth-eastern New South Wales. Australian Journal of Zoology 14:1073–1137.
———. 1970. Social organization in the bat Myotis adversus. Science 168:106–108.
Ch15 (297-336) 10/18/04 1:01 PM Page 324

Elder, W. H., and W. J. Gunier. 1981. Dynamics of a grey bat population (Myotis gris-escens) in Missouri. American Midland Naturalist 105:193–195.
Fisher, R. A. 1922. On the mathematical foundation of theoretical statistics.Philosophical Transactions of the Royal Society of London, Series A 222:309–368.
Fleming, T. H. 1988. The Short-Tailed Fruit Bat. University of Chicago Press, Chicago.Funakoshi, K., and T. A. Uchida. 1982. Age composition of summer colonies in the
Japanese house-dwelling bat, Pipistrellus abramus. Journal of the Faculty ofAgriculture, Kyushu University 27:55–64.
Gardner, A. L., C. O. Handley Jr., and D. E. Wilson. 1991. Survival and relative abundance.pp. 53–75 in C. O. Handley Jr., D. E. Wilson, and A. L. Gardner, eds., Demography andNatural History of the Common Fruit Bat, Artibeus jamaicensis, on Barro ColoradoIsland, Panamá. Smithsonian Contributions to Zoology 511, Washington, D.C.
Gerell, R., and K. Lundberg. 1990. Sexual differences in survival rates of adult pip-istrelle bats (Pipistrellus pipistrellus) in south Sweden. Oecologia 83:401–404.
Glass, B. P. 1982. Seasonal movements of Mexican free-tailed bats Tadarida brasilien-sis mexicana banded in the Great Plains. Southwestern Naturalist 27:127–133.
Goehring, H. H. 1972. Twenty-year study of Eptescus fuscus in Minnesota. Journal ofMammalogy 53:201–207.
Greenhall, A. M., and J. L. Paradiso. 1968. Bats and bat banding. U.S. Fish andWildlife Service Resource Publication 72:1–47.
Griffin, D. R. 1945. Travels of banded cave bats. Journal of Mammalogy 26:15–23.Happold, D. C. D., and M. Happold. 1998. Effects of bat bands and banding on a popu-
lation of Pipistrellus nanus (Chiroptera: Vespertilionidae) in Malawi. Zeitschriftfur Saugetierkunde 63:65–78.
Herreid, C. F., R. B. Davis, and H. L. Short. 1960. Injuries due to bat banding. Journalof Mammalogy 41:398–400.
Hestbeck, J. B., J. D. Nichols, and R. A. Malecki. 1991. Estimates of movement and sitefidelity using mark-resight data of wintering Canada geese. Ecology 72:523–533.
Hickey, J. J. 1952. Survival studies of banded birds. U.S. Fish and Wildlife ServiceSpecial Scientific Report 15:1–177.
Hill, J. E., and J. D. Smith. 1984. Bats: A Natural History. University of Texas Press,Austin.
Hitchcock, H. B. 1957. The use of bird bands on bats. Journal of Mammalogy 38:402–405.Hitchcock, H. B., R. Keen, and A. Kurta. 1984. Survival rates of Myotis leibii and
Eptesicus fuscus in southeastern Ontario. Journal of Mammalogy 65:126–130.Hooper, J. H. D. 1983. The study of horseshoe bats in Devon caves: A review of
progress, 1947–1982. Studies in Speleology 4:59–70.Horn, J. W. 1998. Individual Variation in Nightly Time Budgets of the Little Brown
Bat, Myotis lucifugus. M.A. thesis, Boston University, Boston.Howell, A. B., and L. Little. 1924. Additional notes on California bats; with observa-
tions upon the young of Eumops. Journal of Mammalogy 5:261–263.Hoyle, S. D., A. R. Pople, and G. J. Toop. 2001. Mark-recapture may reveal more about
ecology than about population trends: Demography of a threatened ghost bat(Macroderma gigas) population. Austral Ecology 26:80–92.
Humphrey, S. R., and J. B. Cope. 1970. Population samples of the evening bat,Nycticeus humeralis. Journal of Mammalogy 51:399–401.
_____. 1976. Population ecology of the little brown bat, Myotis lucifugus, in Indianaand north-central Kentucky. American Society of Mammalogists SpecialPublication 4:1–81.
Survival Estimation in Bats 325
Ch15 (297-336) 10/18/04 1:01 PM Page 325

E S T I M AT I N G A B U N D A N C E , D E N S I T Y, A N D O T H E R PA R A M E T E R S326
_____. 1977. Survival rates of the endangered Indiana bat, Myotis sodalis. Journal ofMammalogy 58:32–36.
Humphrey, S. R., and T. H. Kunz. 1976. Ecology of a Pleistocene relict, the westernbig-eared bat (Plecotus townsendii), in the southern Great Plains. Journal ofMammalogy 57:470–494.
Jolly, S. 1990. The biology of the common sheath-tail bat, Taphozous georgianus(Chiroptera: Emballonuridae), in central Queensland. Australian Journal ofZoology 38:65–77.
Jones, C. 1976. Economics and conservation. pp. 133–145 in R. J. Baker, J. K. Jones, andD. C. Carter, eds., Biology of Bats of the New World Family Phyllostomatidae,Part 1. Texas Tech University Press, Lubbock.
Keen, R. 1988. Mark-recapture estimates of bat survival. pp. 157–170 in T. H. Kunz,ed., Ecological and Behavioral Methods for the Study of Bats. SmithsonianInstitution Press, Washington, D.C.
Keen, R., and H. B. Hitchcock. 1980. Survival and longevity of the little brown bat(Myotis lucifugus) in southeastern Ontario. Journal of Mammalogy 61:1–7.
Kerth, G., K. Safi, and B. Koenig. 2002. Mean colony relatedness is a poor predictorof colony structure and female philopatry in the community breedingBechstein’s bat (Myotis bechsteinii). Behavioral Ecology and Sociobiology52:203–210.
Kunz, T. H., and A. Kurta. 1988. Capture methods and holding devices. pp. 1–30 in T. H. Kunz, ed., Ecological and Behavioral Methods for the Study of Bats.Smithsonian Institution Press, Washington, D.C.
Kunz, T. H., C. R. Tidemann, and G. C. Richards. 1996. Capturing small volant mam-mals. pp. 122–146 in D. E. Wilson, F. R. Cole, J. D. Nichols, R. Rudran, and M. S.Foster, eds., Measuring and Monitoring Biological Diversity: Standard Methodsfor Mammals. Smithsonian Institution Press, Washington, D.C.
Kuramoto, T., H. Nakamura, and T. A. Uchida. 1985. A survey of bat-banding on theAkiyoshi-dai plateau. IV. Results from April 1975 to March 1983. Bulletin of theAkiyoshi-dai Science Museum 20:25–44.
Kurta, A., G. P. Bell, K. A. Nagy, and T. H. Kunz. 1989. Energetics of pregnancy andlactation in free-ranging little brown bats (Myotis lucifugus). PhysiologicalZoology 62:804–818.
Kurta, A., T. H. Kunz, and K. A. Nagy. 1990. Energetics and water flux of free-rangingbig brown bats (Eptesicus fuscus) during pregnancy and lactation. Journal ofMammalogy 71:59–65.
Lebreton, J.-D., K. P. Burnham, J. Clobert, and D. R. Anderson. 1992. Modeling sur-vival and testing biological hypotheses using marked animals: A unified approachwith case studies. Ecological Monographs 62:67–118.
Leigh, E. G. Jr., and C. O. Handley Jr. 1991. Population estimates. pp. 77–87 in C. O.Handley Jr., D. E. Wilson, and A. L. Gardner, eds., Demography and NaturalHistory of the Common Fruit Bat, Artibeus jamaicensis, on Barro ColoradoIsland, Panamá. Smithsonian Contributions to Zoology 511, Washington, D.C.
Lewis, S. E. 1995. Roost fidelity in bats: A review. Journal of Mammalogy 76:481–496._____. 1996. Low roost-site fidelity in pallid bats: Associated factors and effect on
group stability. Behavioral Ecology and Sociobiology 39:335–344.Linhart, S. B. 1973. Age determination and occurrence of incremental growth lines in
the dental cementum of the common vampire bat (Desmodus rotundus). Journalof Mammalogy 54:493–496.
Ch15 (297-336) 10/18/04 1:01 PM Page 326

Lord, R. D., F. Muradali, and L. Lazare. 1976. Age composition of vampire bats(Desmodus rotundus) in northern Argentina and southern Brazil. Journal ofMammalogy 57:573–575.
McCracken, G. F., and M. F. Gassel. 1997. Genetic structure of migratory and nonmi-gratory populations of Brazilian free-tailed bats. Journal of Mammalogy78:348–357.
McCracken, G. F., M. K. McCracken, and A. T. Vawter. 1994. Genetic structure inmigratory populations of the bat Tadarida brasiliensis mexicana. Journal ofMammalogy 75:500–514.
McCullagh, P., and J. A. Nelder. 1989. Generalized Linear Models, 2nd ed. Chapman& Hall, London.
Mills, R. S., G. W. Barrett, and M. P. Farrell. 1975. Population dynamics of the big brownbat (Eptesicus fuscus) in southwestern Ohio. Journal of Mammalogy 56:591–604.
Mohr, C. E. 1952. A survey of bat banding in North America, 1932–1951. Bulletin ofthe National Speleological Society 14:3–13.
Nichols, J. D., and K. H. Pollock. 1983. Estimation methodology in contemporarysmall mammal capture-recapture studies. Journal of Mammalogy 64:253–260.
O’Shea, T. J., and M. A. Bogan, eds. 2003. Monitoring Trends in Bat Populations inthe United States and Territories: Problems and Prospects. U.S. Geological SurveyInformation and Technology Report ITR 2003-0003: 1–274
Pape, J. W., T. D. Fitzsimmons, and R. E. Hoffman. 1999. Risk for rabies transmission fromencounters with bats, Colorado, 1977–1996. Emerging Infectious Diseases 5:433–437.
Pearson, O. P., M. R. Koford, and A. K. Pearson. 1952. Reproduction of the lump-nosedbat (Corynorhinus rafinesquei) in California. Journal of Mammalogy 33:273–320.
Perry, A. E., and G. Beckett. 1966. Skeletal damage as a result of band injury in bats.Journal of Mammalogy 47:131–132.
Ransome, R. D. 1995. Earlier breeding shortens life in female greater horseshoe bats.Philosophical Transactions of the Royal Society of London B 350:153–161.
Rice, D. 1957. Life history and ecology of Myotis austroriparius in Florida. Journal ofMammalogy 38:15–31.
Rybar, P. 1973. Remarks on banding and protection of bats. Periodicum Biologorum75:177–179.
Scheaffer, R. L., W. Mendenhall, and L. Ott. 1986. Elementary Survey Sampling, 3rded. Duxbury Press, Boston.
Schowalter, D. B., L. D. Harder, and B. H. Treichel. 1978. Age composition of somevespertilionid bats as determined by dental annuli. Canadian Journal of Zoology56:355–358.
Sendor, T., and M. Simon. 2003. Population dynamics of the pipistrelle bat: Effects of sex,age and winter weather on seasonal survival. Journal of Animal Ecology 72:308–320.
Sherwin, R. E., S. Haymond, D. Stricklan, and R. Olsen. 2002. Freeze-branding to per-manently mark bats. Wildlife Society Bulletin 30:97–100.
Sidner, R. M. 1997. Studies of Bats in Southeastern Arizona with Emphasis onAspects of Life History of Antrozous pallidus and Eptesicus fuscus. Ph.D. disserta-tion, University of Arizona, Tucson.
Simmons, N. B. In press. Chiroptera. in D.E. Wilson and D.M. Reeder, eds., MammalSpecies of the World, 2nd ed. Smithsonian Institution Press, Washington, D.C.
Sluiter, J. W., P. F. Van Heerdt, and J. J. Bezem. 1956. Population statistics of the bat Myotismystacinus, based on the marking-recapture method. Archives Naeerlandaises deZool 12:63–88.
Survival Estimation in Bats 327
Ch15 (297-336) 10/18/04 1:01 PM Page 327

E S T I M AT I N G A B U N D A N C E , D E N S I T Y, A N D O T H E R PA R A M E T E R S328
Sluiter, J. W., P. F. Van Heerdt, and A. M. Voute. 1971. Contribution to the population biol-ogy of the pond bat, Myotis dasycneme, (Boie, 1825). Decheniana-Beihefte 18:1–44.
Stebbings, R. E. 1966. A population study of bats of the Genus Plecotus. Journal ofZoology 150:53–75.
_____. 1970. A comparative study of Plecotus auritus and P. austriacus (Chiroptera,Vespertilionidae) inhabiting one roost. Bijdragen Tot De Dierkunde 40:91–94.
Stebbings, R. E., and H. R. Arnold. 1987. Assessment of trends in size and structure ofa colony of the greater horseshoe bat. Symposium of the Zoological Society ofLondon 58:7–24.
Stevenson, D. E., and M. D. Tuttle. 1981. Survivorship in the endangered gray bat(Myotis grisescens). Journal of Mammalogy 62:244–257.
Svoboda, P. L., J. R. Choate, and R. K. Chesser. 1985. Genetic relationships amongsouthwestern populations of the Brazilian free-tailed bat. Journal of Mammalogy66:444–450.
Thomas, D. W., M. Dorais, and J.-M. Bergeron. 1990. Winter energy budgets and costof arousals for hibernating little brown bats, Myotis lucifugus. Journal ofMammalogy 71:475–479.
Thompson, M. J. A. 1987. Longevity and survival of female pipistrelle bats(Pipistrellus pipistrellus) on the Vale of York, England. Journal of Zoology211:209–214.
Thompson, W. L., G. C. White, and C. Gowan. 1998. Monitoring VertebratePopulations. Academic Press, San Diego.
Tinkle, D. W., and I. G. Patterson. 1965. A study of hibernating populations of Myotisvelifer in northwestern Texas. Journal of Mammalogy 46:612–633.
Trapido, H., and P. E. Crowe. 1946. The wing banding method in the study of thetravels of bats. Journal of Mammalogy 27:224–226.
Tuttle, M. D., and D. Stevenson. 1982. Growth and survival of bats. pp. 105–150 in T.H. Kunz, ed., Ecology of Bats. Plenum Press, New York.
Villa R., B., and E. L. Cockrum. 1962. Migration in the guano bat, Tadarida brasilien-sis mexicana (Saussure). Journal of Mammalogy 43:43–64.
White, G. C. 2001. Statistical models: Keys to understanding the natural world. pp. 35–56in T. M. Shenk and A. B. Franklin, eds., Modeling in Natural Resource Management:Development, Interpretation, and Application. Island Press, Washington, D.C.
White, G. C., D. R. Anderson, K. P. Burnham, and D. L. Otis. 1982. Capture-recaptureand Removal Methods for Sampling Closed Populations. USDOE Report NumberLA-8787-NERP, Los Alamos National Laboratory, Los Alamos, New Mexico.
White, G. C., and K. P. Burnham. 1999. Program MARK: Survival estimation frompopulations of marked animals. Bird Study 46:S120–S138.
Williams, B. K., J. D. Nichols, and M. J. Conroy. 2002. Analysis and Management ofAnimal Populations. Academic Press, San Diego.
Wilson, D. E., and J. S. Findley. 1972. Randomness in bat homing. AmericanNaturalist 106:418–424.
Wimsatt, J., T. J. O’Shea, L. E. Ellison, R. D. Pearce, and V. R. Price. In press.Anesthesia and blood sampling for health screening of big brown bats, Eptesicusfuscus, with an assessment of impacts on survival. Journal of Wildlife Diseases.
Young, R. A. 2001. The eastern horseshoe bat, Rhinolophus megaphyllus, in south-eastQueensland, Australia: Colony demography and dynamics, activity levels, seasonalweight changes, and capture-recapture analyses. Wildlife Research 28:425–434.
Zahn, A. 1999. Reproductive success, colony size and roost temperature in attic-dwelling bat Myotis myotis. Journal of Zoology 247:275–280.
Ch15 (297-336) 10/18/04 1:01 PM Page 328

Summary Species, Methods and Hypotheses of Findings,Location, Years Sample Tested Comments Reference
Antrozous pallidus, Bands, 1,702 A. Descriptive; age, 1st-year F Sidner (1997)Eptesicus fuscus, pallidus, 2,231 E. species contrasts; survival lowest Arizona, 1980–1995 fuscus, 2 nurseries correspondence (means 0.42–0.49
each; LT from KAC. with environ- A. pallidus, 0.53–mental factors. 0.64 E. fuscus).
Annual mean AF survival 0.29–0.76 A. pallidus, 0.71–0.90 E. fuscus.
Artibeus jamaicensis, Bead necklaces, Descriptive; differ- J survival < A, J Gardner et al.Panama, 1976–1980 mist-netting forest, ential survival born spring > J (1991); Leigh
roosts; 8,907. % sexes, age classes, born autumn. and Handley recap or % known birth season of J. Suggested AF (1991)alive by half-year survival > AM.intervals, some Tag loss. Leigh KAC (J, subA, A). and Handley Sexes, ages, marking (1991) calculated periods treated sep- annual survival of arately. Chi-square 0.58. Survival tests on % recap appears low, but among groups. Leigh survival and cap-and Handley (1991) ture probabilities assumed constant, confounded.identical survival process as an earlierstudy; implies no individual hetero-geneity in survival and capture proba-bilities; also used IR.
Appendix 15.1.
Summary of studies of survival rates in bats See Mohr (1952) for summaries of studies reporting recapture rates before 1950. Abbreviations:
A= adult, AF = adult female; AIC = Akaike’s Information Criteria;AM = adult male; BM = Bezem method; CJS = Cormack-Jolly-Seber;
F = female; GLG = growth layer groups in tooth sections;GOF = goodness-of-fit; IR = intuitive regression approach; J = juvenile;KAC = known-age cohorts; LT = life table; M = male; SC = survivorship
curve; SE = standard error; subA = subadult; UAC = unaged cohorts.
Ch15 (297-336) 10/18/04 1:01 PM Page 329

Summary Species, Methods and Hypotheses of Findings,Location, Years Sample Tested Comments Reference
Balionopteryx plicata, Ad hoc surrogate, Descriptive, differ- B. plicata 54%, Bradbury and Rhynchonycteris naso, females only, (% ences based on R. naso >78%, Vehrencamp Saccopteryx bilineata, of females captured habitat stability. S. bilineata 78%, (1976, 1977)S. leptura, Costa Rica, with used teats, S. leptura >78%.1973 parturition rates) n
unspecified.
Carollia perspicillata, Bands, beaded neck- Descriptive; differ- Young recap < A; Fleming (1988)Costa Rica, laces, 3,253, UAC ential survival of young F recap < 1974–1984 IR/LT approach; AF, AM, J. young M (likely
annual changes in differential disper-tooth wear classes; sal);AM, AF similar % in cave recap- % recap. Tag loss.tured after 1 yr.
Chalinolobus Bands, 10–12 yr Band type, degree Differences by Baker et al.morio, Nyctophilus periods, 1,870– of injury affected band type in N. (2001)geoffroyi, Vespadelus 3,936 (varied with φ. Differences in geoffroyi (0.19 ±vulturnus, Australia, species), colony φ by band type 0.05 SE Monel bat years unspecified type unspecified; within species bands, 0.42 ± 0.12
CJS estimate φ tested by Behrens- Mg-Al bird bands).Program JOLLY, Fisher t-tests. Age, sex unspecified.time-varying pi Highest annual φand φ. for V. vulturnus
0.59 ± 0.10; C.morio 0.72 ± 0.04.
Corynorhinus Bands, AF, J, 2 Descriptive 40–54 % J return Pearson et al.townsendii, nurseries, 85 and after 1 yr; 70–80% (1952)California, 1947–1951 60 AF, also hiber- AF return annually.
nacula. % recap-tured.
Desmodus rotundus, GLG teeth, 217, Descriptive SC. Assumed con- Lord et al.Mexico and sexes combined. SC stant reproduction, (1976)Argentina, 1969 (age vs. % in sample). stationary age dis-
GLG not validated tribution.with known-age specimens.
Desmodus rotundus, GLG teeth, 87, Descriptive SC Linhart (1973)Argentina and Brazil, sexes combined. SC years unspecified (number GLG vs.
number of bats).GLG not validated with known-age specimens.
Eptesicus fuscus, Bands, 3,871, hiber- Descriptive “over-all mortality Beer (1955)Minnesota, 1940– nacula; UAC, in- rate of about 40 per-1954 correct ad hoc band cent per year” (Beer
recovery methods. 1955:245); survival lowest 1st yr.
Ch15 (297-336) 10/18/04 1:01 PM Page 330

Summary Species, Methods and Hypotheses of Findings,Location, Years Sample Tested Comments Reference
Eptesicus fuscus, Bands, 960, hiber- Descriptive Survival 60% 1st Goehring Minnesota, ca. naculum; UAC, yr after banding, (1972)1951–1971 % alive vs. yrs higher thereafter.
after banding by sex.
Eptesicus fuscus, Bands, IR Descriptive Annual survival Hitchcock et al.Minnesota, ca. AM 0.82, AF 0.74. (1984), based 1951–1971 on Goehring
(1972)
Eptesicus fuscus, Bands, 110 and Descriptive % recap colony 1, Mills et al.Ohio, 1969–1972 142, 2 nurseries, colony 2: yr 1 (1975)
KAC, IR/LT at 32%, 10%; yr 2 1–3 yrs after 71%, 70%; yr 3 banding. 28%, 57%.
Declines (88% and 60%) thought due to study.
Eptesicus fuscus, Bands, ~39–72, Descriptive Ohio: AF return Brenner (1968)Ohio and Penn- 2 nurseries (Ohio, 53% in 1966, 24% sylvania, 1965–1967 Pennsylvania); % 1967; J 32% 1966,
of F recaptured 17% 1967. Penn:after 1 yr. AF 21% 1966, 10%
1967; J 14% 1966,12% 1967.
Macroderma gigas, Ear tags, 268, mist AIC model selec- Best model for A Hoyle et al.Queensland Australia, nets, caves. Tropical. tion for A φ. Sex, φ included sex, (2001)1976–1980 Recaps in 3-mo time, season, year, season, rainfall.
seasons. CJS model rainfall (flooding AF annual φin MARK, GOF roosts), tempera- (0.57–0.77) > AM tests RELEASE; ture as group (0.43–0.66). AIC used MARK to test factors or covar- support for rain-for trap dependency, iates. fall, sex, tempera-bootstrap estimate ture effects for J.overdispersion 1st yr φ JF 0.35–parameter. A treated 0.46, JM 0.29–0.42.separately from an Tag loss.age-structured model based on 163 bats first caught as J.
Miniopterus Bands, toe clips, Descriptive A survival ~0.75. Dwyer (1966)schreibersi, NSW 8,775, nurseries and Australia, 1960–1963 nonbreeding sites;
estimated % as yearlings, adults,arithmetically com-puted survival that would yield this age distribution.
Ch15 (297-336) 10/18/04 1:01 PM Page 331

Summary Species, Methods and Hypotheses of Findings,Location, Years Sample Tested Comments Reference
Miniopterus Bands, 2,795 M. Descriptive AF % recaptured Kuramoto et schreibersi, Myotis schreibersi, 1,924 > AM in M. al. (1985)macrodactylus, M. macrodactylus, schreibersi, sexes Rhinolophus ferrum- 3,707 R. ferrum- similar in Myotis.equinum, Japan, equinum; nursery,ca. 1966–1980 hibernacula; %
recaptured 1–14 yrs after banding.
Myotis austroriparius, Bands, 1,998, Descriptive Recap ~47% yr 1, Rice (1957)Florida, 1952–1955 nurseries; % 18% yr 2, 35 %
recap by age at 1, ≥ yr 3.2 or ≥ 3 yrs.
Myotis dasycneme, Bands, 179 AF, Descriptive; com- Annual AF sur- Sluiter et al.Netherlands, 1955– nursery; BM. pared estimates at vival similar sum- (1971)1962 winter vs. summer mer (0.70) and
banding sites. winter (0.67) col-onies; > % injury bats banded summer.
Myotis dasycneme, Bands, hibernacula Descriptive; differ- AF, AM survival Bezem et al.1940–57; M. dauben- 1,191 M. dasycneme; ences by 1 cave similar all species; (1960)toni, 1945–1957; 920 M. daubentoni; groups in 3 F = M capture rates M. emarginatus, 1,608 M. emargi- species Myotis, in all, except M.1945–1955; M. natus; 650 M. myo- sex in all (ANOVA daubentonii. No myotis,1940–1955; tis; 1,828 M. mysta- on slopes and diffs in survival M. mystacinus, cinus; 1,717 R. intercepts). but diffs in capture 1945–1957; Rhino- hipposideros. BM. rates between caves lophus hipposideros, for 3 species. Annual 1942–1956; survival for 5 species Netherlands of Myotis range
0.64–0.80, 0.57 in R. hipposideros.
Myotis grisescens, Bands, 18,632 Descriptive M annual survival Elder and Missouri, 1968–1978 banded 2 yrs, 1 70%, F 73%; lower Gunier (1981)
hibernaculum, rates 1st yr.UAC; IR by sex.
Myotis grisescens, Bands, ca. 3,946 at Differential sur- Survival similar by Stevenson and Alabama, Tennessee, 3 nurseries, recap vival at declining sex, age. 1st yr Tuttle (1981)ca. 1968–1976 at 2 hibernacula. J, and stable mater- estimates very
yearling and A nity colonies, sex variable, 0.06–0.73;cohorts. IR/LT; non- and age class diffs. 0.57–0.85 thereafter.parametric trend Survival reflects tests on % recap. changes in counts.
Ch15 (297-336) 10/18/04 1:01 PM Page 332
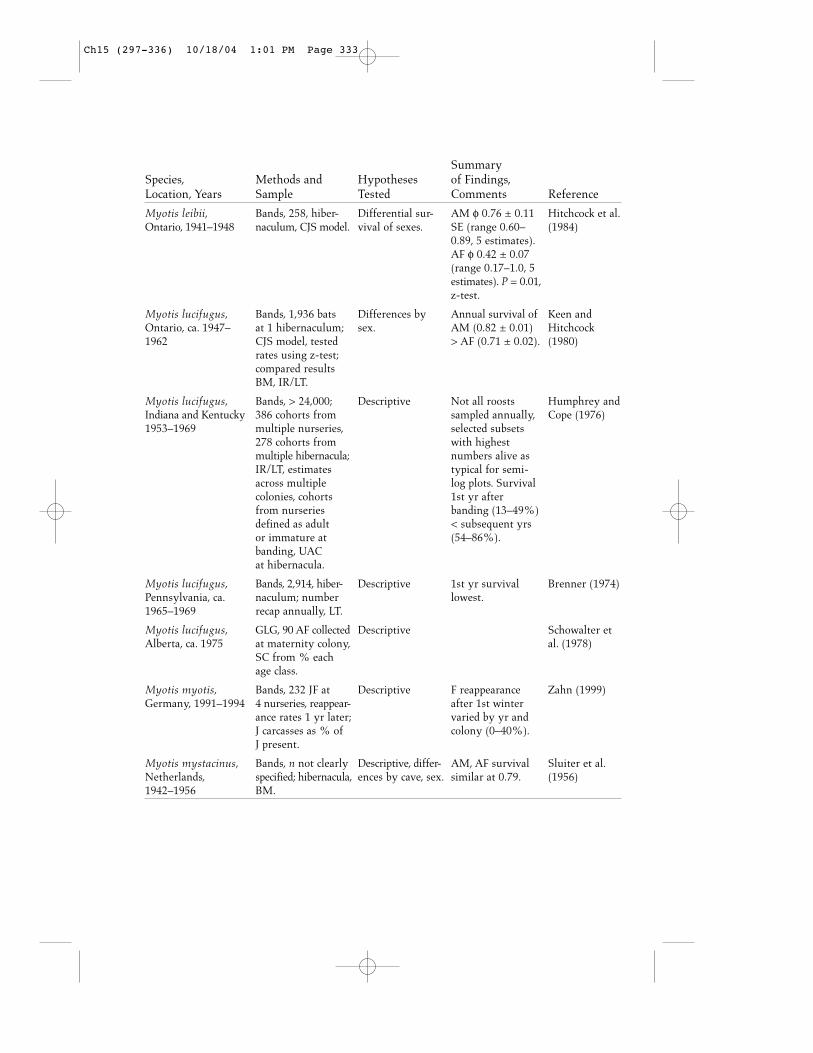
Summary Species, Methods and Hypotheses of Findings,Location, Years Sample Tested Comments Reference
Myotis leibii, Bands, 258, hiber- Differential sur- AM φ 0.76 ± 0.11 Hitchcock et al.Ontario, 1941–1948 naculum, CJS model. vival of sexes. SE (range 0.60– (1984)
0.89, 5 estimates).AF φ 0.42 ± 0.07 (range 0.17–1.0, 5 estimates). P = 0.01,z-test.
Myotis lucifugus, Bands, 1,936 bats Differences by Annual survival of Keen and Ontario, ca. 1947– at 1 hibernaculum; sex. AM (0.82 ± 0.01) Hitchcock 1962 CJS model, tested > AF (0.71 ± 0.02). (1980)
rates using z-test;compared results BM, IR/LT.
Myotis lucifugus, Bands, > 24,000; Descriptive Not all roosts Humphrey and Indiana and Kentucky 386 cohorts from sampled annually, Cope (1976)1953–1969 multiple nurseries, selected subsets
278 cohorts from with highest multiple hibernacula; numbers alive as IR/LT, estimates typical for semi-across multiple log plots. Survival colonies, cohorts 1st yr after from nurseries banding (13–49%) defined as adult < subsequent yrs or immature at (54–86%).banding, UAC at hibernacula.
Myotis lucifugus, Bands, 2,914, hiber- Descriptive 1st yr survival Brenner (1974)Pennsylvania, ca. naculum; number lowest.1965–1969 recap annually, LT.
Myotis lucifugus, GLG, 90 AF collected Descriptive Schowalter et Alberta, ca. 1975 at maternity colony, al. (1978)
SC from % each age class.
Myotis myotis, Bands, 232 JF at Descriptive F reappearance Zahn (1999)Germany, 1991–1994 4 nurseries, reappear- after 1st winter
ance rates 1 yr later; varied by yr and J carcasses as % of colony (0–40%).J present.
Myotis mystacinus, Bands, n not clearly Descriptive, differ- AM, AF survival Sluiter et al.Netherlands, specified; hibernacula, ences by cave, sex. similar at 0.79. (1956)1942–1956 BM.
Ch15 (297-336) 10/18/04 1:01 PM Page 333

Summary Species, Methods and Hypotheses of Findings,Location, Years Sample Tested Comments Reference
Myotis sodalis, Bands, 4 M and 3 Descriptive AM, AF SC similar. Humphrey and Indiana, ca. 1956– F cohorts at 2 Lowest survival 1st Cope (1977)1973 hibernacula; UAC, yr after marking,
IR/LT. last few yrs. A survival highest and constant at yrs 1–6 (F 0.76,M 0.70), lower and constant at yrs 6–10 (F 0.66,M 0.36).
Nycticeus humeralis, Bands, 526, 2 nur- Descriptive 1st yr % recap Humphrey andIndiana, 1958–1964 series, % recap for 0.23–0.32; AF ca. Cope (1970)
UAC, J, A, 1–4 yrs 0.60.after banding.
Pipistrellus abramus, Bands, 315 in 2 nur- Descriptive “Disappearance Funakoshi and Japan, 1971–1975 series; SC, % known rates” (Funakoshi Uchida (1982)
alive, LT; GLG in and Uchida 1982:killed sample of 60) of F to 1 yr 106 at 1 colony. 0.18–0.29, 0.39 in
2nd yr; M 0.85–0.96 in 1st yr.Based on LT of GLG classes, sur-vival in bats age 3–5 < bats age 1–2.
Pipistrellus Bands, 1,253, bat Differential sur- Annual survival Gerell and pipistrellus, Sweden, boxes in summer, vival of sexes due AM = 0.44 (ranges Lundberg 1981–1988 CJS model. to male territori- of variances 0.010– (1990)
ality; seasonal 0.026), AF = 0.54 climatic influences (0.005–0.097). P < on annual varia- 0.05, likelihood test.tion.
Pipistrellus Bands, 90 AF 55 Descriptive Annual survival Thompson pipistrellus, England, JF, 2 nurseries; AF = 0.64, seem- (1987)1977–1984 UAC, IR/LT. ingly constant. J
survival lower 1st yr.
Ch15 (297-336) 10/18/04 1:01 PM Page 334

Summary Species, Methods and Hypotheses of Findings,Location, Years Sample Tested Comments Reference
Pipistrellus Bands, 4,857 AF, Modeled effects Survival varied by Sendor and pipistrellus, Germany, 3,263 AM, 4,408 JF, of sex, age, time, age class and was Simon (2003)1996–2000 3,311 JM; one site season, winter time-dependent;
used as both severity on sur- no effects by sex,hibernaculum and vival, and effort and survival was “swarming” at on capture not lower in night in summer; probabilities. winter. Annual sur-bats only caught vival A = 0.80 while in flight to (SE 0.05), J = 0.53 minimize distur- (SE 0.10). Transience bance; CJS models effects noted.following Lebreton et al. (1992),program MARK,AICc.
Pipistrellus Bands, 2 hibernacula, Descriptive. Age Survival age- Davis (1966b)subflavus, West IR/LT each sex. Ad independence of dependent: low yrs Virginia, 1952–1965 hoc correction to % survival. 1, 2 (0.41, 0.51 F,
recaptured using 0.46, 0.68 M),number alive but increased to yrs not recaptured. 3–4 (0.74, 0.51 AF,Justification for the 0.98, 0.81 AM),form of the declined to yrs correction not 10–14.provided, properties unknown.
Plecotus auritus, Bands, year-round Descriptive Annual survival Stebbings P. austriacus, colony, 16–20 P. AM P. auritus (1966, 1970)England, ca. 1960– auritus, 5–15 P. 0.54, AF 0.76,1969 austriacus known P. austriacus AM
alive each yr; 0.45, AF 0.62.IR/LT.
Plecotus auritus, Bands, 401, nurseries Descriptive; com- Geometric mean Boyd and England, 1975–1985 in bat boxes. Two parisons of ana- annual survival Stebbings
methods: KAC IR, lytical methods. estimates 0.78 ± (1989)CJS. Integrated with 0.03 SE AF (range
reproduction, sex 0.68–0.98 over 9 ratio, and popu- annual estimates),lation size 0.62 ± 0.08 SE information. AM (range 0.49–
0.94). AF survival = 0.86 using regression corrected for rate of increase and age skewness;uncorrected estimate AF = 0.80,AM = 0.60.
Ch15 (297-336) 10/18/04 1:01 PM Page 335

Summary Species, Methods and Hypotheses of Findings,Location, Years Sample Tested Comments Reference
Rhinolophus Bands, 1,808, pri- Descriptive Simple reporting Hooper (1983)ferrumequinum, marily hibernacula. of number banded England, 1948–1958 Number known and number known
alive each yr after alive by yr.banding.
Rhinolophus Bands, toe claw Descriptive: AM M, F SC similar. Stebbings and ferrumequinum, clipping J, hiber- vs. AF, J vs. A, Survival to ages Arnold (1987)England, ca. 1970– nacula and survival, survival 1 (0.65) and 2 1986 nurseries, hand by season. (0.62) lowest.
captures. IR/LT, Annual survival UAC and KAC increases to 0.86 separately. at age 9. Survival
lowest winter, % varied by yr from 0.55 to 0.85.
Tadarida brasiliensis, Ad hoc extrapo- Descriptive AF survival of 70– Davis et al.Texas, 1957–1958 lation from 80% “reasonable” (1962)
relative areas of (Davis et al. 1962:hypothetical SCs, 337) based on age and best fit by class ratios.age ratios based on 3 classes of tooth wear in 22,498 Fs.
Taphozous georgianus, Bands, 229 J, mist Descriptive Annual survival Jolly (1990)Australia, 1985–1989 nets at caves, sub- F 0.42–0.75, M
tropical. IR/LT. 0.24–0.66.
Ch15 (297-336) 10/18/04 1:01 PM Page 336