surveys - environmental science & policy€¢ prenotice letter, a few days before questionnaire...
TRANSCRIPT
SurveysESP178 Research Methods
Professor Susan Handy2/11/16

But first…
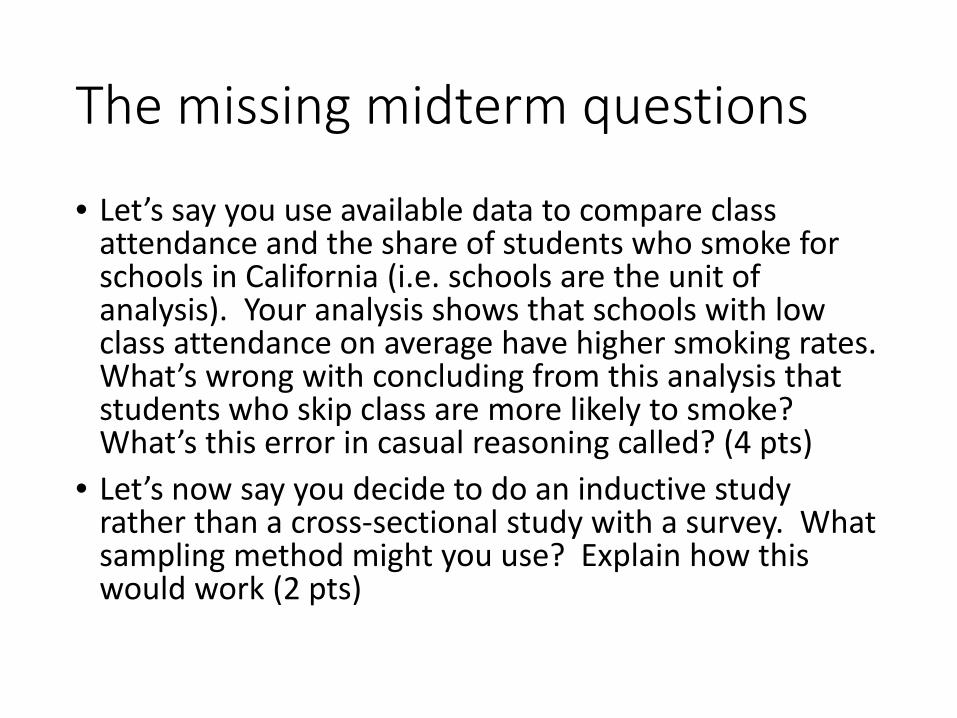
The missing midterm questions
• Let’s say you use available data to compare class attendance and the share of students who smoke for schools in California (i.e. schools are the unit of analysis). Your analysis shows that schools with low class attendance on average have higher smoking rates. What’s wrong with concluding from this analysis that students who skip class are more likely to smoke? What’s this error in casual reasoning called? (4 pts)
• Let’s now say you decide to do an inductive study rather than a cross-sectional study with a survey. What sampling method might you use? Explain how this would work (2 pts)

Surveys!

Type of Question Explanatory ExploratoryType of Research Deductive InductiveType of Data Quantitative QualitativeSampling Probabilistic
RandomRepresentativeLarger
Non-probabilisticConvenient, purposefulIllustrativeSmaller
Data Collection SurveysAvailable data Observation
In-depth interviewsFocus groupsObservation
Types of Data Collection
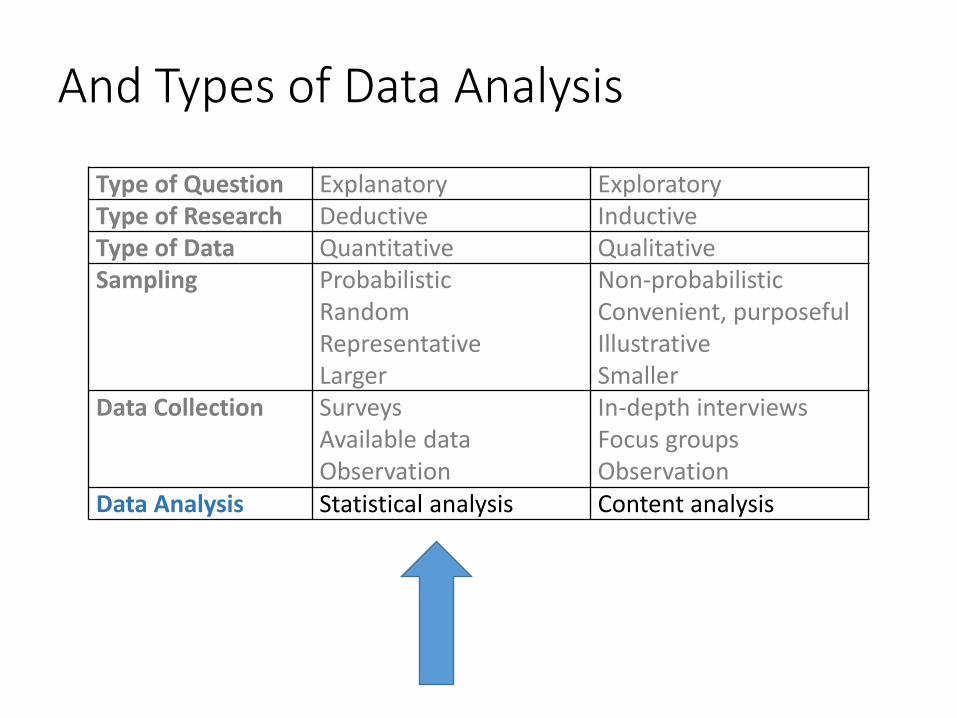
Type of Question Explanatory ExploratoryType of Research Deductive InductiveType of Data Quantitative QualitativeSampling Probabilistic
RandomRepresentativeLarger
Non-probabilisticConvenient, purposefulIllustrativeSmaller
Data Collection SurveysAvailable data Observation
In-depth interviewsFocus groupsObservation
Data Analysis Statistical analysis Content analysis
And Types of Data Analysis
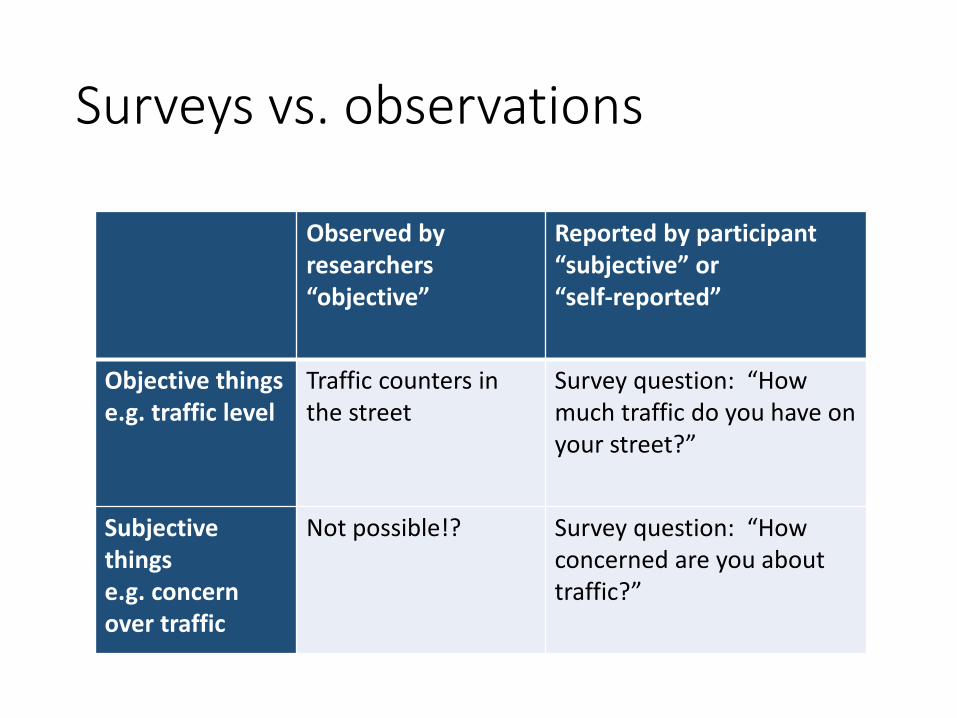
Surveys vs. observations
Observed by researchers“objective”
Reported by participant“subjective” or“self-reported”
Objective thingse.g. traffic level
Traffic counters in the street
Survey question: “How much traffic do you have on your street?”
Subjective thingse.g. concern over traffic
Not possible!? Survey question: “How concerned are you about traffic?”

Survey =standardized questionnaire
to collect dataabout people and
their preferences, thoughts, and behaviors
in a systematic manner


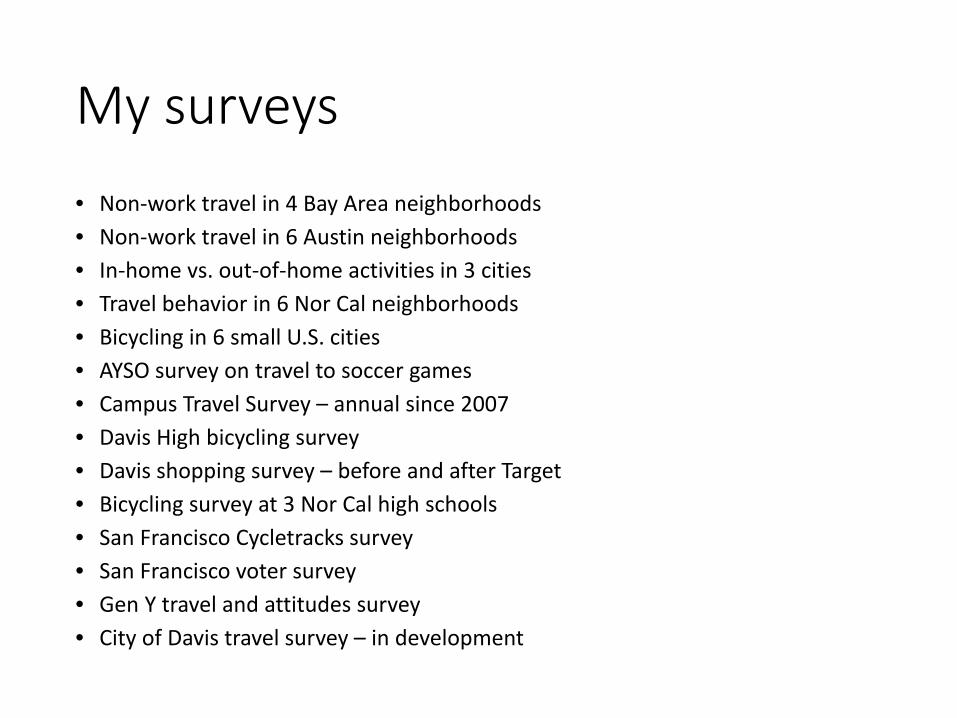
My surveys• Non-work travel in 4 Bay Area neighborhoods• Non-work travel in 6 Austin neighborhoods• In-home vs. out-of-home activities in 3 cities• Travel behavior in 6 Nor Cal neighborhoods• Bicycling in 6 small U.S. cities• AYSO survey on travel to soccer games• Campus Travel Survey – annual since 2007• Davis High bicycling survey• Davis shopping survey – before and after Target• Bicycling survey at 3 Nor Cal high schools• San Francisco Cycletracks survey• San Francisco voter survey• Gen Y travel and attitudes survey• City of Davis travel survey – in development
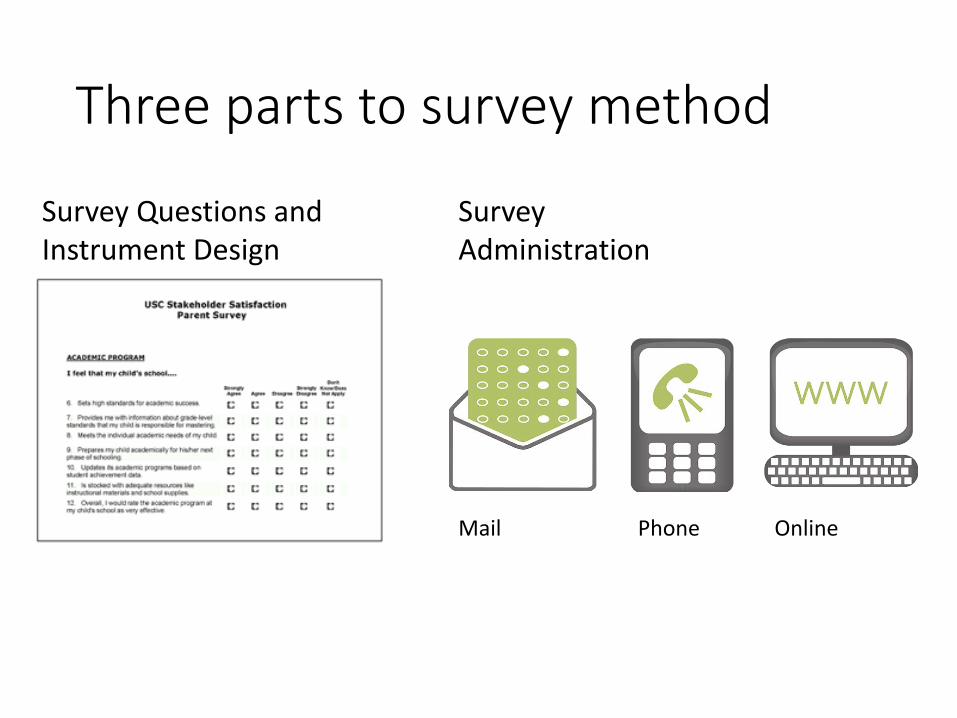
Three parts to survey method
Survey Questions and Instrument Design
Survey Administration
Mail Phone Online
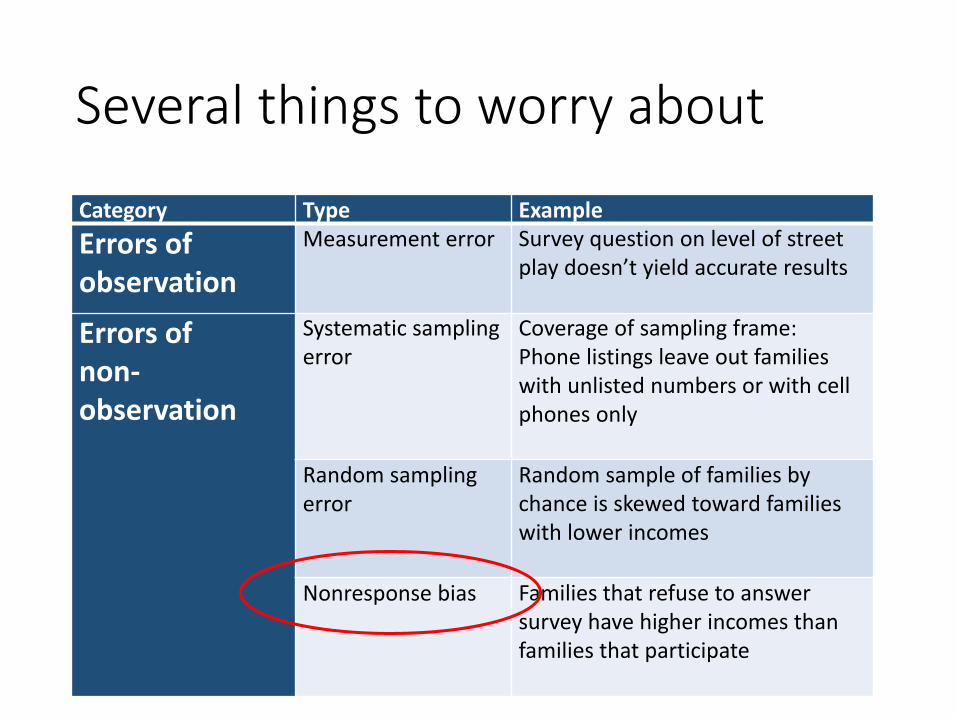
Several things to worry about
Category Type ExampleErrors of observation
Measurement error Survey question on level of street play doesn’t yield accurate results
Errors of non-observation
Systematic sampling error
Coverage of sampling frame:Phone listings leave out families with unlisted numbers or with cell phones only
Random sampling error
Random sample of families by chance is skewed toward families with lower incomes
Nonresponse bias Families that refuse to answer survey have higher incomes than families that participate

Errors of non-observationRandom sampling error
Target Population
Samplingframe
How good is coverage?Systematic sampling error?
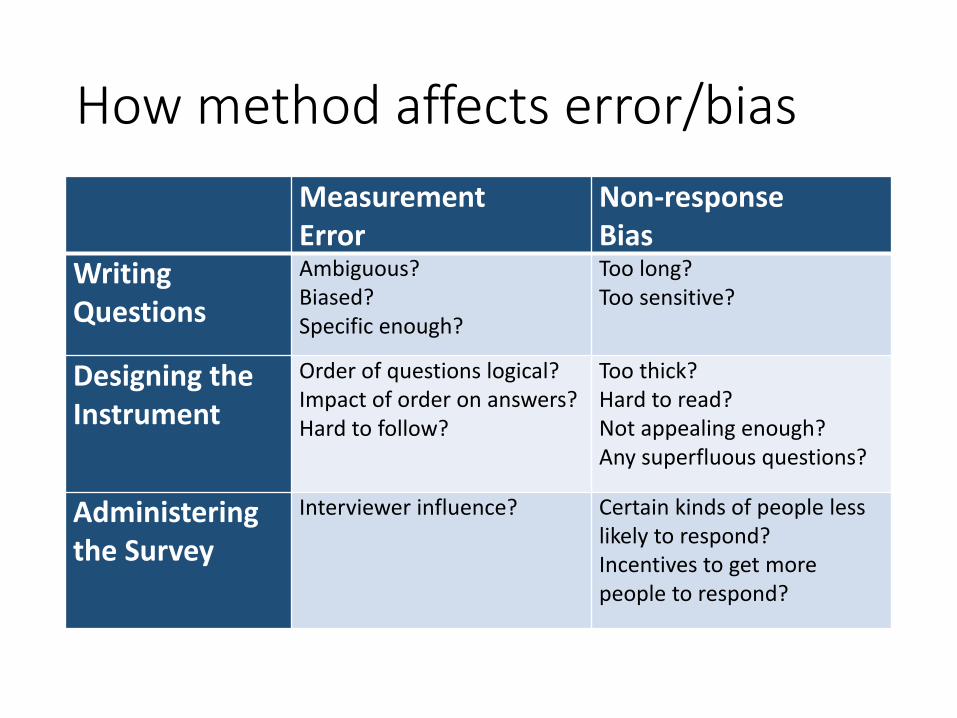
How method affects error/biasMeasurement Error
Non-response Bias
Writing Questions
Ambiguous?Biased?Specific enough?
Too long?Too sensitive?
Designing the Instrument
Order of questions logical?Impact of order on answers?Hard to follow?
Too thick?Hard to read?Not appealing enough?Any superfluous questions?
Administering the Survey
Interviewer influence? Certain kinds of people less likely to respond?Incentives to get more people to respond?

Survey Administration
Mail Phone Online
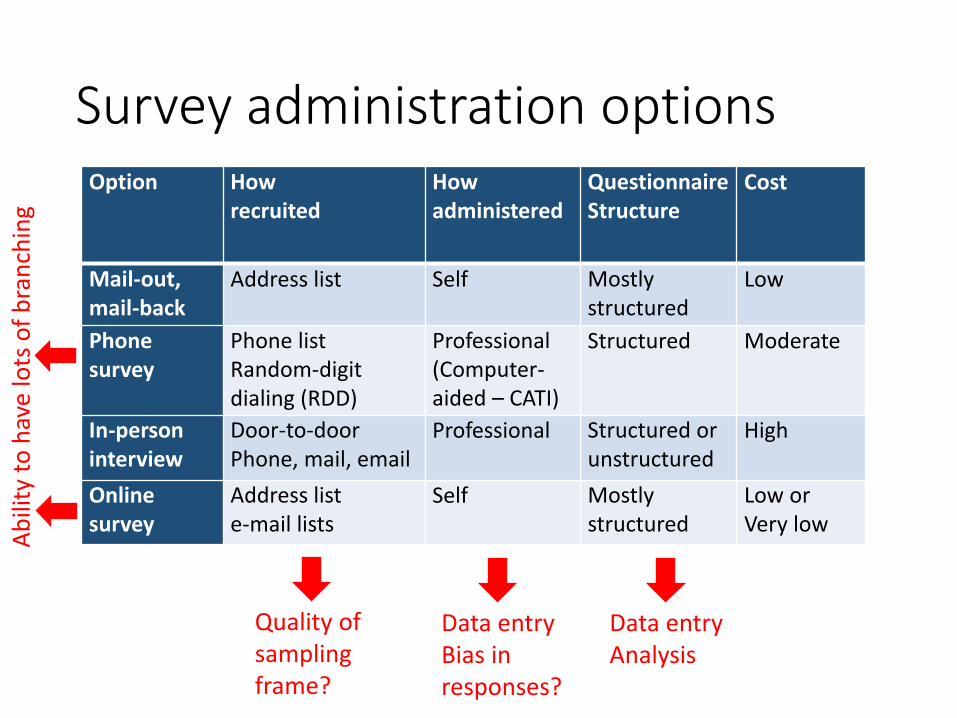
Survey administration optionsOption How
recruitedHow administered
Questionnaire Structure
Cost
Mail-out, mail-back
Address list Self Mostly structured
Low
Phone survey
Phone listRandom-digit dialing (RDD)
Professional(Computer-aided – CATI)
Structured Moderate
In-person interview
Door-to-doorPhone, mail, email
Professional Structured or unstructured
High
Onlinesurvey
Address liste-mail lists
Self Mostly structured
Low orVery low
Quality of sampling frame?
Data entry Bias in responses?
Data entry Analysis
Abili
ty to
hav
e lo
ts o
f bra
nchi
ng
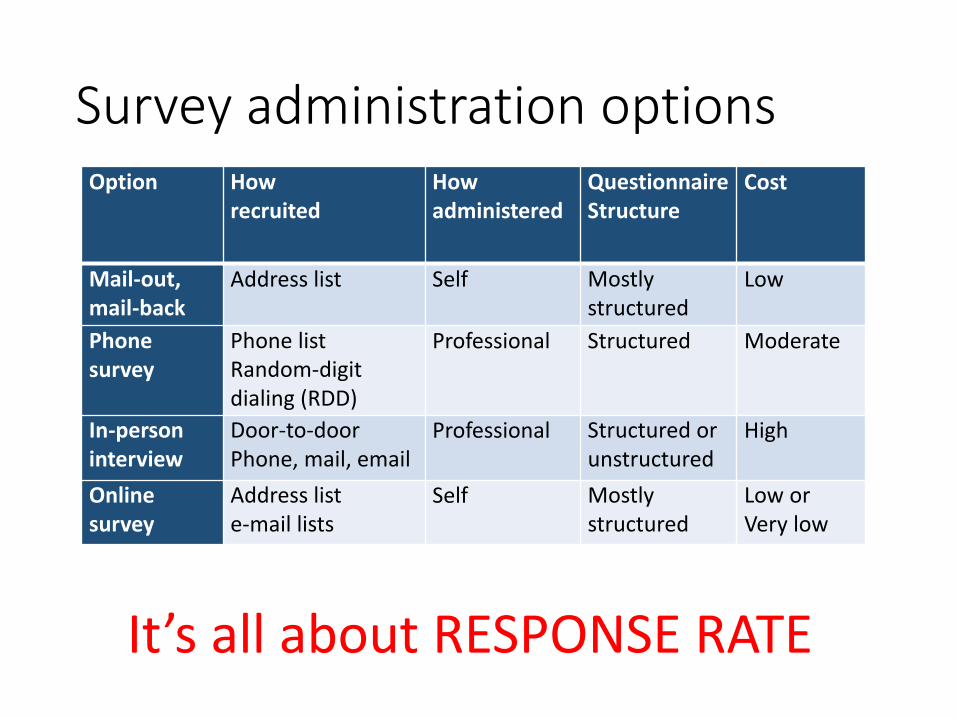
Survey administration optionsOption How
recruitedHow administered
Questionnaire Structure
Cost
Mail-out, mail-back
Address list Self Mostly structured
Low
Phone survey
Phone listRandom-digit dialing (RDD)
Professional Structured Moderate
In-person interview
Door-to-doorPhone, mail, email
Professional Structured or unstructured
High
Onlinesurvey
Address liste-mail lists
Self Mostly structured
Low orVery low
It’s all about RESPONSE RATE

Dillman’s Total Design Method
• Respondent-friendly questionnaire• Four contacts by first class mail, with additional “special”
contact• Prenotice letter, a few days before questionnaire is sent• Questionnaire, with cover letter explaining importance• Thank you postcard, a few days up to a week after questionnaire• Replacement questionnaire, sent to nonrespondents 2-4 weeks
after previous questionnaire mailing• Final contact, by telephone a week or so after fourth contact, or by
fed-ex or express mail 2-4 weeks after previous mailing• Return envelopes with real first-class stamps (vs. business-
reply envelopes)• Personalization of correspondence• Token prepaid financial incentives

Some of my survey examples…
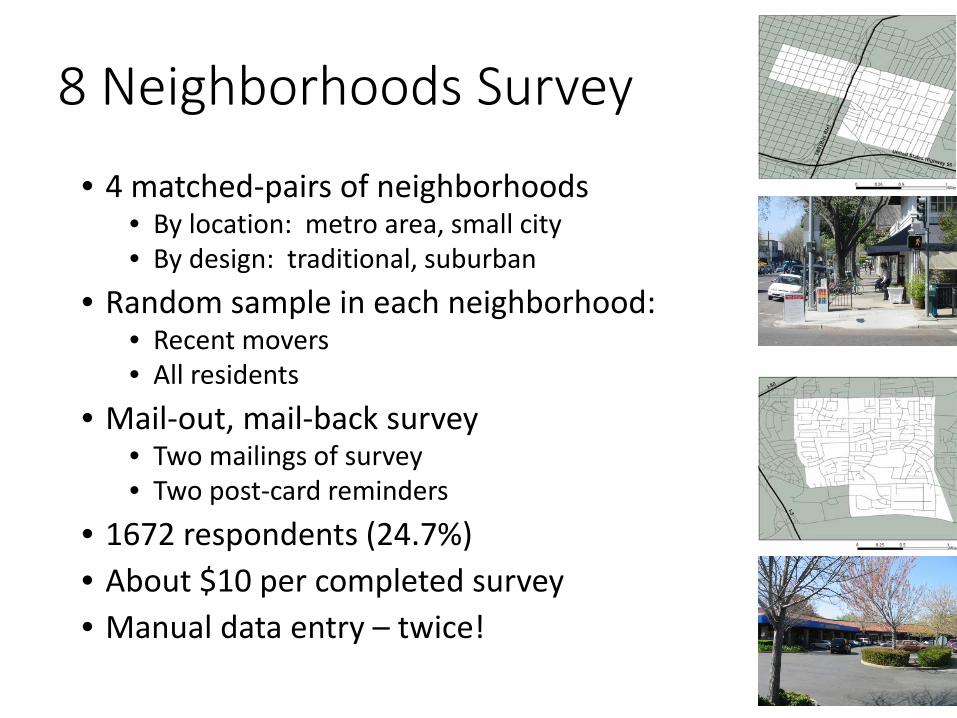
8 Neighborhoods Survey
• 4 matched-pairs of neighborhoods• By location: metro area, small city• By design: traditional, suburban
• Random sample in each neighborhood:• Recent movers• All residents
• Mail-out, mail-back survey• Two mailings of survey• Two post-card reminders
• 1672 respondents (24.7%)• About $10 per completed survey• Manual data entry – twice!

Vehicle Miles Driven per Week
020406080
100120140160180200
Traditional Suburban
148175
18% difference!
Source: Handy, et al. 2006.
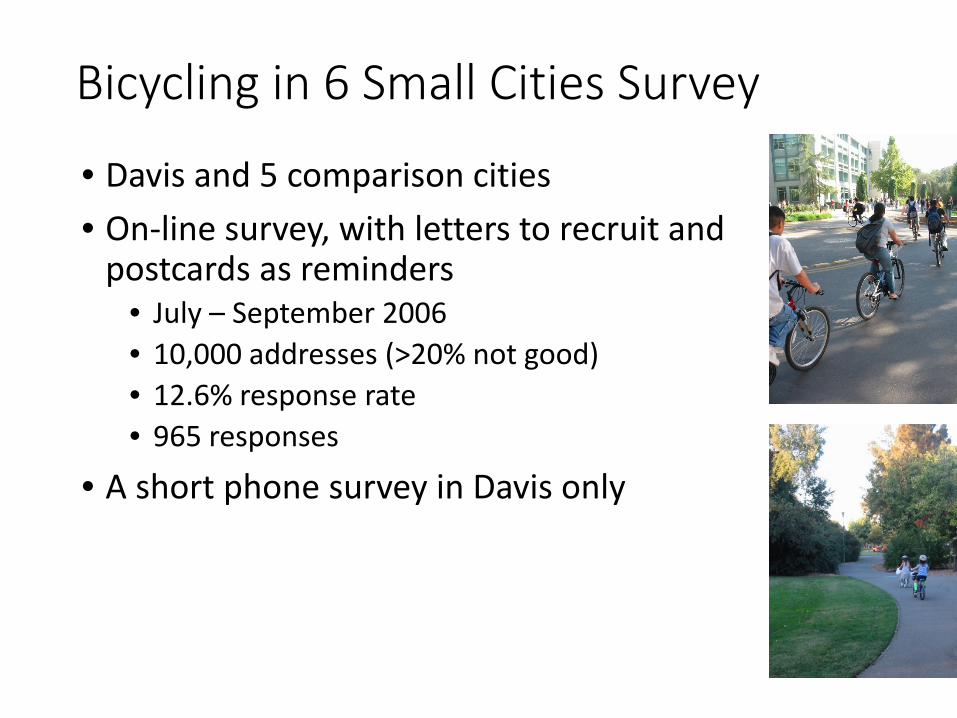
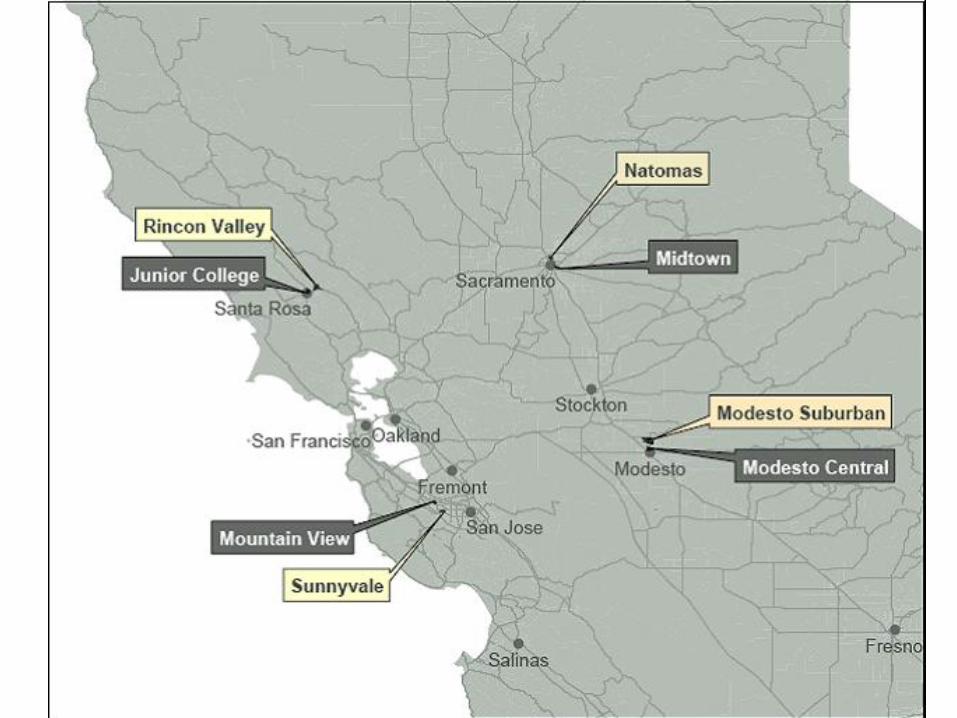
Bicycling in 6 Small Cities Survey
• Davis and 5 comparison cities• On-line survey, with letters to recruit and
postcards as reminders• July – September 2006• 10,000 addresses (>20% not good)• 12.6% response rate• 965 responses
• A short phone survey in Davis only
28
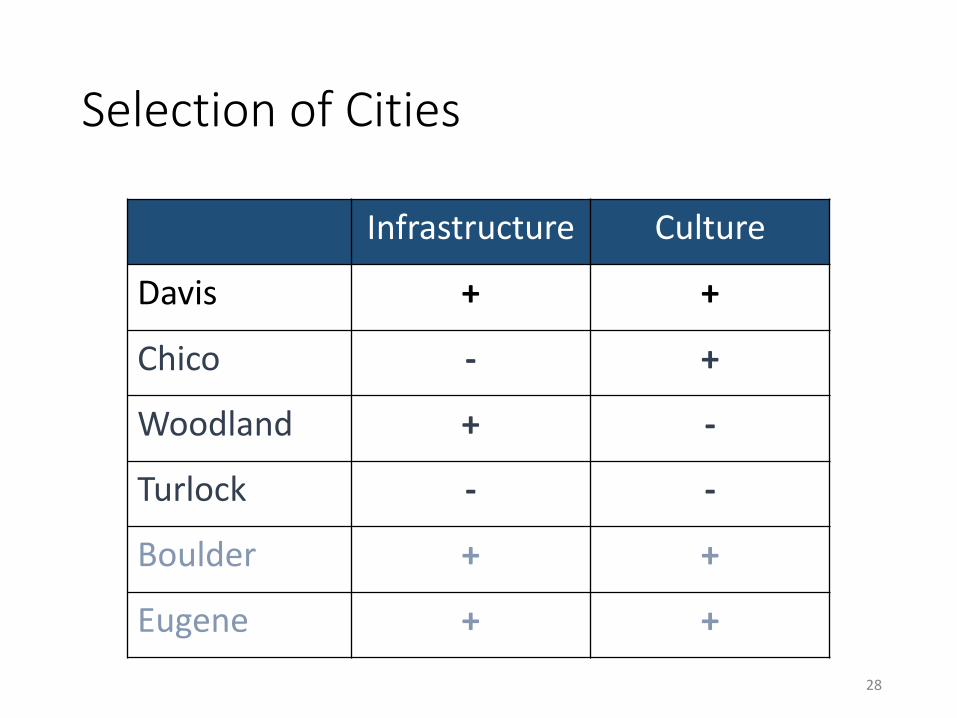
Selection of Cities
Infrastructure Culture
Davis + +
Chico - +
Woodland + -
Turlock - -
Boulder + +
Eugene + +

29
Davis vs. Central Valley Cities
Xing, Handy, and Buehler, presented at the Transportation Research Board Conference, 2008.
10%
20%
30%
40%
50%
60%
70%
80%
Davis Chico Woodland Turlock
Share bicycle ownershipShare biking in last 7 days
30
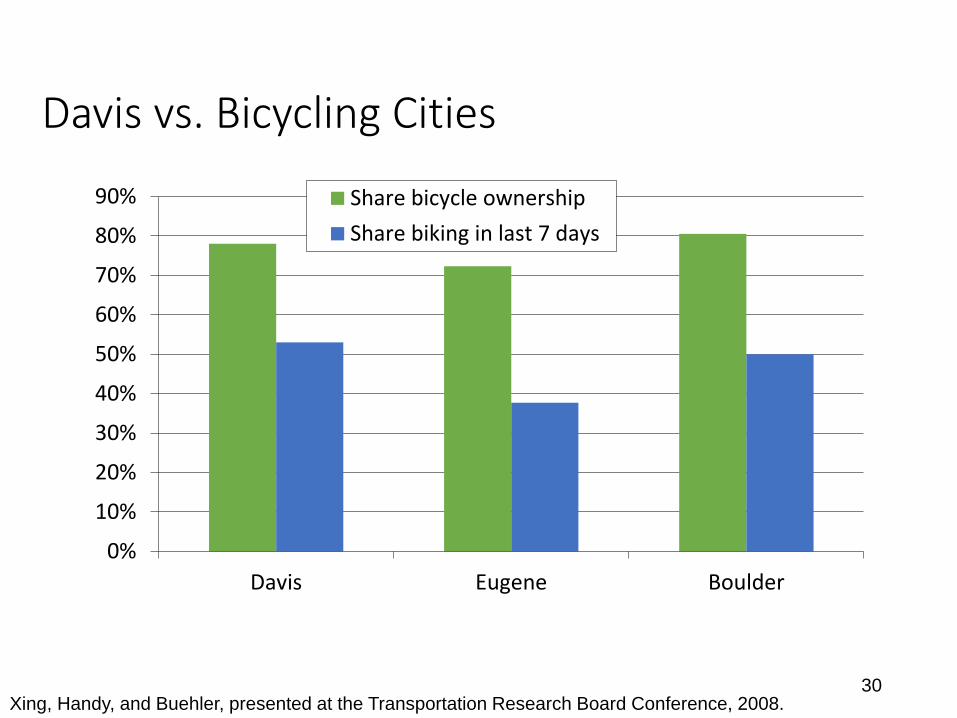
Davis vs. Bicycling Cities
Xing, Handy, and Buehler, presented at the Transportation Research Board Conference, 2008.
0%
10%
20%
30%
40%
50%
60%
70%
80%
90%
Davis Eugene Boulder
Share bicycle ownershipShare biking in last 7 days
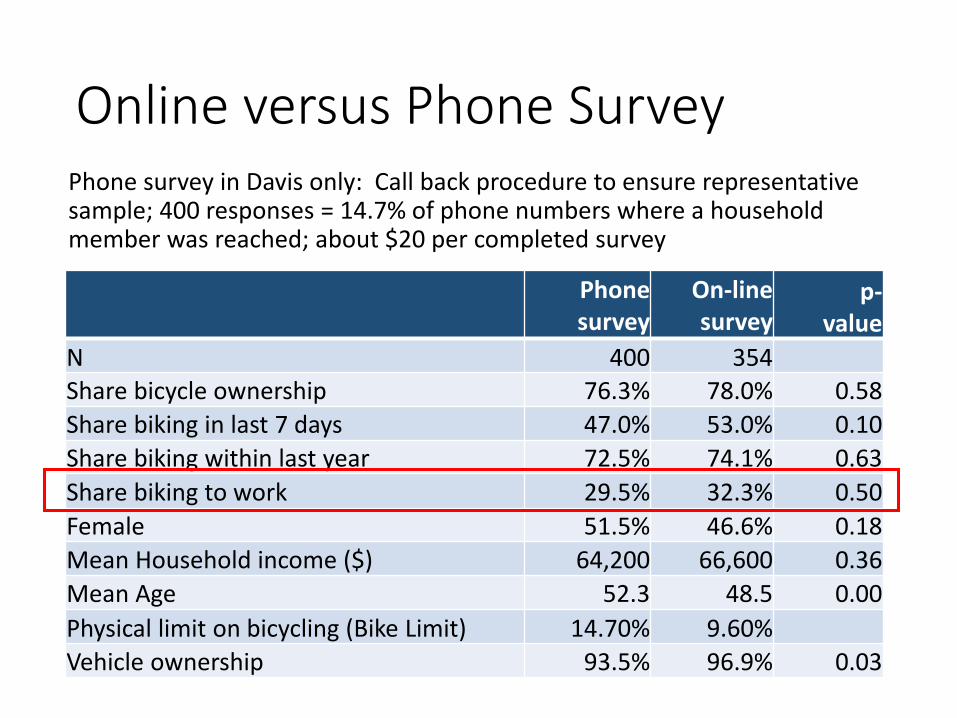
Online versus Phone Survey
Phone survey
On-line survey
p-value
N 400 354Share bicycle ownership 76.3% 78.0% 0.58Share biking in last 7 days 47.0% 53.0% 0.10Share biking within last year 72.5% 74.1% 0.63Share biking to work 29.5% 32.3% 0.50Female 51.5% 46.6% 0.18Mean Household income ($) 64,200 66,600 0.36Mean Age 52.3 48.5 0.00Physical limit on bicycling (Bike Limit) 14.70% 9.60%Vehicle ownership 93.5% 96.9% 0.03
Phone survey in Davis only: Call back procedure to ensure representative sample; 400 responses = 14.7% of phone numbers where a household member was reached; about $20 per completed survey
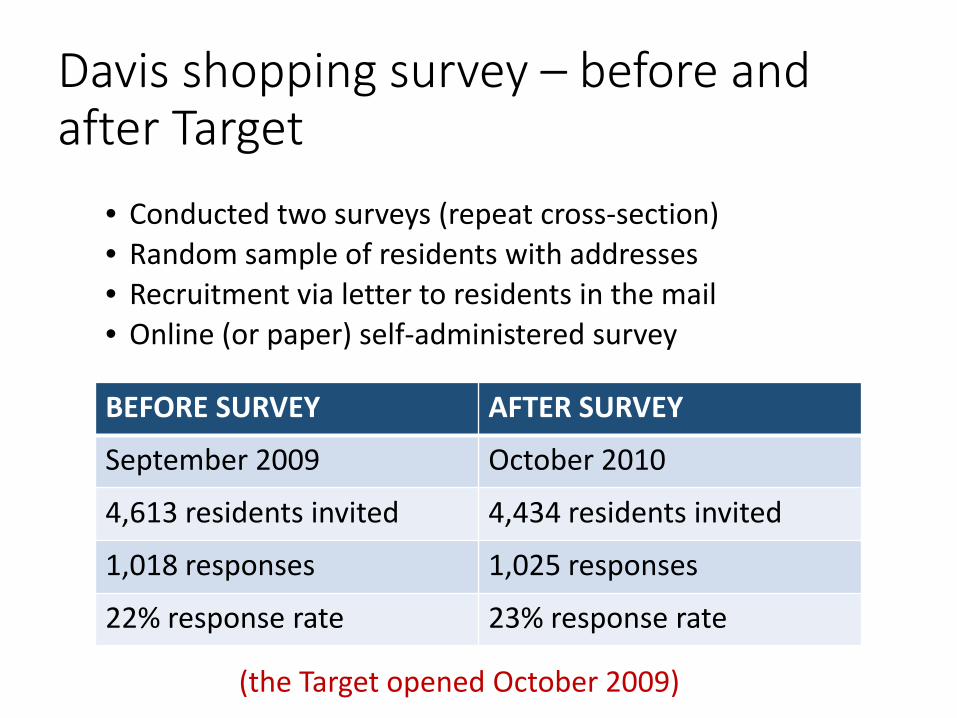
Davis shopping survey – before and after Target
BEFORE SURVEY AFTER SURVEY
September 2009 October 2010
4,613 residents invited 4,434 residents invited
1,018 responses 1,025 responses
22% response rate 23% response rate
• Conducted two surveys (repeat cross-section)• Random sample of residents with addresses• Recruitment via letter to residents in the mail• Online (or paper) self-administered survey
(the Target opened October 2009)

Total shopping VMT per month
***
***
Downtown Davis
Elsewhere in town
Beyond Davis
at Target (in town)
□Overall **
0
20
40
60
80
100
120
Year 1 Year 2
79.696.8
Vehicle-miles (per capita monthly)
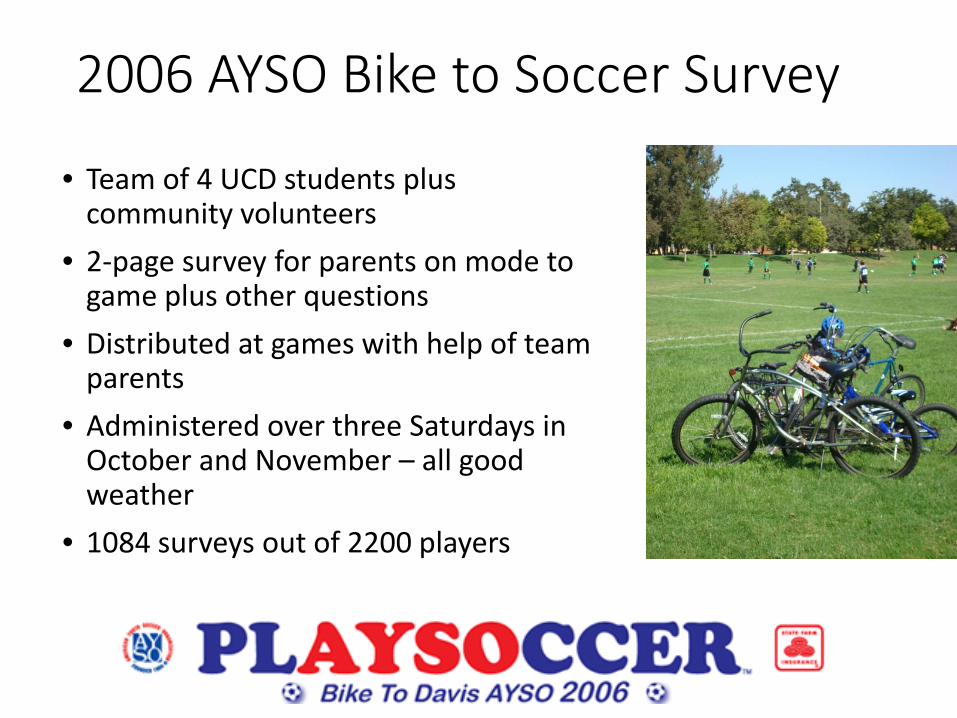
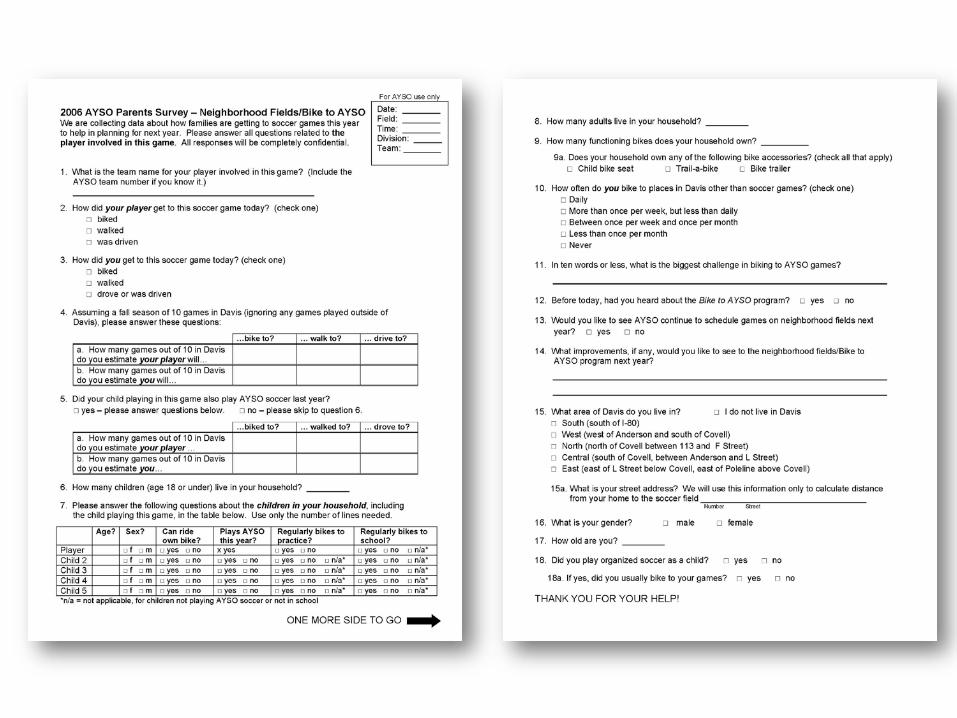
2006 AYSO Bike to Soccer Survey
• Team of 4 UCD students plus community volunteers
• 2-page survey for parents on mode to game plus other questions
• Distributed at games with help of team parents
• Administered over three Saturdays in October and November – all good weather
• 1084 surveys out of 2200 players
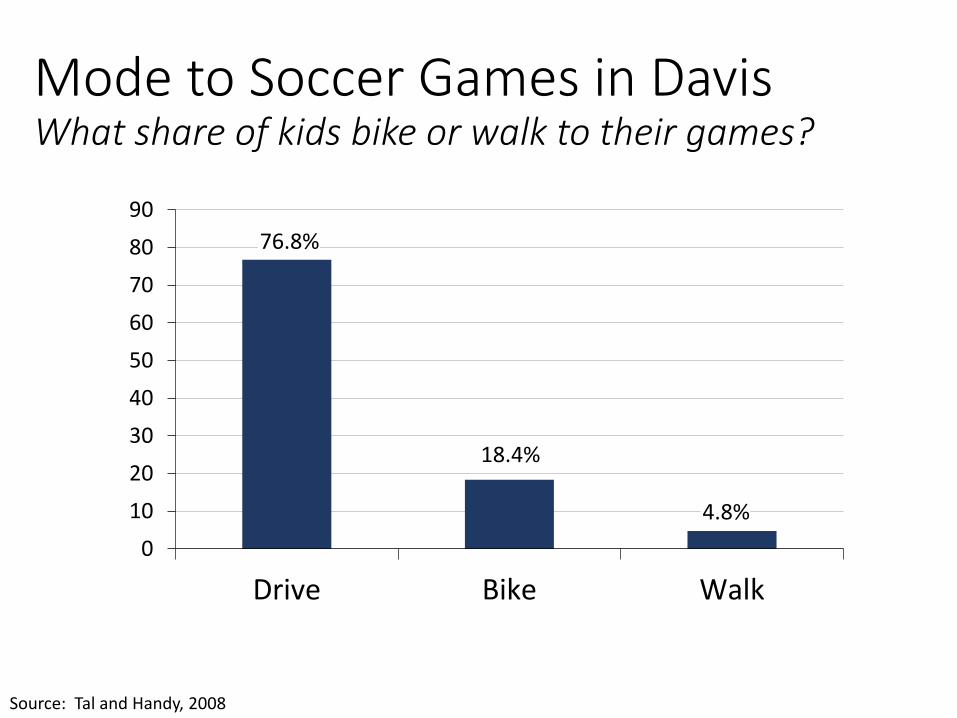
Mode to Soccer Games in DavisWhat share of kids bike or walk to their games?
0102030405060708090
Drive Bike Walk
76.8%
18.4%
4.8%
How much biking and why?
Source: Tal and Handy, 2008
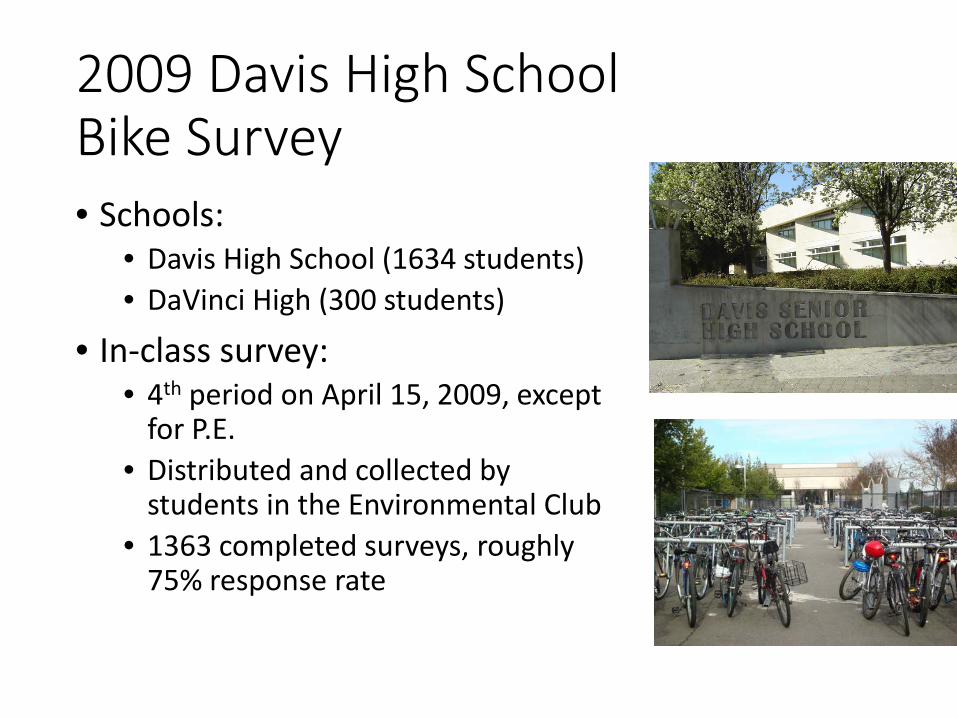
2009 Davis High School Bike Survey• Schools:
• Davis High School (1634 students)• DaVinci High (300 students)
• In-class survey:• 4th period on April 15, 2009, except
for P.E.• Distributed and collected by
students in the Environmental Club• 1363 completed surveys, roughly
75% response rate

Usual mode of travel to school55.1%
34.2%
5.2% 4.2%0.8% 0.4%
0%
10%
20%
30%
40%
50%
60%
I get hereby car
I bicycle I walk I take thebus
Iskateboard
Other
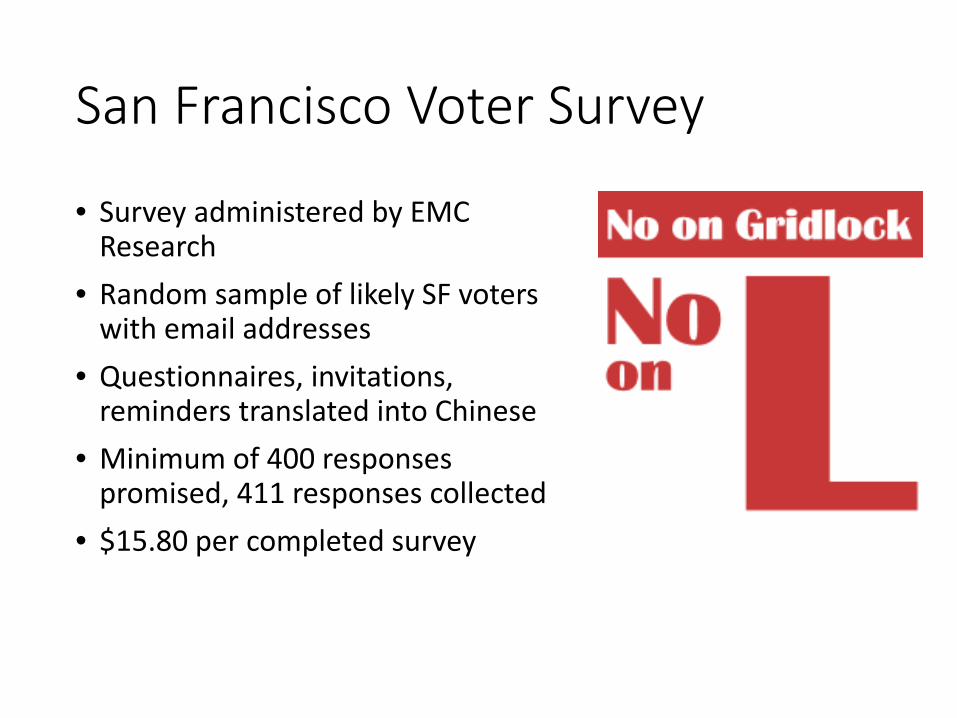
San Francisco Voter Survey
• Survey administered by EMC Research
• Random sample of likely SF voters with email addresses
• Questionnaires, invitations, reminders translated into Chinese
• Minimum of 400 responses promised, 411 responses collected
• $15.80 per completed survey

Survey Questions and Instrument Design

Survey questions = measures of variables
Outdoorplay
Perceived safetyCul-de-sac
Weather
Income
1 or more survey questions for each variable in conceptual model
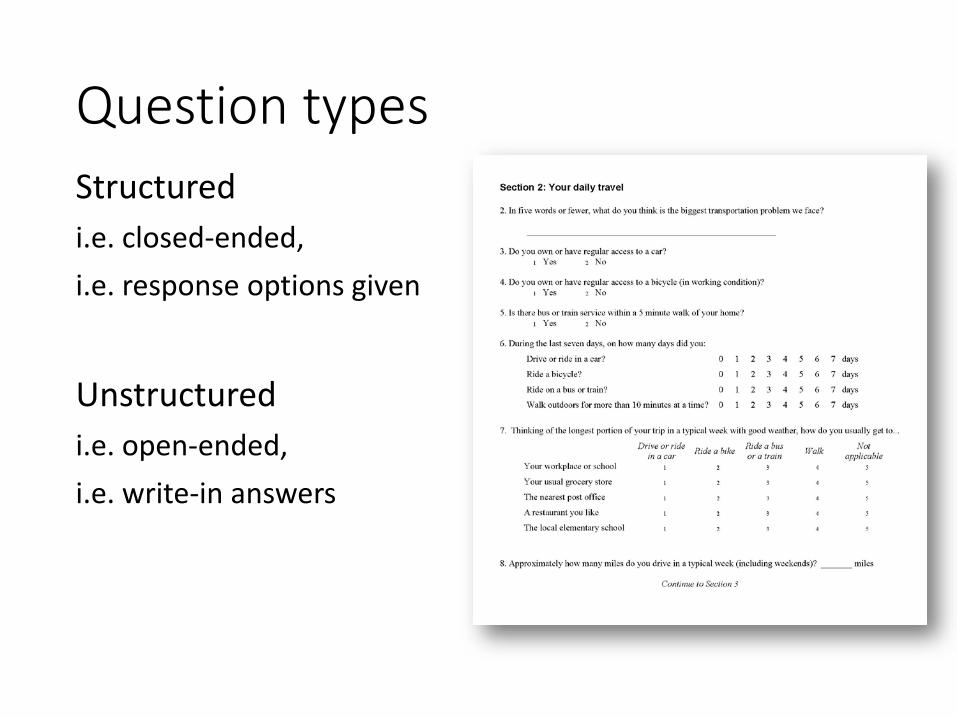
Question typesStructuredi.e. closed-ended, i.e. response options given
Unstructured i.e. open-ended, i.e. write-in answers
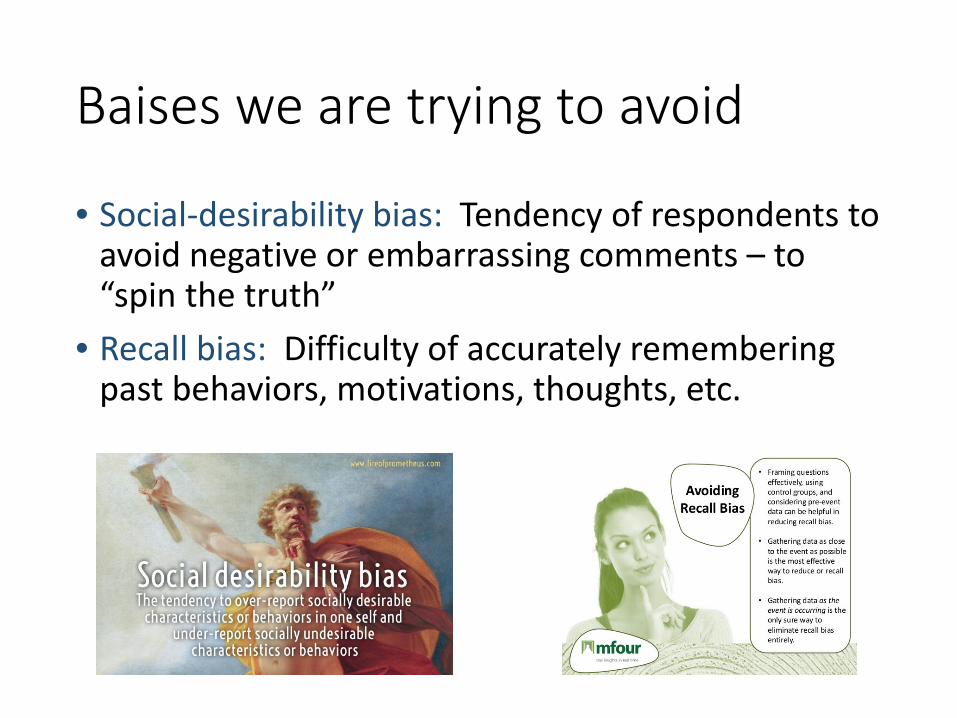
Baises we are trying to avoid
• Social-desirability bias: Tendency of respondents to avoid negative or embarrassing comments – to “spin the truth”
• Recall bias: Difficulty of accurately remembering past behaviors, motivations, thoughts, etc.
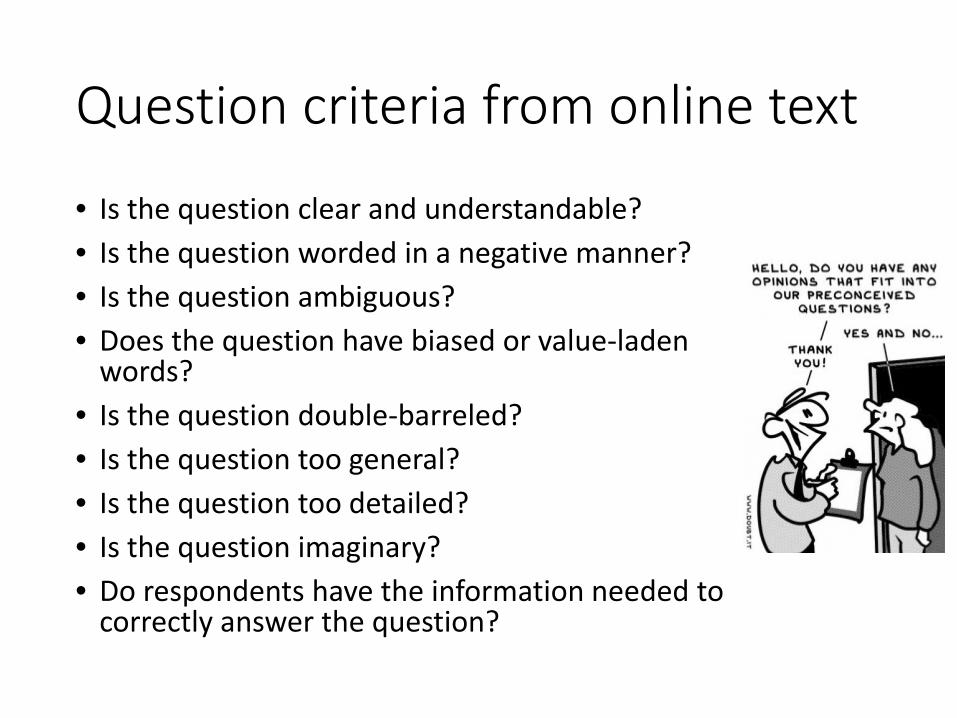
Question criteria from online text
• Is the question clear and understandable?• Is the question worded in a negative manner?• Is the question ambiguous?• Does the question have biased or value-laden
words?• Is the question double-barreled?• Is the question too general?• Is the question too detailed?• Is the question imaginary?• Do respondents have the information needed to
correctly answer the question?
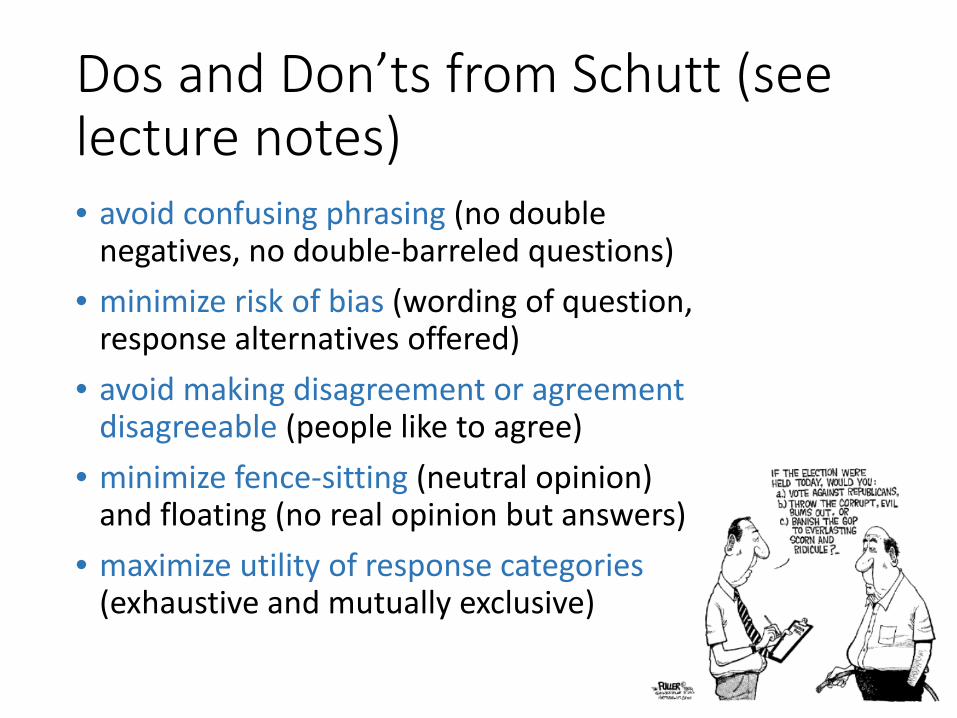
Dos and Don’ts from Schutt (see lecture notes)• avoid confusing phrasing (no double
negatives, no double-barreled questions)• minimize risk of bias (wording of question,
response alternatives offered)• avoid making disagreement or agreement
disagreeable (people like to agree)• minimize fence-sitting (neutral opinion)
and floating (no real opinion but answers)• maximize utility of response categories
(exhaustive and mutually exclusive)
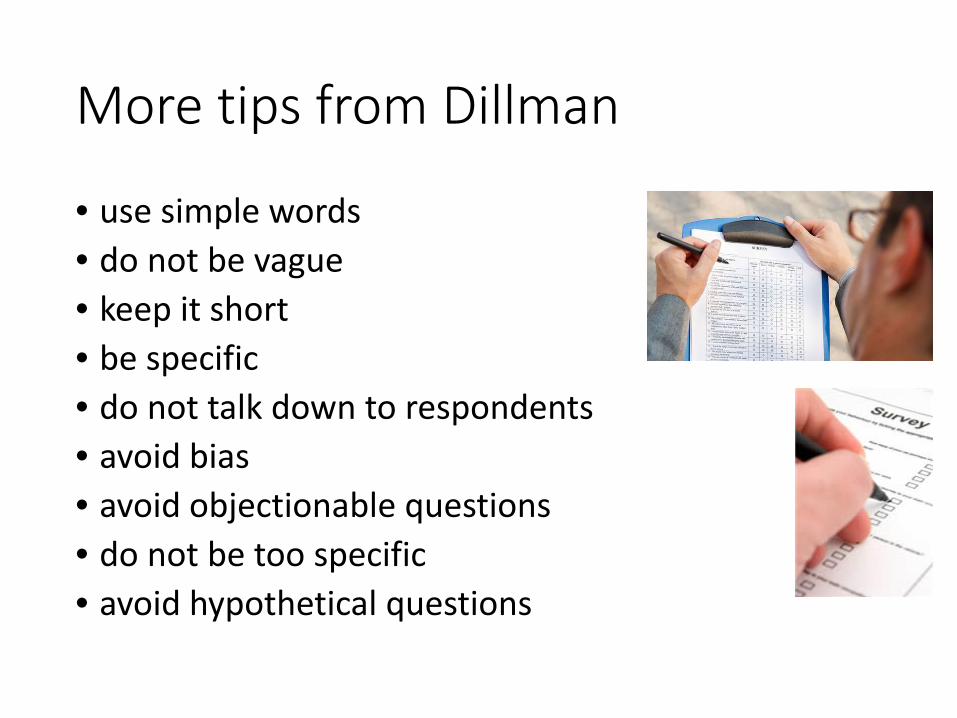
More tips from Dillman
• use simple words• do not be vague• keep it short• be specific• do not talk down to respondents• avoid bias• avoid objectionable questions• do not be too specific• avoid hypothetical questions

Let’s try it out…

What’s wrong with this question?
How often does your child play out in front of your house?
□ Never□ Rarely□ Occasionally□ Regularly
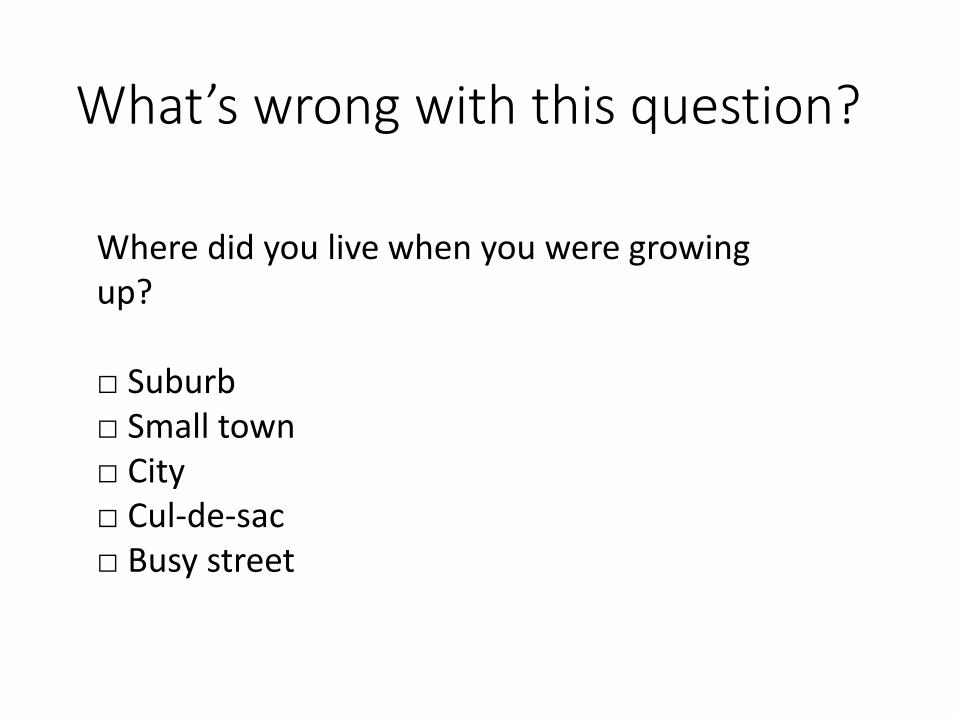
What’s wrong with this question?
Where did you live when you were growing up?
□ Suburb□ Small town□ City□ Cul-de-sac□ Busy street
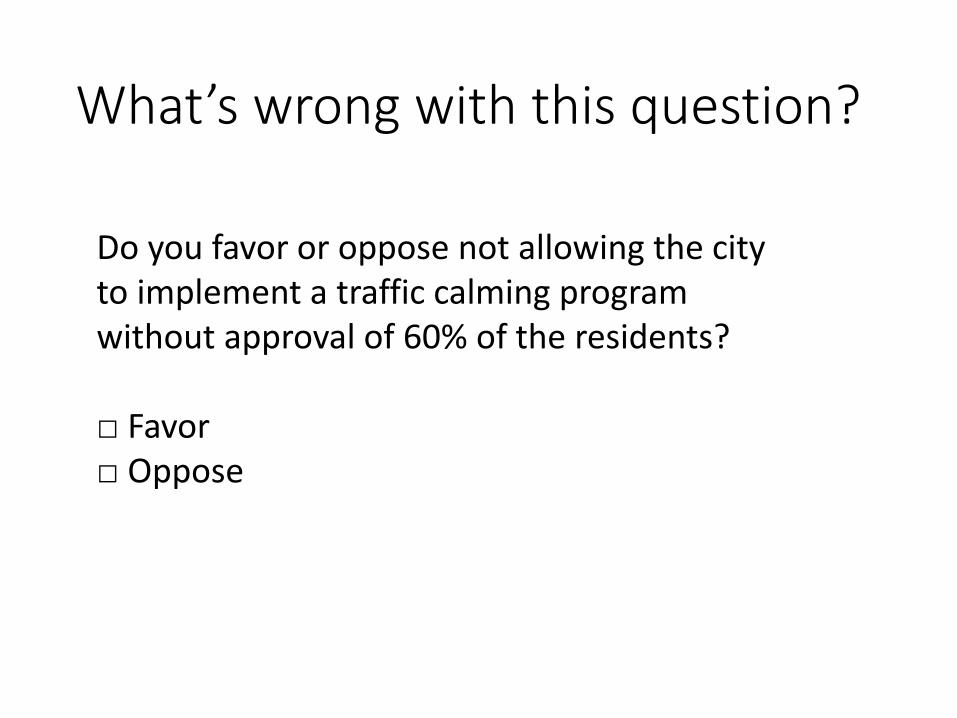
What’s wrong with this question?
Do you favor or oppose not allowing the city to implement a traffic calming program without approval of 60% of the residents?
□ Favor□ Oppose
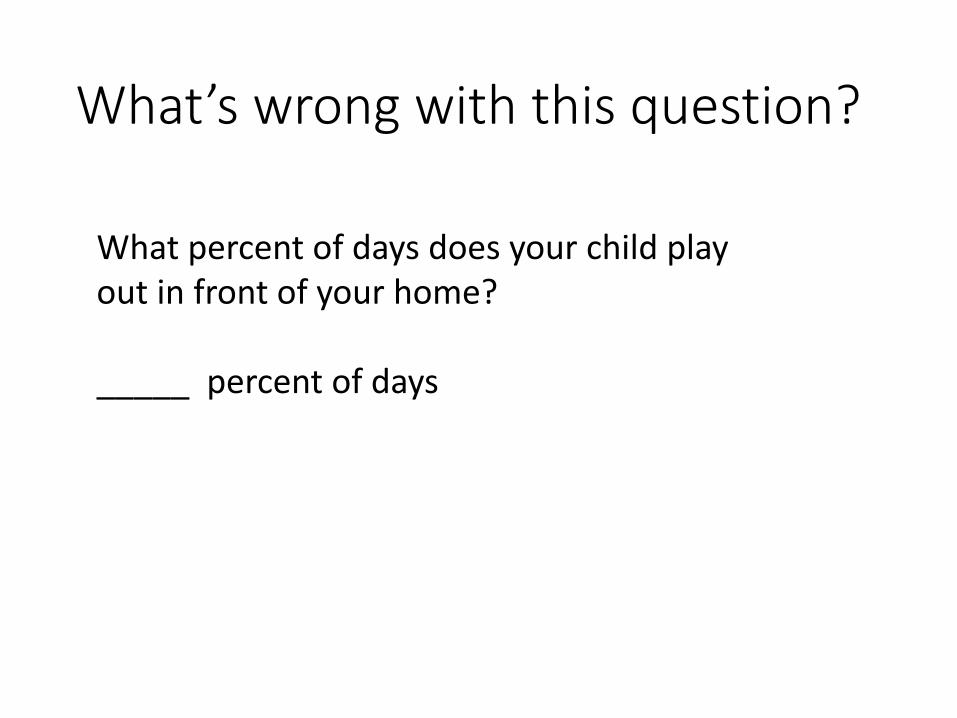
What’s wrong with this question?
What percent of days does your child play out in front of your home?
_____ percent of days
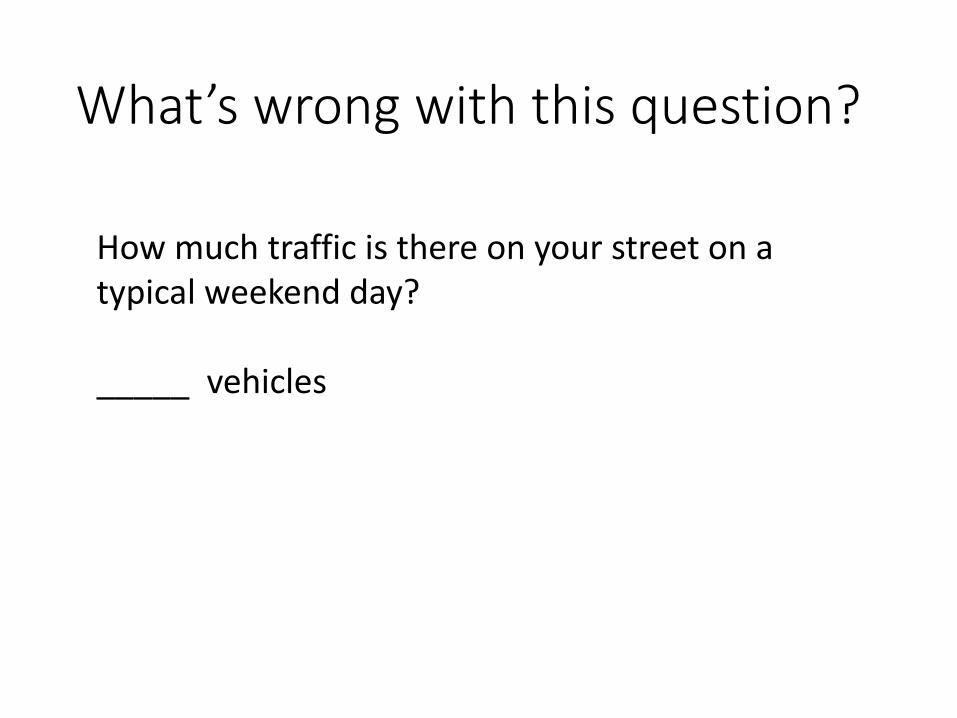
What’s wrong with this question?
How much traffic is there on your street on a typical weekend day?
_____ vehicles
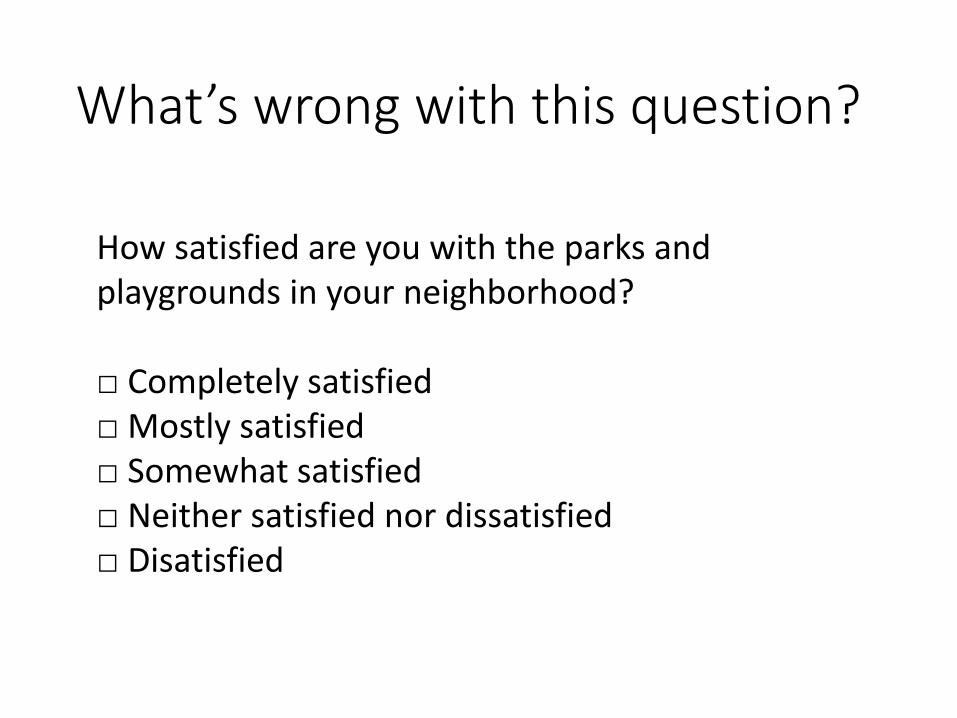
What’s wrong with this question?
How satisfied are you with the parks and playgrounds in your neighborhood?
□ Completely satisfied□ Mostly satisfied□ Somewhat satisfied□ Neither satisfied nor dissatisfied□ Disatisfied

What’s wrong with this question?
Which one of the following do you feel is most responsible for the increase in childhood obesity in the U.S.?
□ Irresponsible parents□ Television□ School policies

What’s wrong with this question?
Don’t you think that parents should encourage their children to get more physical activity?
□ Yes□ No
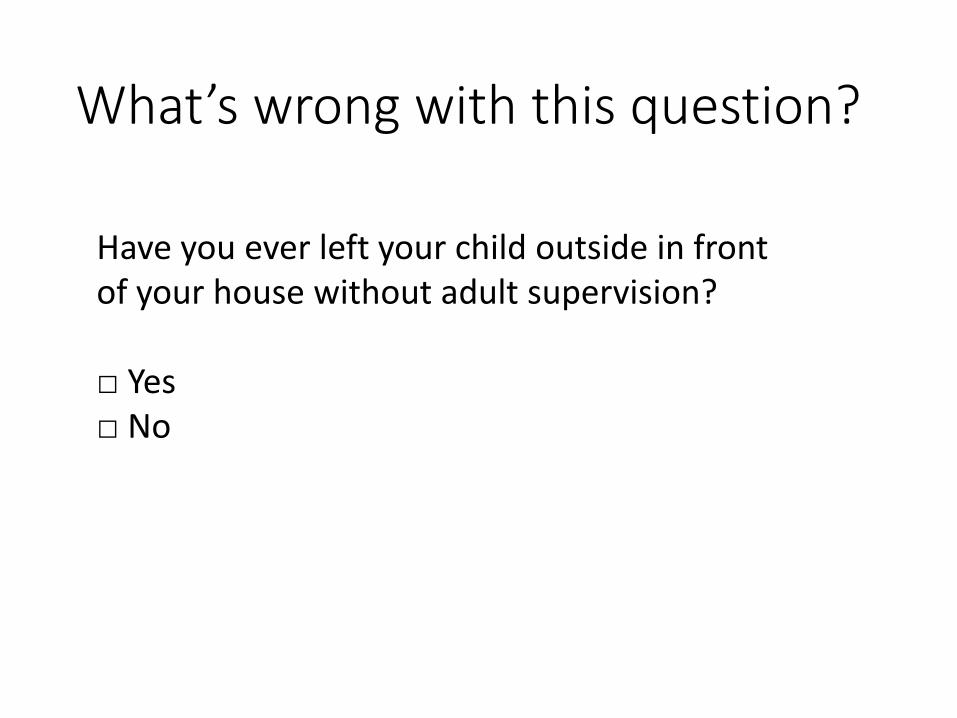
What’s wrong with this question?
Have you ever left your child outside in front of your house without adult supervision?
□ Yes□ No
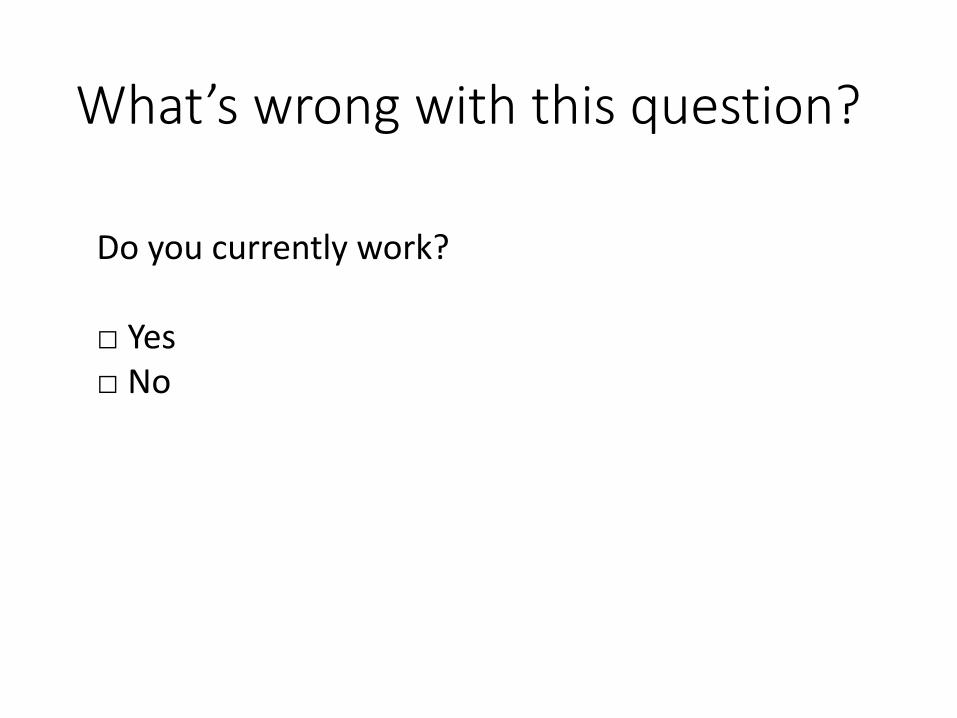
What’s wrong with this question?
Do you currently work?
□ Yes□ No
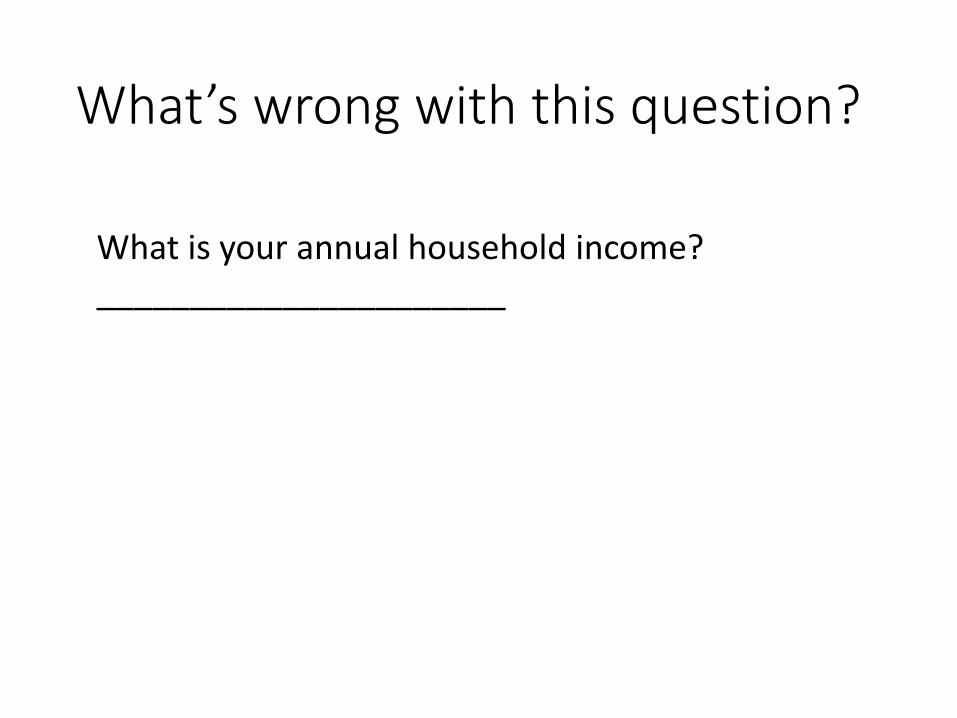
What’s wrong with this question?
What is your annual household income?______________________
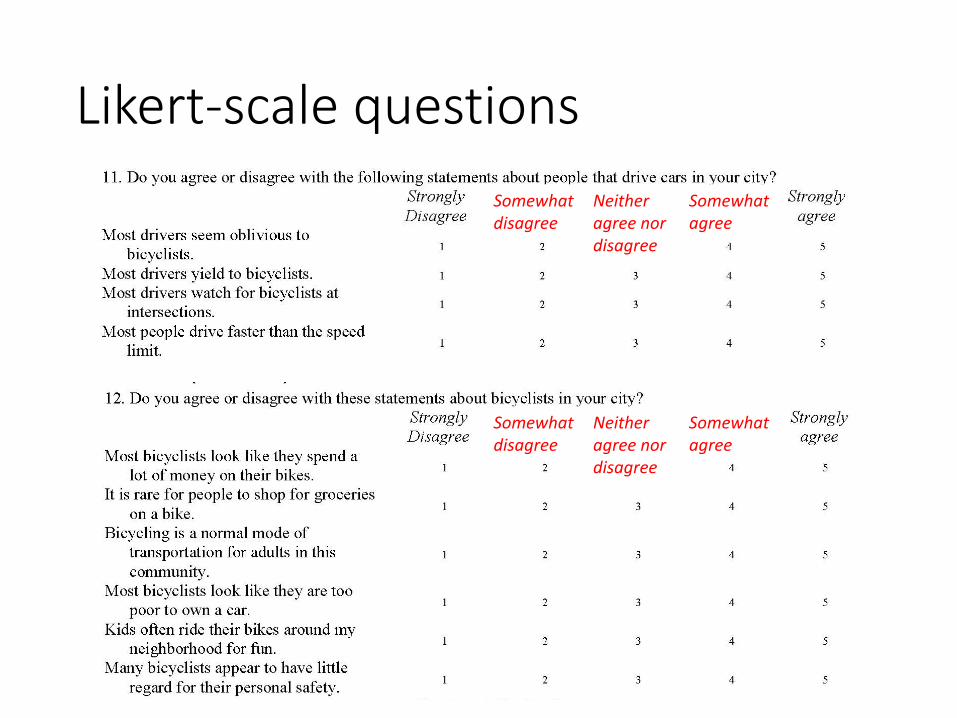
Likert-scale questionsSomewhat disagree
Somewhat agree
Neither agree nor disagree
Somewhat disagree
Somewhat agree
Neither agree nor disagree
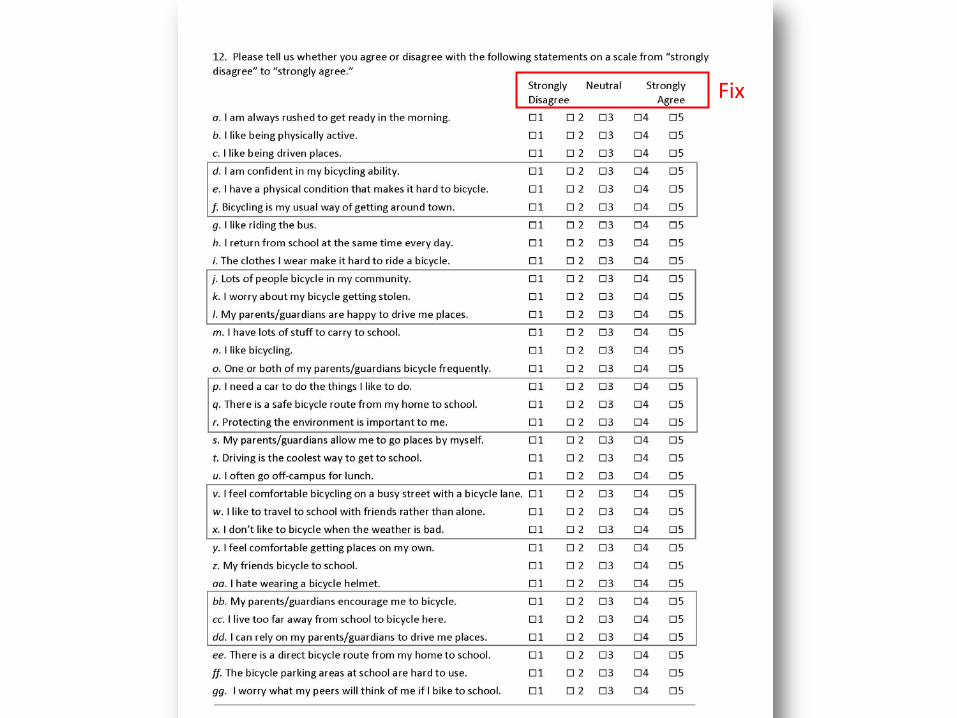
Fix
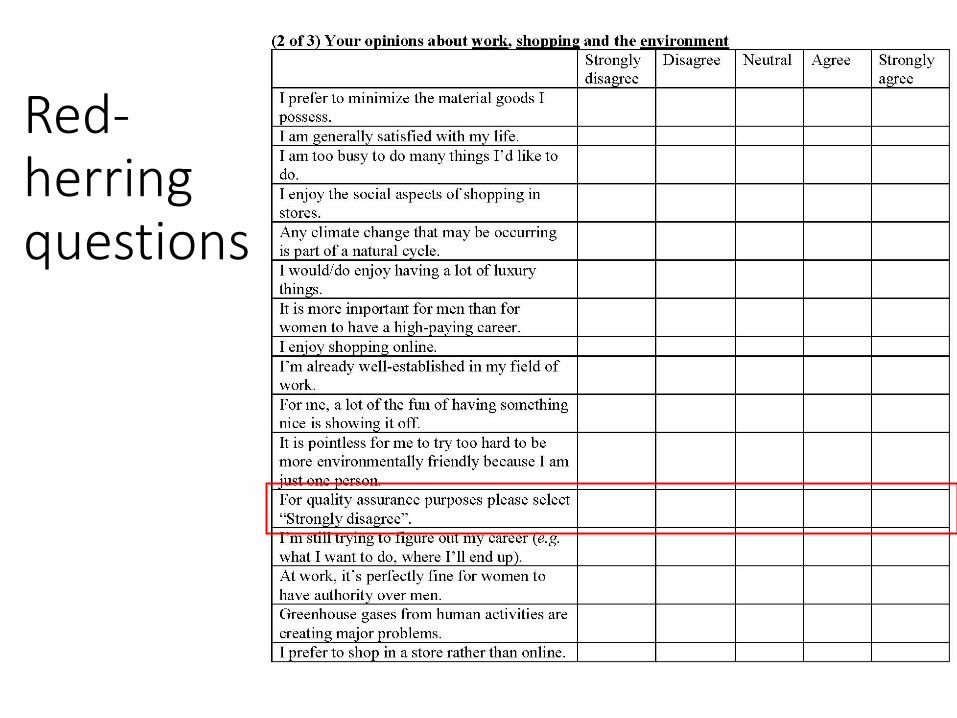
Red-herring questions
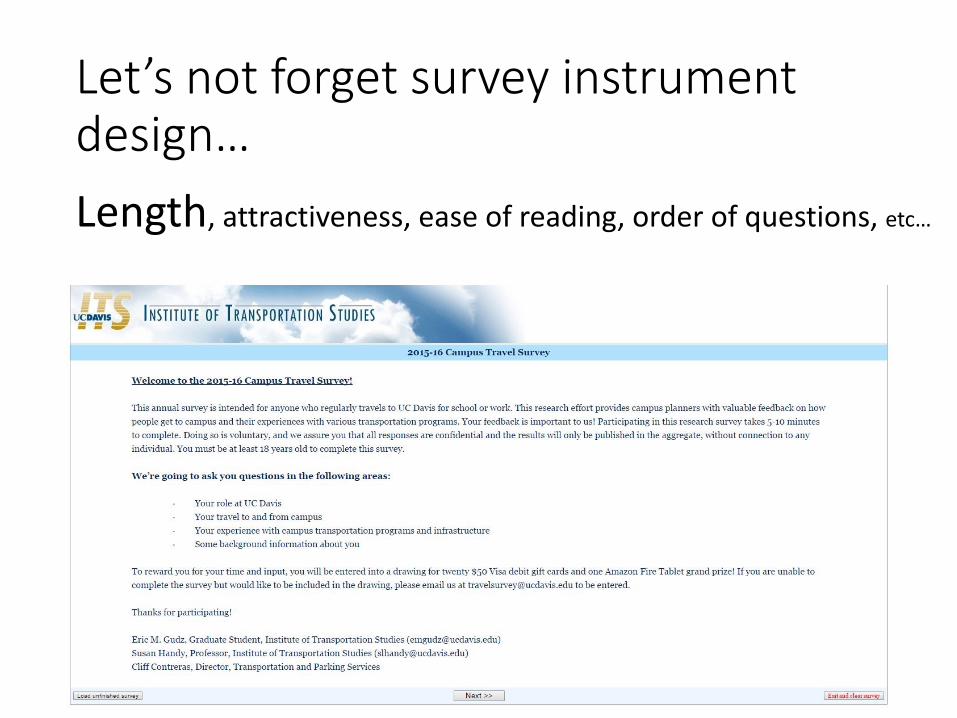
Let’s not forget survey instrument design…Length, attractiveness, ease of reading, order of questions, etc…
Pre-testing!
• Expert panel: experts provide feedback on questions
• Focus groups: convenience sample, group completes and then discusses questions
• Cognitive interviewing: respondent “thinks aloud” while completing the survey
• Pilot tests: try out the survey method on a small scale

Research ProposalAssignment 3!

Assignment 3: Research designWhen to use them…
Cross-sectional To test conceptual model; if variables of interest don’t offer possibility of treatment (e.g. gender, age); as a basis for future intervention studies
Longitudinal To look for changes; if you expect the independent variable to be changing enough over some period of time that you will see a change in the dependent variable
Experimental To test the effect of a treatment, either something you control (“intervention study”) or something someone else controls (“natural experiment”)
See “Research Design Review” handout on website!

To do!
• READ CHAPTER 16 FOR SECTION TOMORROW!• Start Assignment 3• Read on-line text on surveys!• Read articles on surveys!• Exercises on surveys and scales next week