surveyof period variations of superhumpsin suuma-typedwarf
TRANSCRIPT

arX
iv:1
210.
0678
v2 [
astr
o-ph
.SR
] 2
3 Fe
b 20
13PASJ: Publ. Astron. Soc. Japan , 1–??,c© 2018. Astronomical Society of Japan.
Survey of Period Variations of Superhumps in SU UMa-Type Dwarf
Novae. IV: The Fourth Year (2011–2012)
Taichi Kato,1* Franz-Josef Hambsch,2,3,4 Hiroyuki Maehara,5 Gianluca Masi,6 Ian Miller,7 Ryo Noguchi,8
Chihiro Akasaka,8 Tomoya Aoki,8 Hiroshi Kobayashi,8 Katsura Matsumoto,8 Shinichi Nakagawa,8
Takuma Nakazato,8 Takashi Nomoto,8 Kazuyuki Ogura,8 Rikako Ono,8 Keisuke Taniuchi,8 William Stein,9
Arne Henden,10 Enrique de Miguel,11,12 Seiichiro Kiyota,13 Pavol A. Dubovsky,14 Igor Kudzej,14
Kazuyoshi Imamura,15 Hidehiko Akazawa,15 Ryosuke Takagi,15 Yuya Wakabayashi,15 Minako Ogi,15
Kenji Tanabe,15 Joseph Ulowetz,16 Etienne Morelle,17 Roger D. Pickard,18,19 Tomohito Ohshima,1
Kiyoshi Kasai,20 Elena P. Pavlenko,21 Oksana I. Antonyuk,21 Aleksei V. Baklanov,21 Kirill Antonyuk,21
Denis Samsonov,21 Nikolaj Pit,21 Aleksei Sosnovskij,21 Colin Littlefield,22 Richard Sabo,23 Javier Ruiz,24,25
Thomas Krajci,26 Shawn Dvorak,27 Arto Oksanen,28 Kenji Hirosawa,29 William N. Goff,30 Berto Monard,31
Jeremy Shears,32 David Boyd,33 Irina B. Voloshina,34 Sergey Yu. Shugarov,34,35 Drahomir Chochol,35
Atsushi Miyashita,36 Jochen Pietz,37 Natalia Katysheva,34 Hiroshi Itoh,38 Greg Bolt,39
Maksim V. Andreev,40,41 Nikolai Parakhin,40 Viktor Malanushenko,42 Fabio Martinelli,43
Denis Denisenko,44 Chris Stockdale,45 Peter Starr,46 Mike Simonsen,10 Paul. J. Tristram,47
Akihiko Fukui,48 Tamas Tordai,49 Robert Fidrich,49 Kevin B. Paxson,50 Koh-ichi Itagaki,51
Youichirou Nakashima,52 Seiichi Yoshida,53 Hideo Nishimura,54 Timur V. Kryachko,55
Andrey V. Samokhvalov,55 Stanislav A. Korotkiy,55 Boris L. Satovski,55 Rod Stubbings,56 Gary Poyner,57
Eddy Muyllaert,58 Vladimir Gerke,59 Walter MacDonald II,60 Michael Linnolt,10 Yutaka Maeda,61
Hubert Hautecler,581 Department of Astronomy, Kyoto University, Kyoto 606-8502
∗[email protected] Groupe Europeen d’Observations Stellaires (GEOS), 23 Parc de Levesville, 28300 Bailleau l’Eveque, France
3 Bundesdeutsche Arbeitsgemeinschaft fur Veranderliche Sterne (BAV), Munsterdamm 90, 12169 Berlin, Germany4 Vereniging Voor Sterrenkunde (VVS), Oude Bleken 12, 2400 Mol, Belgium
5 Kwasan and Hida Observatories, Kyoto University, Yamashina, Kyoto 607-84716 The Virtual Telescope Project, Via Madonna del Loco 47, 03023 Ceccano (FR), Italy
7 Furzehill House, Ilston, Swansea, SA2 7LE, UK8 Osaka Kyoiku University, 4-698-1 Asahigaoka, Osaka 582-8582
9 6025 Calle Paraiso, Las Cruces, New Mexico 88012, USA10 American Association of Variable Star Observers, 49 Bay State Rd., Cambridge, MA 02138, USA
11 Departamento de Fısica Aplicada, Facultad de Ciencias Experimentales, Universidad de Huelva, 21071 Huelva, Spain12 Center for Backyard Astrophysics, Observatorio del CIECEM, Parque Dunar, Matalascanas, 21760 Almonte, Huelva, Spain
13 Variable Star Observers League in Japan (VSOLJ), 405-1003 Matsushiro, Tsukuba, Ibaraki 305-003514 Vihorlat Observatory, Mierova 4, Humenne, Slovakia
15 Department of Biosphere-Geosphere System Science, Faculty of Informatics, Okayama University of Science, 1-1 Ridai-cho,
Okayama, Okayama 700-000516 Center for Backyard Astrophysics Illinois, Northbrook Meadow Observatory, 855 Fair Ln, Northbrook, Illinois 60062, USA
17 9 rue Vasco de GAMA, 59553 Lauwin Planque, France18 The British Astronomical Association, Variable Star Section (BAA VSS), Burlington House, Piccadilly, London, W1J
0DU, UK19 3 The Birches, Shobdon, Leominster, Herefordshire, HR6 9NG, UK
20 Baselstrasse 133D, CH-4132 Muttenz, Switzerland21 Crimean Astrophysical Observatory, 98409, Nauchny, Crimea, Ukraine
22 Department of Physics, University of Notre Dame, Notre Dame, Indiana 46556, USA23 2336 Trailcrest Dr., Bozeman, Montana 59718, USA
24 Observatorio de Cantabria, Ctra. de Rocamundo s/n, Valderredible, Cantabria, Spain25 Agrupacion Astronomica Cantabra, Apartado 573, 39080-Santander, Spain
26 Astrokolkhoz Observatory, Center for Backyard Astrophysics New Mexico, PO Box 1351 Cloudcroft, New Mexico 83117,
USA27 Rolling Hills Observatory, 1643 Nightfall Drive, Clermont, Florida 34711, USA
28 Nyrola observatory, Jyvaskylan Sirius ry, Vertaalantie 419, FI-40270 Palokka, Finland29 216-4 Maeda, Inazawa-cho, Inazawa-shi, Aichi 492-821730 13508 Monitor Ln., Sutter Creek, California 95685, USA
31 Bronberg Observatory, Center for Backyard Astronomy Pretoria, PO Box 11426, Tiegerpoort 0056, South Africa

2 T. Kato et al. [Vol. ,
32 “Pemberton”, School Lane, Bunbury, Tarporley, Cheshire, CW6 9NR, UK33 Silver Lane, West Challow, Wantage, OX12 9TX, UK
34 Sternberg Astronomical Institute, Lomonosov Moscow University, Universitetsky Ave., 13, Moscow 119992, Russia35 Astronomical Institute of the Slovak Academy of Sciences, 05960, Tatranska Lomnica, the Slovak Republic
36 Seikei Meteorological Observatory, Seikei High School, 3-3-1, Kichijoji-Kitamachi, Musashino-shi, Tokyo 180-863337 Nollenweg 6, 65510 Idstein, Germany
38 VSOLJ, 1001-105 Nishiterakata, Hachioji, Tokyo 192-015339 Camberwarra Drive, Craigie, Western Australia 6025, Australia
40 Institute of Astronomy, Russian Academy of Sciences, 361605 Peak Terskol, Kabardino-Balkaria, Russia41 International Center for Astronomical, Medical and Ecological Research of NASU, Ukraine 27 Akademika Zabolotnoho Str.
03680 Kyiv, Ukraine42 Apache Point Observatory, New Mexico State University, 2001 Apache Point Road, P.O. Box 59, Sunspot, New Mexico
88349-0059, USA43 Palareta, 18-56040 Montecatini, Val Di Cecina, Italy
44 Space Research Institute (IKI), Russian Academy of Sciences, Moscow, Russia45 8 Matta Drive, Churchill, Victoria 3842, Australia
46 Warrumbungle Observatory, Tenby, 841 Timor Rd, Coonabarabran NSW 2357, Australia47 Mt. John Observatory, P.O. Box 56, Lake Tekapo 8770, New Zealand
48 Okayama Astrophysical Observatory, National Astronomical Observatory of Japan, Asakuchi, Okayama 719-023249 Polaris Observatory, Hungarian Astronomical Association, Laborc utca 2/c, 1037 Budapest, Hungary
50 20219 Eden Pines, Spring, Texas 77379, USA51 Itagaki Astronomical Observatory, Teppo-cho, Yamagata 990-249252 968-4 Yamadanoshou, Oku-cho, Setouchi-City, Okayama 701-4246
53 2-4-10-708 Tsunashima-nishi, Kohoku-ku, Yokohama-City, Kanagawa 223-005354 Miyawaki 302-6, Kakegawa, Shizuoka 436-0086
55 Astrotel-Caucasus Observatory, 41 Lenin Street, village Zelenchukskaya Karachay-Cherkessiya, 369140 Russia56 Tetoora Observatory, Tetoora Road, Victoria, Australia
57 BAA Variable Star Section, 67 Ellerton Road, Kingstanding, Birmingham B44 0QE, UK58 Vereniging Voor Sterrenkunde (VVS), Moffelstraat 13 3370 Boutersem, Belgium
59 39-28 Razvilka, Moscow region, 142717 Russia60 Winchester Observatory, P. O. Box 142, Winchester, ON K0C 2K0, Canada
61 Kaminishiyamamachi 12-14, Nagasaki, Nagasaki 850-0006
(Received 201 0; accepted 201 0)
Abstract
Continuing the project described by Kato et al. (2009), we collected times of superhump maxima for86 SU UMa-type dwarf novae mainly observed during the 2011–2012 season. We confirmed the generaltrends recorded in our previous studies, such as the relation between period derivatives and orbital periods.There are some systems showing positive period derivatives despite the long orbital periods. We observedthe 2011 outburst of the WZ Sge-type dwarf nova BW Scl, and recorded an O−C diagram similar tothose of previously known WZ Sge-type dwarf novae. The WZ Sge-type dwarf nova OT J184228.1+483742showed an unusual pattern of double outbursts composed of an outburst with early superhumps andone with ordinary superhumps. We propose an interpretation that a very small growth rate of the 3:1resonance due to an extremely low mass-ratio led to a quenching of the superoutburst before the ordinarysuperhumps appeared. We systematically studied ER UMa-type dwarf novae and found that V1159 Orishowed positive superhumps similar to ER UMa in the 1990s. The recently recognized ER UMa-typeobject BK Lyn dominantly showed negative superhumps, and its behavior was very similar to the present-day state of ER UMa. The pattern of period variations in AM CVn-type objects were very similar toshort-period hydrogen-rich SU UMa-type dwarf novae, making them helium analogue of hydrogen-rich SUUMa-type dwarf novae. SBS 1108+574, a peculiar hydrogen-rich dwarf nova below the period minimum,showed a very similar pattern of period variations to those of short-period SU UMa-type dwarf novae. Themass-ratio derived from the detected orbital period suggests that this secondary is a somewhat evolvedstar whose hydrogen envelope was mostly stripped during the mass-exchange. CC Scl, MASTER OTJ072948.66+593824.4 and OT J173516.9+154708 showed only low-amplitude superhumps with complexprofiles. These superhumps are likely a combination of closely separated two periods.
Key words: accretion, accretion disks — stars: novae, cataclysmic variables — stars: dwarf novae

No. ] Period Variations in SU UMa-Type Dwarf Novae IV 3
1. Introduction
In papers Kato et al. (2009), Kato et al. (2010) and Katoet al. (2012a), we systematically surveyed period varia-tions of superhumps in SU UMa-type dwarf novae (forgeneral information of SU UMa-type dwarf novae and su-perhumps, see e.g. Warner 1995). The period variation ofsuperhumps in many SU UMa-type dwarf novae is gener-ally composed of three distinct stages: early evolutionarystage with a longer superhump period (PSH) (stage A),middle stage with systematically varying periods (stageB), final stage with a shorter, stable superhump period(stage C). These stages are most distinct in objects withshort orbital periods (Porb). Objects with longer orbitalperiods tend to show more gradual changes around thetransition from stage B to C. It was also shown that theperiod derivatives (Pdot = P /P ) during stage B is corre-lated with PSH, or binary mass-ratios (q = M2/M1). InKato et al. (2012a), we also studied global trends in theamplitudes of superhumps, and found that the amplitudesof superhumps are strongly correlated with orbital peri-ods, and the dependence on the inclination is weak innon-eclipsing systems.In the present study, we extended the survey to newly
recorded objects and superoutbursts since the publicationof Kato et al. (2012a).
2. Observation and Analysis
The data were obtained under campaigns led by theVSNET Collaboration (Kato et al. 2004b). In someobjects, we used the public data from the AAVSOInternational Database1. The majority of the data wereacquired by time-resolved CCD photometry by using30 cm-class telescopes, whose observational details onindividual objects will be presented in future papersdealing with analysis and discussion on individual ob-jects. The list of outbursts and observers is summa-rized in table 1. The data analysis was performed justin the same way described in Kato et al. (2009) andKato et al. (2012a). We particularly refer to PhaseDispersion Minimization (PDM; Stellingwerf 1978). Wealso used the Least Absolute Shrinkage and SelectionOperator (Lasso) method (Kato, Uemura 2012) for sep-arating closely spaced periods. The times of all obser-vations are expressed in Barycentric Julian Dates (BJD).We also use the same abbreviations: Porb for the orbitalperiod and ǫ= PSH/Porb− 1 for the fractional superhumpexcess.The derived PSH, Pdot and other parameters are listed
in table 2 in same format as in Kato et al. (2009). Thedefinitions of parameters P1,P2,E1,E2 and Pdot are thesame as in Kato et al. (2009). We also present comparisonsof O−C diagrams between different superoutbursts sincethis has been one of the motivations of these surveys (cf.Uemura et al. 2005).We use the same terminology of superhumps summa-
1 <http://www.aavso.org/data-download>.
Table 3. Superhump maxima of EG Aqr (2011).
E max∗ error O−C† N ‡
0 55740.8707 0.0002 −0.0044 2215 55741.2672 0.0004 −0.0007 11912 55741.8181 0.0008 0.0001 8813 55741.9023 0.0007 0.0058 7893 55748.1819 0.0010 −0.0008 146∗BJD−2400000.†Against max = 2455740.8750+ 0.078577E.‡Number of points used to determine the maximum.
rized in Kato et al. (2012a). We especially call reader’sattention to the term “late superhumps”. We only use“traditional” late superhumps when an ∼0.5 phase shiftis confirmed. Early superhumps are superhumps seen dur-ing the early stages of WZ Sge-type dwarf novae, and haveperiod close to the orbital periods (Kato et al. 1996a; Kato2002a).
3. Individual Objects
3.1. V725 Aquilae
Y. Nakashima detected an outburst of this object on2012 April 16 (vsnet-alert 14450). Subsequent observa-tions confirmed that it is indeed a superoutburst (vsnet-alert 14460). Due to the short visibility in the morning,observations only on two nights were obtained. A PDManalysis yielded a period of 0.09047(5) d. We obtaineda single superhump maximum of BJD 2456036.9734(8)(N = 137). It is noticeable that a likely superoutburstoccurred in 2011 May (vsnet-alert 14460), and the inter-val between the superoutburst was only ∼340 d, which ismuch shorter than previously considered (Uemura et al.2001). The object faded quickly (unfiltered CCD magni-tude 17.6 on April 24) and we probably observed the finalstage of the superoutburst. There was a visual detectionat a magnitude of 14.6 on April 27. The object may haveshown a rebrightening as in the 1999 one (Uemura et al.2001).
3.2. EG Aquarii
The 2011 June superoutburst of this object was de-tected by R. Stubbings at a visual magnitude of 12.5(vsnet-alert 13460). The object was rather unfavorablylocated and the observations were limited than in the paststudies (Imada et al. 2008b; Kato et al. 2009). The timesof superhump maxima are listed in table 3. Althoughthere was likely a stage B–C transition between E = 13and E = 93, the epoch of this transition was not coveredby observations. The Pdot listed in table 2 refers to theglobal Pdot. A comparison of O−C diagrams of EG Aqrbetween different superoutbursts is shown in figure 1.
3.3. SV Arietis
SV Ari was discovered by Wolf, Wolf (1905) whorecorded the object at magnitude 12 on three Heidelbergplates taken on 1905 November 6. The object was not
4 T. Kato et al. [Vol. ,
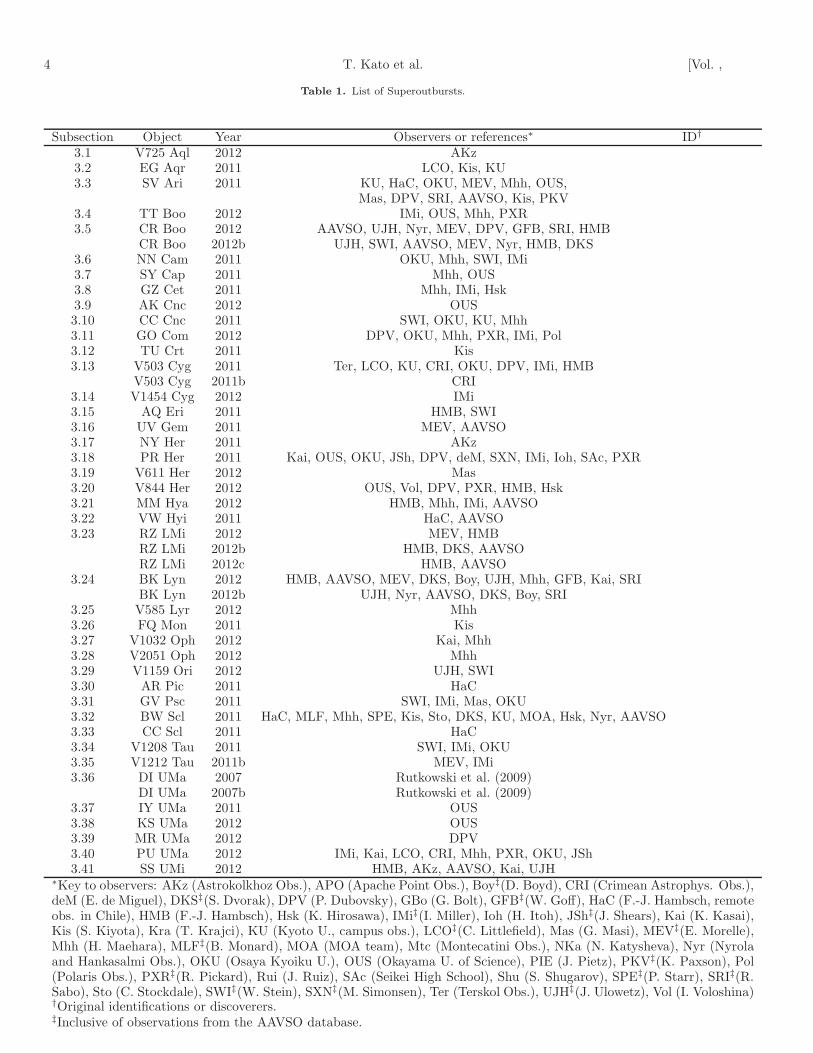
Table 1. List of Superoutbursts.
Subsection Object Year Observers or references∗ ID†
3.1 V725 Aql 2012 AKz3.2 EG Aqr 2011 LCO, Kis, KU3.3 SV Ari 2011 KU, HaC, OKU, MEV, Mhh, OUS,
Mas, DPV, SRI, AAVSO, Kis, PKV3.4 TT Boo 2012 IMi, OUS, Mhh, PXR3.5 CR Boo 2012 AAVSO, UJH, Nyr, MEV, DPV, GFB, SRI, HMB
CR Boo 2012b UJH, SWI, AAVSO, MEV, Nyr, HMB, DKS3.6 NN Cam 2011 OKU, Mhh, SWI, IMi3.7 SY Cap 2011 Mhh, OUS3.8 GZ Cet 2011 Mhh, IMi, Hsk3.9 AK Cnc 2012 OUS3.10 CC Cnc 2011 SWI, OKU, KU, Mhh3.11 GO Com 2012 DPV, OKU, Mhh, PXR, IMi, Pol3.12 TU Crt 2011 Kis3.13 V503 Cyg 2011 Ter, LCO, KU, CRI, OKU, DPV, IMi, HMB
V503 Cyg 2011b CRI3.14 V1454 Cyg 2012 IMi3.15 AQ Eri 2011 HMB, SWI3.16 UV Gem 2011 MEV, AAVSO3.17 NY Her 2011 AKz3.18 PR Her 2011 Kai, OUS, OKU, JSh, DPV, deM, SXN, IMi, Ioh, SAc, PXR3.19 V611 Her 2012 Mas3.20 V844 Her 2012 OUS, Vol, DPV, PXR, HMB, Hsk3.21 MM Hya 2012 HMB, Mhh, IMi, AAVSO3.22 VW Hyi 2011 HaC, AAVSO3.23 RZ LMi 2012 MEV, HMB
RZ LMi 2012b HMB, DKS, AAVSORZ LMi 2012c HMB, AAVSO
3.24 BK Lyn 2012 HMB, AAVSO, MEV, DKS, Boy, UJH, Mhh, GFB, Kai, SRIBK Lyn 2012b UJH, Nyr, AAVSO, DKS, Boy, SRI
3.25 V585 Lyr 2012 Mhh3.26 FQ Mon 2011 Kis3.27 V1032 Oph 2012 Kai, Mhh3.28 V2051 Oph 2012 Mhh3.29 V1159 Ori 2012 UJH, SWI3.30 AR Pic 2011 HaC3.31 GV Psc 2011 SWI, IMi, Mas, OKU3.32 BW Scl 2011 HaC, MLF, Mhh, SPE, Kis, Sto, DKS, KU, MOA, Hsk, Nyr, AAVSO3.33 CC Scl 2011 HaC3.34 V1208 Tau 2011 SWI, IMi, OKU3.35 V1212 Tau 2011b MEV, IMi3.36 DI UMa 2007 Rutkowski et al. (2009)
DI UMa 2007b Rutkowski et al. (2009)3.37 IY UMa 2011 OUS3.38 KS UMa 2012 OUS3.39 MR UMa 2012 DPV3.40 PU UMa 2012 IMi, Kai, LCO, CRI, Mhh, PXR, OKU, JSh3.41 SS UMi 2012 HMB, AKz, AAVSO, Kai, UJH
∗Key to observers: AKz (Astrokolkhoz Obs.), APO (Apache Point Obs.), Boy‡(D. Boyd), CRI (Crimean Astrophys. Obs.),deM (E. de Miguel), DKS‡(S. Dvorak), DPV (P. Dubovsky), GBo (G. Bolt), GFB‡(W. Goff), HaC (F.-J. Hambsch, remoteobs. in Chile), HMB (F.-J. Hambsch), Hsk (K. Hirosawa), IMi‡(I. Miller), Ioh (H. Itoh), JSh‡(J. Shears), Kai (K. Kasai),Kis (S. Kiyota), Kra (T. Krajci), KU (Kyoto U., campus obs.), LCO‡(C. Littlefield), Mas (G. Masi), MEV‡(E. Morelle),Mhh (H. Maehara), MLF‡(B. Monard), MOA (MOA team), Mtc (Montecatini Obs.), NKa (N. Katysheva), Nyr (Nyrolaand Hankasalmi Obs.), OKU (Osaya Kyoiku U.), OUS (Okayama U. of Science), PIE (J. Pietz), PKV‡(K. Paxson), Pol(Polaris Obs.), PXR‡(R. Pickard), Rui (J. Ruiz), SAc (Seikei High School), Shu (S. Shugarov), SPE‡(P. Starr), SRI‡(R.Sabo), Sto (C. Stockdale), SWI‡(W. Stein), SXN‡(M. Simonsen), Ter (Terskol Obs.), UJH‡(J. Ulowetz), Vol (I. Voloshina)†Original identifications or discoverers.‡Inclusive of observations from the AAVSO database.

No. ] Period Variations in SU UMa-Type Dwarf Novae IV 5
Table 1. List of Superoutbursts (continued).
Subsection Object Year Observers or references∗ ID†
3.42 1RXS J231935 2011 MEV, Rui, PIE, OKU, PXR,deM, Mhh, AAVSO, Mtc
3.43 ASAS J224349 2011 IMi3.44 DDE 19 2011 SWI3.45 MASTER J072948 2012 deM, SWI, Shu, IMi, Mhh Balanutsa et al. (2012c)3.46 MASTER J174305 2012 Kra Balanutsa et al. (2012a)3.47 MASTER J182201 2012 Mas Balanutsa et al. (2012b)3.48 MisV 1446 2012 GBo, MLF, Kis, Kai, KU, deM, HaC3.49 SBS 1108 2012 Kai, deM, Vol, LCO,
APO, GFB, Mhh, NKa,CRI, OKU, Kis, Shu
3.50 SDSS J073208 2012 SRI, PXR Wils et al. (2010)3.51 SDSS J080303 2011 deM, OKU, Rui, IMi3.52 SDSS J165359 2012 IMi, Mhh, PXR, OKU, deM3.53 SDSS J170213 2011 MEV, OKU, IMi, DPV,
Mas, LCO, Boy, HMB3.54 SDSS J172102 2012 GFB, Mas Rau et al. (2010)3.55 SDSS J210449 2011 IMi3.56 SDSS J220553 2011 SWI, Mhh, NKa3.57 OT J001952 2012 deM CSS120131:001952+4339013.58 OT J011516 2012 Mas CSS101008:011517+2455303.59 OT J050716 2012 Mas CSS081221:050716+1253143.60 OT J055721 2011 HaC, Mhh SSS111229:055722−3630553.61 OT J064608 2011 SWI, Mas, Rui CSS080512:064608+4033053.62 OT J081117 2011 Rui, Mhh CSS111030:081117+1520033.63 OT J084127 2012 Mas, OKU, PXR CSS090525:084127+2100543.64 OT J094854 2012 HMB, SWI, Mas CSS120315:094854+0149113.65 OT J102842 2012 OKU, Kis, UJH, SWI, deM, HMB CSS090331:102843−0819273.66 OT J105122 2012 SWI, CRI CSS120101:105123+6725283.67 OT J125905 2012 Mas CSS120424:125906+2426343.68 OT J131625 2012 Mas CSS080427:131626−1513133.69 OT J142548 2011 Mas CSS110628:142548+1515023.70 OT J144252 2012 MLF, HaC, LCO CSS120417:144252−2250403.71 OT J144453 2012 Mhh, HaC CSS120424:144453−1311183.72 OT J145921 2011 Kra, Mas, PIE CSS110613:145922+3548063.73 OT J155631 2012 GBo, HMB CSS090321:155631−0804403.74 OT J160410 2012 Mas CSS120326:160411+1456183.75 OT J162806 2011 Mas, Mhh CSS110611:162806+0653163.76 OT J163942 2012 IMi CSS080131:163943+1224143.77 OT J170609 2011 Mas CSS090205:170610+1434523.78 OT J173516 2011 OKU, Mas, Mhh, DPV, KU, HMB, Kis CSS110623:173517+1547083.79 OT J184228 2011 Mas, Mhh, OKU, DPV,
OUS, Ioh, deM, SRI,UJH, KU, AAVSO, HMB,
LCO, CRI, Hsk, IMi Nishimura (Nakano et al. 2011)3.80 OT J210950 2011 DKS, Rui, DPV, OUS,
Kis, SRI, IMi, LCO,Mhh, AAVSO Itagaki (Yamaoka et al. 2011)
3.81 OT J214738 2011 Mas, SWI, deM, HMB, OKU,Nyr, UJH, CRI CSS111004:214738+244554
3.82 OT J215818 2011 SWI, Rui, JSh, deM,OKU, SRI, IMi, UJH,
Mas, MEV PNV J21581852+24192463.83 OT J221232 2011 SWI, Kai, Mas, CRI, SAc CSS 090911:221232+1601403.84 OT J224736 2012 Mas CSS120616:224736+2504363.85 TCP J084616 2012 deM, Mas TCP J08461690+31155543.86 TCP J231308 2011 Rui, Mas, Mhh, Kra, Kis TCP J23130812+2337018

6 T. Kato et al. [Vol. ,
Table 2. Superhump Periods and Period Derivatives
Object Year P1 (d) err E1∗ Pdot
† err† P2 (d) err E2∗ Porb (d) Q‡
EG Aqr 2011 0.078577 0.000055 0 93 −17.6 7.2 – – – – – CGMSV Ari 2011 0.055524 0.000014 19 311 4.0 0.2 0.055350 0.000052 307 366 – ATT Boo 2012 0.078083 0.000015 0 113 1.6 0.8 – – – – – CCR Boo 2012 0.017265 0.000002 0 247 2.0 0.2 0.017193 0.000006 237 395 0.017029 BCR Boo 2012b 0.017257 0.000002 0 245 1.9 0.2 – – – – 0.017029 BNN Cam 2011 0.074197 0.000023 0 57 7.1 3.8 0.073843 0.000013 54 109 0.0717 BSY Cap 2011 0.063750 0.000026 0 31 – – – – – – – CGAK Cnc 2012 0.067239 0.000123 0 46 – – – – – – 0.0651 CCC Cnc 2011 0.075887 0.000001 0 27 – – 0.075456 0.000028 42 103 0.07352 CGO Com 2012 0.063016 0.000019 0 128 4.8 1.5 0.062492 0.000150 127 144 – BTU Crt 2011 – – – – – – 0.084962 0.000043 0 82 0.08209 C
V503 Cyg 2011 0.081309 0.000062 0 25 – – 0.081046 0.000048 35 78 0.07777 BV503 Cyg 2011b 0.081241 0.000057 0 87 −11.6 3.4 – – – – 0.07777 CGMV1454 Cyg 2012 0.057494 0.000015 0 18 – – – – – – – CAQ Eri 2011 – – – – – – 0.061648 0.000247 143 161 0.06094 CGUV Gem 2011 0.092822 0.000094 0 13 – – – – – – – CNY Her 2011 0.075802 0.000121 0 37 – – – – – – – CGPR Her 2011 0.055022 0.000026 0 92 8.8 3.7 – – – – 0.05422 CEV844 Her 2012 0.055901 0.000021 22 124 12.4 1.5 0.055873 0.000031 124 183 0.054643 BMM Hya 2012 0.058872 0.000026 0 122 – – 0.058625 0.000049 119 201 0.057590 CVW Hyi 2011 0.076914 0.000026 25 68 8.2 5.8 0.076540 0.000019 77 146 0.074271 ARZ LMi 2012 0.059441 0.000021 0 126 2.4 1.5 – – – – – CRZ LMi 2012b 0.059472 0.000026 0 84 4.5 3.6 – – – – – CRZ LMi 2012c 0.059408 0.000011 0 133 2.9 0.4 – – – – – BBK Lyn 2012b 0.078510 0.000028 25 127 3.2 2.7 – – – – 0.07498 BV585 Lyr 2012 0.060350 0.000038 0 19 – – – – – – – CFQ Mon 2011 – – – – – – 0.072718 0.000180 0 14 – C
V1032 Oph 2012 0.085965 0.000288 0 47 – – – – – – 0.081055 CAR Pic 2011 – – – – – – 0.083154 0.000149 0 50 0.0801 CPGV Psc 2011 0.094313 0.000018 0 62 −3.1 2.3 – – – – – C2BW Scl 2011 0.055000 0.000008 25 210 4.4 0.3 – – – – 0.054323 ACC Scl 2011 – – – – – – 0.060012 0.000028 0 152 0.05858 C
V1208 Tau 2011 – – – – – – 0.070481 0.000066 0 49 – BV1212 Tau 2011b 0.069692 0.000055 0 18 – – – – – – – C2DI UMa 2007 0.055306 0.000015 18 182 4.1 0.8 – – – – 0.054566 BDI UMa 2007b 0.055340 0.000040 0 126 9.3 4.3 – – – – 0.054566 BMR UMa 2012 – – – – – – 0.064746 0.000021 0 48 – CPU UMa 2012 0.081090 0.000048 11 84 −14.3 2.6 0.080724 0.000100 84 121 0.077881 BSS UMi 2012 0.070358 0.000128 0 33 – – – – – – 0.06778 C
1RXS J231935 2011 0.065989 0.000019 0 79 11.6 1.7 0.065528 0.000014 75 159 – BDDE 19 2011 – – – – – – 0.091210 0.000043 0 35 – C
MisV 1446 2012 0.078072 0.000088 0 35 – – 0.077304 0.000098 35 69 – CSBS 1108 2012 0.039118 0.000003 0 403 1.2 0.1 0.038869 0.000004 399 876 0.038449 CP
SDSS J073208 2012 0.079571 0.000021 0 72 – – – – – – – CGSDSS J080303 2011 0.091949 0.000119 17 31 – – 0.090393 0.000022 27 88 – CSDSS J165359 2012 – – – – – – 0.065105 0.000150 91 121 – CSDSS J170213 2011 0.105005 0.000056 32 117 17.0 2.8 – – – – 0.100082 BSDSS J172102 2012 – – – – – – 0.026673 0.000008 0 463 – CSDSS J210449 2011 0.075315 0.000045 0 27 – – – – – – – CSDSS J220553 2011 0.058151 0.000021 0 99 7.7 0.9 – – – – 0.05752 B∗Interval used for calculating the period (corresponding to E in section 3).†Unit 10−5.‡Data quality and comments. A: excellent, B: partial coverage or slightly low quality, C: insufficient coverage orobservations with large scatter, G: Pdot denotes global Pdot, M: observational gap in middle stage,2: late-stage coverage, the listed period may refer to P2, E: Porb refers to the period of early superhumps.P: Porb refers to a shorter stable periodicity recorded in outburst.

No. ] Period Variations in SU UMa-Type Dwarf Novae IV 7
Table 2. Superhump Periods and Period Derivatives (continued)
Object Year P1 err E1 Pdot err P2 err E2 Porb QOT J001952 2012 0.056770 0.000039 0 18 – – – – – – – COT J050716 2012 0.065916 0.000080 0 15 – – – – – – – COT J055721 2011 0.059756 0.000017 0 153 4.6 0.9 – – – – – BOT J064608 2011 0.061105 0.000023 0 82 11.1 2.6 – – – – – BOT J081117 2011 0.058035 0.000027 0 63 – – – – – – – COT J084127 2012 0.087686 0.000252 0 4 – – – – – – – COT J094854 2012 0.057499 0.000021 0 77 8.3 2.8 – – – – – COT J102842 2012 0.038168 0.000008 70 151 – – – – – – – COT J105122 2012 0.061054 0.000109 0 30 – – – – – – 0.0596 C2OT J144252 2012 0.065126 0.000028 0 59 13.6 4.3 0.064639 0.000054 59 107 – BOT J144453 2012 – – – – – – 0.082289 0.000060 0 58 – COT J145921 2011 0.085114 0.000059 0 74 10.9 7.2 – – – – – COT J155631 2012 0.089309 0.000053 0 41 −21.3 5.8 – – – – – CGOT J162806 2011 0.068847 0.000008 0 140 – – – – – – – CGMOT J163942 2012 0.088585 0.000052 0 23 – – – – – – – COT J170609 2011 0.059460 0.000076 0 16 – – – – – – – COT J184228 2011 0.072342 0.000018 64 206 −0.9 1.5 – – – – 0.07168 BEOT J210950 2011 0.060045 0.000026 34 188 8.5 0.6 0.059742 0.000022 187 289 0.05865 BPOT J214738 2011 0.097147 0.000021 21 107 8.8 1.0 – – – – 0.09273 BPOT J215818 2011 0.067397 0.000027 0 56 6.9 4.5 0.066852 0.000020 50 127 – BOT J221232 2011 0.090322 0.000097 0 29 – – 0.090051 0.000028 29 106 – BOT J224736 2012 0.056673 0.000020 0 37 – – – – – – – CTCP J084616 2012 0.096333 0.000106 0 12 – – – – – – 0.09139 CTCP J231308 2011 0.071364 0.000044 0 24 – – 0.071016 0.000033 28 85 – C
0 20 40 60 80 100 120 140 160 180
−0.02
−0.01
0.00
0.01
200620082011
Fig. 1. Comparison of O−C diagrams of EG Aqr betweendifferent superoutbursts. A period of 0.07885 d was used todraw this figure. Approximate cycle counts (E) after the startof the superoutburst were used. Since the starts of the 2008and 2011 superoutbursts were not well constrained, we shiftedthe O−C diagrams to best fit the best-recorded 2006 one.
detected on November 1, and it quickly faded to magni-tude 13.5 on November 21. According to Duerbeck (1987),there was a possible detection of a brightening to mag-nitude 15.7 on 1943 September 2 by Himpel and Jansch.Although Duerbeck (1987) even suggested an intergalacticnova, many observers, mostly amateur observers, inten-sively monitored the object suspecting that it is a dwarfnova. Robertson et al. (1998) identified a B = 22.1 magquiescent counterpart [see also Robertson et al. (2000);Duerbeck (1987) had also proposed the same 22-nd magcounterpart]. After a long period of unsuccessful detec-tion of an outburst, R. Stubbings finally detected an out-burst at a visual magnitude of 15.0 on 2011 August 2(vsnet-outburst 13091). The outburst was immediatelyconfirmed by T. Tordai and G. Masi who detected super-humps (vsnet-alert 13541, 13552; figure 2).The times of superhump maxima are listed in table
4 The early to middle portion of the O − C diagramshows clear stages of A and B. During the period of BJD2455789–2477912, there were sometimes two hump max-ima, and humps with phases different from main humps(E = 240,253,272) were also included in the table. Therewas some indication of a stage C around the terminal stage(E ≥ 364). The values given in table 2 were determinedafter rejecting humps at E = 240,253,272. The resultantPdot for stage B superhumps was +4.0(0.2)× 10−5, com-parable to those of extreme WZ Sge-type dwarf novae.The 2011 outburst was much fainter than the 1905 out-
burst. This difference can be understood as a combina-

8 T. Kato et al. [Vol. ,
0.053 0.054 0.055 0.056 0.057 0.058
0.92
0.94
0.96
0.98
1.00
(d)
θ
P=0.05533
−0.5 0.0 0.5 1.0 1.5
0.05
0.00
−0.05
−0.10
Fig. 2. Superhumps in SV Ari (2011). (Upper): PDM anal-ysis. (Lower): Phase-averaged profile.
tion of two effects: (1) the magnitude scale in Wolf, Wolf(1905) was about 2 mag brighter than the present scale,which is confirmed from a comparison of the magnitudesof the comparison stars, and (2) the brightness maximumof the 2011 outburst was missed because there were noobservations in that season before the Stubbings’ detec-tion. The lack of a stage of early superhumps, which isexpected for such a WZ Sge-type dwarf nova, can also beunderstood for the same reason. No post-superoutburstrebrightening was recorded.
3.4. TT Bootis
We observed the early part of the 2012 superoutburst.The times of superhump maxima are listed in table 5.There were no detectable superhumps 0.8 d prior to theinitial epoch of superhump maximum. The resultant Pdot
for stage B was smaller than in 2004 and 2010, and it isprobably a result of the limited observation of stage B andpossibly from contamination of stage A or C superhumps(figure 3).
3.5. CR Bootis
CR Boo is one of the prototypical “helium dwarf no-vae” [Patterson et al. (1997); Provencal et al. (1997); Katoet al. (2000b); for representative theoretical analyses, see
Table 4. Superhump maxima of SV Ari (2011).
E max∗ error O−C† N ‡
0 55776.5824 0.0026 0.0059 665 55776.8591 0.0010 0.0052 477 55776.9722 0.0011 0.0072 9911 55777.1956 0.0009 0.0086 25012 55777.2464 0.0007 0.0039 35813 55777.3083 0.0014 0.0103 15416 55777.4748 0.0013 0.0104 4117 55777.5259 0.0015 0.0059 3018 55777.5860 0.0006 0.0106 4919 55777.6419 0.0003 0.0109 3723 55777.8629 0.0003 0.0099 5324 55777.9167 0.0004 0.0082 3830 55778.2477 0.0010 0.0062 8434 55778.4729 0.0014 0.0095 3235 55778.5252 0.0009 0.0063 3136 55778.5792 0.0003 0.0048 9137 55778.6356 0.0004 0.0056 5041 55778.8563 0.0006 0.0043 3443 55778.9637 0.0010 0.0008 2854 55779.5730 0.0003 −0.0004 3859 55779.8498 0.0005 −0.0012 3660 55779.9032 0.0005 −0.0033 2866 55780.2370 0.0028 −0.0024 18667 55780.2891 0.0016 −0.0059 16777 55780.8425 0.0010 −0.0074 2978 55780.9012 0.0010 −0.0043 7579 55780.9551 0.0008 −0.0059 7083 55781.1839 0.0031 0.0009 10084 55781.2324 0.0012 −0.0060 22485 55781.2897 0.0008 −0.0043 25295 55781.8415 0.0005 −0.0074 3696 55781.8981 0.0005 −0.0064 32102 55782.2312 0.0010 −0.0063 238103 55782.2838 0.0006 −0.0092 288109 55782.6183 0.0006 −0.0077 44113 55782.8402 0.0005 −0.0078 35114 55782.8950 0.0006 −0.0085 35127 55783.6165 0.0005 −0.0085 51131 55783.8384 0.0008 −0.0086 35132 55783.8941 0.0007 −0.0083 35145 55784.6161 0.0007 −0.0079 51150 55784.8916 0.0013 −0.0099 65162 55785.5544 0.0037 −0.0131 26163 55785.6194 0.0010 −0.0036 49167 55785.8358 0.0019 −0.0092 30168 55785.8944 0.0010 −0.0061 30185 55786.8424 0.0035 −0.0016 28186 55786.8891 0.0035 −0.0104 19192 55787.2249 0.0039 −0.0076 105203 55787.8394 0.0019 −0.0036 28204 55787.8962 0.0024 −0.0023 28∗BJD−2400000.†Against max = 2455776.5764+ 0.055500E.‡Number of points used to determine the maximum.

No. ] Period Variations in SU UMa-Type Dwarf Novae IV 9
Table 4. Superhump maxima of SV Ari (2011) (continued).
E max∗ error O−C† N ‡
222 55788.8967 0.0043 −0.0008 29240 55789.8813 0.0061 −0.0152 20252 55790.5667 0.0027 0.0042 51253 55790.5904 0.0023 −0.0276 51253 55790.6199 0.0007 0.0020 37257 55790.8503 0.0093 0.0103 19270 55791.5773 0.0049 0.0158 51272 55791.6554 0.0045 −0.0171 29307 55793.6346 0.0020 0.0196 22310 55793.7952 0.0024 0.0137 30311 55793.8603 0.0009 0.0233 40364 55796.7895 0.0039 0.0110 20365 55796.8452 0.0034 0.0112 20366 55796.8987 0.0016 0.0092 16∗BJD−2400000.†Against max = 2455776.5764+ 0.055500E.‡Number of points used to determine the maximum.
0 50 100 150 200 250−0.04
−0.03
−0.02
−0.01
0.00
0.01
2004200720102012
Fig. 3. Comparison of O−C diagrams of TT Boo betweendifferent superoutbursts. A period of 0.07807 d was used todraw this figure. Approximate cycle counts (E) after the startof the superoutburst were used.
Table 5. Superhump maxima of TT Boo (2012).
E max∗ error O−C† N ‡
0 56016.4443 0.0002 −0.0010 811 56016.5239 0.0002 0.0005 832 56016.6011 0.0002 −0.0003 8335 56019.1732 0.0039 −0.0034 3036 56019.2549 0.0011 0.0002 5637 56019.3315 0.0014 −0.0012 4238 56019.4122 0.0005 0.0015 7339 56019.4881 0.0005 −0.0007 7840 56019.5673 0.0005 0.0005 8260 56021.1277 0.0032 0.0001 4461 56021.2069 0.0023 0.0013 5862 56021.2861 0.0013 0.0024 54113 56025.2689 0.0007 0.0054 56139 56027.2870 0.0016 −0.0054 55∗BJD−2400000.†Against max = 2456016.4454+ 0.078036E.‡Number of points used to determine the maximum.
Tsugawa, Osaki (1997), Kotko et al. (2012); for recent ob-servational reviews of AM CVn stars, see Solheim (2010),Ramsay et al. (2011), Ramsay et al. (2012)]. Althoughsuperhumps in this object was well established in thepast, the published observations were either obtained inan anomalous state (Patterson et al. 1997) or not veryideally sampled (Kato et al. 2000b). The object was in astate of regular pattern of outbursts (cf. Kato et al. 2000b)with a supercycle of ∼50 d in 2011–2012 and is ideal tostudy the behavior of superhumps in helium dwarf novae.We present here an analysis of a superoutburst in 2012
March mainly using the AAVSO observations. The super-outburst was first detected by G. Gualdoni on March 3 atV = 13.61 (AAVSO data). The existence of superhumpswas soon recognized (vsnet-alert 14305). Although the ob-ject stayed in its plateau phase for six days, it started os-cillations with a quasi-period of 1.0 d similar to Pattersonet al. (1997), and this state lasted for six days. The ob-ject apparently entered a more stable state, and finallystarted fading rapidly on March 25. Although the over-all behavior of the superoutburst was similar to those ofhydrogen-rich SU UMa-type dwarf novae, the presence ofoscillatory state is different. The relatively large scatter inthe supercycle-phase-folded light curve (figure 4 of Katoet al. 2000b) may have been a result of these oscillations.The times of superhump maxima until the early stage
of the oscillatory state are shown in table 6. The O−Cdiagram shows a pattern very similar to stages B and Cin hydrogen-rich SU UMa-type dwarf novae. The Pdot
for stage B was +2.0(0.2)× 10−5 and the ǫ for stage Band C superhumps (figures 4 and 5, respectively) were1.39(1)%, and 0.97(4)%, similar to those of WZ Sge-typedwarf novae, but are larger than what is expected onlyfrom the mass-ratio. The stage B–C transition occurredwhen the oscillation started (figure 6). This may be anal-ogous to WZ Sge-type dwarf novae, which usually do not

10 T. Kato et al. [Vol. ,
show stage C superhumps by the end of plateau phase(Kato et al. 2009; Kato et al. 2010; Kato et al. 2012a).The oscillatory phase in CR Boo may correspond to post-superoutburst stage in WZ Sge-type dwarf novae, whenthese objects tend to show various kinds of rebrightenings(cf. Kato et al. 2009). We might recall the past examplesof V803 Cen (Kato et al. 2004a) and V406 Hya (Nogamiet al. 2004), both of which showed rebrightenings similarto WZ Sge-type dwarf novae. Ramsay et al. (2011) alsonoted the presence of a “dip” during superoutbursts ofshort-Porb AM CVn-type objects (see also Levitan et al.2011; Kotko et al. 2012). Such phenomena may be moreprevalent than had been thought.Although the superhumps in the later stages were not
readily recognizable, we could detect the period withthe PDM method: 0.017183(5) d for BJD 2455997.8–2456002.0 (oscillatory phase) and 0.017265(3) d for BJD2456002.0–2456009.0 (second stable plateau). These peri-ods indicate the persistence of superhumps until the endof the superoutburst.After one supercycle, the object underwent another su-
peroutburst in 2012 April. The times of superhump max-ima are listed in table 7. Although the object startedoscillatory behavior as in the March superoutburst, thelater part of the superoutburst was not as well observedas in the March one. The resultant period and periodderivatives were quite similar to those of the March super-outburst. The O−C diagram of the stage B very well re-produced that of the March superoutburst (figure 6, lowerpanel).
3.6. NN Camelopardalis
We observed a superoutburst in 2011 December. Thetimes of superhump maxima are listed in table 8.Although stage A and early part of stage B were missed,a clear pattern of stage B–C superhumps was detected.A comparison of O−C diagrams between different su-
peroutbursts is shown in figure 7. The 2007 superout-burst, whose start of the main superoutburst was not ob-served, was shifted by 63 cycles to best match the others.This cycle count placed the initial epoch of superhumpevolution around BJD 2454358.9, shortly after the pre-cursor outburst. It was likely that superhumps started togrow just following the precursor outburst, and it is likelythe true start of the main superoutburst was missed.
3.7. SY Capricorni
We observed a superoutburst in 2011 August–September. The times of superhump are listed in table9. Since only a limited fragment of observation was ob-tained, we adopted a period with the PDM analysis intable 2.
3.8. GZ Ceti
This object (=SDSS J013701.06−091234.9) is an un-usual short-Porb dwarf nova with a massive secondary(Imada et al. 2006; Ishioka et al. 2007). We observed the2011 superoutburst. We only observed the initial and finalparts of the outburst. The times of superhump maxima
Table 6. Superhump maxima of CR Boo (2012 March).
E max∗ error O−C† N ‡
0 55990.7536 0.0001 −0.0006 51 55990.7724 0.0004 0.0010 62 55990.7893 0.0005 0.0006 63 55990.8066 0.0009 0.0006 54 55990.8237 0.0007 0.0006 65 55990.8416 0.0009 0.0011 66 55990.8583 0.0005 0.0006 839 55991.4270 0.0005 0.0001 1440 55991.4433 0.0003 −0.0008 1741 55991.4613 0.0006 −0.0001 1642 55991.4779 0.0005 −0.0008 1643 55991.4946 0.0003 −0.0013 1644 55991.5125 0.0006 −0.0006 1245 55991.5295 0.0003 −0.0009 1446 55991.5479 0.0006 0.0003 1347 55991.5641 0.0004 −0.0007 848 55991.5819 0.0005 −0.0003 1249 55991.5985 0.0003 −0.0009 1550 55991.6161 0.0004 −0.0006 1651 55991.6341 0.0005 0.0002 1552 55991.6503 0.0007 −0.0008 1753 55991.6677 0.0009 −0.0007 1459 55991.7716 0.0006 −0.0003 760 55991.7888 0.0003 −0.0003 661 55991.8053 0.0005 −0.0011 662 55991.8235 0.0002 −0.0002 563 55991.8403 0.0002 −0.0006 664 55991.8569 0.0004 −0.0012 765 55991.8746 0.0002 −0.0007 766 55991.8921 0.0003 −0.0005 696 55992.4093 0.0008 −0.0007 2897 55992.4267 0.0006 −0.0006 3398 55992.4445 0.0004 −0.0001 3099 55992.4615 0.0004 −0.0004 30100 55992.4778 0.0004 −0.0013 22101 55992.4952 0.0011 −0.0012 21102 55992.5129 0.0008 −0.0007 20103 55992.5302 0.0006 −0.0006 24104 55992.5472 0.0011 −0.0009 19105 55992.5626 0.0007 −0.0027 17106 55992.5814 0.0006 −0.0012 18118 55992.7889 0.0012 −0.0006 15119 55992.8061 0.0004 −0.0007 13120 55992.8238 0.0008 −0.0002 15121 55992.8413 0.0004 0.0000 16122 55992.8585 0.0012 −0.0001 15124 55992.8925 0.0005 −0.0005 15125 55992.9103 0.0009 0.0000 15126 55992.9277 0.0006 0.0002 12237 55994.8466 0.0010 0.0045 16239 55994.8783 0.0011 0.0017 15240 55994.8970 0.0006 0.0031 16∗BJD−2400000.†Against max = 2455990.7542+ 0.017249E.‡Number of points used to determine the maximum.

No. ] Period Variations in SU UMa-Type Dwarf Novae IV 11
0.0165 0.0170 0.0175 0.0180
0.6
0.8
1.0
(d)
θ
P=0.01725
−0.5 0.0 0.5 1.0 1.5
0.05
0.00
−0.05
Fig. 4. Superhumps in CR Boo (2012 March) before theoscillatory phase. (Upper): PDM analysis. (Lower):Phase-averaged profile.
are listed in table 10. On BJD 2455923, the amplitudes ofsuperhumps were still less than 0.1 mag, and we must havecaught the initial stage of the outburst. A comparison ofO−C diagrams between different outbursts is shown infigure 8. Despite its unusual properties, the O−C curveis composed of stages B and C similar to those of ordinarySU UMa-type dwarf novae. The Pdot during stage B ap-pears to be smaller than those of ordinary SU UMa-typedwarf novae with similar PSH, consistent with the resultin Kato et al. (2009).
3.9. AK Cancri
We observed a superoutburst in 2012 January. Due tothe short duration of the observation, the recorded su-perhumps were limited (table 11). The resultant periodsuggests that we observed stage B superhumps.
3.10. CC Cancri
We observed a superoutburst in 2011 December. Thetimes of superhump maxima are listed in table 12.Although the data were rather sparse, stages B and Cwere recorded. The obtained periods were similar to thosein 2001 (Kato et al. 2009).A comparison of O−C diagrams between different su-
peroutburst is shown in figure 9. Early stage observations
0.0165 0.0170 0.0175 0.0180
0.96
0.98
1.00
1.02
(d)
θ
P=0.01721
−0.5 0.0 0.5 1.0 1.5
0.02
0.00
−0.02
−0.04
Fig. 5. Superhumps in CR Boo (2012 March) during theoscillatory phase. (Upper): PDM analysis. (Lower):Phase-averaged profile.
are still lacking for this object.
3.11. GO Comae Berenices
We observed the 2012 superoutburst of this object. Thetimes of superhump maxima are listed in table 13. Bothtypical stages B and C can be clearly identified. The O−C variation during this outburst was similar to those inprevious outbursts (figure 10).
3.12. TU Crateris
We observed the late stage of the 2011 superoutburst ofTU Crt. The times of superhump maxima are listed in ta-ble 14. We most likely observed only stage C superhumps.The measured period is in good agreement with that ofstage C superhumps recorded in 1998 (Mennickent et al.1999) and analyzed in Kato et al. (2009). A comparison ofO−C diagrams between different superoutburst is shownin figure 11.
3.13. V503 Cygni
Harvey et al. (1995) established the SU UMa-typenature of this object and reported a mean PSH of0.08101(4) d. They also detected negative superhumps inquiescence. Although there may have been some evidenceof a hump corresponding to negative superhumps during

12 T. Kato et al. [Vol. ,
0 200 400 600 800 1000 1200
−0.005
0.000
0.005
90 95 100 105 110
17
16
15
14
0 50 100 150 200 250 300 350 400 450
−0.005
0.000
0.005
Fig. 6. O−C diagram of superhumps in CR Boo. (Upper:)O−C for the 2012 March superoutburst. We used a periodof 0.017249 d for calculating the O−C residuals. (Middle:)Light curve for the 2012 March superoutburst. (Lower:)Comparison of O−C diagrams between two superoutburstsin 2012 March (filled circles) and April (filled squares).Approximate cycle counts (E) after the start of the super-outburst were used.
superoutburst, its presence was not well established.We observed the 2011 July superoutburst, subsequent
phase with normal outbursts and 2011 October superout-burst. The times of superhump maxima during the Julysuperoutburst are listed in table 15. There was some hintof a break in the O−C diagram for the superhumps dur-ing the superoutburst between E = 25 and E = 35, andwe attributed this to be a stage B–C transition. A globalPdot corresponded to −3.8(2.6)× 10−5.The signals of the ordinary superhumps already be-
came difficult to trace even before the rapid fading (BJD2455751). A PDM analysis, however, to the data forthe interval BJD 2455751–2455754 yielded a period of0.0814(1) d, suggesting that the ordinary superhumpswere still the dominant signal, rather than negative su-perhumps.After BJD 2455754, large-amplitude modulations ap-
peared again. The times of maxima were not on a smoothextension of the times of superhump maxima during thesuperoutburst plateau. These new signals appear to cor-
0 20 40 60 80 100 120 140 160
−0.04
−0.02
0.00
0.02
200720092011
Fig. 7. Comparison of O−C diagrams of NN Cam betweendifferent superoutbursts. A period of 0.0743 d was used todraw this figure. Approximate cycle counts (E) after the startof the superoutburst were used. The 2007 superoutburst wasshifted by 63 cycles to best match the others.
0 50 100 150 200 250 300−0.04
−0.02
0.00
0.02
200320092011
Fig. 8. Comparison of O−C diagrams of GZ Cet betweendifferent superoutbursts. A period of 0.05672 d was used todraw this figure. Approximate cycle counts (E) after the startof the superoutburst were used. We assumed that the 2011 su-peroutburst was caught around its peak based on the bright-ness and evolution of superhumps, and assumed it to be thestart of the superoutburst.

No. ] Period Variations in SU UMa-Type Dwarf Novae IV 13
0 50 100 150 200
−0.02
0.00
0.02
20012011
Fig. 9. Comparison of O−C diagrams of CC Cnc betweendifferent superoutbursts. A period of 0.07589 d was used todraw this figure. Approximate cycle counts (E) after the startof the superoutburst were used. Since the start of the 2001superoutburst was not well constrained, we shifted the O−C
diagrams to best fit the best-recorded 2011 one.
0 50 100 150 200
−0.02
−0.01
0.00
0.01
200320052006200820102012
Fig. 10. Comparison of O−C diagrams of GO Com betweendifferent superoutbursts. A period of 0.06303 d was used todraw this figure. Approximate cycle counts (E) after the startof the superoutburst were used.
Table 6. Superhump maxima of CR Boo (2012 March) (con-tinued).
E max∗ error O−C† N ‡
241 55994.9154 0.0005 0.0043 16242 55994.9310 0.0011 0.0026 14243 55994.9502 0.0011 0.0046 25244 55994.9671 0.0013 0.0042 24245 55994.9834 0.0007 0.0032 25246 55995.0009 0.0011 0.0035 25247 55995.0181 0.0011 0.0034 13284 55995.6566 0.0024 0.0037 21285 55995.6713 0.0016 0.0012 21286 55995.6920 0.0013 0.0046 21287 55995.7075 0.0014 0.0029 22293 55995.8095 0.0012 0.0015 6295 55995.8402 0.0009 −0.0024 11297 55995.8804 0.0010 0.0033 14298 55995.8967 0.0014 0.0024 15299 55995.9126 0.0017 0.0011 14301 55995.9454 0.0016 −0.0007 24305 55996.0184 0.0019 0.0034 9306 55996.0329 0.0011 0.0005 9336 55996.5481 0.0017 −0.0017 22341 55996.6316 0.0008 −0.0044 17344 55996.6866 0.0010 −0.0011 37345 55996.7029 0.0017 −0.0022 36353 55996.8396 0.0008 −0.0034 10359 55996.9414 0.0007 −0.0051 12360 55996.9606 0.0010 −0.0032 7361 55996.9767 0.0028 −0.0043 15363 55997.0128 0.0014 −0.0026 9364 55997.0306 0.0021 −0.0021 8394 55997.5462 0.0020 −0.0039 16395 55997.5658 0.0032 −0.0016 18∗BJD−2400000.†Against max = 2455990.7542+ 0.017249E.‡Number of points used to determine the maximum.
respond to the traditional late superhumps (e.g. Vogt1983), rather than “stage C superhumps” in our designa-tion (table 17).The times of superhump maxima during the October
superoutburst are listed in table 16. Although the epochE = 114 is possibly a late superhump as in the 2011 Julysuperoutburst, the lack of subsequent observations madethe identification unclear. We listed a global Porb andPdot in table 2. A period derived from E ≤ 27 (stage B)was 0.08151(8) d.We were not able to detect a signal of negative su-
perhumps during the fading stage and subsequent qui-escence, and the signal was dominated by positive su-perhumps. The situation was thus different from ERUMa (Ohshima et al. 2012). The mean period of (tra-ditional late) superhumps during the post-superoutburststage was 0.08032(3) d (PDM method), 3.4% longer thanPorb, and was significantly shorter than that of ordinarysuperhumps. Although the superhump signal persisted

14 T. Kato et al. [Vol. ,
Table 7. Superhump maxima of CR Boo (2012 April).
E max∗ error O−C† N ‡
0 56039.6483 0.0002 0.0009 211 56039.6657 0.0002 0.0011 332 56039.6825 0.0001 0.0006 333 56039.7001 0.0003 0.0009 334 56039.7175 0.0001 0.0010 345 56039.7346 0.0002 0.0009 346 56039.7521 0.0002 0.0011 347 56039.7685 0.0002 0.0003 348 56039.7865 0.0001 0.0010 339 56039.8033 0.0002 0.0006 3411 56039.8376 0.0002 0.0004 2412 56039.8551 0.0002 0.0006 3213 56039.8724 0.0002 0.0006 3314 56039.8896 0.0003 0.0006 3315 56039.9074 0.0002 0.0011 3316 56039.9240 0.0002 0.0005 3317 56039.9405 0.0003 −0.0003 3318 56039.9584 0.0002 0.0004 3356 56040.6138 0.0005 0.0000 1557 56040.6305 0.0004 −0.0005 1658 56040.6477 0.0003 −0.0006 1659 56040.6652 0.0004 −0.0004 1560 56040.6825 0.0003 −0.0004 1461 56040.7001 0.0004 −0.0000 1662 56040.7170 0.0003 −0.0003 1663 56040.7340 0.0005 −0.0006 1464 56040.7510 0.0003 −0.0009 1665 56040.7690 0.0005 −0.0001 1366 56040.7859 0.0004 −0.0005 1467 56040.8031 0.0003 −0.0005 1568 56040.8202 0.0003 −0.0006 1569 56040.8374 0.0003 −0.0007 1470 56040.8548 0.0005 −0.0006 1571 56040.8715 0.0003 −0.0011 1372 56040.8890 0.0006 −0.0009 1373 56040.9059 0.0007 −0.0012 15114 56041.6136 0.0004 −0.0011 16115 56041.6317 0.0005 −0.0003 16116 56041.6483 0.0007 −0.0009 16117 56041.6657 0.0009 −0.0007 13118 56041.6836 0.0005 −0.0001 15119 56041.6997 0.0004 −0.0013 15120 56041.7185 0.0004 0.0003 15121 56041.7346 0.0003 −0.0009 11122 56041.7530 0.0006 0.0003 15123 56041.7678 0.0008 −0.0022 14124 56041.7872 0.0006 −0.0001 16125 56041.8037 0.0006 −0.0008 15126 56041.8198 0.0004 −0.0019 12127 56041.8381 0.0005 −0.0009 16128 56041.8551 0.0006 −0.0012 15129 56041.8754 0.0016 0.0019 14∗BJD−2400000.†Against max = 2456039.6474+ 0.017257E.‡Number of points used to determine the maximum.
Table 7. Superhump maxima of CR Boo (2012 April) (con-tinued).
E max∗ error O−C† N ‡
130 56041.8902 0.0007 −0.0006 15184 56042.8229 0.0005 0.0003 15185 56042.8408 0.0005 0.0009 17186 56042.8577 0.0004 0.0005 18187 56042.8748 0.0003 0.0004 17188 56042.8929 0.0006 0.0012 18189 56042.9102 0.0010 0.0012 17190 56042.9262 0.0007 0.0000 18191 56042.9420 0.0008 −0.0014 18192 56042.9604 0.0011 −0.0003 18242 56043.8269 0.0016 0.0033 16245 56043.8774 0.0048 0.0021 15∗BJD−2400000.†Against max = 2456039.6474+ 0.017257E.‡Number of points used to determine the maximum.
Table 8. Superhump maxima of NN Cam (2011).
E max∗ error O−C† N ‡
0 55904.9897 0.0002 0.0015 2541 55905.0612 0.0001 −0.0010 2416 55905.4308 0.0005 −0.0017 757 55905.5044 0.0005 −0.0021 638 55905.5788 0.0004 −0.0017 689 55905.6526 0.0005 −0.0020 5610 55905.7226 0.0010 −0.0060 4211 55905.8007 0.0004 −0.0020 7812 55905.8752 0.0004 −0.0016 7813 55905.9501 0.0004 −0.0007 7624 55906.7647 0.0005 −0.0007 7725 55906.8392 0.0004 −0.0003 7726 55906.9129 0.0005 −0.0006 7829 55907.1393 0.0002 0.0037 29430 55907.2091 0.0003 −0.0006 29440 55907.9548 0.0003 0.0046 26154 55908.9915 0.0002 0.0045 27955 55909.0664 0.0003 0.0053 43356 55909.1419 0.0005 0.0068 21657 55909.2145 0.0004 0.0053 15668 55910.0273 0.0004 0.0036 15669 55910.1016 0.0005 0.0038 10192 55911.7991 0.0005 −0.0019 7993 55911.8731 0.0007 −0.0020 7894 55911.9460 0.0003 −0.0031 30795 55912.0212 0.0004 −0.0020 23696 55912.0932 0.0006 −0.0040 159109 55913.0546 0.0007 −0.0053 135∗BJD−2400000.†Against max = 2455904.9881+ 0.074053E.‡Number of points used to determine the maximum.

No. ] Period Variations in SU UMa-Type Dwarf Novae IV 15
Table 9. Superhump maxima of SY Cap (2011).
E max∗ error O−C† N ‡
0 55803.0789 0.0005 0.0012 1721 55803.1409 0.0006 −0.0005 15416 55804.0964 0.0017 −0.0014 4331 55805.0550 0.0007 0.0007 50∗BJD−2400000.†Against max = 2455803.0777+ 0.063761E.‡Number of points used to determine the maximum.
Table 10. Superhump maxima of GZ Cet (2011).
E max∗ error O−C† N ‡
0 55924.2865 0.0011 0.0021 311 55924.3403 0.0003 −0.0007 542 55924.3963 0.0003 −0.0014 46188 55934.9357 0.0003 0.0003 164189 55934.9918 0.0002 −0.0003 165∗BJD−2400000.†Against max = 2455924.2844+ 0.056654E.‡Number of points used to determine the maximum.
Table 11. Superhump maxima of AK Cnc (2012).
E max∗ error O−C† N ‡
0 55952.0678 0.0047 −0.0045 421 55952.1424 0.0007 0.0028 742 55952.2086 0.0007 0.0018 5445 55955.1043 0.0016 0.0062 7446 55955.1591 0.0011 −0.0062 69∗BJD−2400000.†Against max = 2455952.0723+ 0.067239E.‡Number of points used to determine the maximum.
Table 12. Superhump maxima of CC Cnc (2011).
E max∗ error O−C† N ‡
0 55910.1871 0.0006 −0.0065 15526 55912.1601 0.0011 0.0028 9127 55912.2360 0.0006 0.0031 15442 55913.3697 0.0002 0.0038 20088 55916.8407 0.0004 0.0003 7789 55916.9144 0.0009 −0.0015 3790 55916.9918 0.0007 0.0003 73101 55917.8222 0.0006 −0.0001 79102 55917.8948 0.0008 −0.0031 77103 55917.9741 0.0005 0.0008 79∗BJD−2400000.†Against max = 2455910.1935+ 0.075532E.‡Number of points used to determine the maximum.
Table 13. Superhump maxima of GO Com (2012).
E max∗ error O−C† N ‡
0 55983.5944 0.0002 0.0015 631 55983.6575 0.0003 0.0017 612 55983.7221 0.0003 0.0032 6511 55984.2863 0.0003 0.0006 10725 55985.1654 0.0002 −0.0022 13026 55985.2284 0.0003 −0.0023 12857 55987.1766 0.0003 −0.0067 14562 55987.4973 0.0009 −0.0009 5464 55987.6193 0.0008 −0.0049 53109 55990.4632 0.0005 0.0045 129110 55990.5289 0.0011 0.0072 92125 55991.4696 0.0004 0.0030 128126 55991.5306 0.0005 0.0011 131127 55991.5936 0.0005 0.0010 122128 55991.6615 0.0008 0.0060 71142 55992.5337 0.0010 −0.0037 55143 55992.5976 0.0009 −0.0028 48144 55992.6570 0.0015 −0.0063 45∗BJD−2400000.†Against max = 2455983.5929+ 0.062990E.‡Number of points used to determine the maximum.
0 50 100 150 200
−0.06
−0.04
−0.02
0.00
0.02
1998200120092011
Fig. 11. Comparison of O−C diagrams of TU Crt betweendifferent superoutbursts. A period of 0.08550 d was used todraw this figure. Approximate cycle counts (E) after the startof the superoutburst were used.

16 T. Kato et al. [Vol. ,
Table 14. Superhump maxima of TU Crt (2011).
E max∗ error O−C† N ‡
0 55925.2955 0.0003 0.0004 15169 55931.1543 0.0017 −0.0033 9970 55931.2437 0.0005 0.0011 15182 55932.2639 0.0007 0.0018 151∗BJD−2400000.†Against max = 2455925.2952+ 0.084962E.‡Number of points used to determine the maximum.
during the quiescent state following the superoutburst,the signal became dominated by Porb after the next nor-mal outburst. The Porb determined from all the observa-tions between BJD 2455744–2455802 was 0.077773(2) d.This period is in agreement with an analysis of the dataset restricted to the phase when the object did not showsuperhumps within respective errors. The period is also ingood agreement with the period obtained from the 2010observations (Pavlenko et al. 2012b). We used this refinedPorb in table 2.The lack of negative superhumps during these observa-
tions made a clear contrast to the observation by Harveyet al. (1995). V503 Cyg is known to display highly vari-able number of normal outbursts between superoutbursts(Kato et al. 2002), and normal outbursts were very in-frequent (every ∼30 d) during the observation by Harveyet al. (1995), while the current observations showed muchmore frequent ones (every ∼10 d). Kato et al. (2002) sug-gested that mechanisms for suppressing normal outburstsmay have worked when normal outbursts were very infre-quent. As discussed by various authors (Cannizzo et al.2010; Kato et al. 2012a; Ohshima et al. 2012), the statewith negative superhumps prevents the disk-instability tooccur. The condition to produce negative superhumps(likely a disk tilt) seems to naturally explain the asso-ciation of the presence of negative superhumps with thereduced number of normal outbursts in V503 Cyg.
3.14. V1454 Cygni
This SU UMa-type dwarf nova undergoes outbursts rel-atively rarely and the last outburst was in 2009 (Katoet al. 2010). The new observation during the 2012 su-peroutburst confirmed the period selection as stated inKato et al. (2010). The times of superhump maxima arelisted in table 18. A. Henden reported that there is aV ∼ 20.5-mag blue quiescent counterpart (cf. vsnet-alert14568), whose position is in good agreement with the as-trometry (19h53m38.s47, +35◦21′45.′′8) measured duringthe outburst (vsnet-alert 14566).
3.15. AQ Eridani
The 2011 superoutburst of AQ Eri was observed onlyfor its early and late stages. Although well-developed su-perhumps were observed on the first night, we could notmeasure the superhump period precisely. The late stageof the superoutburst and post-superoutburst stage were
Table 15. Superhump maxima of V503 Cyg (2011 July).
E max∗ error O−C† N ‡
0 55744.5173 0.0005 −0.0041 891 55744.6008 0.0008 −0.0017 4710 55745.3315 0.0016 −0.0007 2112 55745.4959 0.0009 0.0016 3124 55746.4683 0.0008 0.0010 9225 55746.5524 0.0009 0.0039 8235 55747.3620 0.0023 0.0027 1636 55747.4410 0.0006 0.0006 7537 55747.5227 0.0008 0.0012 7539 55747.6836 0.0004 −0.0000 12940 55747.7639 0.0005 −0.0008 15041 55747.8465 0.0005 0.0007 13347 55748.3339 0.0014 0.0016 3061 55749.4612 0.0024 −0.0063 3073 55750.4418 0.0186 0.0013 10174 55750.5206 0.0021 −0.0010 12677 55750.7689 0.0011 0.0041 13678 55750.8419 0.0026 −0.0040 116∗BJD−2400000.†Against max = 2455744.5214+ 0.081084E.‡Number of points used to determine the maximum.
Table 16. Superhump maxima of V503 Cyg (2011 October).
E max∗ error O−C† N ‡
0 55831.1911 0.0014 −0.0055 331 55831.2718 0.0004 −0.0059 582 55831.3537 0.0004 −0.0049 593 55831.4366 0.0005 −0.0030 584 55831.5186 0.0007 −0.0020 3625 55833.2234 0.0012 0.0018 2426 55833.3128 0.0020 0.0101 2827 55833.3946 0.0019 0.0110 2987 55838.2578 0.0016 0.0142 45114 55840.4147 0.0042 −0.0159 45∗BJD−2400000.†Against max = 2455831.1966+ 0.081000E.‡Number of points used to determine the maximum.

No. ] Period Variations in SU UMa-Type Dwarf Novae IV 17
Table 17. Superhump maxima of V503 Cyg (2011 July)(late superhumps).
E max∗ error O−C† N ‡
0 55753.4128 0.0018 −0.0076 301 55753.4995 0.0019 −0.0015 3010 55754.2291 0.0006 0.0041 8216 55754.7127 0.0018 0.0050 6017 55754.7878 0.0008 −0.0003 14524 55755.3518 0.0012 0.0006 3025 55755.4300 0.0021 −0.0017 3026 55755.5117 0.0010 −0.0004 2938 55756.4835 0.0016 0.0060 3042 55756.8034 0.0007 0.0040 14443 55756.8821 0.0008 0.0023 7547 55757.2020 0.0006 0.0004 14648 55757.2768 0.0008 −0.0052 14860 55758.2381 0.0010 −0.0094 7466 55758.7351 0.0010 0.0050 13667 55758.8125 0.0008 0.0019 14170 55759.0506 0.0008 −0.0013 6571 55759.1311 0.0007 −0.0013 16072 55759.2122 0.0010 −0.0007 179∗BJD−2400000.†Against max = 2455753.4205+ 0.080450E.‡Number of points used to determine the maximum.
Table 18. Superhump maxima of V1454 Cyg (2012).
E max∗ error O−C† N ‡
0 56059.5294 0.0005 −0.0001 601 56059.5872 0.0006 0.0002 5817 56060.5067 0.0006 −0.0002 6018 56060.5647 0.0004 0.0002 61∗BJD−2400000.†Against max = 2456059.5296+ 0.057494E.‡Number of points used to determine the maximum.
well observed. The superhumps apparently persisted af-ter the rapid decline. The times of superhump maxima arelisted in table 19. By using the PDM analysis, the signalof the superhumps was detected until BJD 2455586. Thesignal, however, was not significantly detected after thisepoch. The present case appears to be different from long-persisting stage C superhumps in many short-Porb dwarfnovae, such as QZ Vir (Ohshima et al. 2011).
3.16. UV Geminorum
We observed the middle part of the 2011 superoutburst.The times of superhump maxima are listed as table 20. Acomparison of O−C diagram between different superout-bursts is shown in figure 12. Despite the large variationof the superhump period, the periods during the middlestage of superoutbursts were almost the same in differentsuperoutbursts.
Table 19. Superhump maxima of AQ Eri (2011).
E max∗ error O−C† N ‡
0 55875.8290 0.0005 −0.0016 1211 55875.8930 0.0003 0.0001 103143 55884.7372 0.0006 0.0079 77144 55884.7964 0.0007 0.0049 98145 55884.8561 0.0009 0.0024 80159 55885.7152 0.0013 −0.0098 24160 55885.7813 0.0029 −0.0059 22161 55885.8513 0.0008 0.0019 15∗BJD−2400000.†Against max = 2455875.8306+ 0.062228E.‡Number of points used to determine the maximum.
0 20 40 60 80 100
−0.04
−0.02
0.00
0.02
200320082011
Fig. 12. Comparison of O−C diagrams of UV Gem betweendifferent superoutbursts. A period of 0.0936 d was used todraw this figure. Approximate cycle counts (E) after the startof the superoutburst were used.
Table 20. Superhump maxima of AW Gem (2011).
E max∗ error O−C† N ‡
0 55892.6080 0.0004 0.0006 621 55892.6996 0.0005 −0.0007 8010 55893.5351 0.0005 −0.0005 8411 55893.6284 0.0004 −0.0001 8312 55893.7231 0.0007 0.0019 5113 55893.8129 0.0004 −0.0012 60∗BJD−2400000.†Against max = 2455892.6074+ 0.092822E.‡Number of points used to determine the maximum.

18 T. Kato et al. [Vol. ,
Table 21. Superhump maxima of NY Her (2011).
E max∗ error O−C† N ‡
0 55724.6932 0.0013 −0.0023 771 55724.7690 0.0009 −0.0022 792 55724.8466 0.0009 −0.0005 783 55724.9220 0.0006 −0.0009 7813 55725.6829 0.0014 0.0020 7814 55725.7585 0.0072 0.0018 4026 55726.6702 0.0027 0.0039 6527 55726.7455 0.0031 0.0034 3429 55726.8994 0.0040 0.0057 7737 55727.4892 0.0044 −0.0109 28∗BJD−2400000.†Against max = 2455724.6955+ 0.075802E.‡Number of points used to determine the maximum.
3.17. NY Herculis
NY Her was discovered by Hoffmeister (1949) as aMira-type variable with a photographic range of 15.0 tofainter than 16.5. Gessner (1966) classified this object asa Cepheid (likely a W Vir-type variable) with a periodof 6.3146 d. Pastukhova (1988), however, did not confirmthis classification. Pastukhova (1988) identified the objectas an 18-mag blue object on POSS plates and obtained amean period of 67.7067 d. In addition to this mean pe-riod, short outbursts were irregularly observed. The ob-ject varied at a rate up to 2 mag d−1, and Pastukhova(1988) classified the object to be a blue irregular variable.On 2011 June 10, CRTS detected an outburst of this
object. T. Kato suggested that the known behavior ofthis object resembles that of ER UMa (cf. vsnet-alert13410). Follow-up observation indicated the presence ofsuperhumps (vsnet-alert 13418). The best superhump pe-riod with the PDM method was 0.07602(14) d (figure 13).The times of superhump maxima are listed in table 21.
CRTS data suggest a supercycle of 80–90 d. As judgedfrom the relatively long superhump period, the object maybe more similar to V503 Cyg (Harvey et al. 1995) ratherthan ER UMa. Further intensive observations are partic-ularly needed to determine the true cycle length for sucha rare variety of SU UMa-type dwarf novae.
3.18. PR Herculis
PR Her was discovered as a dwarf nova (S 4247) byHoffmeister (1951) with a photographic range of 14.0 tofainter than 17.5. Although this star was monitored byamateur observes since the early 1990s, no outburst hadbeen recorded. In the meantime, A. Henden identifiedthe object as a V = 21-mag blue star in 1999 (vsnet-chat1800).2 The large outburst amplitude made the object agood candidate for a WZ Sge-type dwarf nova.On 2011 November 21, Walter MacDonald II reported
a very bright outburst at a magnitude of V = 12.84 (cf.cvnet-outburst 4406). Subsequent observations confirmed
2 See also <ftp://ftp.aavso.org/upload/chartteam/MISC/seq/Her%20PR.txt>.
0.072 0.074 0.076 0.078 0.080
0.85
0.90
0.95
1.00
(d)
θ
P=0.07602
−0.5 0.0 0.5 1.0 1.5
0.1
0.0
−0.1
−0.2
Fig. 13. Superhumps in NY Her (2011). (Upper): PDManalysis. (Lower): Phase-averaged profile.
Table 22. Superhump maxima of PR Her (2011).
E max∗ error O−C† N ‡
0 55900.2456 0.0006 0.0008 741 55900.3034 0.0006 0.0035 5411 55900.8507 0.0015 0.0006 3112 55900.9020 0.0021 −0.0031 5119 55901.2905 0.0005 0.0002 4337 55902.2771 0.0008 −0.0036 5191 55905.2512 0.0004 −0.0008 11492 55905.3094 0.0011 0.0025 58∗BJD−2400000.†Against max = 2455900.2449+ 0.055022E.‡Number of points used to determine the maximum.
the presence of typical double-wave early superhumps (fig-ure 14). Due to the unfavorable location, the object soonbecame hard to access in the low evening sky. Ordinarysuperhumps were detected despite this unfavorable con-dition (vsnet-alert 13932; figure 15). The times of super-hump maxima are listed in table 22. The large outburstamplitude, the low frequency of outbursts, and the exis-tence of prominent early superhumps qualify PR Her as aWZ Sge-type dwarf nova.

No. ] Period Variations in SU UMa-Type Dwarf Novae IV 19
0.0525 0.0530 0.0535 0.0540 0.0545 0.0550 0.0555 0.0560
0.94
0.96
0.98
1.00
(d)
θ
P=0.05422
−0.5 0.0 0.5 1.0 1.5
0.04
0.02
0.00
−0.02
−0.04
Fig. 14. Early superhumps in PR Her (2011). (Upper):PDM analysis. (Lower): Phase-averaged profile.
3.19. V611 Herculis
Little had been known about this dwarf nova since itsdiscovery (Hoffmeister 1968). CRTS detected four pastoutbursts. An analysis of the SDSS colors of the qui-escent counterpart suggested an object below the periodgap (Kato et al. 2012b). A new outburst was detected byCRTS on 2012 June 8 (cf. vsnet-alert 14647). Subsequentobservations detected superhumps (vsnet-alert 14648; fig-ure 16). We detected two superhump maxima at BJD2456087.4232(5) (N = 62) and 2456087.4877(6) (N = 27).The best period determined by the PDM method was0.0636(4) d.
3.20. V844 Herculis
The well-known SU UMa-type dwarf nova V844 Her un-derwent a superoutburst in 2012 May (vsnet-alert 14525).After a period of frequent outburst in 2009–2011, the ob-ject again entered a relatively inactive phase in 2011–2012and the superoutburst occurred ∼370 d after the 2011 su-peroutburst. The times of superhump maxima are listedin table 23. Although a clear pattern of stages A–C wasobserved, the period of stage A was not determined due tothe limited observations in this stage. The Pdot for stageB was clearly positive as in other superoutbursts in thisobject.
0.0535 0.0540 0.0545 0.0550 0.0555 0.0560 0.0565
0.6
0.8
1.0
(d)
θ
P=0.05499
−0.5 0.0 0.5 1.0 1.5
0.1
0.0
−0.1
Fig. 15. Ordinary superhumps in PR Her (2011). (Upper):PDM analysis. (Lower): Phase-averaged profile.
0.36 0.38 0.40 0.42 0.44 0.46 0.48 0.500.10
0.05
0.00
−0.05
−0.10
Fig. 16. Superhumps in V611 Her.

20 T. Kato et al. [Vol. ,
0 50 100 150 200 250
−0.02
−0.01
0.00
0.01
1997199920022006200820092010
2010b2012
Fig. 17. Comparison of O−C diagrams of V844 Her betweendifferent superoutbursts. A period of 0.05590 d was used todraw this figure. Approximate cycle counts (E) after the startof the superoutburst were used. For descriptions of the 2009,2010 and 2010b superoutburst see Kato et al. (2012a).
Figure 17 illustrates a comparison of O−C diagramsbetween different superoutbursts. As noted in Kato et al.(2012a), the epoch of stage B–C transition is different be-tween different superoutbursts. The B–C transition in the2012 superoutburst appears to have occurred earlier thanin other superoutbursts.
3.21. MM Hydrae
We observed the early and late stages of the 2012 super-outburst of this object. The times of superhump maximaare listed in table 24. The O−C diagram indicates thatwe missed the middle-to-end part of stage B, and it wasimpossible to determine Pdot. Although a comparison ofO−C diagrams can be drawn (figure 18), middle to latepart of stage B has not yet been well recorded in thisobject.
3.22. VW Hydri
Although this object is one of the best and oldest knownprototypical SU UMa-type dwarf novae, no high-qualityphotometric data for superhumps had been publicly avail-able. The present observation (Hambsch 2012) recordedthe 2011 November–December superoutburst and twonormal outbursts in 2011 December and 2012 January.Although the data were not as uninterrupted as Keplerobservations, the data provide an opportunity to analyzeobservations of this well-known object in a modern wayand with modern knowledge.The times of superhump maxima during the superout-
burst are listed in table 25.The outburst started with a precursor (figure 19, lower
pnel), after a stage of short fading branch and entered theplateau phase. During the plateau phase, stage A and twosegments of almost constant periods, which we attribute
Table 23. Superhump maxima of V844 Her (2012).
E max∗ error O−C† N ‡
0 56050.3428 0.0002 0.0028 1081 56050.3997 0.0001 0.0038 1172 56050.4563 0.0001 0.0044 7122 56051.5754 0.0004 0.0055 5130 56052.0187 0.0004 0.0016 9131 56052.0758 0.0003 0.0029 9232 56052.1291 0.0003 0.0003 9333 56052.1850 0.0003 0.0002 8134 56052.2424 0.0008 0.0017 2335 56052.2992 0.0012 0.0026 2237 56052.4098 0.0002 0.0014 6838 56052.4639 0.0002 −0.0004 7539 56052.5194 0.0003 −0.0007 6140 56052.5788 0.0004 0.0027 4156 56053.4671 0.0003 −0.0034 7657 56053.5233 0.0002 −0.0031 7662 56053.8026 0.0011 −0.0032 1163 56053.8568 0.0011 −0.0050 1267 56054.0835 0.0012 −0.0018 6768 56054.1391 0.0005 −0.0022 9269 56054.1891 0.0008 −0.0080 10870 56054.2490 0.0008 −0.0041 5774 56054.4731 0.0003 −0.0036 7475 56054.5308 0.0003 −0.0018 7680 56054.8101 0.0008 −0.0020 1281 56054.8610 0.0015 −0.0070 1287 56055.2002 0.0007 −0.0032 6188 56055.2581 0.0008 −0.0012 6298 56055.8172 0.0013 −0.0010 1299 56055.8689 0.0032 −0.0053 12110 56056.4915 0.0006 0.0024 75111 56056.5511 0.0015 0.0061 69122 56057.1642 0.0019 0.0043 35123 56057.2213 0.0010 0.0055 40124 56057.2740 0.0014 0.0023 38164 56059.5099 0.0007 0.0022 46165 56059.5653 0.0004 0.0017 42176 56060.1775 0.0008 −0.0010 42177 56060.2345 0.0016 0.0001 40181 56060.4574 0.0009 −0.0006 59182 56060.5146 0.0008 0.0007 62183 56060.5734 0.0017 0.0035 62∗BJD−2400000.†Against max = 2456050.3401+ 0.055900E.‡Number of points used to determine the maximum.

No. ] Period Variations in SU UMa-Type Dwarf Novae IV 21
0 50 100 150 200 250
−0.03
−0.02
−0.01
0.00
0.01
199820012012
Fig. 18. Comparison of O−C diagrams of MM Hya betweendifferent superoutbursts. A period of 0.05892 d was used todraw this figure. Approximate cycle counts (E) after the startof the superoutburst were used.
Table 24. Superhump maxima of MM Hya (2012).
E max∗ error O−C† N ‡
0 55993.5863 0.0008 0.0008 121 55993.6431 0.0009 −0.0012 172 55993.7015 0.0008 −0.0016 183 55993.7580 0.0023 −0.0040 20104 55999.6983 0.0025 −0.0078 9105 55999.7591 0.0026 −0.0058 14119 56000.5967 0.0017 0.0078 16120 56000.6488 0.0020 0.0011 19121 56000.7086 0.0017 0.0021 14122 56000.7681 0.0019 0.0027 10135 56001.5303 0.0005 −0.0002 44136 56001.5987 0.0009 0.0094 23137 56001.6485 0.0013 0.0003 18138 56001.7135 0.0022 0.0065 6139 56001.7670 0.0011 0.0011 15144 56002.0616 0.0009 0.0014 122145 56002.1193 0.0008 0.0003 99152 56002.5325 0.0007 0.0015 40153 56002.5928 0.0011 0.0029 23154 56002.6484 0.0012 −0.0003 18201 56005.3977 0.0019 −0.0170 61∗BJD−2400000.†Against max = 2455993.5854+ 0.058852E.‡Number of points used to determine the maximum.
to stage B and C. The stage B–C transition occurred be-tween E = 68 and E = 77 and was apparently relativelysmooth compared to short-Porb systems (cf. Kato et al.2009 figure 4).During the rapid fading stage of the superoutburst a
phase reversal occurred as described as for “traditional”late superhumps (Schoembs, Vogt 1980; Vogt 1983), andthis signal persisted during the quiescent period after thissuperoutburst (figure 19). The times of maxima of thesesuperhumps are listed in table 26. In contrast to V344 Lyr(Kato et al. 2012a; Wood et al. 2011), there was no promi-nent signal of “secondary maxima” during the late plateaustage of the superoutburst, and it looks like that the phasesuddenly jumped by an ∼0.5 PSH. Although “traditional”late superhumps were usually considered to arise from anordinary stream-impact hot spot,3 the apparent absenceof the corresponding signal before the rapid fading, asrecorded in V344 Lyr, would make this traditional expla-nation worth reconsideration. The unavoidable gap be-tween BJD 2455904.9 and 2455905.4 made it difficult toexamine how this phase jump occurred.The times of the late superhumps, measured after sub-
tracting the mean orbital variation, are listed in table 26.These late superhumps persisted until the second nextnormal outburst, as observed in V344 Lyr (Kato et al.2012a; Wood et al. 2011). After this second normal out-burst, superhumps still persisted with a shorter period[0.075333(4) d] and there was a well-recognizable signalin PDM analysis (figure 20).
3.23. RZ Leonis Minoris
We analyzed three superoutbursts in 2012 from theAAVSO data (tables 27, 28, 29). The first two super-outbursts were observed for their later parts and the lastsuperoutburst was mainly observed for the earlier part. Inmeasuring Pdot, we did not use E ≥ 176 for the first out-burst, which were obtained during the fading stage andthe identification of the phases was ambiguous. A com-parison of O−C diagrams is shown in figure 21. Althougha combined O−C analysis of Olech et al. (2008) in Katoet al. (2009) was suggestive of a positive Pdot, the currentanalysis of the new data more strongly supports the posi-tive Pdot in this very unusual object. Although there wasa hint of emergence of double-wave modulations duringthe fading stage, we could not detect secure stage C super-humps. It would be worth noting that the epochs of super-hump maxima for these three superoutbursts can be rea-sonably well (within 0.005 d) expressed by a single periodof 0.059432(2) d, which might strengthen the finding byOlech et al. (2008) that there was no phase shift of super-humps between different superhumps. A direct analysis ofthe photometric data (PDM method, figure 22), however,strongly preferred a period of 0.059585(1) d with larger(0.010 d) and systematically variable O−C values. Sincethe O−C analysis of individual superoutbursts gives onlysmall residuals for the period of 0.05940 d, this preference
3 See also a discussion in Hessman et al. (1992), who reportedthat the traditional model of late superhumps by Vogt (1983)did not trivially explain the observed eclipse depths in OY Car.

22 T. Kato et al. [Vol. ,
0 100 200 300 400 500 600 700
−0.4
−0.2
0.0
890 900 910 920 930 940
14
12
10
8
891 892 893 894 895 89614
12
10
8
Fig. 19. O−C diagram of superhumps in VW Hyi (2011). (Upper): O−C. Filled circles and filled squares represent superhumpsand late superhumps after the rapid fading. We used a period of 0.076914 d for calculating the O−C residuals. (Middle): Lightcurve. (Lower): Enlarged light curve of showing the precursor and evolution of superhumps.

No. ] Period Variations in SU UMa-Type Dwarf Novae IV 23
Table 25. Superhump maxima of VW Hyi (2011).
E max∗ error O−C† N ‡
0 55892.5748 0.0007 −0.0202 8403 55892.8124 0.0024 −0.0128 2612 55893.5120 0.0006 −0.0041 3313 55893.5865 0.0004 −0.0064 4214 55893.6647 0.0005 −0.0050 2415 55893.7424 0.0004 −0.0040 2216 55893.8190 0.0005 −0.0042 2525 55894.5140 0.0001 −0.0001 72126 55894.5919 0.0001 0.0011 83427 55894.6701 0.0003 0.0025 37128 55894.7459 0.0007 0.0016 1929 55894.8231 0.0013 0.0020 2131 55894.9762 0.0002 0.0016 18038 55895.5102 0.0015 −0.0018 2839 55895.5896 0.0008 0.0009 4240 55895.6670 0.0012 0.0015 2941 55895.7415 0.0012 −0.0008 2142 55895.8203 0.0014 0.0013 2251 55896.5134 0.0004 0.0034 64752 55896.5924 0.0002 0.0057 83953 55896.6712 0.0004 0.0078 35354 55896.7447 0.0011 0.0045 2055 55896.8205 0.0024 0.0035 2264 55897.5133 0.0010 0.0054 3265 55897.5926 0.0013 0.0079 4266 55897.6672 0.0014 0.0058 2167 55897.7454 0.0017 0.0072 2268 55897.8205 0.0010 0.0056 2277 55898.5086 0.0013 0.0028 2678 55898.5903 0.0009 0.0077 4279 55898.6630 0.0008 0.0036 3080 55898.7420 0.0011 0.0058 3181 55898.8203 0.0017 0.0074 3490 55899.5028 0.0038 −0.0010 2591 55899.5842 0.0007 0.0036 4292 55899.6586 0.0006 0.0013 3093 55899.7368 0.0014 0.0027 3194 55899.8123 0.0010 0.0015 33103 55900.5017 0.0022 −0.0000 25104 55900.5804 0.0013 0.0019 21105 55900.6553 0.0015 0.0000 30106 55900.7322 0.0011 0.0002 30107 55900.8089 0.0012 0.0001 34130 55902.5656 0.0020 −0.0088 25131 55902.6465 0.0038 −0.0046 30132 55902.7214 0.0016 −0.0066 30133 55902.7957 0.0015 −0.0090 34145 55903.7186 0.0016 −0.0073 30146 55903.7915 0.0015 −0.0112 34∗BJD−2400000.†Against max = 2455892.5949+ 0.076765E.‡Number of points used to determine the maximum.
Table 26. Late superhumps in VW Hyi (2011).
E max∗ error O−C† N ‡
0 55905.5093 0.0016 −0.0199 321 55905.5913 0.0018 −0.0140 210 55905.5093 0.0015 −0.0199 303 55905.7420 0.0014 −0.0155 324 55905.8211 0.0019 −0.0124 3313 55906.5142 0.0015 −0.0042 3314 55906.5930 0.0015 −0.0015 1915 55906.6703 0.0014 −0.0004 2816 55906.7476 0.0012 0.0009 3417 55906.8225 0.0021 −0.0003 3327 55907.5803 0.0011 −0.0035 2128 55907.6569 0.0013 −0.0030 3029 55907.7331 0.0009 −0.0029 3330 55907.8075 0.0025 −0.0046 3453 55909.5714 0.0009 0.0090 2254 55909.6458 0.0010 0.0073 2855 55909.7218 0.0015 0.0072 3156 55909.7949 0.0014 0.0042 3266 55910.5545 0.0008 0.0029 2067 55910.6310 0.0010 0.0032 2168 55910.7084 0.0008 0.0045 2269 55910.7847 0.0010 0.0048 2770 55910.8612 0.0023 0.0051 1480 55911.6155 0.0027 −0.0016 1581 55911.6975 0.0007 0.0044 2482 55911.7755 0.0007 0.0062 2783 55911.8477 0.0016 0.0024 2093 55912.6148 0.0021 0.0085 1694 55912.6937 0.0012 0.0113 2095 55912.7673 0.0019 0.0088 2696 55912.8477 0.0009 0.0130 18107 55913.6761 0.0015 0.0043 20108 55913.7510 0.0010 0.0031 25109 55913.8291 0.0016 0.0052 26119 55914.5864 0.0022 0.0015 15120 55914.6634 0.0008 0.0024 20121 55914.7410 0.0019 0.0039 27122 55914.8180 0.0014 0.0048 26145 55916.5642 0.0016 0.0007 15146 55916.6421 0.0019 0.0025 21147 55916.7187 0.0015 0.0030 26148 55916.7930 0.0020 0.0012 26158 55917.5454 0.0023 −0.0074 28159 55917.6268 0.0105 −0.0021 13161 55917.7855 0.0047 0.0044 19250 55924.5427 0.0012 −0.0112 46251 55924.6012 0.0035 −0.0288 22252 55924.6934 0.0016 −0.0126 25263 55925.5463 0.0011 0.0031 41264 55925.6232 0.0026 0.0039 23∗BJD−2400000.†Against max = 2455905.5291+ 0.076099E.‡Number of points used to determine the maximum.

24 T. Kato et al. [Vol. ,
0.072 0.073 0.074 0.075 0.076 0.077 0.078
0.96
0.98
1.00
1.02
(d)
θ
P=0.07533
−0.5 0.0 0.5 1.0 1.5
0.05
0.00
−0.05
Fig. 20. Late superhumps in VW Hyi after a normal out-burst. (Upper): PDM analysis after removing the meanorbital variation. The rejection rate for bootstrappingwas reduced to 0.2 for better visualization. (Lower):Phase-averaged profile.
of a different period over the 0.05940 d is an unnaturalbehavior. This suggests that the apparent coherence ofsuperhumps in the combined O−C analysis with a periodof 0.059432(2) d may simply be superficial, and that thetrue underlying period may be different. This possibilityshould be clarified by a larger set of data.While most of the weak signal in figure 22 corresponds
to aliases of the main superhump signal as is evident fromthe window function, the period at 0.059053(2) d does notarise from an alias. Since ǫ for objects around these PSH
is usually 1.0% or slightly less (cf. Kato et al. 2012a), weregard this period to be a candidate orbital period. Thewaveform of this periodicity is shown in figure 23. If thisis the true orbital period, the ǫ for stage B superhumps is0.6%. Further testing for the stability of this signal needsto be confirmed.
3.24. BK Lyncis
BK Lyn has been a well-known permanent superhumperbelow the period gap (Skillman, Patterson 1993). Theobject, however, has recently been demonstrated to showdwarf nova-type outbursts, and the pattern of outburstsis quite similar to those of ER UMa stars (E. de Miguel,
Table 26. Late superhumps in VW Hyi (2011) (continued).
E max∗ error O−C† N ‡
265 55925.6969 0.0017 0.0016 26266 55925.7700 0.0022 −0.0015 32278 55926.6932 0.0046 0.0085 13280 55926.8429 0.0028 0.0060 9289 55927.5281 0.0021 0.0063 23290 55927.5923 0.0015 −0.0056 18291 55927.6709 0.0013 −0.0031 19292 55927.7444 0.0025 −0.0056 21293 55927.8374 0.0021 0.0112 14303 55928.5967 0.0027 0.0095 17304 55928.6673 0.0010 0.0040 18305 55928.7469 0.0010 0.0075 22306 55928.8156 0.0025 0.0002 13383 55934.6792 0.0017 0.0042 17384 55934.7569 0.0012 0.0057 14397 55935.7212 0.0034 −0.0192 18421 55937.5789 0.0010 0.0121 16422 55937.6529 0.0007 0.0099 18423 55937.7285 0.0014 0.0095 18461 55940.5898 0.0008 −0.0210 19462 55940.6646 0.0015 −0.0223 22∗BJD−2400000.†Against max = 2455905.5291+ 0.076099E.‡Number of points used to determine the maximum.
0 20 40 60 80 100 120 140 160 180
−0.010
−0.005
0.000
0.005
0.010
20122012b2012c
Fig. 21. Comparison of O−C diagrams of RZ LMi betweendifferent superoutbursts. A period of 0.05940 d was used todraw this figure. Approximate cycle counts (E) after the startof the superoutburst were used.

No. ] Period Variations in SU UMa-Type Dwarf Novae IV 25
0.0580 0.0585 0.0590 0.0595 0.0600
0.7
0.8
0.9
1.0
(d)
θ
P=0.05958
Fig. 22. Period analysis of plateau phases of three subse-quent superoutbursts of RZ LMi. The curve at the bottom ofthe figure represents the window function.
−0.5 0.0 0.5 1.0 1.5
0.01
0.00
−0.01
−0.02
Fig. 23. Waveform of the candidate orbital period(0.059053 d) of RZ LMi.
see also Kemp et al. 2012). According to the NorthernSky Variability Survey (NSVS), the object was still in no-valike (NL)-type state in 2002.4 The CRTS data indicatethat the object already entered a DN state in 2005. Theoutburst-like variations were also recorded in AAVSO ob-servations in 2005–2006. We here analyze observations in2012, mostly from the AAVSO database.As in recent ER UMa (Ohshima et al. 2012), the object
showed negative superhumps during most of its outburstcycle, and showed positive superhumps during the ∼10 dinitial part of superoutbursts. We first identified the pe-riod of positive superhumps using the best observed su-peroutburst in 2012 April. The period was identified to be0.07859(1) d (figure 24). With the help of this period, wecould identify the times of superhump maxima during theless-observed 2012 February–March superoutburst (table30). Although the maxima for E≤3 were those of negative
4 <http://skydot.lanl.gov/nsvs/star.php?num=7454712&mask=32004>
Table 27. Superhump maxima of RZ LMi (2012February–March).
E max∗ error O−C† N ‡
0 55985.8946 0.0016 0.0046 101 55985.9531 0.0014 0.0036 711 55986.5476 0.0011 0.0027 1812 55986.6056 0.0012 0.0011 1413 55986.6690 0.0017 0.0050 1414 55986.7253 0.0014 0.0017 1515 55986.7866 0.0057 0.0035 1326 55987.4366 0.0004 −0.0014 4028 55987.5568 0.0031 −0.0003 1229 55987.6183 0.0019 0.0016 1430 55987.6743 0.0011 −0.0019 1431 55987.7325 0.0019 −0.0032 1342 55988.3877 0.0011 −0.0030 3843 55988.4431 0.0017 −0.0071 3444 55988.5117 0.0033 0.0020 4445 55988.5717 0.0014 0.0024 5746 55988.6243 0.0007 −0.0045 5561 55989.5188 0.0015 −0.0032 4262 55989.5808 0.0011 −0.0007 4263 55989.6342 0.0008 −0.0068 41126 55993.3849 0.0022 −0.0071 38176 55996.3719 0.0012 0.0030 35177 55996.4281 0.0040 −0.0004 35178 55996.4921 0.0011 0.0040 43179 55996.5485 0.0008 0.0009 43180 55996.6107 0.0011 0.0036 43∗BJD−2400000.†Against max = 2455985.8900+ 0.059540E.‡Number of points used to determine the maximum.
superhumps [P =0.071(2) d], we included these epochs toillustrate the smooth transition from negative superhumpsto positive superhumps in phase as recorded in ER UMa(Ohshima et al. 2012). The times of superhump maximaduring the 2012 April superoutburst are shown in table32. Since the epochs E = 1,2 were obtained before themaximum of the superoutburst, we did not use them incalculating the period and Pdot. During the later stage(E ≥ 114), the structure of superhumps became complexand both negative and positive superhumps appeared tocoexist. Although the superhump period during the su-peroutburst was not very different from those recordedduring its NL-type state (Skillman, Patterson 1993), theamplitudes of superhumps were much larger than those inits former NL-type state, implying that 3:1 resonance ismore strongly excited during a superoutburst.A comparison of the O−C diagrams of positive super-
humps between different superhumps is shown in figure25. The disagreement between the O−C diagrams wasslightly larger than in other SU UMa-type dwarf novae,which may be a result of remnant, overlapping negativesuperhumps. Particularly, the relatively large scatter inthe O − C diagram in the later part of this figure wascaused by profile variations caused by evolving negative

26 T. Kato et al. [Vol. ,
Table 28. Superhump maxima of RZ LMi (2012March–April).
E max∗ error O−C† N ‡
0 56013.6575 0.0013 0.0032 481 56013.7157 0.0011 0.0019 482 56013.7722 0.0011 −0.0011 4717 56014.6658 0.0009 0.0004 4718 56014.7193 0.0040 −0.0055 6119 56014.7888 0.0022 0.0045 7220 56014.8436 0.0026 −0.0002 2534 56015.6745 0.0016 −0.0018 4735 56015.7329 0.0016 −0.0029 4936 56015.7914 0.0027 −0.0040 4750 56016.6273 0.0017 −0.0006 6451 56016.6882 0.0006 0.0008 6352 56016.7519 0.0020 0.0051 9153 56016.8072 0.0011 0.0009 7654 56016.8649 0.0021 −0.0009 2067 56017.6371 0.0009 −0.0018 6268 56017.6986 0.0010 0.0002 6269 56017.7581 0.0010 0.0002 6384 56018.6517 0.0017 0.0017 60∗BJD−2400000.†Against max = 2456013.6543+ 0.059472E.‡Number of points used to determine the maximum.
Table 29. Superhump maxima of RZ LMi (2012 April).
E max∗ error O−C† N ‡
0 56030.8288 0.0004 0.0026 1815 56031.7195 0.0015 0.0022 3716 56031.7776 0.0005 0.0009 3247 56033.6196 0.0011 0.0012 3448 56033.6779 0.0004 0.0001 8149 56033.7354 0.0003 −0.0018 8850 56033.7953 0.0010 −0.0013 2164 56034.6275 0.0005 −0.0009 6365 56034.6854 0.0005 −0.0023 9966 56034.7453 0.0005 −0.0018 9681 56035.6371 0.0004 −0.0012 6782 56035.6959 0.0005 −0.0018 9483 56035.7560 0.0006 −0.0011 7498 56036.6480 0.0007 −0.0002 62131 56038.6100 0.0025 0.0013 44132 56038.6712 0.0013 0.0031 63133 56038.7287 0.0009 0.0012 61∗BJD−2400000.†Against max = 2456030.8262+ 0.059408E.‡Number of points used to determine the maximum.
Table 30. Superhump maxma of BK Lyn (2012February–March).
E max∗ error O−C† N ‡
0 55971.6983 0.0012 0.0155 691 55971.7771 0.0012 0.0159 752 55971.8456 0.0011 0.0061 763 55971.9115 0.0015 −0.0062 719 55972.3785 0.0006 −0.0088 3910 55972.4569 0.0005 −0.0087 4121 55973.3168 0.0021 −0.0099 2122 55973.3992 0.0008 −0.0059 4023 55973.4779 0.0012 −0.0054 4024 55973.5590 0.0008 −0.0026 3925 55973.6400 0.0009 0.0001 3926 55973.7193 0.0010 0.0012 2073 55977.3967 0.0015 −0.0006 7274 55977.4807 0.0049 0.0051 4376 55977.6363 0.0027 0.0041 71∗BJD−2400000.†Against max = 2455971.6828+ 0.078280E.‡Number of points used to determine the maximum.
superhumps.The behavior of negative superhumps was very similar
to that of ER UMa (figure 26; cf. figure 2 of Ohshimaet al. 2012). The mean period of negative superhumpsduring the superoutburst was 0.072793(7) d (0≤E≤ 280).The period slightly lengthened later, and stabilized to aslightly longer period during the phase showing normaloutbursts [mean period 0.072922(6) d for 280≤ E ≤ 544](table 31). It is noteworthy that there was no jump inphase when superhumps switched from negative ones topositive ones. The same phenomenon was observed in ERUMa (Ohshima et al. 2012). The amplitudes of negativesuperhumps were well correlated with the system magni-tude, and the amplitudes became larger when the systemgets fainter. This relation was also observed in V344 Lyr(cf. figure 79 of Kato et al. 2012a), V503 Cyg (Harveyet al. 1995), MN Dra (Pavlenko et al. 2010a) and ERUMa, although Ohshima et al. (2012) did not present thecorresponding figure.Kemp et al. (2012) proposed that a transition from a
permanent superhumper to a dwarf nova may a result ofcooling of the white dwarf following a nova eruption. Thetime-scale (several years) of this transition, however, ap-pears to be too short compared to the proposed dura-tion (∼ 1900 yr) of the post-nova state. The change ofstate may also be a result of variable mass-transfer rateas recorded in other ER UMa-type dwarf novae such asV1159 Ori (Kato 2001) rather than secular evolution.
3.25. V585 Lyrae
Although the object was extensively observed duringthe 2003 superoutburst (cf. Kato et al. 2009), no se-cure record of an outburst had been recorded until 2012.The 2012 superoutburst was detected by P. A. Dubovsky(vsnet-alert 14494). We obtained two nights of observa-

No. ] Period Variations in SU UMa-Type Dwarf Novae IV 27
−200 −100 0 100 200 300 400 500 600 700
0.0
0.1
0.2
0.3
0.0
0.2
0.4
0.6
0.8
970 980 990 1000 1010 1020 1030
16
15
14
Fig. 26. O−C diagram of negative superhumps in BK Lyn (2012). (Upper:) O−C. Filled circles and filled squares representnegative superhumps and positive superhumps, respectively. The positive superhumps appeared as the next superoutburst started,and the phase of the hump maximum was continuous with that of the preceding negative superhumps. The maxima of positivesuperhumps during the first superoutburst are not shown. We used a period of 0.07280 d for calculating the O − C residuals.(Middle:) Amplitudes of negative superhumps. The amplitudes become larger when the system fades. (Lower:) Light curve. Thesupercycle is ∼50 d and there were three normal outbursts between the superoutbursts.

28 T. Kato et al. [Vol. ,
Table 31. Times of negative superhumps in BK Lyn.
E max∗ error O−C† N ‡
0 55980.3754 0.0007 0.0147 381 55980.4487 0.0017 0.0153 383 55980.5802 0.0018 0.0010 374 55980.6492 0.0011 −0.0028 387 55980.8787 0.0011 0.0080 338 55980.9500 0.0028 0.0065 3514 55981.3926 0.0006 0.0118 3915 55981.4669 0.0007 0.0133 3716 55981.5455 0.0014 0.0191 3717 55981.6180 0.0020 0.0186 3821 55981.8987 0.0005 0.0079 3322 55981.9707 0.0020 0.0071 3535 55982.9136 0.0006 0.0027 3736 55982.9856 0.0014 0.0018 3583 55986.4151 0.0016 0.0066 3884 55986.4814 0.0014 0.0001 3385 55986.5601 0.0013 0.0059 3486 55986.6320 0.0009 0.0050 3796 55987.3671 0.0016 0.0114 3497 55987.4377 0.0017 0.0091 3798 55987.5104 0.0029 0.0089 2099 55987.5807 0.0010 0.0064 37100 55987.6514 0.0012 0.0042 74114 55988.6707 0.0007 0.0034 70115 55988.7376 0.0010 −0.0026 70128 55989.6868 0.0011 −0.0006 107129 55989.7556 0.0009 −0.0047 109130 55989.8273 0.0006 −0.0059 76131 55989.9025 0.0008 −0.0036 38132 55989.9795 0.0006 0.0006 27142 55990.7038 0.0018 −0.0037 29143 55990.7704 0.0006 −0.0100 28144 55990.8470 0.0009 −0.0063 37145 55990.9213 0.0009 −0.0049 36146 55990.9992 0.0013 0.0002 32205 55995.2980 0.0015 −0.0001 37206 55995.3687 0.0010 −0.0022 105207 55995.4409 0.0019 −0.0029 61208 55995.5085 0.0016 −0.0082 30220 55996.3870 0.0015 −0.0040 37233 55997.3443 0.0015 0.0060 28234 55997.4104 0.0020 −0.0008 37235 55997.4785 0.0015 −0.0056 36237 55997.6176 0.0013 −0.0122 37238 55997.6893 0.0015 −0.0134 26247 55998.3545 0.0010 −0.0039 33248 55998.4217 0.0017 −0.0096 36249 55998.4863 0.0012 −0.0179 37261 55999.3772 0.0008 −0.0014 149262 55999.4466 0.0006 −0.0049 155263 55999.5109 0.0006 −0.0134 85264 55999.5829 0.0004 −0.0142 83∗BJD−2400000.†Against max = 2455980.3606+ 0.072866E.‡Number of points used to determine the maximum.
Table 31. Times of negative superhumps in BK Lyn.
E max∗ error O−C† N ‡
265 55999.6572 0.0009 −0.0128 80266 55999.7331 0.0010 −0.0098 76267 55999.8042 0.0010 −0.0115 69274 56000.3215 0.0007 −0.0043 59275 56000.3944 0.0005 −0.0043 94276 56000.4666 0.0004 −0.0049 96277 56000.5342 0.0008 −0.0102 74278 56000.6064 0.0006 −0.0109 118279 56000.6762 0.0006 −0.0139 144280 56000.7488 0.0003 −0.0142 169281 56000.8213 0.0004 −0.0146 159282 56000.9008 0.0010 −0.0079 65288 56001.3384 0.0004 −0.0076 90289 56001.4108 0.0003 −0.0080 165290 56001.4818 0.0003 −0.0099 164291 56001.5541 0.0004 −0.0104 138292 56001.6257 0.0004 −0.0117 160293 56001.6982 0.0005 −0.0120 154294 56001.7739 0.0004 −0.0092 118295 56001.8487 0.0003 −0.0073 127302 56002.3597 0.0005 −0.0064 52303 56002.4311 0.0005 −0.0078 60304 56002.5064 0.0005 −0.0054 61305 56002.5792 0.0006 −0.0054 60307 56002.7236 0.0004 −0.0068 70308 56002.7958 0.0006 −0.0074 70316 56003.3838 0.0005 −0.0024 67319 56003.6021 0.0007 −0.0026 77320 56003.6714 0.0004 −0.0062 96321 56003.7420 0.0008 −0.0085 70322 56003.8161 0.0006 −0.0073 61334 56004.6958 0.0008 −0.0020 71335 56004.7690 0.0007 −0.0016 70343 56005.3553 0.0007 0.0018 52346 56005.5768 0.0005 0.0047 31347 56005.6492 0.0006 0.0041 58349 56005.7955 0.0019 0.0048 40357 56006.3766 0.0006 0.0030 150358 56006.4429 0.0005 −0.0036 161359 56006.5174 0.0005 −0.0020 150360 56006.5887 0.0007 −0.0036 119370 56007.3278 0.0005 0.0069 38384 56008.3424 0.0005 0.0014 99385 56008.4199 0.0003 0.0060 99386 56008.4893 0.0006 0.0025 90387 56008.5628 0.0007 0.0032 132388 56008.6355 0.0005 0.0030 82390 56008.7829 0.0007 0.0047 64398 56009.3636 0.0008 0.0025 67399 56009.4342 0.0006 0.0002 67400 56009.5119 0.0008 0.0051 66402 56009.6606 0.0008 0.0080 65403 56009.7327 0.0013 0.0072 70404 56009.7992 0.0014 0.0008 66∗BJD−2400000.†Against max = 2455980.3606+ 0.072866E.‡Number of points used to determine the maximum.

No. ] Period Variations in SU UMa-Type Dwarf Novae IV 29
Table 31. Times of negative superhumps in BK Lyn.
E max∗ error O−C† N ‡
425 56011.3411 0.0003 0.0125 162426 56011.4104 0.0004 0.0090 233427 56011.4817 0.0003 0.0074 238428 56011.5444 0.0005 −0.0027 136431 56011.7727 0.0005 0.0069 48439 56012.3546 0.0003 0.0059 220440 56012.4247 0.0003 0.0031 212441 56012.5003 0.0003 0.0059 124444 56012.7173 0.0008 0.0043 70445 56012.7888 0.0006 0.0029 61453 56013.3721 0.0002 0.0033 213454 56013.4456 0.0003 0.0040 215455 56013.5206 0.0003 0.0061 111467 56014.3951 0.0004 0.0062 196468 56014.4673 0.0004 0.0056 163469 56014.5387 0.0004 0.0041 131470 56014.6154 0.0011 0.0080 23471 56014.6861 0.0008 0.0057 56472 56014.7585 0.0008 0.0053 56480 56015.3382 0.0010 0.0020 299481 56015.4170 0.0006 0.0080 281482 56015.4887 0.0007 0.0068 201483 56015.5588 0.0006 0.0041 162484 56015.6340 0.0005 0.0064 50494 56016.3649 0.0006 0.0086 211495 56016.4368 0.0006 0.0077 182496 56016.5051 0.0005 0.0031 125498 56016.6493 0.0007 0.0016 46508 56017.3803 0.0005 0.0039 71509 56017.4536 0.0007 0.0044 108510 56017.5283 0.0008 0.0062 74522 56018.3972 0.0005 0.0007 60523 56018.4714 0.0003 0.0020 62524 56018.5430 0.0004 0.0008 61530 56018.9824 0.0006 0.0030 129540 56019.7023 0.0011 −0.0058 71544 56020.0010 0.0010 0.0015 150∗BJD−2400000.†Against max = 2455980.3606+ 0.072866E.‡Number of points used to determine the maximum.
0.070 0.072 0.074 0.076 0.078 0.080 0.082
0.7
0.8
0.9
1.0
(d)
θ
P=0.07859
−0.5 0.0 0.5 1.0 1.50.10
0.05
0.00
−0.05
−0.10
Fig. 24. Positive superhumps in BK Lyn (2012 April).(Upper): PDM analysis. A period at 0.0728 d is a one–day alias of the superhump period. This period coincidedthe period of negative superhumps by chance. (Lower):Phase-averaged profile.
tions and listed the times of maxima (table 33). The pe-riod in table 2 was obtained by the PDM method.
3.26. FQ Monocerotis
Only a fragment of the 2011 superoutburst was ob-served. The times of superhump maxima are listed intable 34. Since the object quickly faded three days af-ter the observation, it is likely we only observed stage Csuperhumps.
3.27. V1032 Ophiuchi
This object is an eclipsing SU UMa-type dwarf nova(Kato et al. 2010). By applying Markov-Chain MonteCarlo (MCMC) method to the phased data using the pe-riod and epoch as trial variables (see appendix 1), we ob-tained an updated orbital ephemeris of
Min(BJD) = 2455286.68256(7)+0.081055386(10)E (1)
based on 2010 and 2012 observations. The times of su-perhump maxima are listed in table 35. A PDM analysisyielded a consistent result of 0.08599(5) d.

30 T. Kato et al. [Vol. ,
Table 32. Superhump maxima of BK Lyn (2012 April).
E max∗ error O−C† N ‡
0 56020.6533 0.0009 −0.0043 671 56020.7259 0.0011 −0.0102 6625 56022.6242 0.0004 0.0029 14236 56023.4880 0.0018 0.0027 6237 56023.5685 0.0011 0.0047 9538 56023.6449 0.0005 0.0025 7139 56023.7240 0.0006 0.0031 7048 56024.4297 0.0005 0.0018 6649 56024.5077 0.0006 0.0013 7350 56024.5853 0.0006 0.0003 9451 56024.6628 0.0004 −0.0007 14652 56024.7410 0.0005 −0.0011 13960 56025.3774 0.0005 0.0069 8261 56025.4519 0.0005 0.0029 8262 56025.5290 0.0005 0.0014 9073 56026.3951 0.0008 0.0035 7574 56026.4729 0.0011 0.0027 7577 56026.7014 0.0009 −0.0043 7678 56026.7839 0.0018 −0.0004 4388 56027.5681 0.0009 −0.0017 4389 56027.6441 0.0005 −0.0043 7090 56027.7221 0.0005 −0.0048 6699 56028.4338 0.0018 −0.0000 88100 56028.5159 0.0008 0.0035 50101 56028.5918 0.0007 0.0009 74102 56028.6665 0.0006 −0.0030 69103 56028.7423 0.0008 −0.0057 63114 56029.6190 0.0053 0.0069 51115 56029.6781 0.0011 −0.0124 66116 56029.7610 0.0019 −0.0081 40124 56030.4074 0.0011 0.0098 153125 56030.4849 0.0024 0.0089 104126 56030.5569 0.0013 0.0023 69127 56030.6252 0.0022 −0.0080 91∗BJD−2400000.†Against max = 2456020.6576+ 0.078548E.‡Number of points used to determine the maximum.
Table 33. Superhump maxima of V585 Lyr (2012).
E max∗ error O−C† N ‡
0 56045.1580 0.0005 −0.0005 1231 56045.2195 0.0006 0.0006 7118 56046.2441 0.0008 −0.0025 12419 56046.3094 0.0023 0.0023 68∗BJD−2400000.†Against max = 2456045.1584+ 0.060454E.‡Number of points used to determine the maximum.
−20 0 20 40 60 80 100 120 140
−0.04
−0.02
0.00
0.02
20122012b
Fig. 25. Comparison of O− C diagrams of positive super-humps of BK Lyn between different superoutbursts. The ab-breviation 2012 refers to the 2012 February–March superout-burst and 2012b the 2012 April one, respectively. A periodof 0.07859 d was used to draw this figure. Approximate cyclecounts (E) after the appearance of the positive superhumpswere used. The maxima for E < 0 are negative superhumps.As known in ER UMa (Ohshima et al. 2012), there were rel-atively large intranight O − C variations against the meanperiod of positive superhumps. This can be interpreted as aresult of the coexistence of negative superhumps.
Table 34. Superhump maxima of FQ Mon (2011).
E max∗ error O−C† N ‡
0 55922.0918 0.0011 −0.0015 1301 55922.1676 0.0033 0.0015 6713 55923.0405 0.0020 0.0018 9114 55923.1096 0.0015 −0.0018 130∗BJD−2400000.†Against max = 2455922.0934+ 0.072718E.‡Number of points used to determine the maximum.
Table 35. Superhump maxima of V1032 Oph (2012).
E max∗ error O−C† phase‡ N §
0 56076.3539 0.0046 −0.0101 0.52 809 56077.1475 0.0015 0.0098 0.23 12712 56077.3984 0.0009 0.0029 0.15 14847 56080.4017 0.0012 −0.0026 0.29 150∗BJD−2400000.†Against max = 2456076.3640+ 0.085965E.‡Orbital phase.§Number of points used to determine the maximum.

No. ] Period Variations in SU UMa-Type Dwarf Novae IV 31
Table 36. Superhump maxima of V1159 Ori (2012).
E max∗ error O−C† N ‡
0 55991.6169 0.0004 0.0065 1231 55991.6826 0.0004 0.0074 12416 55992.6410 0.0010 −0.0046 5730 55993.5407 0.0012 −0.0106 4231 55993.6059 0.0023 −0.0101 5761 55995.5631 0.0005 0.0064 5462 55995.6264 0.0009 0.0049 5877 55996.5919 0.0011 0.0000 58∗BJD−2400000.†Against max = 2455991.6105+ 0.064694E.‡Number of points used to determine the maximum.
3.28. V2051 Ophiuchi
Only one superhump was recorded during the 2012February superoutburst: BJD 2455985.3378(2) (N =157).
3.29. V1159 Orionis
V1159 Ori is one of the member of the ER UMa stars(Robertson et al. 1995; Nogami et al. 1995; Pattersonet al. 1995). Although the object generally follows the ERUMa-type pattern with a short supercycle (Kato, Kunjaya1995), the object is known to show variations of supercy-cles with a range of 44.6–53.3 d (Kato 2001). Since it hasbeen demonstrated that the prototype ER UMa has re-cently been in a state of “negative superhumps” (Ohshimaet al. 2012), it would be worth examining the current stateof superhumps in V1159 Ori.The observations were taken during its 2012 March su-
peroutburst (the data were mainly from the AAVSO). Thetimes of superhump maxima are listed in table 36. Therewas a ∼0.5 phase shift between E = 31 and E = 77, asseen in ER UMa in its “positive superhump” state (Katoet al. 2003a). A period analysis for E ≥ 61 yielded a pe-riod of 0.06430(5) d, indicating that the period after thephase shift was that of positive superhumps, and not thatof negative superhumps. The behavior well reproducedER UMa in its “positive superhump” state (in the 1990s).V1159 Ori is currently the best target to investigate theER UMa-type phenomena in “positive superhump” stateand further detailed observations are required.
3.30. AR Pictoris
We observed the 2011 superoutburst of this object(=CTCV J0549−4921, Imada et al. 2008a). Kato et al.(2009) identified this object with a large negative Pdot.The times of superhump maxima are listed in table 37. Weonly observed the terminal portion of the superoutburst,and the mean superhump period [0.08315(15) d] was muchshorter than the value obtained during the 2006 superout-burst (Kato et al. 2009). During the post-superoutburstphase, we could detect a superhump period of 0.08225(9) d(PDM method). A lasso analysis yielded a combination ofthe superhump period and a period of 0.0801(1) d, whichis potentially the orbital period. If this is indeed Porb, ǫ
0 20 40 60 80 100
−0.08
−0.06
−0.04
−0.02
0.00
20062011
Fig. 27. Comparison of O−C diagrams of AR Pic betweendifferent superoutbursts. A period of 0.08458 d was used todraw this figure. Approximate cycle counts (E) after the startof the superoutburst were used.
Table 37. Superhump maxima of AR Pic (2011).
E max∗ error O−C† N ‡
0 55910.5774 0.0018 0.0038 201 55910.6570 0.0014 0.0002 252 55910.7425 0.0011 0.0026 293 55910.8225 0.0017 −0.0005 2913 55911.6510 0.0016 −0.0036 2524 55912.5752 0.0144 0.0059 1925 55912.6474 0.0066 −0.0051 1726 55912.7304 0.0022 −0.0052 2338 55913.7164 0.0111 −0.0171 2739 55913.8294 0.0034 0.0128 2950 55914.7376 0.0093 0.0063 28∗BJD−2400000.†Against max = 2455910.5736+ 0.083154E.‡Number of points used to determine the maximum.
for the 2006 and 2011 superoutburst were 5.4% (average)and 3.7%, respectively. A comparison of O−C diagrams(figure 27) indicates that the O−C diagram in 2011 isin smooth extension of the 2006 one, which was obtainedonly during the early stage.
3.31. GV Piscium
The 2011 superoutburst of this object was detectedby CRTS on October 17. Subsequent observations con-firmed the presence of superhumps (vsnet-alert 13768).The times of superhump maxima are listed in table 38.There was little hint of period variation, and the meanperiod was close to that obtained during the 2008 super-outburst (Kato et al. 2009). Since the object faded rela-tively soon after the outburst detection, it looks likely thatwe also observed only stage C superhumps as in 2008.

32 T. Kato et al. [Vol. ,
Table 38. Superhump maxima of GV Psc (2011).
E max∗ error O−C† N ‡
0 55852.3350 0.0003 −0.0003 951 55852.4291 0.0003 −0.0005 864 55852.7127 0.0003 0.0001 945 55852.8055 0.0003 −0.0014 8711 55853.3728 0.0003 −0.0000 9012 55853.4688 0.0005 0.0016 9925 55854.6952 0.0003 0.0020 9926 55854.7867 0.0004 −0.0008 9061 55858.0892 0.0008 0.0007 6262 55858.1814 0.0007 −0.0014 61∗BJD−2400000.†Against max = 2455852.3354+ 0.094313E.‡Number of points used to determine the maximum.
3.32. BW Sculptoris
This object (=HE 2350−3908, RX J2353.0−3852) wasinitially discovered in the Hamburg/ESO quasar survey(Augusteijn, Wisotzki 1997) and was also selected as aROSAT CV (Abbott et al. 1997). Its remarkable similar-ity with WZ Sge was already noted at its very early history(Augusteijn, Wisotzki 1997). Despite monitoring, therehad been no outbursts until 2011. Uthas et al. (2012) re-ported the ZZ Cet-type pulsation of the white dwarf andthe presence of quiescent superhumps 11% longer thanPorb.The 2011 outburst was detected by M. Linnolt on
October 21 at a visual magnitude of 9.6 (posting toAAVSO discussion), and subsequent observation soonconfirmed early superhumps (vsnet-alert 13786; figure 28).The last observation before this outburst was on October15 (by J. Hambsch; see also Hambsch 2012) when the ob-ject was still in quiescence. On October 31, ordinary su-perhumps developed (vsnet-alert 13815, 13819; figure 29).The object entered the rapid fading stage on November12 (vsnet-alert 13847, 13850). The times of maxima ofordinary superhumps are listed in table 39. Followinga period of stage A (E ≤ 25), there was stage B withPdot = +4.3(0.3)× 10−5. Although there was a sugges-tion of sudden shortening of the superhump period af-ter E = 210, as seen in other WZ Sge-type dwarf novae[e.g. GW Lib and V455 And (Kato et al. 2009); OTJ012059.6+325545 and SDSS J080434.20+510349.2 = EZLyn, (Kato et al. 2012a)], a discontinuity in the observa-tion made the identification of hump phasing uncertain.We list times of hump maxima after this rapid fading intable 40, which were measured after subtracting the meanorbital variation (figure 30). The overall behavior of theoutburst and O−C diagram were very similar to those ofGW Lib and V455 And. The period of early superhumpswas 0.054308(2) d, 0.03% shorter than Porb. The ǫ forstage B superhumps was 1.3%.A full analysis will be presented by Ohshima et al., in
preparation.
Table 39. Superhump maxima of BW Scl (2011).
E max∗ error O−C† N ‡
0 55865.5288 0.0016 −0.0209 891 55865.5827 0.0022 −0.0221 612 55865.6444 0.0031 −0.0155 893 55865.6992 0.0044 −0.0157 898 55865.9875 0.0003 −0.0026 4269 55866.0407 0.0004 −0.0044 18710 55866.0966 0.0006 −0.0035 15417 55866.4844 0.0030 −0.0010 5018 55866.5415 0.0005 0.0011 8919 55866.6000 0.0004 0.0045 8820 55866.6558 0.0004 0.0053 8921 55866.7103 0.0008 0.0048 8925 55866.9339 0.0003 0.0082 27926 55866.9873 0.0002 0.0065 30527 55867.0432 0.0003 0.0074 27428 55867.0976 0.0004 0.0068 22331 55867.2628 0.0001 0.0069 23832 55867.3191 0.0001 0.0081 23833 55867.3729 0.0001 0.0069 23634 55867.4282 0.0003 0.0071 12535 55867.4830 0.0001 0.0069 28136 55867.5371 0.0001 0.0060 30237 55867.5926 0.0002 0.0065 7538 55867.6471 0.0002 0.0059 8939 55867.7022 0.0002 0.0060 8946 55868.0864 0.0002 0.0049 8947 55868.1424 0.0002 0.0058 6854 55868.5261 0.0004 0.0044 8955 55868.5816 0.0003 0.0048 8856 55868.6357 0.0003 0.0039 8957 55868.6911 0.0003 0.0042 8858 55868.7479 0.0005 0.0059 5563 55869.0200 0.0002 0.0029 14464 55869.0756 0.0003 0.0035 18265 55869.1295 0.0003 0.0023 10272 55869.5126 0.0006 0.0001 9173 55869.5701 0.0012 0.0026 6574 55869.6238 0.0004 0.0013 8975 55869.6781 0.0005 0.0005 8976 55869.7328 0.0005 0.0002 8480 55869.9520 0.0005 −0.0008 14181 55870.0068 0.0004 −0.0010 16582 55870.0626 0.0004 −0.0003 23783 55870.1169 0.0002 −0.0010 9384 55870.1713 0.0003 −0.0017 8490 55870.5005 0.0004 −0.0026 3391 55870.5567 0.0004 −0.0015 3792 55870.6106 0.0003 −0.0027 4493 55870.6659 0.0003 −0.0024 4394 55870.7217 0.0003 −0.0016 44104 55871.2706 0.0001 −0.0030 238105 55871.3265 0.0002 −0.0022 237106 55871.3808 0.0003 −0.0029 197108 55871.4894 0.0006 −0.0045 24109 55871.5484 0.0006 −0.0004 33110 55871.5994 0.0003 −0.0045 40∗BJD−2400000.†Against max = 2455865.5497+ 0.055038E.‡Number of points used to determine the maximum.

No. ] Period Variations in SU UMa-Type Dwarf Novae IV 33
−100 0 100 200 300 400 500 600
−0.02
0.00
0.02(a)
865 870 875 880 885 890 89516
14
12
10 (b)
0 200 400 600 800 1000 1200
−0.02
0.00
0.02
0.04
(c)
Fig. 31. O−C diagram of superhumps in BW Scl (2011). (a) O−C. Filled circles and filled squares represent ordinary superhumpsand late-stage superhumps after the rapid fading. We used a period of 0.055036 d for calculating the O−C residuals. (b) Lightcurve. (c) O−C diagram of the entire observation. The global evolution of the O−C diagram is remarkably similar to those of GWLib and V455 And (Kato et al. 2009).

34 T. Kato et al. [Vol. ,
Table 39. Superhump maxima of BW Scl (2011). (contin-ued)
E max∗ error O−C† N ‡
111 55871.6557 0.0004 −0.0033 40112 55871.7096 0.0006 −0.0043 40123 55872.3150 0.0003 −0.0044 219124 55872.3748 0.0004 0.0004 237126 55872.4877 0.0014 0.0032 222127 55872.5363 0.0005 −0.0033 152128 55872.5938 0.0009 −0.0007 40129 55872.6470 0.0008 −0.0026 40130 55872.7023 0.0008 −0.0024 41140 55873.2540 0.0005 −0.0010 155141 55873.3079 0.0002 −0.0022 238142 55873.3626 0.0002 −0.0025 235143 55873.4179 0.0002 −0.0022 240144 55873.4718 0.0004 −0.0033 161145 55873.5282 0.0006 −0.0021 32146 55873.5822 0.0003 −0.0031 40147 55873.6364 0.0004 −0.0039 41148 55873.6916 0.0004 −0.0037 40152 55873.9127 0.0019 −0.0027 76153 55873.9670 0.0010 −0.0035 115154 55874.0217 0.0010 −0.0038 114158 55874.2507 0.0014 0.0050 133159 55874.2986 0.0002 −0.0021 238160 55874.3519 0.0004 −0.0039 235161 55874.4064 0.0003 −0.0044 237162 55874.4653 0.0004 −0.0006 237163 55874.5174 0.0004 −0.0035 232164 55874.5729 0.0004 −0.0030 40165 55874.6268 0.0007 −0.0042 40166 55874.6858 0.0007 −0.0003 40167 55874.7388 0.0005 −0.0022 32182 55875.5660 0.0007 −0.0006 40183 55875.6218 0.0010 0.0001 40184 55875.6762 0.0016 −0.0005 40185 55875.7297 0.0014 −0.0020 40207 55876.9523 0.0010 0.0097 60208 55877.0060 0.0005 0.0084 50209 55877.0583 0.0005 0.0057 100210 55877.1150 0.0008 0.0074 58218 55877.5496 0.0019 0.0016 24219 55877.6102 0.0026 0.0072 25220 55877.6578 0.0025 −0.0003 25∗BJD−2400000.†Against max = 2455865.5497+ 0.055038E.‡Number of points used to determine the maximum.
Table 40. Late-stage superhumps in BW Scl (2011).
E max∗ error O−C† N ‡
0 55878.5682 0.0018 0.0005 251 55878.6229 0.0020 0.0000 252 55878.6792 0.0016 0.0013 253 55878.7354 0.0013 0.0024 226 55878.9046 0.0013 0.0063 1069 55879.0664 0.0003 0.0028 8310 55879.1202 0.0006 0.0014 8417 55879.4966 0.0079 −0.0078 1218 55879.5597 0.0019 0.0002 1919 55879.6089 0.0020 −0.0058 2020 55879.6700 0.0016 0.0002 1921 55879.7182 0.0024 −0.0067 1927 55880.0462 0.0011 −0.0093 11028 55880.1026 0.0007 −0.0079 8635 55880.4947 0.0025 −0.0015 1038 55880.6570 0.0008 −0.0045 1939 55880.7171 0.0008 0.0005 1643 55880.9349 0.0024 −0.0021 6145 55881.0489 0.0004 0.0016 9749 55881.2693 0.0001 0.0016 39050 55881.3184 0.0002 −0.0044 47651 55881.3792 0.0002 0.0014 47454 55881.5417 0.0010 −0.0014 1855 55881.5971 0.0009 −0.0011 1956 55881.6483 0.0005 −0.0050 2057 55881.7031 0.0017 −0.0054 1962 55881.9812 0.0012 −0.0027 7672 55882.5419 0.0013 0.0070 2073 55882.5929 0.0008 0.0028 2074 55882.6502 0.0007 0.0051 2075 55882.7038 0.0004 0.0035 19100 55884.0747 0.0005 −0.0030 55108 55884.5163 0.0008 −0.0022 57109 55884.5752 0.0006 0.0016 59110 55884.6275 0.0005 −0.0013 58111 55884.6824 0.0010 −0.0014 58114 55884.8482 0.0011 −0.0009 41115 55884.9028 0.0005 −0.0014 38116 55884.9684 0.0014 0.0091 31117 55885.0094 0.0007 −0.0050 59118 55885.0703 0.0012 0.0008 37123 55885.3416 0.0004 −0.0034 127124 55885.4023 0.0006 0.0021 99126 55885.5076 0.0013 −0.0027 51127 55885.5614 0.0012 −0.0040 59140 55886.2831 0.0004 0.0014 110141 55886.3414 0.0004 0.0046 127142 55886.3942 0.0007 0.0023 39144 55886.5067 0.0004 0.0046 48145 55886.5594 0.0007 0.0022 59146 55886.6157 0.0006 0.0034 44163 55887.5493 0.0010 0.0003 59164 55887.5986 0.0009 −0.0055 59176 55888.2721 0.0003 0.0068 94177 55888.3224 0.0009 0.0020 127∗BJD−2400000.†Against max = 2455878.5677+ 0.055100E.‡Number of points used to determine the maximum.

No. ] Period Variations in SU UMa-Type Dwarf Novae IV 35
Table 40. Late-stage superhumps in BW Scl (2011). (con-tinued)
E max∗ error O−C† N ‡
178 55888.3753 0.0004 −0.0002 108181 55888.5423 0.0008 0.0015 59182 55888.5963 0.0008 0.0004 59199 55889.5340 0.0011 0.0014 58200 55889.5946 0.0013 0.0069 59217 55890.5255 0.0005 0.0012 58218 55890.5817 0.0006 0.0023 59231 55891.2933 0.0005 −0.0025 127232 55891.3512 0.0004 0.0003 127233 55891.4057 0.0004 −0.0003 127235 55891.5101 0.0017 −0.0061 56236 55891.5659 0.0008 −0.0054 59242 55891.8982 0.0013 −0.0037 55243 55891.9565 0.0010 −0.0005 68245 55892.0659 0.0007 −0.0012 22246 55892.1261 0.0013 0.0039 19264 55893.1127 0.0049 −0.0014 29272 55893.5538 0.0019 −0.0010 31273 55893.6157 0.0029 0.0057 24280 55893.9866 0.0026 −0.0091 27281 55894.0568 0.0046 0.0061 19285 55894.2767 0.0004 0.0055 104287 55894.3843 0.0004 0.0030 126288 55894.4320 0.0004 −0.0044 127303 55895.2698 0.0009 0.0068 90304 55895.3173 0.0005 −0.0008 127305 55895.3718 0.0019 −0.0014 127308 55895.5409 0.0023 0.0025 30309 55895.6012 0.0012 0.0077 30310 55895.6448 0.0043 −0.0038 30336 55897.0768 0.0027 −0.0045 31345 55897.5796 0.0010 0.0025 30353 55898.0220 0.0009 0.0041 22354 55898.0742 0.0013 0.0011 30355 55898.1331 0.0018 0.0050 20362 55898.5154 0.0024 0.0015 26363 55898.5645 0.0028 −0.0045 30364 55898.6223 0.0026 −0.0017 17372 55899.0623 0.0017 −0.0026 29373 55899.1255 0.0016 0.0056 28380 55899.5067 0.0012 0.0011 22381 55899.5630 0.0019 0.0022 30382 55899.6172 0.0011 0.0014 19400 55900.6020 0.0022 −0.0057 15417 55901.5496 0.0021 0.0053 20418 55901.5961 0.0017 −0.0033 16436 55902.5986 0.0028 0.0074 18471 55904.5193 0.0017 −0.0004 30473 55904.6377 0.0032 0.0078 19491 55905.6176 0.0019 −0.0041 15527 55907.5997 0.0029 −0.0056 16552 55908.9906 0.0015 0.0078 30553 55909.0312 0.0025 −0.0067 30594 55911.2995 0.0009 0.0025 126612 55912.2892 0.0012 0.0004 102∗BJD−2400000.†Against max = 2455878.5677+ 0.055100E.‡Number of points used to determine the maximum.
0.0530 0.0535 0.0540 0.0545 0.0550 0.0555 0.0560
0.7
0.8
0.9
1.0
(d)
θ
P=0.05431
−0.5 0.0 0.5 1.0 1.5
0.06
0.04
0.02
0.00
−0.02
−0.04
−0.06
Fig. 28. Early superhumps in BW Scl (2011). (Upper):PDM analysis. (Lower): Phase-averaged profile.
Table 40. Late-stage superhumps in BW Scl (2011). (con-tinued)
E max∗ error O−C† N ‡
613 55912.3463 0.0008 0.0024 126617 55912.5732 0.0044 0.0090 12685 55916.2978 0.0005 −0.0133 116726 55918.5678 0.0046 −0.0024 14885 55927.3339 0.0011 0.0029 126886 55927.3744 0.0019 −0.0117 105903 55928.3225 0.0003 −0.0003 85∗BJD−2400000.†Against max = 2455878.5677+ 0.055100E.‡Number of points used to determine the maximum.

36 T. Kato et al. [Vol. ,
0.0535 0.0540 0.0545 0.0550 0.0555 0.0560 0.0565
0.6
0.8
1.0
(d)
θ
P=0.05499
−0.5 0.0 0.5 1.0 1.5
0.05
0.00
−0.05
Fig. 29. Ordinary superhumps in BW Scl (2011). (Upper):PDM analysis. (Lower): Phase-averaged profile.
−0.5 0.0 0.5 1.0 1.5
0.05
0.00
−0.05
−0.10
Fig. 30. Averaged orbital profile of BW Scl (2011) after therapid decline.
3.33. CC Sculptoris
CC Scl was discovered as a ROSAT-selected CV(Schwope et al. 2000). During its 2000 October out-burst (the second known), Ishioka et al. (2001a) detectedlikely superhumps with a period of 0.078 d and ampli-tudes of ∼0.3 mag. However, Augusteijn et al. (2000,vsnet-campaign 544) reported the detection of a photo-metric period of 0.058 d, which was considered as beingthe orbital period. Based on the discrepancy between theapparent period of superhumps and the orbital period,Ishioka et al. (2001a) suggested that the object may bean intermediate polar. The unusual short duration of thesuperoutburst was also noted. The 0.058 d period waslater confirmed to be the orbital period (Chen et al. 2001;Tappert et al. 2004). Although there have been severaloutbursts since then, no confirmatory observations of su-perhumps have been reported.The 2011 superoutburst was detected by CRTS Siding
Spring Survey (SSS) and subsequent observations indi-cated the presence of low-amplitude (up to 0.1 mag) vari-ations similar to superhumps with a period of 0.0603 d(vsnet-alert 13832). Although the observed variationshad a definite underlying periodicity (vsnet-alert 13841,13846), individual waveforms were rather irregular (vsnet-alert 13840; see also actual observations in figure 34) un-like most of SU UMa-type dwarf novae. Even after theobject faded, the superhump signal persisted for at leasteight days.A PDM analysis yielded the stronger superhump signal
and weaker orbital signal (figure 32 upper). A lasso anal-ysis, which is less affected by aliasing, also indicated thepresence of both signals (figure 32 lower). We adopteda refined orbital period of 0.0585845(10) d. We decom-posed the observations into these two periodicities (figure33), and tried to reproduce the observed light curve bycombining these waves (figure 34). Although the resultwas not as remarkable as in OT J173516.9+154708, aswe will see later (subsection 3.78), a part of the complexstructure in the light curve appears to be understood asan effect of the orbital signal. We therefore subtracted theorbital variation and determined the time of superhumpmaxima (table 41). The relatively large scatter in theO−C residuals suggests the presence of irregularities notattributable to the orbital variation. Despite these irreg-ularities, the O−C residuals itself did not show a strongtrend of variation. Considering that the initial part of theoutburst was likely missed, we probably observed only thestage C superhumps. We listed the value in table 2 basedon this interpretation.The unusualbehavior of superhumps in this system, as
well as the strong presence of the orbital signal, mighthave led to a detection of a different period in (Ishiokaet al. 2001a). Such unusual behavior may be related to alikely high orbital inclination (Tappert et al. 2004). Theǫ, however, was 2.4%, a normal value for this Porb. Futuredense monitoring to detect the early stage of a superout-burst is desired.Woudt et al. (2012) recently established that this object

No. ] Period Variations in SU UMa-Type Dwarf Novae IV 37
0.050 0.055 0.060 0.065 0.070
0.90
0.95
1.00
(d)
θ
0.050 0.055 0.060 0.065 0.070
0.00
0.02
0.04
0.06
0.08
0.10
Fig. 32. Period analysis in CC Scl (2011). (Upper): PDManalysis. (Lower): lasso analysis (logλ=−5.05).
is an intermediate polar similar to HT Cam. CC Scl is anintriguing case since HT Cam has not yet shown superout-bursts (Ishioka et al. 2002). The unusual behavior of thesuperhumps in CC Scl may be related to the magnetismof the white dwarf.
3.34. V1208 Tauri
We observed the 2011 December superoutburst of thisobject. The initial part of the outburst was likely missed.The times of superhump maxima are listed in table 42.The O−C values were close to zero, which strengthensthe identification of these superhump to be stage C super-humps. It is likely both 2000 and 2002 observations (Katoet al. 2009) also recorded stage C superhumps, which wasnot labelled as such in table 2 of Kato et al. (2009).
3.35. V1212 Tauri
Although the object underwent a superoutburst in 2011January–February, it again underwent another superout-burst in September–October. The times of superhumpmaxima are listed in table 43. The period given in table 2was determined with the PDM method. The value of theperiod suggests that we observed either the very start ofstage B or stage C. The supercycle length of this objectis about 240 d.
Table 41. Superhump maxima of CC Scl (2011).
E max∗ error O−C† N ‡
0 55870.5914 0.0009 −0.0043 471 55870.6551 0.0040 −0.0006 482 55870.7078 0.0017 −0.0079 4815 55871.5040 0.0011 0.0082 3816 55871.5482 0.0011 −0.0077 3717 55871.6251 0.0014 0.0092 4418 55871.6732 0.0023 −0.0027 4432 55872.5019 0.0011 −0.0142 3633 55872.5826 0.0019 0.0065 4551 55873.6608 0.0014 0.0045 4452 55873.7157 0.0031 −0.0006 4466 55874.5598 0.0009 0.0033 4167 55874.6204 0.0020 0.0039 4469 55874.7376 0.0014 0.0011 3582 55875.5213 0.0034 0.0046 2283 55875.5765 0.0014 −0.0002 4384 55875.6400 0.0014 0.0033 4385 55875.7007 0.0037 0.0040 4399 55876.5243 0.0047 −0.0126 24100 55876.5904 0.0086 −0.0065 27117 55877.6246 0.0030 0.0076 28118 55877.6874 0.0060 0.0103 26119 55877.7551 0.0023 0.0181 14133 55878.5726 0.0013 −0.0046 27134 55878.6307 0.0027 −0.0065 27149 55879.5368 0.0016 −0.0006 20150 55879.5937 0.0048 −0.0037 21151 55879.6535 0.0029 −0.0040 21152 55879.7095 0.0011 −0.0080 20∗BJD−2400000.†Against max = 2455870.5957+ 0.060012E.‡Number of points used to determine the maximum.
Table 42. Superhump maxima of V1208 Tau (2011).
E max∗ error O−C† N ‡
0 55919.4074 0.0007 0.0021 751 55919.4775 0.0008 0.0016 549 55920.0347 0.0008 −0.0050 7510 55920.1086 0.0006 −0.0015 5834 55921.8064 0.0009 0.0047 7335 55921.8728 0.0007 0.0006 7348 55922.7901 0.0007 0.0017 7349 55922.8548 0.0012 −0.0041 73∗BJD−2400000.†Against max = 2455919.4054+ 0.070481E.‡Number of points used to determine the maximum.

38 T. Kato et al. [Vol. ,
−0.5 0.0 0.5 1.0 1.5
0.1
0.0
−0.1 P=0.05858
−0.5 0.0 0.5 1.0 1.5
0.1
0.0
−0.1
P=0.06003
Fig. 33. Profiles of two periodicities in CC Scl (2011).(Upper) orbital variation. (Lower) superhump.
Table 43. Superhump maxima of V1212 Tau (2011b).
E max∗ error O−C† N ‡
0 55834.4345 0.0034 −0.0001 211 55834.5065 0.0016 0.0021 632 55834.5735 0.0008 −0.0005 1073 55834.6423 0.0010 −0.0016 9015 55835.4805 0.0017 −0.0001 2916 55835.5497 0.0019 −0.0006 6617 55835.6201 0.0010 0.0000 3518 55835.6906 0.0019 0.0008 19∗BJD−2400000.†Against max = 2455834.4346+ 0.069731E.‡Number of points used to determine the maximum.
70.40 70.45 70.50 70.55 70.60 70.65 70.70 70.75
0.2
0.0
−0.2
71.40 71.45 71.50 71.55 71.60 71.65 71.70 71.75
0.2
0.0
−0.2
72.40 72.45 72.50 72.55 72.60 72.65 72.70 72.75
0.2
0.0
−0.2
73.40 73.45 73.50 73.55 73.60 73.65 73.70 73.75
0.2
0.0
−0.2
Fig. 34. Synthesized light curve of CC Scl (2011). Thepoints represent observations. The curves represent the ex-pected light curve by adding two waves in figure 33.
3.36. DI Ursae Majoris
Since online data for Rutkowski et al. (2009) are avail-able, we extracted times of superhump maxima for twosuperoutbursts in 2007 using our method (tables 44 and45). The resultant values of Pdot were not very differentfrom the analysis by Rutkowski et al. (2009). Although welisted times of maxima before the superoutburst (E ≤ 2)and after the superoutburst (E ≥ 216) for the first super-outburst, these maxima may not be equivalent to stageA and C superhumps in other SU UMa-type dwarf no-vae. Although there may be either a discontinuous periodchange or a phase shift between E = 182 and E = 216,we could not make a distinction from the available data.The second superoutburst was less observed and the re-sultant Pdot was less reliable. We have also analyzedthe entire 2007 light curve to determine the orbital pe-riod. We detected a strong signal with a period of0.0545665(8) d. This period is closer to the spectroscopicperiod of 0.054564(2) d obtained by Thorstensen et al.(2002b) than the one obtained by Rutkowski et al. (2009)and it likely represents the correct orbital period. Theǫ for the better determined first superoutburst was 1.4%,

No. ] Period Variations in SU UMa-Type Dwarf Novae IV 39
Table 44. Superhump maxima of DI UMa (2007).
E max∗ error O−C† N ‡
0 54204.3594 0.0028 −0.0185 201 54204.4108 0.0015 −0.0224 242 54204.4641 0.0011 −0.0244 4418 54205.3793 0.0007 0.0070 2019 54205.4336 0.0005 0.0061 2520 54205.4894 0.0009 0.0066 3535 54206.3165 0.0003 0.0050 3936 54206.3715 0.0002 0.0048 3737 54206.4246 0.0003 0.0027 3953 54207.3080 0.0006 0.0022 7954 54207.3630 0.0003 0.0020 10255 54207.4200 0.0003 0.0037 6956 54207.4745 0.0003 0.0030 6757 54207.5293 0.0003 0.0025 6671 54208.3073 0.0005 0.0072 4072 54208.3535 0.0014 −0.0020 3291 54209.4102 0.0013 0.0051 20127 54211.4019 0.0010 0.0081 28128 54211.4583 0.0016 0.0093 16143 54212.2886 0.0020 0.0110 18144 54212.3452 0.0008 0.0123 28182 54214.4491 0.0010 0.0170 31216 54216.3046 0.0006 −0.0058 39217 54216.3615 0.0005 −0.0042 46218 54216.4143 0.0009 −0.0065 28219 54216.4696 0.0005 −0.0065 24235 54217.3548 0.0018 −0.0052 11236 54217.3952 0.0035 −0.0200 11∗BJD−2400000.†Against max = 2454204.3779+ 0.055243E.‡Number of points used to determine the maximum.
and there was no need to modify the ǫ by Rutkowski et al.(2009). This ǫ is fairly common for such short-Porb objectsand we cannot discriminate DI UMa from other SU UMa-type dwarf novae by ǫ only.
3.37. IY Ursae Majoris
We observed a superoutburst in 2011 June. Only twosuperhump maxima were recorded: BJD 2455717.0312(4)(N = 60) and BJD 2455718.0930(17) (N = 68).
3.38. KS Ursae Majoris
We observed a superoutburst in 2012May. Only two su-perhump maxima were recorded: BJD 2456052.0468(13)(N = 52) and BJD 2456052.1159(18) (N = 50).
3.39. MR Ursae Majoris
The times of superhump maxima during the 2012 su-peroutburst are listed in table 46. Only the late stage ofthe outburst was observed and we recorded typical stageC superhumps. A comparison of O−C diagrams betweendifferent superoutbursts is shown in figure 35.
Table 45. Superhump maxima of DI UMa (2007b).
E max∗ error O−C† N ‡
0 54237.4668 0.0002 0.0044 2916 54238.3514 0.0005 0.0035 3617 54238.4042 0.0003 0.0009 3918 54238.4571 0.0006 −0.0015 4134 54239.3435 0.0003 −0.0005 3335 54239.3951 0.0005 −0.0043 3336 54239.4538 0.0004 −0.0009 3071 54241.3914 0.0008 −0.0002 2289 54242.3861 0.0008 −0.0016 2990 54242.4357 0.0016 −0.0074 28107 54243.3918 0.0007 0.0079 19108 54243.4289 0.0018 −0.0103 26126 54244.4451 0.0016 0.0098 27∗BJD−2400000.†Against max = 2454237.4624+ 0.055340E.‡Number of points used to determine the maximum.
0 20 40 60 80 100 120 140 160 180
−0.04
−0.02
0.00
20022003200720102012
Fig. 35. Comparison of O−C diagrams of MR UMa betweendifferent superoutbursts. A period of 0.06512 d was used todraw this figure. Approximate cycle counts (E) after the startof the 2007 superoutburst were used. Since the starts of theother superoutbursts were not well constrained, we shifted theO−C diagrams to best fit the 2007 one.

40 T. Kato et al. [Vol. ,
Table 46. Superhump maxima of MR UMa (2012).
E max∗ error O−C† N ‡
0 56094.3735 0.0005 0.0019 1291 56094.4353 0.0006 −0.0011 13516 56095.4070 0.0008 −0.0006 12417 56095.4713 0.0010 −0.0010 13131 56096.3792 0.0009 0.0004 13332 56096.4438 0.0010 0.0003 13447 56097.4144 0.0012 −0.0003 13348 56097.4799 0.0020 0.0004 104∗BJD−2400000.†Against max = 2456094.3716+ 0.064746E.‡Number of points used to determine the maximum.
3.40. PU Ursae Majoris
PU UMa (=SDSS J090103.93+480911.1) is a deeplyeclipsing CV below the period gap (Dillon et al. 2008),which was originally discovered by Szkody et al. (2003).Three past outbursts had been recorded before 2012: 2007October (likely normal outburst), 2009 May (superout-burst; although superhumps were detected, the durationof the observation was insufficient to determine the pe-riod) and 2009 December (likely normal outburst).The 2012 outburst was detected by J. Shears (BAAVSS
alert 2830). Subsequent observations detected develop-ing superhumps and eclipses (vsnet-alert 14201, 14214,14215). The times of recorded eclipses were determinedwith the Kwee and van Woerden (KW) method (Kwee,van Woerden 1956; modified by the author, see appendix1), after removing linearly approximated trends aroundeclipses in order to minimize the effect of superhumps,and are summarized in table 47. We obtained an updatedephemeris of
Min(BJD) = 2453773.4875(3)+ 0.07788054(1)E. (2)
The times of superhump maxima outside the eclipsesare listed in table 48. Except E = 0 (stage A), there is ahint of a stage B–C transition around E=48. The overallpattern is similar to relatively long Porb-systems such asEG Aqr (Imada et al. 2008b) and NSV 4838 (Imada et al.2009).The ǫ for stage B and C superhumps were 4.1% and
3.7%, respectively, and is slightly larger than typical val-ues of SU UMa-type dwarf novae with these Porb. A meanprofile of stage B superhumps is shown in figure 36. Shearset al. (2012a) also reported observations of the same su-peroutburst, although they did not distinguish stage Band C superhumps.
3.41. SS Ursae Minoris
Olech et al. (2006) reported observations of the 2004 su-peroutburst and obtained a mean period of 0.070149(16) dwith a negative (global) Pdot. We observed the late stageof a superoutburst in 2012 March. As in Olech et al.(2006), the the main peak of the superhump was alreadydiminishing and the secondary maximum was developing.
0.078 0.080 0.082 0.084
0.6
0.8
1.0
(d)
θ
P=0.08129
−0.5 0.0 0.5 1.0 1.5
0.2
0.0
−0.2
Fig. 36. Stage B superhumps in PU UMa (2012). (Upper):PDM analysis. (Lower): Phase-averaged profile.
Table 47. Eclipse minima of PU UMa (2012).
E Minimum∗ error O−C†
28068 55959.43896 0.00006 0.0001928069 55959.51692 0.00003 0.0002728080 55960.37350 0.00005 0.0001728081 55960.45131 0.00006 0.0001028092 55961.30786 0.00002 -0.0000428093 55961.38604 0.00004 0.0002628110 55962.70976 0.00004 0.0000128111 55962.78746 0.00004 -0.0001728112 55962.86561 0.00003 0.0000928118 55963.33222 0.00004 -0.0005828119 55963.41032 0.00005 -0.0003628173 55967.61633 0.00003 0.00010∗BJD−2400000.†Against equation 2.

No. ] Period Variations in SU UMa-Type Dwarf Novae IV 41
Table 48. Superhump maxima of PU UMa (2012).
E max∗ error O−C† phase‡ N §
0 55959.4659 0.0007 −0.0331 0.13 18311 55960.3880 0.0009 −0.0029 0.16 12312 55960.4712 0.0008 −0.0007 0.18 10122 55961.2845 0.0012 0.0019 0.54 6323 55961.3685 0.0006 0.0049 0.17 23924 55961.4507 0.0015 0.0060 0.30 7735 55962.3444 0.0011 0.0079 0.46 3436 55962.4242 0.0011 0.0067 0.55 3540 55962.7460 0.0005 0.0042 0.18 13241 55962.8265 0.0008 0.0036 0.30 11547 55963.3178 0.0014 0.0085 0.41 6748 55963.3998 0.0011 0.0094 0.30 6983 55966.2293 0.0045 0.0015 0.41 2884 55966.3101 0.0015 0.0013 0.33 40100 55967.5984 0.0006 −0.0076 0.19 96121 55969.2966 0.0039 −0.0118 0.68 132∗BJD−2400000.†Against max = 2455959.4991+ 0.081068E.‡Orbital phase.§Number of points used to determine the maximum.
Table 49. Superhump maxima of SS UMi (2012).
E max∗ error O−C† N ‡
0 56009.5129 0.0007 0.0029 531 56009.5786 0.0009 −0.0017 532 56009.6468 0.0014 −0.0039 505 56009.8662 0.0043 0.0044 806 56009.9295 0.0014 −0.0026 807 56010.0062 0.0020 0.0037 5415 56010.5616 0.0015 −0.0038 5233 56011.8328 0.0053 0.0010 80∗BJD−2400000.†Against max = 2456009.5100+ 0.070358E.‡Number of points used to determine the maximum.
We list times of maxima of these humps in table 49. Atthis and following stages, the secondary humps were thedominant signal, which are listed in table 50. These sec-ondary humps persisted during the quiescent state fol-lowing the superoutburst, and the behavior is similar tothe late stage of VW Hyi (subsection 3.22) and V344 Lyr(Kato et al. 2012a; Wood et al. 2011). Since SS UMiis considered to have a high mass-transfer rate compa-rable to ER UMa stars (Kato et al. 2000a; Olech et al.2006), these secondary humps are possibly “traditional”late superhumps arising from the stream impact point.The signal became less convincing after the next normaloutburst. A period analysis of the entire observation (BJD2456007–2456038) yielded a photometric orbital period of0.067855(7) d, which is slightly longer than the spectro-scopic period of 0.06778(4) d in Thorstensen et al. (1996).
Table 50. Superhump maxima of SS UMi (2012) (secondaryhumps).
E max∗ error O−C† N ‡
0 56009.5410 0.0012 −0.0003 521 56009.6083 0.0007 −0.0029 524 56009.8206 0.0009 −0.0004 805 56009.8899 0.0010 −0.0010 796 56009.9611 0.0006 0.0002 8014 56010.5134 0.0007 −0.0070 5315 56010.5876 0.0009 −0.0028 5216 56010.6528 0.0010 −0.0075 5018 56010.7969 0.0006 −0.0033 7119 56010.8669 0.0006 −0.0032 7920 56010.9348 0.0009 −0.0053 7928 56011.4990 0.0009 −0.0006 5229 56011.5696 0.0016 0.0000 8630 56011.6398 0.0005 0.0003 7433 56011.8523 0.0006 0.0030 7934 56011.9197 0.0008 0.0004 7935 56011.9931 0.0006 0.0039 6942 56012.4833 0.0011 0.0044 5243 56012.5527 0.0009 0.0039 6444 56012.6247 0.0004 0.0059 10445 56012.6965 0.0045 0.0078 4856 56013.4677 0.0006 0.0097 5357 56013.5267 0.0027 −0.0013 2758 56013.6075 0.0015 0.0096 5359 56013.6717 0.0011 0.0038 3671 56014.5123 0.0012 0.0051 2172 56014.5843 0.0008 0.0071 2773 56014.6504 0.0011 0.0033 3478 56014.9951 0.0015 −0.0017 4685 56015.4873 0.0017 0.0009 2786 56015.5525 0.0007 −0.0038 5387 56015.6182 0.0014 −0.0081 5388 56015.6914 0.0027 −0.0048 1892 56015.9750 0.0008 −0.0010 52100 56016.5337 0.0012 −0.0019 20101 56016.5996 0.0009 −0.0059 28102 56016.6762 0.0012 0.0008 27106 56016.9480 0.0006 −0.0072 55∗BJD−2400000.†Against max = 2456009.5412+ 0.069943E.‡Number of points used to determine the maximum.

42 T. Kato et al. [Vol. ,
0.063 0.064 0.065 0.066 0.067 0.068 0.069
0.6
0.7
0.8
0.9
1.0
(d)
θ
P=0.06582
−0.5 0.0 0.5 1.0 1.5
0.05
0.00
−0.05
−0.10
Fig. 37. Superhumps in 1RXS J231935 (2011). (Upper):PDM analysis. (Lower): Phase-averaged profile.
3.42. 1RXS J231935.0+364705
This object (hereafter 1RXS J231935) was selectedas a variable star, likely a dwarf nova, during thecourse of identification of the ROSAT sources (Denisenko,Sokolovsky 2011). The two previously known outburstsoccurred in 2009 November and 2010 December, andboth appear to be normal outbursts (H. Maehara de-tected no superhumps during the 2009 outburst). The2011 September outburst was detected by E. Muyllaert(BAAVSS alert 2710). Subsequent observations confirmedthe presence of superhumps (vsnet-alert 13711, 13712,13719; figure 37). The times of superhump maxima arelisted in table 51. The O−C diagram clearly shows thefamiliar pattern of stages B and C. The Pdot for stage Bsuperhumps was large [+11.6(1.7)× 10−5], typical for anobject with this PSH.
3.43. ASAS J224349+0809.5
The 2011 June outburst of this object (hereafter ASASJ224349) was detected by Y. Maeda at a visual magni-tude of 13.2 (vsnet-alert 13458). Due to the unfavorableseasonal condition, we obtained only two superhump max-ima: BJD 2455740.6014(5) (N=40) and 2455741.5730(5)(N=49).
Table 51. Superhump maxima of 1RXS J231935.
E max∗ error O−C† N ‡
0 55835.4280 0.0003 −0.0040 651 55835.4930 0.0003 −0.0048 682 55835.5596 0.0002 −0.0039 1023 55835.6240 0.0002 −0.0052 2034 55835.6920 0.0004 −0.0030 8414 55836.3491 0.0004 −0.0035 4915 55836.4142 0.0003 −0.0042 21316 55836.4793 0.0002 −0.0049 36217 55836.5457 0.0002 −0.0043 38918 55836.6113 0.0002 −0.0044 21719 55836.6764 0.0003 −0.0051 13229 55837.3357 0.0003 −0.0035 15730 55837.4024 0.0002 −0.0025 16931 55837.4658 0.0002 −0.0049 25032 55837.5312 0.0003 −0.0052 26733 55837.5978 0.0002 −0.0044 26734 55837.6649 0.0005 −0.0031 9344 55838.3270 0.0007 0.0014 8645 55838.3920 0.0006 0.0006 12646 55838.4587 0.0006 0.0015 12547 55838.5220 0.0038 −0.0009 4156 55839.1186 0.0011 0.0038 9457 55839.1859 0.0006 0.0054 12359 55839.3162 0.0006 0.0041 9860 55839.3808 0.0007 0.0030 11661 55839.4481 0.0006 0.0045 12162 55839.5133 0.0006 0.0039 8563 55839.5871 0.0025 0.0120 7764 55839.6491 0.0015 0.0082 4175 55840.3753 0.0005 0.0110 5176 55840.4449 0.0014 0.0149 5077 55840.5081 0.0007 0.0123 5778 55840.5728 0.0006 0.0112 5779 55840.6379 0.0006 0.0106 44102 55842.1444 0.0006 0.0045 112103 55842.2125 0.0005 0.0068 119104 55842.2761 0.0008 0.0047 66118 55843.1927 0.0005 0.0005 95140 55844.6357 0.0010 −0.0033 31141 55844.7006 0.0011 −0.0041 31142 55844.7650 0.0008 −0.0054 36143 55844.8324 0.0009 −0.0038 33144 55844.8970 0.0009 −0.0050 35153 55845.4853 0.0036 −0.0086 54154 55845.5512 0.0010 −0.0084 59155 55845.6205 0.0010 −0.0049 83157 55845.7555 0.0039 −0.0014 34159 55845.8803 0.0010 −0.0081 28∗BJD−2400000.†Against max = 2455835.4320+ 0.065764E.‡Number of points used to determine the maximum.

No. ] Period Variations in SU UMa-Type Dwarf Novae IV 43
0.086 0.088 0.090 0.092 0.094 0.096 0.098
0.2
0.4
0.6
0.8
1.0
(d)
θ
P=0.09116
−0.5 0.0 0.5 1.0 1.5
0.05
0.00
−0.05
−0.10
Fig. 38. Superhumps in DDE 19 (2011). (Upper): PDManalysis. (Lower): Phase-averaged profile.
3.44. DDE 19
DDE 19 is a CV discovered by D. Denisenko.5 The ob-ject is located at 00h38m37.s40, +79◦21′37.′′5 (J2000.0).During its outburst in 2011 November, superhumps weredetected (vsnet-alert 13886, 13890; figure 38). The timesof superhump maxima are listed in table 52. The objectfaded quickly after these observations, and we only ob-served the late stage of this superoutburst. We attributedthe superhumps to stage C superhumps in table 2.
3.45. MASTER OT J072948.66+593824.4
This object (hereafter MASTER J072948) is a tran-sient detected at an unfiltered CCD magnitude of 13.3on 2012 February 17 (Balanutsa et al. 2012c; see alsovsnet-alert 14249). Although subsequent observations de-tected superhump-like modulations (vsnet-alert 14252),their waveform was rather irregular and the variation didnot appear to be expressed by a single period (vsnet-alert14253, 14258, 14263). The observed maxima could notbe expressed by any single period, and there was likely asuperposition of two close periods (vsnet-alert 14265).PDM and lasso analysis (see subsection 3.78 for the ap-
plication of lasso and separation of two signals) is shownin figure 39. The lasso analysis favored the co-existence
5 <http://hea.iki.rssi.ru/∼denis/VarDDE.html>
Table 52. Superhump maxima of DDE 19 (2011).
E max∗ error O−C† N ‡
0 55888.6444 0.0004 0.0018 972 55888.8256 0.0004 0.0006 9611 55889.6458 0.0009 −0.0001 8712 55889.7356 0.0008 −0.0014 9613 55889.8258 0.0006 −0.0025 9633 55891.6541 0.0007 0.0017 9634 55891.7445 0.0013 0.0008 9635 55891.8339 0.0010 −0.0010 96∗BJD−2400000.†Against max = 2455888.6425+ 0.091210E.‡Number of points used to determine the maximum.
of two periods 0.06416(4) d and 0.06625(4) d. A periodof 0.06208(3) d, a one-day alias of the 0.06625-d period,cannot be excluded instead of the 0.06625-d period. Themean profiles of these signals are shown in figure 40. Whilethe 0.06416-d signal resembles a profile of superhumps(faster rise, sharper maximum), the other signal has asharper minimum. A combination of these signals partlyreproduced the actual light curve during the plateau phase(figure 41). Based on the profile, we may identify the0.06416-d signal as superhumps. We might then interpretthat the 0.06625-d period is the orbital period, and the0.06416-d signal is 3.2% shorter than Porb. Although neg-ative superhumps are unexpected in ordinary SU UMa-type dwarf novae, this interpretation might explain whythe profile of superhumps was so unstable (as in ER UMa,cf. Ohshima et al. 2012), and why the orbital signal is sostrongly visible in a non-eclipsing system. Since the ob-ject started rapidly fading only three days after the startof our observation, the baseline for period analysis wasinsufficient to distinguish other possible periods or inter-pretations. Future observations in quiescence and in su-peroutbursts are absolutely needed.
3.46. MASTER OT J174305.70+231107.8
This object (hereafter MASTER J174305) is a tran-sient detected at an unfiltered CCD magnitude of 15.6on 2012 April 5 (Balanutsa et al. 2012a). Subsequentobservations detected superhumps (vsnet-alert 14428; fig-ure 42). Two superhump maxima were recorded: BJD2456027.8604(12) (N = 79) and BJD 2456027.9281(9)(N = 82). The superhump period by the PDM methodwas 0.0670(5) d.
3.47. MASTER OT J182201.93+324906.7
This object (hereafter MASTER J182201) is a tran-sient detected at an unfiltered CCD magnitude of 15.4on 2012 April 29 (Balanutsa et al. 2012b). Subsequentobservations detected superhumps (vsnet-alert 14529; fig-ure 43). Two superhump maxima were recorded: BJD2456050.4464(6) (N = 33) and 2456050.5081(4) (N =33). The superhump period by the PDM method was0.0618(2) d (figure 43).

44 T. Kato et al. [Vol. ,
0.060 0.062 0.064 0.066 0.068 0.0700.80
0.85
0.90
0.95
1.00
(d)
θ
0.060 0.062 0.064 0.066 0.068 0.070
0.000
0.001
0.002
0.003
Fig. 39. Period analysis in MASTER J072948 (2012).(Upper): PDM analysis. The lower curve at the bot-tom indicates the window function. (Lower): lasso analysis(logλ=−4.34).
3.48. MisV 1446
MisV 1446 was detected as a transient by the MISAOproject, and it could be probably identified with the X-raysource 1RXS J074112.2−094529 (vsnet-alert 14080). Thecoordinates of the object are 07h41m12.s70, −09◦45′55.′′9.Multicolor photometry by H. Sato was consistent withthat of a color of a dwarf nova in outburst (vsnet-alert14085). Subsequent observations recorded superhumps(vsnet-alert 14096, 14102, 14104; figure 44). The timesof superhump maxima are listed in table 53. It appearsthat the observations recorded the late stage of a super-outburst, and that late part of stage B and stage C wererecorded. It was impossible to measure Pdot for stage B.
3.49. SBS 1108+574
This object (hereafter SBS 1108) was originally se-lected as an ultraviolet-excess object during the course ofthe Second Byurakan Survey (SBS, Markarian, Stepanian1983). An outburst of this object was detected by CRTSon 2012 April 22 (=CSS120422:111127+571239). Thevery blue color (u − g = −0.3) in quiescence was verynotable (vsnet-alert 14475, 14483). Subsequent observa-
−0.5 0.0 0.5 1.0 1.5
0.05
0.00
−0.05
−0.10
P=0.06414
−0.5 0.0 0.5 1.0 1.5
0.05
0.00
−0.05
−0.10
P=0.06625
Fig. 40. Profiles of two periodicities in MASTER J072948(2012).
tions clarified that this object is an ultra-short period SUUMa-type dwarf nova showing superhumps (vsnet-alert14480, 14484, 14493; figure 45). Although it was not ini-tially clear whether this object belongs to AM CVn-typeobjects or hydrogen-rich objects, spectroscopic observa-tion (Garnavich et al. 2012) confirmed that the object ishydrogen-rich.The times of superhump maxima are listed in table 54.
Although the epoch of the start of the outburst is un-known, the O −C variation was very similar to that ofordinary short-Porb SU UMa-type dwarf novae: consist-ing of stage B with a longer PSH and a positive Pdot andstage C with a shorter PSH with a relatively constant pe-riod (figure 46). The amplitudes of superhumps becamesmaller near the end of stage B as in ordinary short-Porb
SU UMa-type dwarf novae (Kato et al. 2012a) and becamelarger at the start of stage C (figure 47). The object alsoslightly brightened after the stage B–C transition (figure46). This feature is commonly seen in objects with distinctstage B–C transitions (cf. Kato et al. 2003b; Kato et al.2012a). The transition from stage B to C was abrupt, as inordinary short-Porb SU UMa-type dwarf novae. The stageC superhumps persisted after the rapid decline without aphase shift.

No. ] Period Variations in SU UMa-Type Dwarf Novae IV 45
76.2 76.4 76.6 76.8 77.00.4
0.2
0.0
−0.2
−0.4
77.2 77.4 77.6 77.8 78.00.4
0.2
0.0
−0.2
−0.4
78.2 78.4 78.6 78.8 79.00.4
0.2
0.0
−0.2
−0.4
Fig. 41. Synthesized light curve of MASTER J072948(2011). The points represent observations. The curves repre-sent the expected light curve by adding two waves in figure40
.
In addition to superhumps, we detected a stable periodof 0.038449(6) d, which we identified to be the orbital pe-riod (figure 48). The ǫ for stage B and C superhumpswere 1.74(2)% and 1.11(2)%, respectively. By applyingthe ǫ–q relation in Kato et al. (2009) to the ǫ of stage Csuperhumps, we obtained q = 0.06. The ǫ or q is largerthan those of many extreme WZ Sge-type dwarf novae,and this implies that the secondary is denser, or moremassive, than in ordinary dwarf novae. The estimatedvolume radii of the Roche lobe of the secondary is locatedbelow the theoretical radius of a brown dwarf when we as-sume a typical mass (0.7 M⊙) for a white dwarf in a dwarfnova (figure 49). Only with a massive (≥1.0 M⊙) whitedwarf, the secondary can be a normal lower main-sequencestar. Since sustained nuclear burning is not expected fora brown dwarf, this finding suggests that this secondaryis a somewhat evolved star whose hydrogen envelope wasmostly stripped during the mass-exchange. The spectrumtaken in quiescence (Pavlenko et al. in preparation) show-ing the enhanced abundance of helium is consistent withthis interpretation. The object may be analogous to OTJ112253.3−111037 (= CSS100603:112253−111037) (Katoet al. 2010; Breedt et al. 2012; note also the unusual u−gcolor mentioned in Kato et al. 2012b). Further detailedradial-velocity study would enable to clarify the nature ofthis binary.
0.055 0.060 0.065 0.070 0.075 0.080
0.6
0.8
1.0
(d)
θ
P=0.0670
−0.5 0.0 0.5 1.0 1.5
0.1
0.0
−0.1
Fig. 42. Superhumps in MASTER J174305 (2012). (Upper):PDM analysis. (Lower): Phase-averaged profile.
3.50. SDSS J073208.11+413008.7
We observed the 2012 superoutburst of this object(hereafter SDSS J073208; the object was selected by Wilset al. 2010, see a comment in Kato et al. 2010). The timesof superhump maxima are listed in table 55. The periodlisted in table 2 was determined by the PDM method.This period appears to be a global average of stage B andC superhumps.
3.51. SDSS J080303.90+251627.0
This object (hereafter SDSS J080303) was discovered asa CV during the course of the SDSS (Szkody et al. 2005).Szkody et al. (2005) identified a spectroscopic period of0.071 d. The object showed multiple outbursts in theCRTS data. The 2011 outburst was detected by J. Shears(BAAVSS alert 2806). The detection was sufficiently earlyto observe the early evolution of superhumps (vsnet-alert14006, 14015, 14033). The object showed large variationof the superhump period (vsnet-alert 14063). The meansuperhump profile is shown in figure 50.The times of superhump maxima are listed in table 56.
The initial stage A with growing superhumps is immedi-ately recognizable. We considered E =27–31 to be stageB–C transition and listed the period according to theseidentifications in table 2.

46 T. Kato et al. [Vol. ,
0.045 0.050 0.055 0.060 0.065 0.070 0.075 0.080
0.0
0.5
1.0
(d)
θ
P=0.06180
−0.5 0.0 0.5 1.0 1.50.10
0.05
0.00
−0.05
−0.10
−0.15
Fig. 43. Superhumps in MASTER J182201 (2012). (Upper):PDM analysis. (Lower): Phase-averaged profile.
The large negative Pdot [global value of −79(8)× 10−5]and the long PSH resemble those of MN Dra (Pavlenkoet al. 2010b).
3.52. SDSS J165359.06+201010.4
We observed a superoutburst in 2012 May of this SUUMa-type dwarf nova (hereafter SDSS J165359). Thetimes of superhumps are listed in table 57. Since the ob-ject faded rapidly after our final observation, the super-humps recorded on the last three nights were most likelystage C superhumps. Although the identification of thestage of earlier observations was unclear due to the longgap in the observation, a comparison of the O−C diagramwith the 2010 superoutburst suggests that we observed theearlier stage of stage B (figure 51).
3.53. SDSS J170213.26+322954.1
This object (hereafter SDSS J170213) is an eclipsingSU UMa-type dwarf nova in the period gap (Boyd et al.2006; Littlefair et al. 2006). Boyd et al. (2006) reportedan analysis of the 2005 superoutburst. Kato et al. (2009)analyzed their data and concluded that this object showedincrease in the PSH during the middle-to-late stage of a su-peroutburst, contrary to most SU UMa-type dwarf novaewith similar PSH.
0.075 0.076 0.077 0.078 0.079 0.080 0.081
0.96
0.97
0.98
0.99
1.00
(d)
θ
P=0.07793
−0.5 0.0 0.5 1.0 1.5
0.05
0.00
−0.05
−0.10
Fig. 44. Superhumps in MisV 1446 (2012). (Upper): PDManalysis. (Lower): Phase-averaged profile.
The 2011 superoutburst by detected by G. Poyner withan unfiltered CCD magnitude of 13.93 (vsnet-outburst13058). Subsequent observations confirmed the presenceof superhumps and eclipses (vsnet-alert 13524, 13526,13528, 13532). The times of recorded eclipses, determinedwith the KW method, after removing linearly approxi-mated trends around eclipses in order to minimize theeffect of superhumps, are summarized in table 58. Weobtained an updated ephemeris of
Min(BJD)=2453648.23651(31)+0.100082207(15)E.(3)
The times of superhump maxima determined outsidethe eclipses are listed in table 59. There were clear stageA (E ≤ 32) and stage B with a positive Pdot. There wasno indication of a transition to stage C despite that theobservation covered the early stage of the rapid decline.The large positive Pdot confirmed the 2005 results, and assuggested in Kato et al. (2009), this object mimics a short-Porb system both in O−C variation and stage transitions.The ǫ = 6.0% is, however, much larger than those in sys-tems with short-Porb. This object appears to have rela-tively infrequent outbursts [the only known outbursts havebeen in 2005 September–October (superoutburst), 2006July (normal outburst), 2007 September (superoutburst),2009 February (normal outburst), 2009 October (super-

No. ] Period Variations in SU UMa-Type Dwarf Novae IV 47
Table 53. Superhump maxima of MisV 1446 (2012).
E max∗ error O−C† N ‡
0 55938.0155 0.0031 −0.0006 1341 55938.0949 0.0006 0.0010 2072 55938.1682 0.0005 −0.0034 3123 55938.2450 0.0006 −0.0044 2814 55938.3233 0.0006 −0.0040 2795 55938.4019 0.0015 −0.0031 11313 55939.0278 0.0012 0.0003 17814 55939.1040 0.0007 −0.0013 28715 55939.1822 0.0007 −0.0009 15816 55939.2639 0.0012 0.0030 15517 55939.3371 0.0008 −0.0016 12426 55940.0351 0.0031 −0.0038 13827 55940.1209 0.0010 0.0042 10835 55940.7515 0.0016 0.0123 8136 55940.8206 0.0008 0.0035 6737 55940.9001 0.0009 0.0053 8240 55941.1329 0.0011 0.0046 22541 55941.2098 0.0012 0.0038 15742 55941.2873 0.0010 0.0034 15544 55941.4427 0.0006 0.0032 30145 55941.5184 0.0007 0.0011 40748 55941.7484 0.0104 −0.0023 1849 55941.8340 0.0123 0.0055 1056 55942.3688 0.0037 −0.0043 19157 55942.4462 0.0025 −0.0047 40858 55942.5173 0.0010 −0.0114 33669 55943.3793 0.0014 −0.0053 31∗BJD−2400000.†Against max = 2455938.0160+ 0.077806E.‡Number of points used to determine the maximum.
outburst), and 2011 July (superoutburst)] and probablyindeed resembles EF Peg (cf. Howell et al. 1993; Kato2002b) as proposed in Kato et al. (2009), rather than anunusual system with a large Pdot, GX Cas (Kato et al.2012a). The behavior of O−C variation was similar be-tween 2005 and 2011 outbursts (figure 52). It is notewor-thy that stage A lasted much longer than in other systems.
3.54. SDSS J172102.48+273301.2
This object (hereafter SDSS J172102) was originally se-lected as a helium CV using the SDSS colors and con-firmed by spectroscopy (Rau et al. 2010). Although therehad been no record of outbursts, CRTS detected this ob-ject in outburst on 2012 June 8 at an unfiltered CCDmagnitude of 16.4 (CSS120608:172102+273301). A quickfollow-up observation confirmed the presence of super-humps on June 9 (vsnet-alert 14653). A retrospectivestudy indicated that the object was recorded at unfilteredCCD magnitudes of 16.0–16.2 on June 5 at MASTER-Kislovodsk (vsnet-alert 14657). The object rapidly fadedto 18.9 on June 11 (Goff) and 19.1 on June 15 (CRTS).The object was thus likely a superoutburst of an AM CVn-type object detected during its final stage. The object un-
Table 54. Superhump maxima of SBS 1108 (2012).
E max∗ error O−C† N ‡
0 56040.6654 0.0007 −0.0064 671 56040.7056 0.0007 −0.0053 563 56040.7820 0.0006 −0.0070 6311 56041.0923 0.0021 −0.0090 5912 56041.1304 0.0010 −0.0099 8013 56041.1755 0.0042 −0.0039 8014 56041.2158 0.0045 −0.0027 5318 56041.3662 0.0007 −0.0085 3219 56041.4061 0.0005 −0.0076 4020 56041.4448 0.0004 −0.0079 4321 56041.4834 0.0005 −0.0084 4222 56041.5227 0.0004 −0.0082 4323 56041.5617 0.0005 −0.0082 4224 56041.6002 0.0004 −0.0087 10825 56041.6390 0.0005 −0.0090 7126 56041.6778 0.0004 −0.0093 6927 56041.7171 0.0006 −0.0089 6933 56041.9475 0.0022 −0.0128 6234 56041.9887 0.0012 −0.0107 12135 56042.0287 0.0010 −0.0097 12236 56042.0697 0.0042 −0.0078 3544 56042.3807 0.0006 −0.0091 4245 56042.4206 0.0005 −0.0083 4246 56042.4600 0.0005 −0.0079 4247 56042.4995 0.0005 −0.0075 4348 56042.5390 0.0004 −0.0070 4349 56042.5768 0.0005 −0.0083 4250 56042.6166 0.0007 −0.0075 3751 56042.6560 0.0007 −0.0072 6752 56042.6963 0.0005 −0.0059 6953 56042.7332 0.0005 −0.0081 6154 56042.7724 0.0004 −0.0079 1455 56042.8130 0.0011 −0.0064 1056 56042.8522 0.0011 −0.0062 1457 56042.8875 0.0019 −0.0099 1468 56043.3183 0.0006 −0.0087 2669 56043.3565 0.0005 −0.0095 2670 56043.3964 0.0007 −0.0086 2471 56043.4355 0.0008 −0.0086 2672 56043.4770 0.0014 −0.0061 2673 56043.5145 0.0009 −0.0077 2694 56044.3342 0.0007 −0.0080 7595 56044.3729 0.0006 −0.0083 9896 56044.4121 0.0008 −0.0081 9697 56044.4503 0.0024 −0.0089 2198 56044.4894 0.0009 −0.0089 1299 56044.5289 0.0012 −0.0085 12100 56044.5709 0.0016 −0.0055 8101 56044.6077 0.0009 −0.0077 38102 56044.6465 0.0008 −0.0080 53103 56044.6850 0.0010 −0.0085 50104 56044.7266 0.0009 −0.0060 53∗BJD−2400000.†Against max = 2456040.6718+ 0.039046E.‡Number of points used to determine the maximum.
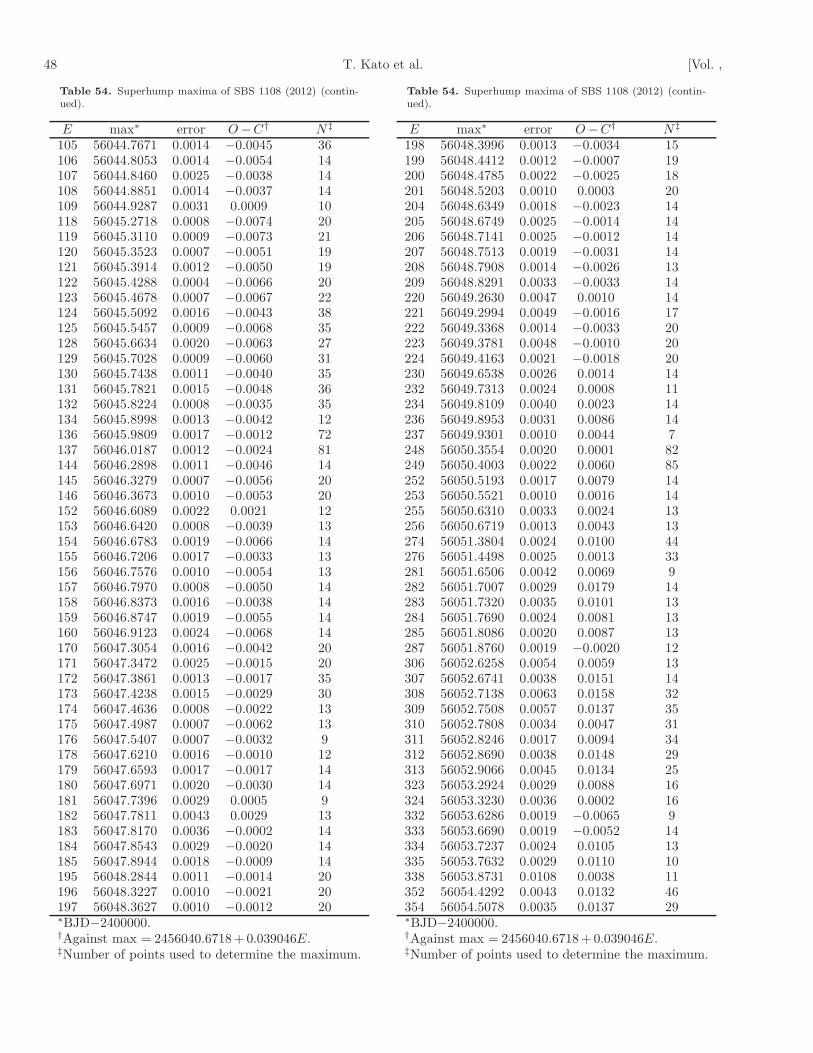
48 T. Kato et al. [Vol. ,
Table 54. Superhump maxima of SBS 1108 (2012) (contin-ued).
E max∗ error O−C† N ‡
105 56044.7671 0.0014 −0.0045 36106 56044.8053 0.0014 −0.0054 14107 56044.8460 0.0025 −0.0038 14108 56044.8851 0.0014 −0.0037 14109 56044.9287 0.0031 0.0009 10118 56045.2718 0.0008 −0.0074 20119 56045.3110 0.0009 −0.0073 21120 56045.3523 0.0007 −0.0051 19121 56045.3914 0.0012 −0.0050 19122 56045.4288 0.0004 −0.0066 20123 56045.4678 0.0007 −0.0067 22124 56045.5092 0.0016 −0.0043 38125 56045.5457 0.0009 −0.0068 35128 56045.6634 0.0020 −0.0063 27129 56045.7028 0.0009 −0.0060 31130 56045.7438 0.0011 −0.0040 35131 56045.7821 0.0015 −0.0048 36132 56045.8224 0.0008 −0.0035 35134 56045.8998 0.0013 −0.0042 12136 56045.9809 0.0017 −0.0012 72137 56046.0187 0.0012 −0.0024 81144 56046.2898 0.0011 −0.0046 14145 56046.3279 0.0007 −0.0056 20146 56046.3673 0.0010 −0.0053 20152 56046.6089 0.0022 0.0021 12153 56046.6420 0.0008 −0.0039 13154 56046.6783 0.0019 −0.0066 14155 56046.7206 0.0017 −0.0033 13156 56046.7576 0.0010 −0.0054 13157 56046.7970 0.0008 −0.0050 14158 56046.8373 0.0016 −0.0038 14159 56046.8747 0.0019 −0.0055 14160 56046.9123 0.0024 −0.0068 14170 56047.3054 0.0016 −0.0042 20171 56047.3472 0.0025 −0.0015 20172 56047.3861 0.0013 −0.0017 35173 56047.4238 0.0015 −0.0029 30174 56047.4636 0.0008 −0.0022 13175 56047.4987 0.0007 −0.0062 13176 56047.5407 0.0007 −0.0032 9178 56047.6210 0.0016 −0.0010 12179 56047.6593 0.0017 −0.0017 14180 56047.6971 0.0020 −0.0030 14181 56047.7396 0.0029 0.0005 9182 56047.7811 0.0043 0.0029 13183 56047.8170 0.0036 −0.0002 14184 56047.8543 0.0029 −0.0020 14185 56047.8944 0.0018 −0.0009 14195 56048.2844 0.0011 −0.0014 20196 56048.3227 0.0010 −0.0021 20197 56048.3627 0.0010 −0.0012 20∗BJD−2400000.†Against max = 2456040.6718+ 0.039046E.‡Number of points used to determine the maximum.
Table 54. Superhump maxima of SBS 1108 (2012) (contin-ued).
E max∗ error O−C† N ‡
198 56048.3996 0.0013 −0.0034 15199 56048.4412 0.0012 −0.0007 19200 56048.4785 0.0022 −0.0025 18201 56048.5203 0.0010 0.0003 20204 56048.6349 0.0018 −0.0023 14205 56048.6749 0.0025 −0.0014 14206 56048.7141 0.0025 −0.0012 14207 56048.7513 0.0019 −0.0031 14208 56048.7908 0.0014 −0.0026 13209 56048.8291 0.0033 −0.0033 14220 56049.2630 0.0047 0.0010 14221 56049.2994 0.0049 −0.0016 17222 56049.3368 0.0014 −0.0033 20223 56049.3781 0.0048 −0.0010 20224 56049.4163 0.0021 −0.0018 20230 56049.6538 0.0026 0.0014 14232 56049.7313 0.0024 0.0008 11234 56049.8109 0.0040 0.0023 14236 56049.8953 0.0031 0.0086 14237 56049.9301 0.0010 0.0044 7248 56050.3554 0.0020 0.0001 82249 56050.4003 0.0022 0.0060 85252 56050.5193 0.0017 0.0079 14253 56050.5521 0.0010 0.0016 14255 56050.6310 0.0033 0.0024 13256 56050.6719 0.0013 0.0043 13274 56051.3804 0.0024 0.0100 44276 56051.4498 0.0025 0.0013 33281 56051.6506 0.0042 0.0069 9282 56051.7007 0.0029 0.0179 14283 56051.7320 0.0035 0.0101 13284 56051.7690 0.0024 0.0081 13285 56051.8086 0.0020 0.0087 13287 56051.8760 0.0019 −0.0020 12306 56052.6258 0.0054 0.0059 13307 56052.6741 0.0038 0.0151 14308 56052.7138 0.0063 0.0158 32309 56052.7508 0.0057 0.0137 35310 56052.7808 0.0034 0.0047 31311 56052.8246 0.0017 0.0094 34312 56052.8690 0.0038 0.0148 29313 56052.9066 0.0045 0.0134 25323 56053.2924 0.0029 0.0088 16324 56053.3230 0.0036 0.0002 16332 56053.6286 0.0019 −0.0065 9333 56053.6690 0.0019 −0.0052 14334 56053.7237 0.0024 0.0105 13335 56053.7632 0.0029 0.0110 10338 56053.8731 0.0108 0.0038 11352 56054.4292 0.0043 0.0132 46354 56054.5078 0.0035 0.0137 29∗BJD−2400000.†Against max = 2456040.6718+ 0.039046E.‡Number of points used to determine the maximum.

No. ] Period Variations in SU UMa-Type Dwarf Novae IV 49
Table 54. Superhump maxima of SBS 1108 (2012) (contin-ued).
E max∗ error O−C† N ‡
357 56054.6351 0.0027 0.0239 10359 56054.7126 0.0010 0.0233 30360 56054.7527 0.0020 0.0243 28361 56054.7857 0.0062 0.0182 30362 56054.8322 0.0016 0.0257 27363 56054.8668 0.0067 0.0213 21364 56054.9069 0.0038 0.0223 17399 56056.2788 0.0015 0.0277 12402 56056.3998 0.0016 0.0315 24403 56056.4295 0.0015 0.0222 33405 56056.5165 0.0028 0.0311 23406 56056.5499 0.0038 0.0254 26410 56056.7049 0.0009 0.0242 20411 56056.7437 0.0026 0.0240 18412 56056.7791 0.0024 0.0204 20413 56056.8207 0.0013 0.0229 20414 56056.8615 0.0018 0.0247 20415 56056.9012 0.0017 0.0253 21425 56057.2882 0.0014 0.0218 16426 56057.3266 0.0025 0.0212 31427 56057.3600 0.0033 0.0155 80428 56057.4052 0.0009 0.0216 104429 56057.4426 0.0015 0.0201 88430 56057.4837 0.0013 0.0221 61431 56057.5178 0.0014 0.0171 60450 56058.2623 0.0018 0.0198 10451 56058.3031 0.0021 0.0216 16476 56059.2684 0.0080 0.0106 14477 56059.3158 0.0012 0.0190 17478 56059.3567 0.0007 0.0209 31479 56059.3930 0.0016 0.0182 58480 56059.4306 0.0010 0.0167 61481 56059.4684 0.0009 0.0154 41482 56059.5069 0.0012 0.0149 15487 56059.7054 0.0014 0.0182 20488 56059.7442 0.0009 0.0179 18489 56059.7845 0.0013 0.0191 20490 56059.8094 0.0012 0.0050 20492 56059.9002 0.0022 0.0178 20512 56060.6731 0.0020 0.0098 8513 56060.7125 0.0012 0.0100 20514 56060.7444 0.0013 0.0029 18515 56060.7918 0.0017 0.0113 19516 56060.8281 0.0018 0.0085 18517 56060.8687 0.0029 0.0101 20518 56060.9091 0.0038 0.0114 14528 56061.3000 0.0034 0.0118 12531 56061.4138 0.0019 0.0086 43533 56061.4901 0.0028 0.0068 32540 56061.7538 0.0013 −0.0028 20541 56061.7907 0.0050 −0.0050 18∗BJD−2400000.†Against max = 2456040.6718+ 0.039046E.‡Number of points used to determine the maximum.
Table 54. Superhump maxima of SBS 1108 (2012) (contin-ued).
E max∗ error O−C† N ‡
542 56061.8396 0.0068 0.0048 19543 56061.8850 0.0033 0.0112 17556 56062.3817 0.0056 0.0003 72558 56062.4634 0.0020 0.0039 72559 56062.5072 0.0013 0.0087 29564 56062.7000 0.0036 0.0062 20565 56062.7351 0.0019 0.0023 19566 56062.7764 0.0023 0.0046 20582 56063.3952 0.0038 −0.0014 29583 56063.4310 0.0020 −0.0046 28584 56063.4683 0.0036 −0.0064 26607 56064.3700 0.0033 −0.0028 42608 56064.4070 0.0042 −0.0048 43609 56064.4419 0.0022 −0.0090 42634 56065.4115 0.0021 −0.0155 25635 56065.4566 0.0023 −0.0094 26657 56066.3051 0.0023 −0.0199 17658 56066.3447 0.0008 −0.0194 29659 56066.3833 0.0011 −0.0198 39660 56066.4265 0.0034 −0.0157 38662 56066.4951 0.0035 −0.0252 12736 56069.3768 0.0026 −0.0329 9738 56069.4499 0.0015 −0.0379 6763 56070.4258 0.0012 −0.0382 11770 56070.6959 0.0017 −0.0413 9773 56070.8146 0.0013 −0.0398 8872 56074.6617 0.0049 −0.0583 7873 56074.7169 0.0034 −0.0421 7875 56074.7828 0.0042 −0.0542 9876 56074.8171 0.0018 −0.0591 9∗BJD−2400000.†Against max = 2456040.6718+ 0.039046E.‡Number of points used to determine the maximum.
Table 55. Superhump maxima of SDSS J073208 (2012).
E max∗ error O−C† N ‡
0 55977.6385 0.0015 −0.0009 411 55977.7190 0.0008 0.0000 512 55977.7994 0.0012 0.0009 5372 55983.3671 0.0025 −0.0000 43∗BJD−2400000.†Against max = 2455977.6394+ 0.079552E.‡Number of points used to determine the maximum.

50 T. Kato et al. [Vol. ,
0.037 0.038 0.039 0.040 0.0410.90
0.92
0.94
0.96
0.98
1.00
(d)
θ
P=0.03911
−0.5 0.0 0.5 1.0 1.5
0.04
0.02
0.00
−0.02
−0.04
Fig. 45. Superhumps in SBS 1108 (2012). (Upper): PDManalysis. The curve at the bottom of the figure representsthe window function. The signal at P = 0.038449 d is thecandidate orbital period. (Lower): Phase-averaged profile.
Table 56. Superhump maxima of SDSS J080303 (2011).
E max∗ error O−C† N ‡
0 55921.6801 0.0015 −0.0524 961 55921.7738 0.0026 −0.0499 5610 55922.6375 0.0004 −0.0071 18711 55922.7343 0.0005 −0.0016 13717 55923.2981 0.0008 0.0150 10421 55923.6649 0.0003 0.0169 9922 55923.7573 0.0005 0.0181 7527 55924.2195 0.0005 0.0243 10128 55924.3112 0.0009 0.0247 10030 55924.4919 0.0006 0.0230 5931 55924.5842 0.0006 0.0240 5943 55925.6680 0.0006 0.0133 9987 55929.6462 0.0020 −0.0220 9788 55929.7332 0.0022 −0.0262 98∗BJD−2400000.†Against max = 2455921.7325+ 0.091215E.‡Number of points used to determine the maximum.
0 100 200 300 400 500 600 700 800 900
−0.10
−0.05
0.00
0.0
0.1
0.2
0.3
0.4
0.5
40 45 50 55 60 65 70 7520
19
18
17
16
Fig. 46. O − C diagram of superhumps in SBS 1108.(Upper:) O − C diagram. We used a period of 0.03912 dfor calculating the O−C residuals. (Middle:) Amplitudes ofsuperhumps. There was a slight tendency of regrowth of su-perhumps around the stage B–C transition. (Lower:) Lightcurve. The object slightly brightened after the stage B–Ctransition.
Table 57. Superhump maxima of SDSS J165359 (2012).
E max∗ error O−C† N ‡
0 56062.5903 0.0004 0.0011 671 56062.6574 0.0004 0.0031 5213 56063.4328 0.0004 −0.0025 10514 56063.4999 0.0004 −0.0005 11623 56064.0889 0.0009 0.0027 7024 56064.1505 0.0011 −0.0008 5228 56064.4077 0.0008 −0.0040 4791 56068.5137 0.0007 0.0015 64106 56069.4898 0.0009 0.0013 57107 56069.5505 0.0007 −0.0032 55115 56070.0719 0.0022 −0.0025 132121 56070.4688 0.0013 0.0039 48∗BJD−2400000.†Against max = 2456062.5892+ 0.065089E.‡Number of points used to determine the maximum.

No. ] Period Variations in SU UMa-Type Dwarf Novae IV 51
−0.5 0.0 0.5 1.0 1.5
1.5
1.0
0.5
0.0
41
42
43
44
45
46
47
48
49
50
51
(BJD−2456000)
−0.5 0.0 0.5 1.0 1.5
1.5
1.0
0.5
0.0
52
53
54
55
56
57
58
59
60
61
62
(BJD−2456000)
Fig. 47. Variation of superhump prfiles in SBS 1108 (2012).A period of 0.039111 d was assumed in phase-averag-ing. Although the amplitude of superhumps decreased fora time (BJD 2456050–2456056), it increased again (BJD2456057–2456060).
−0.5 0.0 0.5 1.0 1.5
0.04
0.02
0.00
−0.02
−0.04
Fig. 48. Waveform of the candidate orbital period(0.038449 d) of SBS 1108.
0.04
0.06
0.08
0.1
0.14
0.2
0.01 0.02 0.04 0.06 0.08 0.1 0.14
Rad
ius
(RS
un)
Mass (MSun)
1.4MSun
1.0MSun
0.7MSun
0.35MSun
CB97B+03
Fig. 49. Mass-radius relation of the secondary of SBS 1108.The volume radii of the Roche lobe of the secondary for vari-ous masses of the primary are plotted against the mass-radiusrelationship of 10 Gyr brown dwarfs and low-mass main-se-quence stars by Baraffe et al. (2003) (B03) and Chabrier,Baraffe (1997) (CB97).
0.082 0.084 0.086 0.088 0.090 0.092 0.094 0.096 0.098 0.100
0.6
0.7
0.8
0.9
1.0
(d)
θ
P=0.09203
−0.5 0.0 0.5 1.0 1.5
0.10
0.05
0.00
−0.05
−0.10
Fig. 50. Superhumps in SDSS J080303 (2011). (Upper):PDM analysis. (Lower): Phase-averaged profile.

52 T. Kato et al. [Vol. ,
0 20 40 60 80 100 120 140−0.02
−0.01
0.00
0.01
0.02
20102012
Fig. 51. Comparison of O − C diagrams of SDSS J165359between different superoutbursts. A period of 0.06520 d wasused to draw this figure. Approximate cycle counts (E) afterthe start of the observation were used. We could not obtaina better match if we shifted the cycle number between thesesuperoutbursts.
0 20 40 60 80 100 120 140 160
−0.02
−0.01
0.00
0.01
20052011
Fig. 52. Comparison of O − C diagrams of SDSS J170213between different superoutbursts. A period of 0.10510 d wasused to draw this figure. Approximate cycle counts (E) afterthe start of the superoutburst were used.
Table 58. Eclipse minima of SDSS J170213 (2011).
E Minimum∗ error O−C†
21165 55766.47660 0.00003 0.0001821195 55769.47798 0.00004 -0.0009121196 55769.57867 0.00004 -0.0002921205 55770.48023 0.00004 0.0005221214 55771.38036 0.00012 -0.0000921215 55771.48107 0.00009 0.0005421224 55772.38128 0.00003 0.0000121225 55772.48149 0.00005 0.0001321234 55773.38194 0.00003 -0.0001521235 55773.48223 0.00003 0.0000521245 55774.48296 0.00004 -0.0000421248 55774.78356 0.00013 0.0003221254 55775.38378 0.00003 0.0000421255 55775.48378 0.00003 -0.0000421264 55776.38464 0.00003 0.0000821265 55776.48473 0.00005 0.0000921270 55776.98509 0.00005 0.0000421271 55777.08517 0.00006 0.0000321274 55777.38503 0.00003 -0.0003521280 55777.98583 0.00011 -0.0000521281 55778.08560 0.00005 -0.0003621284 55778.38640 0.00014 0.00020∗BJD−2400000.†Against equation 3.
derwent a short post-superoutburst rebrightening on June20 whose peak brightness must have been brighter than17.5 (Goff). The times of superhump maxima are listedin table 60. Note that these observations were mostlymade during the final stage of the superoutburst and sub-sequent post-superoutburst phase, and the maxima wererather difficult to identify due to the faintness. Our bestestimate of the superhump period is 0.026673(8) d (figure53). It is remarkable that both spectra in Rau et al. (2010)and the SDSS public archive were continuum-dominated(vsnet-alert 14650) in contrast to the quiescent state ofmany AM CVn-type objects showing dwarf-nova type out-bursts.
3.55. SDSS J210449.94+010545.8
This object (hereafter SDSS J210449) was discovered asa CV during the course of the SDSS (Szkody et al. 2006).Szkody et al. (2006) recorded high and low states ranging17.1–20.6 mag. Southworth et al. (2007) detected a pho-tometric period of 0.07196(8) d. CRTS recorded multi-ple outbursts, and at least one of them (2006 November)lasted more than 18 d and was likely a superoutburst.During the superoutburst in 2011 September, I. Millerdetected superhumps (vsnet-alert 13704). A PDM analy-sis yielded two equally acceptable one-day aliases (figure54).The times of superhump maxima are listed in table 61
The timing analysis prefers an alias of 0.0753 d, and weobtained a period of 0.07531(4) d with the PDM method,

No. ] Period Variations in SU UMa-Type Dwarf Novae IV 53
Table 59. Superhump maxima of SDSS J170213 (2011).
E max∗ error O−C† phase‡ N §
0 55766.1025 0.0004 −0.0084 0.27 1253 55766.4152 0.0003 −0.0111 0.39 1874 55766.5234 0.0004 −0.0081 0.47 19022 55768.4280 0.0005 0.0041 0.50 8932 55769.4973 0.0010 0.0221 0.19 18133 55769.5977 0.0011 0.0174 0.19 12241 55770.4259 0.0004 0.0045 0.46 8248 55771.1610 0.0007 0.0037 0.81 14150 55771.3684 0.0014 0.0008 0.88 3551 55771.4720 0.0015 −0.0007 0.92 7760 55772.4140 0.0005 −0.0048 0.33 8770 55773.4604 0.0024 −0.0098 0.78 9679 55774.4138 0.0006 −0.0025 0.31 12080 55774.5194 0.0005 −0.0021 0.37 11085 55775.0472 0.0006 0.0001 0.64 16988 55775.3584 0.0048 −0.0041 0.75 5389 55775.4627 0.0029 −0.0050 0.79 10098 55776.4132 0.0020 −0.0007 0.29 15799 55776.5209 0.0009 0.0019 0.36 106104 55777.0438 0.0026 −0.0009 0.59 231107 55777.3571 0.0024 −0.0030 0.72 82108 55777.4626 0.0048 −0.0026 0.77 79113 55777.9987 0.0034 0.0078 0.13 148117 55778.4129 0.0037 0.0015 0.27 138∗BJD−2400000.†Against max = 2455766.1110+ 0.105132E.‡Orbital phase.§Number of points used to determine the maximum.
which is used in table 2. The ǫ of 4.7% inferred from thisperiod is likely to be too large for this Porb, and theremay have been negative superhumps at the time of ob-servations by Southworth et al. (2007). The exact orbitalperiod needs to be determined by radial-velocity studies.
3.56. SDSS J220553.98+115553.7
This object (hereafter SDSS J220553) was detected asa CV during the course of SDSS (Szkody et al. 2003).Szkody et al. (2003) showed the presence of the underlyingwhite dwarf in the spectrum, suggesting the low mass-transfer rate. Warner, Woudt (2004) indicated that thissystem contains a ZZ Cet-type pulsating white dwarf (seealso Szkody et al. 2007), also suggesting the low surface-temperature of the white dwarf (consistent with the lowmass-transfer rate). Southworth et al. (2008) obtained thespectroscopic orbital period of 0.0575175(62) d, and theyfound that the pulsation of white dwarf ceased in 2007.Although the spectrum and the orbital period suggestedan SU UMa-type or an even WZ Sge-type dwarf nova, nooutburst had been recorded until 2011.CRTS detected an outburst on 2011 May 20 (cf. vsnet-
alert 13325) and the announcement of this detection wasimmediately followed by observations. Fully grown super-humps were soon detected (vsnet-alert 13329, figure 55),
Table 60. Superhump maxima of SDSS J172102 (2012).
E max∗ error O−C† N ‡
0 56087.5334 0.0007 0.0035 181 56087.5601 0.0008 0.0036 1982 56089.7123 0.0007 −0.0043 1383 56089.7401 0.0007 −0.0032 1484 56089.7687 0.0010 −0.0013 1285 56089.7919 0.0017 −0.0047 1486 56089.8217 0.0014 −0.0016 1287 56089.8449 0.0008 −0.0050 1088 56089.8753 0.0011 −0.0013 1489 56089.9039 0.0016 0.0006 1390 56089.9306 0.0015 0.0007 9120 56090.7290 0.0011 −0.0010 13122 56090.7869 0.0019 0.0036 14123 56090.8112 0.0032 0.0012 14124 56090.8354 0.0056 −0.0013 13127 56090.9128 0.0041 −0.0039 13233 56093.7449 0.0021 0.0015 13234 56093.7751 0.0037 0.0050 14236 56093.8200 0.0012 −0.0034 13237 56093.8512 0.0013 0.0011 8238 56093.8733 0.0019 −0.0035 14239 56093.9027 0.0032 −0.0007 13271 56094.7616 0.0007 0.0048 11272 56094.7900 0.0030 0.0065 14273 56094.8203 0.0050 0.0101 14274 56094.8427 0.0012 0.0059 8275 56094.8690 0.0033 0.0055 13345 56096.7276 0.0019 −0.0026 11346 56096.7560 0.0020 −0.0009 10347 56096.7784 0.0019 −0.0051 14350 56096.8612 0.0021 −0.0023 13384 56097.7699 0.0025 −0.0004 11387 56097.8535 0.0022 0.0033 11388 56097.8736 0.0057 −0.0033 13389 56097.9032 0.0033 −0.0004 14390 56097.9289 0.0016 −0.0013 12457 56099.7196 0.0050 0.0026 13460 56099.8005 0.0044 0.0035 13461 56099.8212 0.0034 −0.0025 9462 56099.8486 0.0024 −0.0017 12463 56099.8699 0.0050 −0.0071 14∗BJD−2400000.†Against max = 2456087.5299+ 0.026668E.‡Number of points used to determine the maximum.
Table 61. Superhump maxima of SDSS J210449 (2011).
E max∗ error O−C† N ‡
0 55834.4629 0.0008 −0.0000 7926 55836.4217 0.0015 0.0000 6927 55836.4970 0.0011 −0.0000 55∗BJD−2400000.†Against max = 2455834.4629+ 0.075338E.‡Number of points used to determine the maximum.

54 T. Kato et al. [Vol. ,
0.0260 0.0265 0.0270 0.0275
0.94
0.96
0.98
1.00
1.02
(d)
θ
P=0.02667
−0.5 0.0 0.5 1.0 1.5
0.10
0.05
0.00
−0.05
−0.10
Fig. 53. Superhumps in SDSS J172102 (2012). (Upper):PDM analysis. The rejection rate for bootstrappingwas reduced to 0.2 for better visualization. (Lower):Phase-averaged profile.
and the later development suggested a low ǫ, characteristicto a WZ Sge-type dwarf nova (vsnet-alert 13332, 13336).The Pdot was, however, unexpectedly large (vsnet-alert13348).The times of superhump maxima are listed in table 62.
The resultant Pdot was +7.7(0.9)× 10−5. The ǫ for themean period of stage B superhumps was 1.1%, which ismuch smaller than what would be expected for this largePdot.According to the CRTS data, the object brighter than
in usual quiescence four months after the outburst. This,combined with the low ǫ and the lack of previous outburstsin the CRTS data, suggest that the object is a WZ Sge-type dwarf nova. It may have been that the period of earlysuperhumps was missed, and that the true maximum wasmuch brighter.
3.57. OT J001952.2+433901
This transient (=CSS120131:001952+433901; hereafterOT J001952) was detected by CRTS on 2012 January 31.The large outburst amplitude (∼ 6.5 mag) and the lack ofprevious outbursts attracted observers’ attention (vsnet-alert 14182). Subsequent observations detected short-period superhumps (vsnet-alert 14189, 14202; figure 56).
0.068 0.070 0.072 0.074 0.076 0.078 0.080 0.082
0.4
0.6
0.8
1.0
(d)
θ
P=0.07531
−0.5 0.0 0.5 1.0 1.5
0.1
0.0
−0.1
Fig. 54. Superhumps in SDSS J210449 (2011). (Upper):PDM analysis. The alias selection was based on superhumptiming analysis. (Lower): Phase-averaged profile.
Table 62. Superhump maxima of SDSS J220553 (2011).
E max∗ error O−C† N ‡
0 55702.2039 0.0015 0.0042 1091 55702.2618 0.0008 0.0039 11912 55702.8979 0.0004 0.0003 6013 55702.9551 0.0004 −0.0006 5329 55703.8834 0.0004 −0.0028 8730 55703.9436 0.0003 −0.0007 8640 55704.5235 0.0010 −0.0024 3146 55704.8715 0.0009 −0.0032 8747 55704.9297 0.0005 −0.0032 8663 55705.8626 0.0008 −0.0007 6064 55705.9204 0.0005 −0.0010 6197 55707.8427 0.0028 0.0023 3698 55707.9006 0.0007 0.0021 6099 55707.9586 0.0007 0.0018 43∗BJD−2400000.†Against max = 2455702.1998+ 0.058151E.‡Number of points used to determine the maximum.

No. ] Period Variations in SU UMa-Type Dwarf Novae IV 55
0.055 0.056 0.057 0.058 0.059 0.060 0.061
0.90
0.95
1.00
(d)
θ
P=0.05808
−0.5 0.0 0.5 1.0 1.5
0.05
0.00
−0.05
−0.10
Fig. 55. Superhumps in SDSS J220553 (2011). (Upper):PDM analysis. (Lower): Phase-averaged profile.
Table 63. Superhump maxima of OT J001952.
E max∗ error O−C† N ‡
0 55958.3297 0.0005 0.0005 611 55958.3856 0.0007 −0.0005 4217 55959.2959 0.0006 0.0005 5018 55959.3517 0.0008 −0.0005 60∗BJD−2400000.†Against max = 2455958.3292+ 0.056827E.‡Number of points used to determine the maximum.
The times of superhump maxima are listed in table 63.The large outburst amplitude and short superhump pe-riod suggest a possibility of a WZ Sge-type dwarf nova.
3.58. OT J011516.5+245530
This transient (=CSS101008:011517+245530; hereafterOT J011516) was detected by CRTS on 2010 October 8.Although several outbursts were known, the 2012 outburstwas the brightest one (vsnet-alert 14142). Subsequentobservations recorded superhumps (vsnet-alert 14147,14149). Only single-night observation was available withsuperhump maxima of BJD 2455952.2518(7) (N=51) and2455952.3253(10) (N=44). The best superhump period
0.052 0.054 0.056 0.058 0.060
0.2
0.4
0.6
0.8
1.0
(d)
θ
P=0.05677
−0.5 0.0 0.5 1.0 1.5
0.1
0.0
−0.1
Fig. 56. Superhumps in OT J001952 (2011). (Upper): PDManalysis. The alias selection was based on continuous sin-gle-night observation. (Lower): Phase-averaged profile.
Table 64. Superhump maxima of OT J050716.
E max∗ error O−C† N ‡
0 55952.4395 0.0009 −0.0012 311 55952.5075 0.0024 0.0015 1914 55953.3518 0.0055 −0.0033 2815 55953.4234 0.0018 0.0030 36∗BJD−2400000.†Against max = 2455952.4407+ 0.065317E.‡Number of points used to determine the maximum.
by the PDM was 0.0731(6) d (figure 57).
3.59. OT J050716.2+125314
This transient (=CSS081221:050716+125314; hereafterOT J050716) was detected by CRTS on 2008 December21. The 2012 January outburst led to the detection ofsuperhumps (vsnet-alert 14150, 14151). The times of su-perhump maxima are listed in table 64. Although theO−C analysis favored an alias of 0.06592(8) d (adoptedin table 2), the alias of 0.07055(9) d is not excluded (figure58).

56 T. Kato et al. [Vol. ,
0.060 0.065 0.070 0.075 0.080 0.085
0.2
0.4
0.6
0.8
1.0
(d)
θ
P=0.073
−0.5 0.0 0.5 1.0 1.5
0.1
0.0
−0.1
Fig. 57. Superhumps in OT J011516 (2012). (Upper): PDManalysis. (Lower): Phase-averaged profile.
3.60. OT J055721.8−363055
This transient (=SSS111229:055722−363055; hereafterOT J055721) was detected by CRTS SSS on 2011December 29. The large outburst amplitude suggested anSU UMa-type, or even a WZ Sge-type object (vsnet-alert14041). Subsequent observations detected superhumps(vsnet-alert 14052). The times of superhump maxima arelisted in table 65. Although the observations in the mid-dle of the outburst were rather sparse, we likely observedstage B superhumps with a positive Pdot. The amplitudeof superhumps (cf. figure 59) resembles those of ordinarySU UMa-type dwarf novae rather than those of extremeWZ Sge-type dwarf novae. The object, however, under-went a post-outburst rebrightening similar to those of WZSge-type dwarf novae (rebrightening followed by a short“dip”; vsnet-alert 14097).
3.61. OT J064608.2+403305
This transient (=CSS 080512:064608+403305; hereafterOT J064608) was detected by CRTS on 2008 May 12.A bright outburst in 2011 December was detected by E.Muyllaert (BAAVSS alert 2808). Subsequent observationsconfirmed the presence of superhumps (vsnet-alert 14023,14036, 14039; figure 60). The time of superhump maximaare listed in table 66. The Pdot was +11.1(2.6)× 10−5, a
0.058 0.060 0.062 0.064 0.066 0.068 0.070 0.072 0.074
0.4
0.6
0.8
1.0
(d)
θ
P=0.06592
−0.5 0.0 0.5 1.0 1.5
0.1
0.0
−0.1
Fig. 58. Superhumps in OT OT J050716 (2012). (Upper):PDM analysis. (Lower): Phase-averaged profile.
typical value for stage B superhumps with this PSH.
3.62. OT J081117.1+152003
This transient (=CSS111030:081117+152003; hereafterOT J081117) was detected by CRTS on 2011 October 30.The object had a large (∼ 6 mag) outburst amplitude andwas considered as a good candidate for an SU UMa-typedwarf nova. As expected, short-period superhumps weredetected (vsnet-alert 13816; figure 61). Due to the insuf-ficient observation, we could not measure PSH precisely.The times of superhump maxima are listed in table 67.We listed the most likely alias determined with the PDMmethod in table 2.
3.63. OT J084127.4+210053
This transient (=CSS090525:084127+210054; hereafterOT J084127) was detected by CRTS on 2009 May 25.There were other known outbursts (CRTS detections) in2007 September, 2010 January and 2010 May. Kato et al.(2012b) suggested Porb=0.10 d from the SDSS colors. The2012 March outburst was observed and superhumps wereimmediately detected (vsnet-alert 14391, 14392, 14396;figure 62). The times of superhump maxima are listedin table 68.

No. ] Period Variations in SU UMa-Type Dwarf Novae IV 57
0.056 0.057 0.058 0.059 0.060 0.061 0.062 0.063
0.92
0.94
0.96
0.98
1.00
(d)
θ
P=0.05971
−0.5 0.0 0.5 1.0 1.50.2
0.1
0.0
−0.1
−0.2
Fig. 59. Superhumps in OT J055721 (2011). (Upper): PDManalysis. The rejection rate for bootstrapping was reduced to0.2 for better visualization. (Lower): Phase-averaged profile.
3.64. OT J094854.0+014911
This transient (=CSS120315:094854+014911; hereafterOT J094854) was detected by CRTS on 2012 March15. There was no previous outbursts detected by CRTS.Immediately following this discovery superhumps were de-tected (vsnet-alert 14326, 14327; figure 63). The SDSScolor of the quiescent counterpart resembles those of or-dinary SU UMa-type dwarf novae rather than those ofextreme WZ Sge-type dwarf novae (vsnet-alert 14328; seealso Kato et al. 2012b). S. Yoshida pointed out that theobject was already in outburst on March 11 (vsnet-alert14330). The times of superhump maxima are listed in ta-ble 69. There was likely a stage B–C transition aroundE = 77. The early part of stage B was missed and theobservations were not sufficient to determine the periodof stage C superhumps.
3.65. OT J102842.9−081927
This object (=CSS090331:102843−081927, hereafterOT J102842) was originally discovered by CRTS. Katoet al. (2009) indicated that this object has a very short[0.038147(14) d] superhump period, suggesting an unusualevolutionary status similar to EI Psc (Thorstensen et al.2002a; Uemura et al. 2002) or V485 Cen (Augusteijn
Table 65. Superhump maxima of OT J055721 (2011).
E max∗ error O−C† N ‡
0 55926.5487 0.0010 0.0008 221 55926.6101 0.0006 0.0024 142 55926.6685 0.0005 0.0010 103 55926.7283 0.0015 0.0010 154 55926.7898 0.0011 0.0028 2017 55927.5657 0.0006 0.0019 1718 55927.6250 0.0012 0.0014 1419 55927.6836 0.0006 0.0002 1320 55927.7438 0.0005 0.0008 1721 55927.8028 0.0007 0.0000 2033 55928.5184 0.0024 −0.0015 1734 55928.5806 0.0010 0.0010 1535 55928.6376 0.0009 −0.0018 1436 55928.6967 0.0008 −0.0024 1637 55928.7549 0.0005 −0.0040 1738 55928.8170 0.0006 −0.0016 1994 55932.1550 0.0068 −0.0100 100152 55935.6360 0.0036 0.0051 14153 55935.6934 0.0029 0.0029 17∗BJD−2400000.†Against max = 2455926.5480+ 0.059756E.‡Number of points used to determine the maximum.
0.057 0.058 0.059 0.060 0.061 0.062 0.063 0.064 0.065
0.2
0.4
0.6
0.8
1.0
(d)
θ
P=0.06109
−0.5 0.0 0.5 1.0 1.50.10
0.05
0.00
−0.05
−0.10
Fig. 60. Superhumps in OT J064608 (2011). (Upper): PDManalysis. (Lower): Phase-averaged profile.

58 T. Kato et al. [Vol. ,
Table 66. Superhump maxima of OT J064608 (2011).
E max∗ error O−C† N ‡
0 55923.3629 0.0006 −0.0018 361 55923.4269 0.0002 0.0010 642 55923.4884 0.0002 0.0014 793 55923.5492 0.0002 0.0011 544 55923.6111 0.0002 0.0019 547 55923.7948 0.0002 0.0023 638 55923.8553 0.0002 0.0017 639 55923.9152 0.0006 0.0005 6310 55923.9751 0.0003 −0.0007 6417 55924.4049 0.0003 0.0013 6418 55924.4661 0.0003 0.0015 6423 55924.7705 0.0002 0.0004 6424 55924.8319 0.0003 0.0006 6425 55924.8923 0.0002 −0.0001 6526 55924.9527 0.0003 −0.0007 6427 55925.0124 0.0005 −0.0022 5539 55925.7448 0.0008 −0.0031 3640 55925.8078 0.0003 −0.0012 6441 55925.8668 0.0003 −0.0032 6442 55925.9280 0.0004 −0.0031 6443 55925.9880 0.0005 −0.0043 6356 55926.7855 0.0004 −0.0011 6457 55926.8473 0.0003 −0.0004 6458 55926.9074 0.0003 −0.0014 6459 55926.9667 0.0008 −0.0032 6360 55927.0366 0.0016 0.0055 3482 55928.3828 0.0008 0.0075 65∗BJD−2400000.†Against max = 2455923.3648+ 0.061105E.‡Number of points used to determine the maximum.
Table 67. Superhump maxima of OT J081117 (2011).
E max∗ error O−C† N ‡
0 55865.6525 0.0003 −0.0003 551 55865.7111 0.0004 0.0003 3663 55869.3040 0.0031 −0.0000 20∗BJD−2400000.†Against max = 2455865.6529+ 0.057955E.‡Number of points used to determine the maximum.
Table 68. Superhump maxima of OT J084127 (2012).
E max∗ error O−C† N ‡
0 56014.1263 0.0005 −0.0004 1312 56014.3029 0.0004 0.0007 843 56014.3901 0.0004 0.0003 1774 56014.4769 0.0007 −0.0006 91∗BJD−2400000.†Against max = 2456014.1268+ 0.087686E.‡Number of points used to determine the maximum.
0.0560 0.0565 0.0570 0.0575 0.0580 0.0585 0.0590 0.0595 0.0600
0.5
0.6
0.7
0.8
(d)
θ
P=0.05804
−0.5 0.0 0.5 1.0 1.5
0.1
0.0
−0.1
Fig. 61. Superhumps in OT J081117 (2011). (Upper): PDManalysis. The rejection rate for bootstrapping was reduced to0.2 for better visualization. (Lower): Phase-averaged profile.
et al. 1993; Augusteijn et al. 1996; Olech 1997). The2012 superoutburst, detected by CRTS, was also observed.The times of superhump maxima are listed in table 70.Contrary to Kato et al. (2009), the present observationgave a longer superhump period, particularly during thefirst half of the observation. It is difficult to reconcilewith this disagreement of the periods unless we assumethat the first half of the 2012 observation recorded stageA superhumps (sinec CRTS observations were typicallymade with 10-d intervals, it is difficult to determine thestarting dates of outbursts). In table 2 and figure 64 wegave values and a comparison of O−C diagrams basedon this identification. This interpretation, however, has aproblem in that it cannot explain the large amplitudes ofsuperhumps at the initial stage of the 2012 observation. Itmay be either that the evolution of superhumps in this sys-tem is unusual, or that the period of superhumps greatlyvary between superoutbursts. Further observations, par-ticularly regular monitoring to record the epoch of thestart of the outbursts, and to record superhumps duringthe full course of the outbursts.
3.66. OT J105122.8+672528
This transient (=CSS120101:105123+672528; hereafterOT J105122) was detected by CRTS on 2012 January 1.

No. ] Period Variations in SU UMa-Type Dwarf Novae IV 59
0.075 0.080 0.085 0.090 0.095 0.100
0.0
0.2
0.4
0.6
0.8
1.0
(d)
θ
P=0.08768
−0.5 0.0 0.5 1.0 1.5
0.1
0.0
−0.1
−0.2
Fig. 62. Superhumps in OT J084127 (2012). (Upper): PDManalysis. (Lower): Phase-averaged profile.
There is an X-ray counterpart 1RXS J105120.5+672550.D. Denisenko reported that this object was recordedbright on a Palomer Sky Survey infrared plate taken on1999 December 12 (vsnet-alert 14060). Subsequent obser-vations detected superhumps (vsnet-alert 14067, 14072).MASTER team also independently detected this transient(Tiurina et al. 2012). Although it was classified as a CV(Sokolovsky et al. 2012), they couldn’t detect variability.Pavlenko et al. (2012a) further observed this object inquiescence and recorded high-amplitude variations witha period of 0.0596(9) d, which was considered to be theorbital period.The times of superhump maxima are listed in table 71.
During these observations, the amplitudes of superhumpswere small (figure 65), and not triangular as typically seenin early stage superhumps. Although these superhumpswere likely recorded when the amplitudes get smaller (par-ticularly before the stage B–C transition, cf. subsection4.7 of Kato et al. 2012a), it was impossible to identify thestage in which they were observed.
3.67. OT J125905.8+242634
This transient (=CSS120424:125906+242634; hereafterOT J125905) was detected by CRTS on 2012 April24. There was a previous outburst in 2009 February.
0.055 0.056 0.057 0.058 0.059 0.060
0.6
0.8
1.0
(d)
θ
P=0.05748
−0.5 0.0 0.5 1.0 1.50.10
0.05
0.00
−0.05
−0.10
Fig. 63. Superhumps in OT J094854 (2012). (Upper): PDManalysis. (Lower): Phase-averaged profile.
0 50 100 150 200 250 300 350
−0.02
−0.01
0.00
0.01
0.02
200920102012
Fig. 64. Comparison of O−C diagrams of J102842 betweendifferent superoutbursts. A period of 0.03816 d was used todraw this figure. Approximate cycle counts (E) after the startof the observations were used for 2009 and 2012, assumingthat the observations started at the initial stage of the out-bursts. The O−C diagram for 2010 was shifted by 80 cycles.
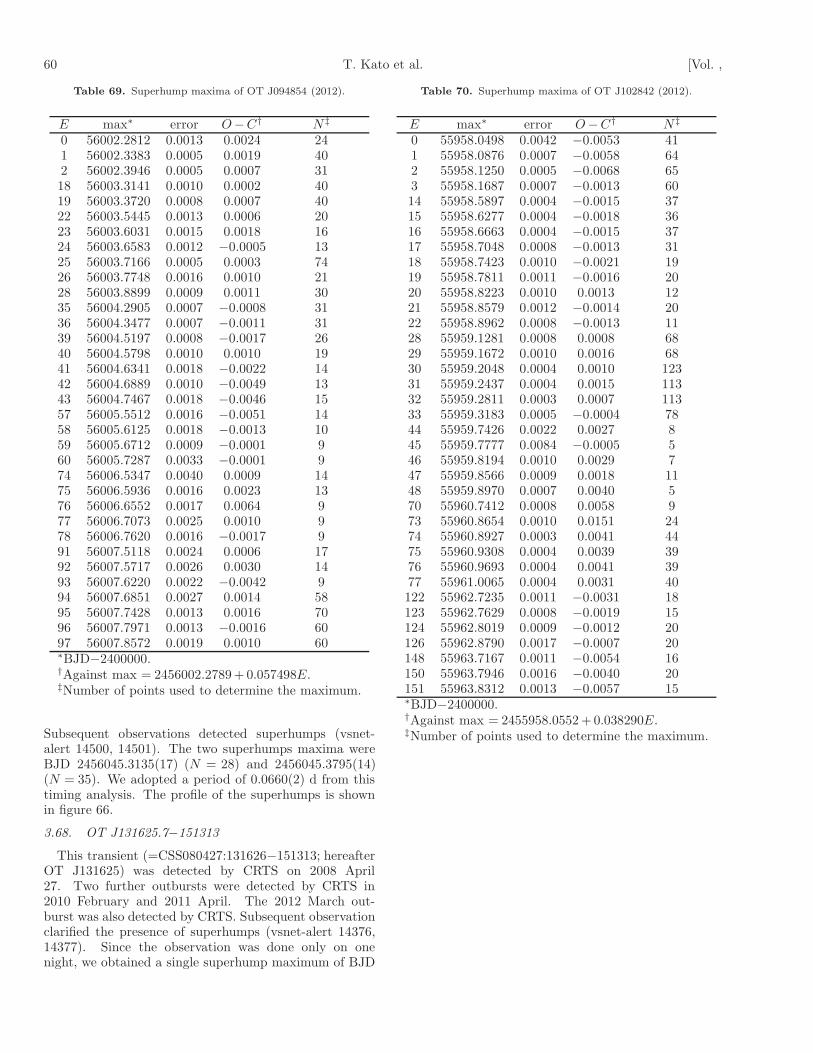
60 T. Kato et al. [Vol. ,
Table 69. Superhump maxima of OT J094854 (2012).
E max∗ error O−C† N ‡
0 56002.2812 0.0013 0.0024 241 56002.3383 0.0005 0.0019 402 56002.3946 0.0005 0.0007 3118 56003.3141 0.0010 0.0002 4019 56003.3720 0.0008 0.0007 4022 56003.5445 0.0013 0.0006 2023 56003.6031 0.0015 0.0018 1624 56003.6583 0.0012 −0.0005 1325 56003.7166 0.0005 0.0003 7426 56003.7748 0.0016 0.0010 2128 56003.8899 0.0009 0.0011 3035 56004.2905 0.0007 −0.0008 3136 56004.3477 0.0007 −0.0011 3139 56004.5197 0.0008 −0.0017 2640 56004.5798 0.0010 0.0010 1941 56004.6341 0.0018 −0.0022 1442 56004.6889 0.0010 −0.0049 1343 56004.7467 0.0018 −0.0046 1557 56005.5512 0.0016 −0.0051 1458 56005.6125 0.0018 −0.0013 1059 56005.6712 0.0009 −0.0001 960 56005.7287 0.0033 −0.0001 974 56006.5347 0.0040 0.0009 1475 56006.5936 0.0016 0.0023 1376 56006.6552 0.0017 0.0064 977 56006.7073 0.0025 0.0010 978 56006.7620 0.0016 −0.0017 991 56007.5118 0.0024 0.0006 1792 56007.5717 0.0026 0.0030 1493 56007.6220 0.0022 −0.0042 994 56007.6851 0.0027 0.0014 5895 56007.7428 0.0013 0.0016 7096 56007.7971 0.0013 −0.0016 6097 56007.8572 0.0019 0.0010 60∗BJD−2400000.†Against max = 2456002.2789+ 0.057498E.‡Number of points used to determine the maximum.
Subsequent observations detected superhumps (vsnet-alert 14500, 14501). The two superhumps maxima wereBJD 2456045.3135(17) (N = 28) and 2456045.3795(14)(N = 35). We adopted a period of 0.0660(2) d from thistiming analysis. The profile of the superhumps is shownin figure 66.
3.68. OT J131625.7−151313
This transient (=CSS080427:131626−151313; hereafterOT J131625) was detected by CRTS on 2008 April27. Two further outbursts were detected by CRTS in2010 February and 2011 April. The 2012 March out-burst was also detected by CRTS. Subsequent observationclarified the presence of superhumps (vsnet-alert 14376,14377). Since the observation was done only on onenight, we obtained a single superhump maximum of BJD
Table 70. Superhump maxima of OT J102842 (2012).
E max∗ error O−C† N ‡
0 55958.0498 0.0042 −0.0053 411 55958.0876 0.0007 −0.0058 642 55958.1250 0.0005 −0.0068 653 55958.1687 0.0007 −0.0013 6014 55958.5897 0.0004 −0.0015 3715 55958.6277 0.0004 −0.0018 3616 55958.6663 0.0004 −0.0015 3717 55958.7048 0.0008 −0.0013 3118 55958.7423 0.0010 −0.0021 1919 55958.7811 0.0011 −0.0016 2020 55958.8223 0.0010 0.0013 1221 55958.8579 0.0012 −0.0014 2022 55958.8962 0.0008 −0.0013 1128 55959.1281 0.0008 0.0008 6829 55959.1672 0.0010 0.0016 6830 55959.2048 0.0004 0.0010 12331 55959.2437 0.0004 0.0015 11332 55959.2811 0.0003 0.0007 11333 55959.3183 0.0005 −0.0004 7844 55959.7426 0.0022 0.0027 845 55959.7777 0.0084 −0.0005 546 55959.8194 0.0010 0.0029 747 55959.8566 0.0009 0.0018 1148 55959.8970 0.0007 0.0040 570 55960.7412 0.0008 0.0058 973 55960.8654 0.0010 0.0151 2474 55960.8927 0.0003 0.0041 4475 55960.9308 0.0004 0.0039 3976 55960.9693 0.0004 0.0041 3977 55961.0065 0.0004 0.0031 40122 55962.7235 0.0011 −0.0031 18123 55962.7629 0.0008 −0.0019 15124 55962.8019 0.0009 −0.0012 20126 55962.8790 0.0017 −0.0007 20148 55963.7167 0.0011 −0.0054 16150 55963.7946 0.0016 −0.0040 20151 55963.8312 0.0013 −0.0057 15∗BJD−2400000.†Against max = 2455958.0552+ 0.038290E.‡Number of points used to determine the maximum.

No. ] Period Variations in SU UMa-Type Dwarf Novae IV 61
0.058 0.059 0.060 0.061 0.062 0.063 0.064
0.8
0.9
1.0
(d)
θ
P=0.06103
−0.5 0.0 0.5 1.0 1.5
0.05
0.00
−0.05
Fig. 65. Superhumps in OT J105122 (2012). (Upper): PDManalysis. (Lower): Phase-averaged profile.
Table 71. Superhump maxima of OT J105122 (2012).
E max∗ error O−C† N ‡
0 55929.7466 0.0019 0.0007 641 55929.8069 0.0015 −0.0001 632 55929.8626 0.0009 −0.0055 633 55929.9291 0.0014 −0.0001 634 55929.9894 0.0009 −0.0008 5712 55930.4884 0.0023 0.0098 1626 55931.3292 0.0033 −0.0041 1627 55931.3949 0.0024 0.0005 2029 55931.5163 0.0072 −0.0003 2330 55931.5776 0.0038 −0.0000 23∗BJD−2400000.†Against max = 2455929.7460+ 0.061054E.‡Number of points used to determine the maximum.
−0.5 0.0 0.5 1.0 1.5
0.2
0.1
0.0
−0.1
−0.2
Fig. 66. Superhumps in OT J125905 (2012). A period of0.0660 d was assumed in phase-averaging.
2456012.5086(9) (N = 71). The best superhump period is0.0955(8) d (PDM method).
3.69. OT J142548.1+151502
This transient (=CSS110628:142548+151502; hereafterOT J142548) was detected by CRTS on 2011 June28. Only single-night observation was available, whichclearly showed superhumps (vsnet-alert 13474). Thebest superhump period (PDM method) was 0.0984(10) dand we obtained only two superhump maxima: BJD2455742.3565(9) (N=34) and 2455742.4548(14) (N=27).
3.70. OT J144252.0−225040
This transient (=CSS120417:144252−225040; hereafterOT J144252) was detected by CRTS on 2012 April 17.The large outburst amplitude received attention (vsnet-alert 14448). Subsequent observations detected super-humps (vsnet-alert 14455, 14457; figure 67). The timesof superhump maxima are listed in table 72. A clear pat-tern of stages B and C can be recognized. Despite thelarge outburst amplitude and the lack of past outburstsin the CRTS data, the O−C diagram resembles those ofordinary SU UMa-type dwarf novae rather than those ofextreme WZ Sge-type dwarf novae.
3.71. OT J144453.1−131118
This transient (=CSS120424:144453−131118; hereafterOT J144453) was detected by CRTS on 2012 April 24.There was a past outburst in 2005 December. Althoughthere was a hint of superhumps in the first observa-tion (vsnet-alert 14491), confirmatory observations be-came available after 4 d (vsnet-alert 14507). Later obser-vations well characterized superhumps (vsnet-alert 14516,14522, 14530; figure 68). The times of superhump max-ima are listed in table 73. There was no hint of periodvariation. By taking the long initial gap of observationinto account, we likely observed stage C superhumps. Itis not, however, excluded that this object has a virtuallyzero Pdot as in some long-Porb systems.

62 T. Kato et al. [Vol. ,
0.062 0.063 0.064 0.065 0.066 0.067 0.068
0.6
0.8
1.0
(d)
θ
P=0.06503
−0.5 0.0 0.5 1.0 1.50.10
0.05
0.00
−0.05
−0.10
Fig. 67. Superhumps in OT J144252 (2012). (Upper): PDManalysis. (Lower): Phase-averaged profile.
3.72. OT J145921.8+354806
This transient (=CSS110613:145922+354806; hereafterOT J145921) was detected by CRTS on 2011 June 13.There was an earlier outburst in 2008 April. Subsequentobservations detected superhumps (vsnet-alert 13427; fig-ure 69). The times of superhump maxima are listed intable 74. The large amplitudes of the superhumps suggestthat the outburst was detected in a relatively early stage.The resultant Pdot was less likely negative, as expectedfor an object with this PSH, and may be even positive.The object may be analogous to GX Cas (cf. Kato et al.2012a) which showed a large positive Pdot despite its longPSH.
3.73. OT J155631.0−080440
The object was detected as a transient(=CSS090321:155631−080440; hereafter OT J155631) byCRTS on 2009 March 21. Although several outburstswere recorded since then, the 2012 March outburst wasthe brightest (15.3 mag) in its history. Superhumps weresoon detected (vsnet-alert 14406, 14416; figure 70). Thetimes of superhump maxima are listed in table 75.
Table 72. Superhump maxima of OT J144252 (2012).
E max∗ error O−C† N ‡
0 56035.6984 0.0015 −0.0041 781 56035.7648 0.0010 −0.0027 892 56035.8322 0.0007 −0.0003 143 56035.8949 0.0006 −0.0025 1812 56036.4809 0.0004 −0.0013 14013 56036.5455 0.0006 −0.0017 15214 56036.6126 0.0010 0.0004 7515 56036.6742 0.0011 −0.0030 1218 56036.8697 0.0009 −0.0024 1827 56037.4552 0.0007 −0.0017 15028 56037.5212 0.0008 −0.0006 13329 56037.5855 0.0011 −0.0014 1330 56037.6543 0.0016 0.0024 1433 56037.8448 0.0014 −0.0020 1734 56037.9103 0.0021 −0.0014 1344 56038.5666 0.0031 0.0051 1345 56038.6260 0.0017 −0.0004 1348 56038.8248 0.0013 0.0034 1449 56038.8921 0.0032 0.0057 1859 56039.5453 0.0018 0.0092 1260 56039.6056 0.0015 0.0045 1361 56039.6725 0.0012 0.0064 1164 56039.8669 0.0013 0.0059 1975 56040.5781 0.0013 0.0023 1376 56040.6422 0.0017 0.0014 1379 56040.8370 0.0012 0.0013 1880 56040.9001 0.0021 −0.0006 1790 56041.5552 0.0069 0.0048 991 56041.6086 0.0013 −0.0068 13106 56042.5791 0.0034 −0.0109 13107 56042.6463 0.0026 −0.0087 13∗BJD−2400000.†Against max = 2456035.7025+ 0.064977E.‡Number of points used to determine the maximum.
3.74. OT J160410.6+145618
The object was detected as a transient(=CSS120326:160411+145618; hereafter OT J160410) byCRTS on 2012 March 26. There was another outburst in2010 July (CRTS data). The large (>5 mag) outburstamplitude was noted (vsnet-alert 14384). Although therewas only a single-night observation, two superhumpmaxima were recorded: BJD 2456014.5194(8) (N = 35)and BJD 2456014.5841(11) (N = 34). The superhumpperiod by the PDM method is 0.0656(5) d.
3.75. OT J162806.2+065316
The object was detected as a transient(=CSS110611:162806+065316; hereafter OT J162806) byCRTS on 2011 June 11. The object had been selectedas a candidate for QSO based on SDSS colors (Richardset al. 2009). The existence of two previous outbursts inthe CRTS data confirmed the DN-type nature (vsnet-alert 13413). The object was soon confirmed to show
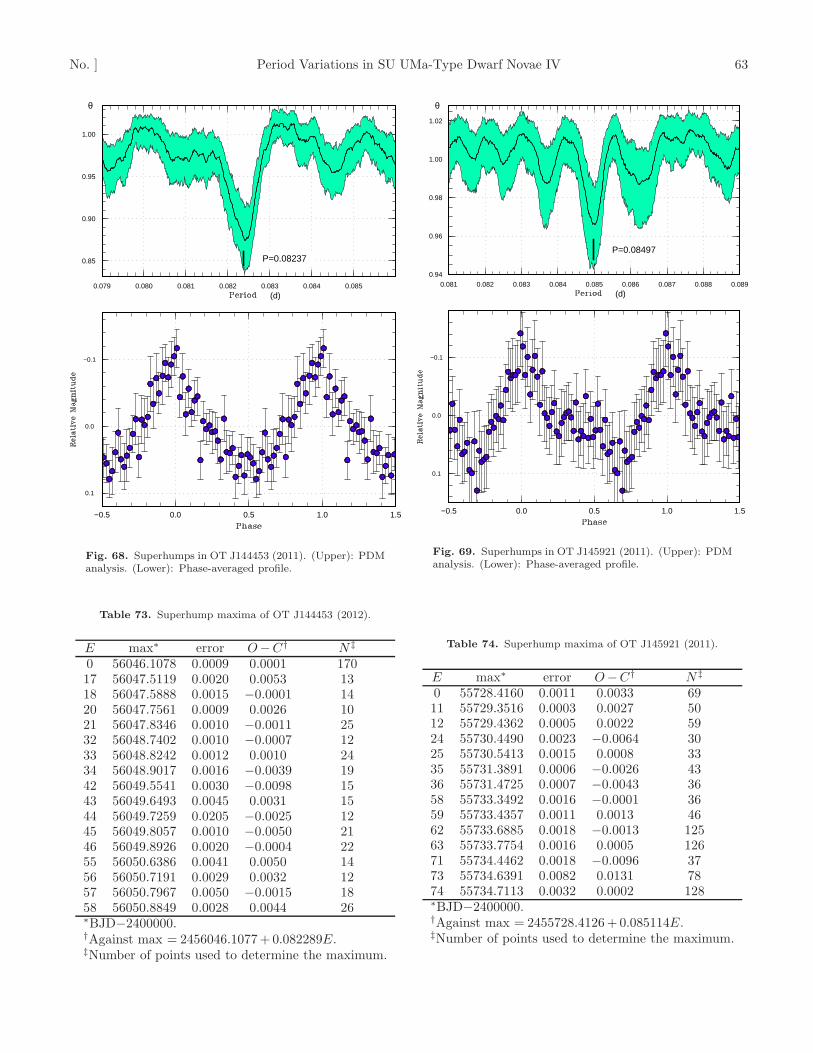
No. ] Period Variations in SU UMa-Type Dwarf Novae IV 63
0.079 0.080 0.081 0.082 0.083 0.084 0.085
0.85
0.90
0.95
1.00
(d)
θ
P=0.08237
−0.5 0.0 0.5 1.0 1.5
0.1
0.0
−0.1
Fig. 68. Superhumps in OT J144453 (2011). (Upper): PDManalysis. (Lower): Phase-averaged profile.
Table 73. Superhump maxima of OT J144453 (2012).
E max∗ error O−C† N ‡
0 56046.1078 0.0009 0.0001 17017 56047.5119 0.0020 0.0053 1318 56047.5888 0.0015 −0.0001 1420 56047.7561 0.0009 0.0026 1021 56047.8346 0.0010 −0.0011 2532 56048.7402 0.0010 −0.0007 1233 56048.8242 0.0012 0.0010 2434 56048.9017 0.0016 −0.0039 1942 56049.5541 0.0030 −0.0098 1543 56049.6493 0.0045 0.0031 1544 56049.7259 0.0205 −0.0025 1245 56049.8057 0.0010 −0.0050 2146 56049.8926 0.0020 −0.0004 2255 56050.6386 0.0041 0.0050 1456 56050.7191 0.0029 0.0032 1257 56050.7967 0.0050 −0.0015 1858 56050.8849 0.0028 0.0044 26∗BJD−2400000.†Against max = 2456046.1077+ 0.082289E.‡Number of points used to determine the maximum.
0.081 0.082 0.083 0.084 0.085 0.086 0.087 0.088 0.0890.94
0.96
0.98
1.00
1.02
(d)
θ
P=0.08497
−0.5 0.0 0.5 1.0 1.5
0.1
0.0
−0.1
Fig. 69. Superhumps in OT J145921 (2011). (Upper): PDManalysis. (Lower): Phase-averaged profile.
Table 74. Superhump maxima of OT J145921 (2011).
E max∗ error O−C† N ‡
0 55728.4160 0.0011 0.0033 6911 55729.3516 0.0003 0.0027 5012 55729.4362 0.0005 0.0022 5924 55730.4490 0.0023 −0.0064 3025 55730.5413 0.0015 0.0008 3335 55731.3891 0.0006 −0.0026 4336 55731.4725 0.0007 −0.0043 3658 55733.3492 0.0016 −0.0001 3659 55733.4357 0.0011 0.0013 4662 55733.6885 0.0018 −0.0013 12563 55733.7754 0.0016 0.0005 12671 55734.4462 0.0018 −0.0096 3773 55734.6391 0.0082 0.0131 7874 55734.7113 0.0032 0.0002 128∗BJD−2400000.†Against max = 2455728.4126+ 0.085114E.‡Number of points used to determine the maximum.

64 T. Kato et al. [Vol. ,
0.086 0.088 0.090 0.092 0.0940.2
0.4
0.6
0.8
(d)
θ
P=0.08930
−0.5 0.0 0.5 1.0 1.5
0.1
0.0
−0.1
−0.2
Fig. 70. Superhumps in OT J155631 (2012). (Upper): PDManalysis. (Lower): Phase-averaged profile.
Table 75. Superhump maxima of OT J155631 (2012).
E max∗ error O−C† N ‡
0 56017.2322 0.0007 −0.0021 921 56017.3236 0.0005 −0.0000 9518 56018.8443 0.0013 0.0024 1329 56019.8257 0.0020 0.0015 1030 56019.9149 0.0019 0.0013 1440 56020.8067 0.0025 0.0001 941 56020.8928 0.0029 −0.0032 21∗BJD−2400000.†Against max = 2456017.2343+ 0.089309E.‡Number of points used to determine the maximum.
0.0670 0.0675 0.0680 0.0685 0.0690 0.0695 0.0700 0.0705
0.4
0.6
0.8
1.0
(d)
θ
P=0.06882
−0.5 0.0 0.5 1.0 1.5
0.10
0.05
0.00
−0.05
−0.10
Fig. 71. Superhumps in OT J162806 (2011). (Upper): PDManalysis. (Lower): Phase-averaged profile.
Table 76. Superhump maxima of OT J162806 (2011).
E max∗ error O−C† N ‡
0 55724.4545 0.0003 0.0009 6713 55725.3473 0.0005 −0.0013 3814 55725.4175 0.0003 0.0000 6415 55725.4866 0.0003 0.0003 55139 55734.0220 0.0012 −0.0013 105140 55734.0935 0.0022 0.0014 99∗BJD−2400000.†Against max = 2455724.4536+ 0.068847E.‡Number of points used to determine the maximum.
superhumps (vsnet-alert 13416; figure 71). The times ofsuperhump maxima are listed in table 76.
3.76. OT J163942.7+122414
The object was originally detected as a transient(=CSS080131:163943+122414; hereafter OT J163942) byCRTS on 2008 January 31. We observed the 2012 Apriloutburst detected by the CRTS. The observations con-firmed the presence of superhumps (vsnet-alert 14474; fig-ure 72). The times of superhump maxima are listed intable 77. The period in table 2 refers to the result of the

No. ] Period Variations in SU UMa-Type Dwarf Novae IV 65
0.084 0.086 0.088 0.090 0.092 0.094
0.2
0.4
0.6
0.8
1.0
(d)
θ
P=0.08858
−0.5 0.0 0.5 1.0 1.5
0.1
0.0
−0.1
−0.2
Fig. 72. Superhumps in OT J163942 (2012). (Upper): PDManalysis. The alias was selected by O−C analysis of a contin-uous run on a single night. (Lower): Phase-averaged profile.
Table 77. Superhump maxima of OT J163942 (2012).
E max∗ error O−C† N ‡
0 56039.5603 0.0007 −0.0000 8822 56041.5094 0.0024 0.0009 3323 56041.5962 0.0011 −0.0008 39∗BJD−2400000.†Against max = 2456039.5603+ 0.088554E.‡Number of points used to determine the maximum.
PDM analysis. The object appears to be a long-Porb sys-tem with frequent outbursts based on numerous outburstdetections by the CRTS.
3.77. OT J170609.7+143452
The object was originally detected as a transient(=CSS090205:170610+143452; hereafter OT J170609) byCRTS on 2009 February 5. Although superhumps weredetected during the 2009 outburst (vsnet-alert 11061), theperiod was not well determined because the object fadedquickly after this observation.The object underwent another outburst in 2011 June
(CRTS detection, see also vsnet-alert 13456). Although
0.056 0.058 0.060 0.062 0.0640.2
0.4
0.6
0.8
1.0
(d)
θ
P=0.05946
−0.5 0.0 0.5 1.0 1.5
0.10
0.05
0.00
−0.05
−0.10
Fig. 73. Superhumps in OT J170609 (2011). (Upper): PDManalysis. (Lower): Phase-averaged profile.
Table 78. Superhump maxima of OT J170609 (2011).
E max∗ error O−C† N ‡
0 55745.5333 0.0006 −0.0017 591 55745.5963 0.0015 0.0018 3115 55746.4283 0.0004 −0.0003 5716 55746.4884 0.0004 0.0002 60∗BJD−2400000.†Against max = 2455745.5350+ 0.059578E.‡Number of points used to determine the maximum.
the object once faded (vsnet-alert 13464), it showed arebrightening in July (vsnet-alert 13481). The outburstturned out to be a superoutburst preceded by a precursor.Observations on two nights yielded a likely superhump pe-riod of 0.05946(8) d (PDM analysis; figure 73), althoughone-day aliases cannot be perfectly excluded. The selec-tion of the alias appears to be justified by independentlydetermined spectroscopic period of 0.0582 d (Thorstensen,Skinner 2012), yielding an ǫ of 2.2%. The times of super-hump maxima are listed in table 78.

66 T. Kato et al. [Vol. ,
3.78. OT J173516.9+154708
The object was detected as a transient(=CSS110623:173517+154708; hereafter OT J173516) byCRTS on 2011 June 23. The object was also in outburstin GSC 1.2. Although early observations already recordedsuperhump-like modulations (vsnet-alert 13465, 13468,13470), the times of maxima could not be well expressedby any trial period (vsnet-alert 13473, 13482). Althoughthe main power of periodicities was recorded in a rangeof 0.05–0.06 d, we could not sort out a single superhumpperiod at the time of the observation. On July 9, theobject entered a rapid decline phase.Using the best part (June 26–29) of our observation be-
fore the rapid decline, there appeared to be two strongsignals around 0.05436 d and 0.05827 d with the PDManalysis. The lasso analysis, which is less affected bythe window function, yielded the same two signals (fig-ure 74). By partially subtracting mean profiles from theobservations folded by each period, we have been able todecompose the light curve into these periods (figure 75).A simple superposition of these two waves has been shownto express the observation fairly well (figure 76).The exact identifications of these periodicities are yet
unclear. It might be that the shorter period is Porb andthe longer period is PSH. In this case, however, the ǫis 7.2%, extremely too large for this Porb, and none ofnon-eclipsing SU UMa-type dwarf novae have yet shownsimilar amplitudes of orbital humps and superhumps atthe same time. We suggest an alternative interpretationthat the longer period is Porb and the shorter period rep-resents negative superhumps. The small amplitude of su-perhumps, compared to that of orbital humps, may be rec-onciled if negative superhumps were indeed excited. Theexact identification of the periods should await future ob-servations.
3.79. OT J184228.1+483742
This object (hereafter OT J184228) was discovered H.Nishimura on 2011 September 5.5293 UT at an unfilteredCCD magnitude of 11.8 (=PNV J18422792+4837425;Nakano et al. 2011). S. Kiyota’s early multicolor photom-etry already suggested the dwarf nova-type nature (vsnet-alert 13645). M. Fujii, A. Ayani, C. Buil (vsnet-alert13650, 13651, 13655) and A. Arai6 reported spectra, all ofwhich indicated Balmer lines in absorption with emissioncores for Hα and Hβ, indicating that the object is indeed adwarf nova in outburst. The relatively narrow absorptionsuggested a low-inclination of this object. U. Munari alsoreported a spectrum (Nakano et al. 2011). Although therewere small-amplitude variations, the object started rapidfading on September 25 before the development of super-humps (we call this outburst “first plateau phase”; vsnet-alert 13703). The object brightened again on October 3(vsnet-alert 13713) and object further brightened to thesecond plateau phase. During this plateau phase, ordinarysuperhumps finally developed (vsnet-alert 13726, 13728,
6 <http://www.cbat.eps.harvard.edu/unconf/followups/J18422792+4837425.html>.
0.045 0.050 0.055 0.060 0.065 0.070
0.8
0.9
1.0
(d)
θ
0.045 0.050 0.055 0.060 0.065 0.070
0.000
0.001
0.002
0.003
Fig. 74. Period analysis in OT J173516 (2011). (Upper):PDM analysis. (Lower): lasso analysis (logλ=−6.42).
13729). Such development of the outburst was unprece-dented in dwarf novae. On October 18, the object enterthe rapid fading stage (vsnet-alert 13775). The object re-mained above quiescence even following the rapid decline,and there was another rebrightening following the secondplateau phase (Katysheva et al. in preparation).The times of superhump maxima during the second
plateau phase and post-superoutburst stage are listed intable 79. The epochs E=0,1 were recorded during the riseto the second plateau phase. The times for E > 206 wererecorded during the post-superoutburst stage. Althoughthe humps were clearly detected, the cycle counts forthe latter maxima were slightly uncertain. As seen fromE =413 and E =428, there appeared to have been doublemaxima during one superhump cycle. The short visibil-ity in the evening during this stage hindered unambiguousidentification of the nature of these maxima. We identi-fied E ≤ 64 as the stage A superhumps because the su-perhumps evolved during this stage, and subsequent su-perhumps as stage B superhumps. These stages, however,may be inadequate considering the peculiar evolution ofthe entire outburst. In determining the period of stage Asuperhumps, we disregarded E =0,1. The period of stageB superhumps was very stable, and Pdot was almost zero.

No. ] Period Variations in SU UMa-Type Dwarf Novae IV 67
−0.5 0.0 0.5 1.0 1.5
0.02
0.00
−0.02
P=0.05436
−0.5 0.0 0.5 1.0 1.5
0.02
0.00
−0.02
P=0.05827
Fig. 75. Profiles of two periodicities in OT J173516 (2011).
Although these superhumps bore more characteristics ofstage C superhumps in ordinary SU UMa-type dwarf no-vae, the identification of the nature should await future re-search. The amplitudes of superhumps were small (0.045mag in full amplitude in average), suggesting a weak man-ifestation of the tidal instability.During the first plateau phase, there was a possible sig-
nal of early superhumps with a period of 0.07168(1) d(figure 78). Since the signal had only a small amplitude,exact identification of the orbital period should await fu-ture observations. Assuming that this period is close tothe orbital period, we obtained an ǫ of 0.9%, comparableto those of short-Porb WZ Sge-type dwarf novae, but isunusually small for a Porb =0.07168 d object. This mightsuggest the presence of an anomalously undermassive sec-ondary and this object could be a good candidate for aperiod bouncer.The unique feature of the outburst evolution might be
also understood if the mass-ratio is anomalously low asexplained in the following scenario. (1) The disk initiallyexpanded enough to trigger the 2:1 resonance. (2) Thedisk started to cool down before the 3:1 resonance gov-erns as in ordinary WZ Sge-type dwarf novae, and theobject underwent a temporary excursion to a quiescentstate, then (3) the 3:1 resonance started to grow slowly,
39.3 39.4 39.5 39.6 39.70.10
0.05
0.00
−0.05
−0.10
40.3 40.4 40.5 40.6 40.70.10
0.05
0.00
−0.05
−0.10
40.9 41.0 41.1 41.2 41.30.10
0.05
0.00
−0.05
−0.10
41.9 42.0 42.1 42.2 42.30.10
0.05
0.00
−0.05
−0.10
Fig. 76. Synthesized light curve of OT J173516 (2011).
The points represent observations. The curves representthe expected light curve by adding two waves in figure 75.
and triggered a second thermal instability and entered thesecond plateau phase. The second plateau phase appar-ently started from an inside-out type outburst, as sug-gested by the slow rise. The small amplitude probablyreflect the weak tidal torque resulting from a low mass-ratio.The object resembles in its long Porb and apparently in
its low mass-ratio, suggesting a brown-dwarf secondary,the famous CV GD 552 (Hessman, Hopp 1990; Unda-Sanzana et al. 2008), which had never been observed toundergo an outburst (cf. Richter 1990). If GD 552 wereto undergo an outburst, we might expect a phenomenonsimilar to OT J184228.A more detailed analysis will be reported in Ohshima
et al., in preparation.
3.80. OT J210950.5+134840
This object (hereafter OT J210950) was discoveredas a possible nova (=PNV J21095047+1348396) by K.Itagaki as an 11.5 mag (unfiltered CCD magnitude) ob-ject (Yamaoka et al. 2011). Although the initial discov-ery announcement suggested the absence of the quiescent

68 T. Kato et al. [Vol. ,
Table 79. Superhump maxima of OT J184228 (2011).
E max∗ error O−C† N ‡
0 55838.9637 0.0022 −0.0366 1721 55839.0387 0.0005 −0.0341 8317 55840.2225 0.0011 −0.0097 16418 55840.2982 0.0009 −0.0065 32219 55840.3668 0.0007 −0.0104 27022 55840.5828 0.0017 −0.0117 5131 55841.2434 0.0017 −0.0033 10432 55841.3122 0.0009 −0.0070 7633 55841.3884 0.0003 −0.0032 21134 55841.4617 0.0008 −0.0024 13435 55841.5395 0.0019 0.0029 9136 55841.6068 0.0005 −0.0023 15437 55841.6791 0.0008 −0.0024 11341 55841.9707 0.0011 −0.0007 22142 55842.0431 0.0015 −0.0007 35543 55842.1302 0.0046 0.0139 3645 55842.2669 0.0011 0.0057 7646 55842.3374 0.0019 0.0037 7649 55842.5624 0.0008 0.0113 11850 55842.6314 0.0006 0.0079 13156 55843.0700 0.0024 0.0117 8758 55843.1943 0.0071 −0.0090 5659 55843.2815 0.0018 0.0058 7660 55843.3504 0.0022 0.0022 7563 55843.5736 0.0010 0.0080 16464 55843.6538 0.0017 0.0158 12465 55843.7276 0.0020 0.0171 6568 55843.9248 0.0013 −0.0030 17269 55843.9854 0.0023 −0.0149 16573 55844.3040 0.0008 0.0139 6074 55844.3727 0.0011 0.0100 7475 55844.4453 0.0010 0.0102 7276 55844.5252 0.0010 0.0176 4777 55844.5898 0.0011 0.0098 4782 55844.9495 0.0010 0.0072 11484 55845.0895 0.0020 0.0022 10487 55845.3107 0.0012 0.0060 7388 55845.3790 0.0015 0.0019 7289 55845.4512 0.0022 0.0016 64100 55846.2521 0.0009 0.0054 157101 55846.3275 0.0005 0.0083 254102 55846.4008 0.0008 0.0092 283103 55846.4745 0.0024 0.0103 46109 55846.9046 0.0013 0.0057 74114 55847.2699 0.0015 0.0087 226115 55847.3359 0.0017 0.0022 280128 55848.2806 0.0014 0.0049 70129 55848.3479 0.0012 −0.0002 144130 55848.4222 0.0020 0.0015 145141 55849.2102 0.0164 −0.0075 109142 55849.2933 0.0024 0.0030 257∗BJD−2400000.†Against max = 2455839.0003+ 0.072464E.‡Number of points used to determine the maximum.
0.0710 0.0715 0.0720 0.0725 0.0730 0.0735 0.0740
0.96
0.97
0.98
0.99
1.00
(d)
θ
P=0.07246
−0.5 0.0 0.5 1.0 1.5
0.04
0.02
0.00
−0.02
−0.04
Fig. 77. Superhumps in OT J184228 (2011). (Upper): PDManalysis. (Lower): Phase-averaged profile.
counterpart, independent examinations of plate archivesindicated the presence of an 18–19 mag counterpart (S.Korotkiy, vsnet-alert 13342; E. Guido and G. Sostero,Yamaoka et al. 2011, vsnet-alerr 13344). It was alreadysuggested to be a WZ Sge-type dwarf nova with an ampli-tude exceeding 7 mag (vsnet-alert 13341). D. Denisenkoalso noted the presence of an M-dwarf having a com-mon proper motion and the detection of this object inGALEX UV data (vsnet-alert 13343). Although only low-amplitude variations were detected soon after the discov-ery, superhumps appeared on May 30, 6 d after the dis-covery (vsnet-alert 13359). The obtained period was notsuggestive of an extreme WZ Sge-type dwarf nova. Therewas a hint of evolving (double wave) superhumps on May28 (vsnet-alert 13363). The object was spectroscopicallyconfirmed to be a dwarf nova (Yamaoka et al. 2011).The times of superhump maxima are listed in table 80.
Distinct stages of A–C are present. Although the last twoepochs were measured after the rapid fading, the times ofmaxima were well on the extension of the timings of stageC superhumps recorded before the rapid fading, and weconsider them as persisting stage C superhumps as we al-ready reported in earlier papers (Kato et al. 2009; Katoet al. 2010; Kato et al. 2012a). The resultant Pdot for thestage B was +8.5(0.6)×10−5, whose large value is consis-tent with the idea that this object is not an extreme WZ

No. ] Period Variations in SU UMa-Type Dwarf Novae IV 69
0.0700 0.0705 0.0710 0.0715 0.0720 0.0725 0.0730
0.996
0.998
1.000
(d)
θ
P=0.07168
−0.5 0.0 0.5 1.0 1.5
0.005
0.000
−0.005
Fig. 78. Possible early superhumps in OT J184228 (2011).(Upper): PDM analysis. (Lower): Phase-averaged profile.
Sge-type dwarf nova. No post-superoutburst rebrighten-ing was recorded. CRTS data7 did not record a prior out-burst, and the data indicated that the object remainedbrighter than quiescence five months after the outburst.These features suggest that the outburst frequency is low,and the presence of a long-fading tail looks like those ofWZ Sge-type dwarf novae (e.g. GW Lib, figure 33 in Katoet al. 2009). The object may be a WZ Sge-type dwarf novawith non-extreme properties, and showed a type-D super-outburst in terms of the lack of a post-superoutburst re-brightening. The Pdot-ǫ relation (equation 6 in Kato et al.2009) suggests ǫ of 2.6%.In the PDM analysis (figure 79) there seems to be a
slightly enhanced signal shorter than PSH, we employedlasso analysis to detect the possible Porb. The obtainedcandidate period was 0.05865(1) d, suggesting ǫ for stageB superhumps of 2.4%. Although this period is close towhat was expected from the Pdot-ǫ relation, it needs to betested by future observations.
3.81. OT J214738.4+244553
The object was detected as a transient(=CSS111004:214738+244554; hereafter OT J214738) by
7 <http://nesssi.cacr.caltech.edu/catalina/20110606/1106061121124182967p.html>
Table 79. Superhump maxima of OT J184228 (2011) (con-tinued).
E max∗ error O−C† N ‡
143 55849.3628 0.0013 0.0001 216144 55849.4368 0.0021 0.0016 141156 55850.3115 0.0015 0.0068 156157 55850.3759 0.0013 −0.0013 138158 55850.4445 0.0018 −0.0051 138165 55850.9518 0.0014 −0.0051 150170 55851.3083 0.0032 −0.0109 54171 55851.3874 0.0041 −0.0043 71183 55852.2622 0.0018 0.0009 187184 55852.3280 0.0007 −0.0057 271185 55852.4003 0.0010 −0.0059 272186 55852.4717 0.0010 −0.0069 126192 55852.9039 0.0011 −0.0095 167193 55852.9774 0.0014 −0.0085 251194 55853.0539 0.0018 −0.0044 150198 55853.3424 0.0045 −0.0058 65199 55853.4125 0.0026 −0.0082 55198 55853.3424 0.0045 −0.0058 65206 55853.9201 0.0018 −0.0078 110226 55855.3771 0.0010 −0.0001 56321 55862.2628 0.0015 0.0016 27377 55866.3262 0.0018 0.0070 19413 55868.9431 0.0010 0.0152 79428 55869.9909 0.0009 −0.0241 91472 55873.2097 0.0053 0.0064 9∗BJD−2400000.†Against max = 2455839.0003+ 0.072464E.‡Number of points used to determine the maximum.
CRTS on 2011 October 4. ASAS-3 (Pojmanski 2002)recorded additional three outbursts. Subsequent obser-vations recorded superhumps (vsnet-alert 13720, 13721;figure 80). The times of superhump maxima are listedin table 81. Although it is unclear whether we indeedobserved the early stage of the outburst, the superhumpsfor E ≤ 20 appears to be stage A superhumps. Therewas no clear transition to stage C, and Pdot for E ≤ 20was +8.8(1.0)× 10−5 anomalously high for a long-PSH
system. The behavior resembles those of SDSS J170213(subsection 3.53) and GX Cas (Kato et al. 2012a). Thereis a strong signal at 0.09273(3) d (see figure 80), whichwe interpret as the orbital period. Assuming this period,the ǫ for the mean PSH is 4.9%.
3.82. OT J215818.5+241925
This object (hereafter OT J215818) is an object re-ported by G. Sun and X. Gao to Central Bureaufor Astronomical Telegrams (CBAT) Transient ObjectsConfirmation Page (TOCP) originally suspected to be anova (=PNV J21581852+2419246). Soon after the dis-covery, R. Koff8 detected modulations similar to super-humps. This finding was confirmed by subsequent obser-
8 <http://www.cbat.eps.harvard.edu/unconf/followups/J21581852+2419246.html>.

70 T. Kato et al. [Vol. ,
Table 80. Superhump Maxima of OT J210950 (2011).
E max∗ error O−C† N ‡
0 55710.5319 0.0009 −0.0188 1681 55710.5897 0.0008 −0.0211 16827 55712.1758 0.0006 0.0044 9628 55712.2356 0.0003 0.0042 9234 55712.5982 0.0002 0.0066 10437 55712.7804 0.0003 0.0088 8738 55712.8401 0.0002 0.0084 10439 55712.9005 0.0002 0.0088 12254 55713.7970 0.0002 0.0049 17055 55713.8564 0.0003 0.0043 8771 55714.8117 0.0004 −0.0008 8672 55714.8706 0.0004 −0.0019 8677 55715.1733 0.0008 0.0006 3878 55715.2326 0.0004 −0.0001 4884 55715.5900 0.0003 −0.0028 11587 55715.7693 0.0004 −0.0036 6188 55715.8315 0.0004 −0.0015 7489 55715.8904 0.0004 −0.0026 75104 55716.7890 0.0004 −0.0043 72105 55716.8497 0.0002 −0.0036 146106 55716.9099 0.0004 −0.0035 142117 55717.5703 0.0003 −0.0033 168117 55717.5703 0.0003 −0.0034 167121 55717.8098 0.0006 −0.0040 106122 55717.8708 0.0008 −0.0030 82128 55718.2312 0.0005 −0.0027 101148 55719.4352 0.0008 0.0008 120165 55720.4667 0.0013 0.0119 122166 55720.5259 0.0010 0.0110 133187 55721.7886 0.0020 0.0132 68188 55721.8463 0.0010 0.0109 69220 55723.7585 0.0029 0.0023 35221 55723.8227 0.0008 0.0064 48222 55723.8818 0.0013 0.0055 49288 55727.8236 0.0018 −0.0143 82289 55727.8802 0.0019 −0.0178 93∗BJD−2400000.†Against max = 55710.5507+ 0.060025E.‡Number of points used to determine the maximum.
Table 81. Superhump maxima of OT J214738 (2011).
E max∗ error O−C† N ‡
0 55839.3213 0.0002 −0.0289 2441 55839.4206 0.0002 −0.0270 25010 55840.3196 0.0002 −0.0038 25311 55840.4178 0.0003 −0.0029 29712 55840.5161 0.0003 −0.0019 25213 55840.6173 0.0005 0.0020 26014 55840.7175 0.0004 0.0049 14021 55841.4019 0.0002 0.0081 40822 55841.5001 0.0003 0.0090 23724 55841.6948 0.0003 0.0090 17525 55841.7914 0.0002 0.0083 18627 55841.9864 0.0002 0.0087 16028 55842.0864 0.0003 0.0114 8831 55842.3748 0.0005 0.0078 15232 55842.4717 0.0003 0.0074 32733 55842.5686 0.0003 0.0070 13534 55842.6645 0.0003 0.0056 23735 55842.7619 0.0006 0.0057 6444 55843.6347 0.0006 0.0027 6045 55843.7323 0.0004 0.0030 6951 55844.3131 0.0006 −0.0001 11052 55844.4106 0.0007 0.0001 13753 55844.5068 0.0008 −0.0011 9655 55844.7015 0.0002 −0.0009 25156 55844.7976 0.0002 −0.0022 21265 55845.6732 0.0006 −0.0024 14266 55845.7686 0.0003 −0.0043 18671 55846.2559 0.0004 −0.0036 16372 55846.3539 0.0003 −0.0029 38173 55846.4503 0.0003 −0.0038 40375 55846.6462 0.0051 −0.0026 9476 55846.7457 0.0004 −0.0004 18382 55847.3285 0.0003 −0.0015 18086 55847.7168 0.0004 −0.0024 18387 55847.8098 0.0007 −0.0067 16696 55848.6900 0.0007 −0.0024 10197 55848.7888 0.0007 −0.0009 102107 55849.7643 0.0017 0.0015 24∗BJD−2400000.†Against max = 2455839.3502+ 0.097313E.‡Number of points used to determine the maximum.

No. ] Period Variations in SU UMa-Type Dwarf Novae IV 71
0.057 0.058 0.059 0.060 0.061 0.062 0.063
0.85
0.90
0.95
1.00
(d)
θ
P=0.05993
−0.5 0.0 0.5 1.0 1.5
0.04
0.02
0.00
−0.02
−0.04
−0.06
Fig. 79. Superhumps in OT J210950 (2011). (Upper): PDManalysis. (Lower): Phase-averaged profile.
vations (vsnet-alert 13803, 13805, 13807; figure 81), andthe dwarf nova-type nature was confirmed. The times ofsuperhump maxima are listed in table 82. The O−C dia-gram shows typical stage B and C superhumps. The Pdot
for stage B superhumps was not meaningfully determinedbecause the outburst was apparently observed only dur-ing its late course. Shears et al. (2012b) reported a Pdot
of 0.06728(21) d using a slightly different data set andobtained a similar pattern of O −C variation with thisanalysis. Shears et al. (2012b) also reported the possiblepresence of an orbital signal at 0.06606(35) d. Our anal-ysis yielded only a very weak signal (see figure 81), andit appears to be still inconclusive. Using lasso, we mea-sured a period of 0.06607(5) d assuming that it is a realperiodicity.
3.83. OT J221232.0+160140
The object was detected as a transient (=CSS090911:221232+160140; hereafter OT J221232) by CRTSon 2009 September 11. A bright outburst was detected on2011 December 23 by E. Muyllaert (BAAVSS alert 2804).Subsequent observations confirmed the presence of super-humps (vsnet-alert 14017, 14018, 14020; figure 82). Thetimes of superhump maxima are listed in table 83. Theearly stage of the outburst was not observed. There was
0.092 0.094 0.096 0.098 0.100
0.92
0.94
0.96
0.98
1.00
(d)
θ
P=0.09727
−0.5 0.0 0.5 1.0 1.50.10
0.05
0.00
−0.05
−0.10
Fig. 80. Superhumps in OT J214738 (2011). (Upper): PDManalysis. (Lower): Phase-averaged profile.
a likely stage B–C transition around E = 29.
3.84. OT J224736.4+250436
This object (=CSS120616:224736+250436, hereafterOT J224736) is a transient detected by CRTS on 2012June 16. There was a previous outburst in 2006 November(CRTS data). An analysis of the SDSS color using theneural network (Kato et al. 2012b) suggested an objectbelow the period gap (vsnet-alert 14682). Subsequent ob-servation detected superhumps (vsnet-alert 14684; figure83). The times of superhump maxima are listed in table84. Due to the gap in observation, the other 2-d aliases arestill viable. We used the period which gave the smallestresiduals to superhump maxima on individual nights.
3.85. TCP J08461690+3115554
This object (hereafter TCP J084616) is a transient dis-covered by T. Kryachko et al. on 2012 March 19.9 Theobject was soon recognized as a deeply eclipsing SU UMa-type dwarf nova (vsnet-alert 14347, 14348, 14351). Theobject has a g = 21.8 mag SDSS counterpart. Usingthe MCMC method (appendix 1), we obtained an eclipseephemeris of
9 <http://www.cbat.eps.harvard.edu/unconf/followups/J08461690+3115554.html>.

72 T. Kato et al. [Vol. ,
0.064 0.065 0.066 0.067 0.068 0.069 0.070
0.7
0.8
0.9
1.0
(d)
θ
P=0.06731
−0.5 0.0 0.5 1.0 1.5
0.05
0.00
−0.05
−0.10
Fig. 81. Superhumps in OT J215818 (2011). (Upper): PDManalysis. (Lower): Phase-averaged profile.
Min(BJD) = 2456007.33870(6)+0.091383(6)E. (4)
The times of superhumps maxima are listed in table85. A PDM analysis (figure 84) yielded a period of0.09633(11) d, giving ǫ = 5.4(1)%.
3.86. TCP J23130812+2337018
This object (hereafter TCP J231308) was discovered byItagaki and Kaneda as a 14.3 mag (unfiltered CCD magni-tude) object (TCP J23130812+2337018).10 According toASAS-3 data, the object underwent a brighter (V = 13.4)outburst in 2005 August. Subsequent observations con-firmed the presence of superhumps (vsnet-alert 13438; fig-ure 85). The times of superhump maxima are listed intable 86. The O−C values clearly showed a stage B–Ctransition. The observation of stage B was not sufficientlylong to determine Pdot.
4. Discussion
4.1. Period Derivatives during Stage B
As in Kato et al. (2012a), we compared period deriva-tives during stage B (figure 86). The newly obtained Pdot
10 <http://www.cbat.eps.harvard.edu/unconf/followups/J23130812+2337018.html>.
Table 82. Superhump maxima of OT J215818 (2011).
E max∗ error O−C† N ‡
0 55863.2398 0.0003 −0.0043 1341 55863.3048 0.0002 −0.0064 2312 55863.3696 0.0004 −0.0088 2773 55863.4404 0.0002 −0.0051 4384 55863.5061 0.0003 −0.0065 18517 55864.3810 0.0005 −0.0039 7818 55864.4489 0.0002 −0.0031 20919 55864.5162 0.0003 −0.0029 20120 55864.5814 0.0006 −0.0048 20421 55864.6512 0.0003 −0.0021 31822 55864.7198 0.0004 −0.0006 25923 55864.7865 0.0009 −0.0010 9930 55865.2517 0.0023 −0.0056 3131 55865.3245 0.0007 0.0002 11232 55865.3927 0.0004 0.0012 19333 55865.4587 0.0004 0.0002 19534 55865.5280 0.0005 0.0023 15536 55865.6653 0.0004 0.0054 17537 55865.7313 0.0004 0.0044 17540 55865.9351 0.0005 0.0068 11941 55865.9970 0.0009 0.0016 11450 55866.6093 0.0004 0.0100 17951 55866.6757 0.0003 0.0093 22652 55866.7436 0.0004 0.0101 17655 55866.9400 0.0008 0.0052 11656 55867.0100 0.0005 0.0081 7461 55867.3408 0.0008 0.0034 14762 55867.4088 0.0005 0.0042 19363 55867.4778 0.0006 0.0061 14380 55868.6185 0.0009 0.0061 9181 55868.6812 0.0010 0.0017 93125 55871.6216 0.0008 −0.0105 127126 55871.6902 0.0008 −0.0090 176127 55871.7544 0.0018 −0.0119 148∗BJD−2400000.†Against max = 2455863.2441+ 0.067104E.‡Number of points used to determine the maximum.
for object for Porb < 0.076 d followed the trend obtainedin the previous research. There were also two Pdot> 0 sys-tems (SDSS J170213 and OT J145921) for Porb > 0.080 d,as noted in Kato et al. (2012a). Among them, SDSSJ170213 showed infrequent outbursts and indeed resem-bles EF Peg, the representative Pdot ∼ 0 object with along Porb (cf. Kato et al. 2009). The other object, OTJ145921, showed more frequent outbursts and may resem-ble GX Cas, an unexpected object with Pdot > 0 withtypical SU UMa-type outburst behavior. There may betwo classes of objects with Pdot > 0 among SU UMa-typedwarf novae with long Porb.
4.2. Periods of Stage A Superhumps
Stage A superhumps recorded in the present study arelisted in table 87. Although most of objects in this study

No. ] Period Variations in SU UMa-Type Dwarf Novae IV 73
0.080 0.085 0.090 0.095 0.100
0.6
0.8
1.0
(d)
θ
P=0.09017
−0.5 0.0 0.5 1.0 1.5
0.1
0.0
−0.1
−0.2
Fig. 82. Superhumps in OT J221232 (2011). (Upper): PDManalysis. (Lower): Phase-averaged profile.
Table 83. Superhump maxima of OT J221232 (2011).
E max∗ error O−C† N ‡
0 55921.6566 0.0004 −0.0069 936 55922.2042 0.0003 −0.0000 1167 55922.2925 0.0004 −0.0019 12211 55922.6537 0.0005 −0.0012 9114 55922.9302 0.0018 0.0050 4517 55923.1942 0.0005 −0.0015 4818 55923.2872 0.0005 0.0014 9622 55923.6480 0.0005 0.0018 9128 55924.1862 0.0023 −0.0008 8429 55924.2797 0.0007 0.0026 22133 55924.6417 0.0008 0.0040 9055 55926.6221 0.0006 0.0017 8273 55928.2400 0.0004 −0.0026 91106 55931.2153 0.0024 −0.0016 30∗BJD−2400000.†Against max = 2455921.6635+ 0.090126E.‡Number of points used to determine the maximum.
0.054 0.055 0.056 0.057 0.058 0.059
0.0
0.5
1.0
(d)
θ
P=0.05667
−0.5 0.0 0.5 1.0 1.5
0.1
0.0
−0.1
Fig. 83. Superhumps in OT J224736 (2012). (Upper): PDManalysis. (Lower): Phase-averaged profile.
Table 84. Superhump maxima of OT J224736 (2012).
E max∗ error O−C† N ‡
0 56095.4674 0.0005 −0.0005 271 56095.5251 0.0004 0.0005 2836 56097.5076 0.0007 −0.0006 3037 56097.5653 0.0005 0.0005 29∗BJD−2400000.†Against max = 2456095.4679+ 0.056673E.‡Number of points used to determine the maximum.
Table 85. Superhump maxima of TCP J084616 (2012).
E max∗ error O−C† phase‡ N §
0 56007.2977 0.0006 −0.0009 0.35 321 56007.3955 0.0014 0.0006 0.33 2711 56008.3626 0.0046 0.0046 0.62 3512 56008.4500 0.0028 −0.0043 0.59 40∗BJD−2400000.†Against max = 2456007.2986+ 0.096303E.‡Orbital phase.§Number of points used to determine the maximum.

74 T. Kato et al. [Vol. ,
0.090 0.092 0.094 0.096 0.098 0.100
0.4
0.6
0.8
1.0
(d)
θ
P=0.09633
−0.5 0.0 0.5 1.0 1.50.4
0.2
0.0
−0.2
−0.4
Fig. 84. Superhumps in TCP J084616 (2012). (Upper):PDM analysis. (Lower): Phase-averaged profile.
Table 86. Superhump maxima of TCP J231308 (2011).
E max∗ error O−C† N ‡
0 55732.5371 0.0003 −0.0036 1881 55732.6077 0.0002 −0.0041 21214 55733.5369 0.0003 0.0015 9115 55733.6066 0.0003 0.0001 5919 55733.8916 0.0003 0.0009 9423 55734.1796 0.0013 0.0047 17624 55734.2488 0.0014 0.0029 11828 55734.5318 0.0002 0.0017 7829 55734.6024 0.0004 0.0013 5051 55736.1610 0.0034 −0.0031 7456 55736.5193 0.0003 −0.0001 4557 55736.5888 0.0004 −0.0017 4471 55737.5845 0.0003 −0.0006 17685 55738.5799 0.0003 0.0001 199∗BJD−2400000.†Against max = 2455732.5407+ 0.071048E.‡Number of points used to determine the maximum.
0.068 0.069 0.070 0.071 0.072 0.073 0.074
0.6
0.8
1.0
(d)
θ
P=0.07107
−0.5 0.0 0.5 1.0 1.50.10
0.05
0.00
−0.05
−0.10
Fig. 85. Superhumps in TCP J231308 (2011). (Upper):PDM analysis. (Lower): Phase-averaged profile.
0.06 0.07 0.08 0.09
−10
0
10
20
30
Fig. 86. Pdot for stage B versus Porb. Open circles, filledcircles, filled triangles and filled squares represent samples inKato et al. (2009), Kato et al. (2010), Kato et al. (2012a) andthis paper, respectively. The curve represents the spline-s-moothed global trend.

No. ] Period Variations in SU UMa-Type Dwarf Novae IV 75
Table 87. Superhump Periods during Stage A
Object Year period (d) errSV Ari 2011 0.05575 0.00012VW Hyi 2011 0.07770 0.00013BW Scl 2011 0.05623 0.00012PU UMa 2012 0.08382 –
SDSS J080303 2011 0.09540 0.00028SDSS J170213 2011 0.10605 0.00011OT J102842 2012 0.03844 0.00002OT J184228 2011 0.07287 0.00008OT J210950 2011 0.06087 0.00006OT J214738 2011 0.09928 0.00022
0.06 0.07 0.08 0.09 0.10 0.110.00
0.02
0.04
0.06
0.08
First yearSecond year
Third yearFourth year
Fig. 87. Superhump periods during the stage A.Superhumps in this stage has a period typically 1.0–1.5%longer than the one during the stage B. There is a slighttendency of increasing fractional period excess for longer-Porb
systems. The symbols for first, second, third and fourthyears represent data in Kato et al. (2009), Kato et al. (2010),Kato et al. (2012a) and this paper.
followed the trend obtained in the previous study, one ob-ject (SDSS J170213) has a substantially smaller fractionalexcess for stage A superhumps. This may have been eitherdue to small number of observations (insufficient coveragefor stage A), a systematic effect by overlapping eclipses,or the unusual period evolution of this object for this Porb
(cf. subsection 4.1). Although the object may also re-semble short-Porb objects in its small fractional excess forstage A superhumps, this needs to be confirmed by furtherobservations.
4.3. WZ Sge-Type Stars
NewWZ Sge-type dwarf novae and candidates are listedin table 88. Among them PR Her, BW Scl and OTJ184228 were well characterized. SV Ari was observedonly in the late stage of its superoutburst, and SDSSJ220553 and OT J210950 were included in this table due
0.005 0.010 0.015 0.020 0.025 0.030 0.035
0
5
10
ε
Fig. 88. Pdot versus ǫ for WZ Sge-type dwarf novae. Opencircles, filled circles, filled squares and filled stars representoutbursts reported in Kato et al. (2009), Kato et al. (2010),Kato et al. (2012a) and this paper, respectively. The dashedline represents a linear regression for points with ǫ < 0.026 asin Kato et al. (2009) figure 35.
to their resemblance to WZ Sge-type objects in the post-superoutburst behavior. For OT J001952 and OT J055721we have only very limited information and these objectswere included based on the large outburst amplitudes.The relation between Pdot versus ǫ for WZ Sge-type
dwarf novae is shown in figure 88. Although there is atendency of increasing Pdot for objects with larger ǫ asstated in Kato et al. (2009), several objects lie well abovethis relation, as discussed in Kato et al. (2012a). Althoughwe may add two additional examples in the present study,these two objects, SDSS J220553 and PR Her, were notvery well sampled and it is not certain whether these ob-jects are outliers to this relation. The reverse case OTJ184228 is remarkable in that it showed almost zero Pdot.This object was indeed unusual in its “double plateau”superoutburst. The unusually small Pdot may be relatedto the unusual binary parameters (long Porb and smallexpected q), and probably to its evolutionary stage as acandidate period bouncer.Figure 89 indicates the updated relation between Pdot
and Porb and its relation to the type of post-superoutburstrebrightening phenomenon: type-A (long-lasting post-outburst rebrightening), type-B (multiple discrete re-brightenings), type-C (single rebrightening) and type-D(no rebrightening), cf. Kato et al. (2009). In the presentstudy, type-C and type-D superoutbursts followed thesame trend as in the past studies. There is noteworthypresence of a new type-B superoutburst (OT J184228)with an exceptionally long Porb and small Pdot. This pres-ence seems to support the earlier suggestion (Kato et al.2009; Kato et al. 2012a) that type-B superoutbursts areassociated with low-q systems and they are likely periodbouncers.
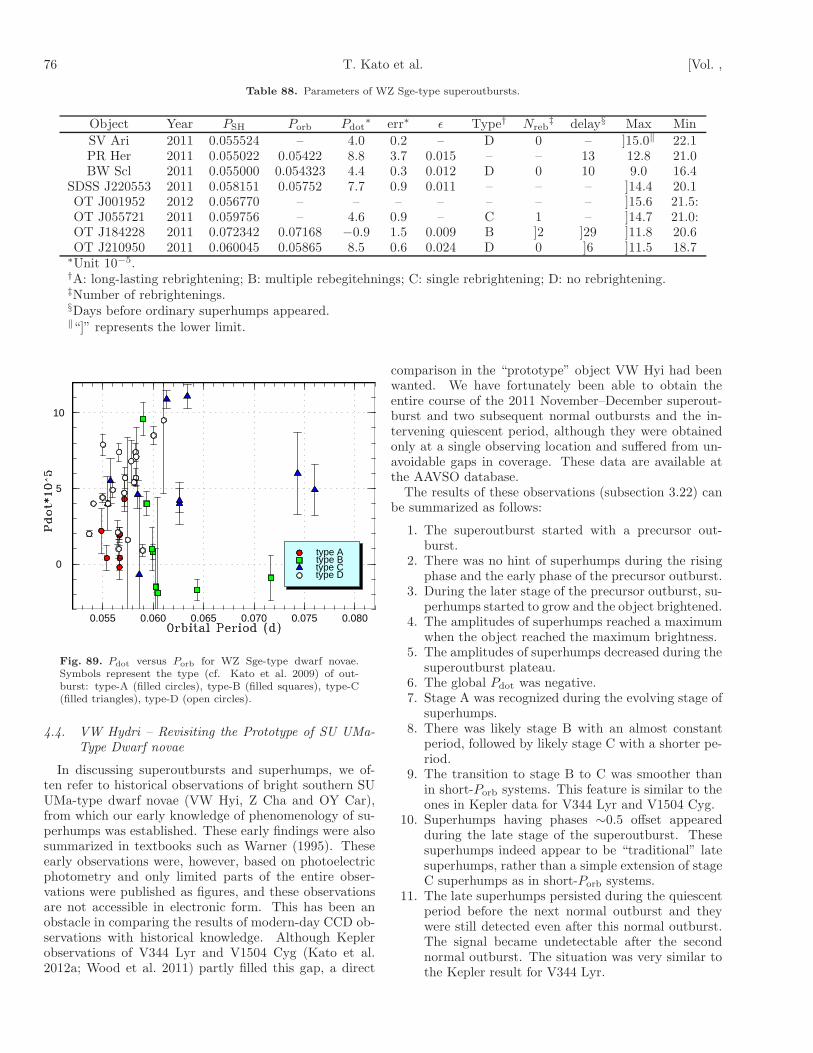
76 T. Kato et al. [Vol. ,
Table 88. Parameters of WZ Sge-type superoutbursts.
Object Year PSH Porb Pdot∗ err∗ ǫ Type† Nreb
‡ delay§ Max Min
SV Ari 2011 0.055524 – 4.0 0.2 – D 0 – ]15.0‖ 22.1PR Her 2011 0.055022 0.05422 8.8 3.7 0.015 – – 13 12.8 21.0BW Scl 2011 0.055000 0.054323 4.4 0.3 0.012 D 0 10 9.0 16.4
SDSS J220553 2011 0.058151 0.05752 7.7 0.9 0.011 – – – ]14.4 20.1OT J001952 2012 0.056770 – – – – – – – ]15.6 21.5:OT J055721 2011 0.059756 – 4.6 0.9 – C 1 – ]14.7 21.0:OT J184228 2011 0.072342 0.07168 −0.9 1.5 0.009 B ]2 ]29 ]11.8 20.6OT J210950 2011 0.060045 0.05865 8.5 0.6 0.024 D 0 ]6 ]11.5 18.7
∗Unit 10−5.†A: long-lasting rebrightening; B: multiple rebegitehnings; C: single rebrightening; D: no rebrightening.‡Number of rebrightenings.§Days before ordinary superhumps appeared.‖“]” represents the lower limit.
0.055 0.060 0.065 0.070 0.075 0.080
0
5
10
type Atype Btype Ctype D
Fig. 89. Pdot versus Porb for WZ Sge-type dwarf novae.Symbols represent the type (cf. Kato et al. 2009) of out-burst: type-A (filled circles), type-B (filled squares), type-C(filled triangles), type-D (open circles).
4.4. VW Hydri – Revisiting the Prototype of SU UMa-
Type Dwarf novae
In discussing superoutbursts and superhumps, we of-ten refer to historical observations of bright southern SUUMa-type dwarf novae (VW Hyi, Z Cha and OY Car),from which our early knowledge of phenomenology of su-perhumps was established. These early findings were alsosummarized in textbooks such as Warner (1995). Theseearly observations were, however, based on photoelectricphotometry and only limited parts of the entire obser-vations were published as figures, and these observationsare not accessible in electronic form. This has been anobstacle in comparing the results of modern-day CCD ob-servations with historical knowledge. Although Keplerobservations of V344 Lyr and V1504 Cyg (Kato et al.2012a; Wood et al. 2011) partly filled this gap, a direct
comparison in the “prototype” object VW Hyi had beenwanted. We have fortunately been able to obtain theentire course of the 2011 November–December superout-burst and two subsequent normal outbursts and the in-tervening quiescent period, although they were obtainedonly at a single observing location and suffered from un-avoidable gaps in coverage. These data are available atthe AAVSO database.The results of these observations (subsection 3.22) can
be summarized as follows:
1. The superoutburst started with a precursor out-burst.
2. There was no hint of superhumps during the risingphase and the early phase of the precursor outburst.
3. During the later stage of the precursor outburst, su-perhumps started to grow and the object brightened.
4. The amplitudes of superhumps reached a maximumwhen the object reached the maximum brightness.
5. The amplitudes of superhumps decreased during thesuperoutburst plateau.
6. The global Pdot was negative.7. Stage A was recognized during the evolving stage of
superhumps.8. There was likely stage B with an almost constant
period, followed by likely stage C with a shorter pe-riod.
9. The transition to stage B to C was smoother thanin short-Porb systems. This feature is similar to theones in Kepler data for V344 Lyr and V1504 Cyg.
10. Superhumps having phases ∼0.5 offset appearedduring the late stage of the superoutburst. Thesesuperhumps indeed appear to be “traditional” latesuperhumps, rather than a simple extension of stageC superhumps as in short-Porb systems.
11. The late superhumps persisted during the quiescentperiod before the next normal outburst and theywere still detected even after this normal outburst.The signal became undetectable after the secondnormal outburst. The situation was very similar tothe Kepler result for V344 Lyr.

No. ] Period Variations in SU UMa-Type Dwarf Novae IV 77
12. In contrast to V344 Lyr, secondary maxima of su-perhumps were not prominent.
We thus confirmed most of the classical superhump phe-nomenology including the “traditional” late superhumps,whose presence has been questioned in most of recentlyobserved objects (Kato et al. 2009; Kato et al. 2010;Kato et al. 2012a). Combined with the knowledge withV344 Lyr, the traditional descriptions of the developmentof superhumps and the appearance of late superhumpsseem to be common among relatively long-Porb and highmass-transfer systems, and VW Hyi can indeed be re-garded as the prototype of these systems. Things, how-ever, are somewhat different in shorter-Porb and lowermass-transfer systems in the clear presence of stages Band C and no clear signature of “traditional” late su-perhumps. Although the systematics of superhumps inVW Hyi would be adequate for describing long-Porb sys-tems, we regard it dangerous to describe the phenomenaseen in shorter-Porb systems in the same manner. Thiswill be particularly true for the term “late superhumps”which has been a major cause of confusion in describ-ing the stage C superhumps. Although some authors re-fer superhumps seen in the late stages of superoutburstas late superhumps, this leads to a confusion since theoriginal term “late superhumps” implies an ∼0.5 phaseshift, while stage C superhumps don’t show such a phaseshift. This ambiguity in terminology could lead to a con-fusion in interpreting the mechanism [see e.g. Hessmanet al. (1992), a work before the clarification between “tra-ditional” superhumps and stage C superhumps, analyzedstage C superhumps with a term of “late superhumps”and an assumption of an ∼0.5 phase shift]. We proposethat we should not use the term “late superhumps” unlessthere is a ∼0.5 phase shift.Schreiber et al. (2004) recently compared the calcula-
tions of the pure thermal-tidal instability (TTI) modeland the enhanced mass-transfer (EMT) model for VWHyi. Although both models (TTI and EMT) well explainthe many of observed characteristics, they claimed theadvantage of the EMT model in that it can explain vari-eties in the observed light curve of single systems such asVW Hyi. Although we don’t aim to validate or invalidatetheir claim here, we need to be specially careful in inter-preting observations. They referred to varieties of lightcurves based on historical visual observations, and theseobservations may have not been very sensitive to subtlesignatures of light curves. For example, while the presentsuperoutburst showed a clear signature of a precursor, vi-sual observations of the same superoutburst reported tothe AAVSO did not recognize this feature. Consideringthat all six superoutbursts of V344 Lyr and all six super-outbursts of V1504 Cyg showed precursors in Kepler data(Cannizzo et al. 2012), and considering that these lightcurves are very similar to the present one of VW Hyi (fig-ure 19, lower panel), we may postulate that precursors aremore commonly present in superoutburst of these systemsthan assumed in Schreiber et al. (2004), and that varia-tions within the single system is less pronounced. This
stability of appearance of precursors might in turn favorthe pure TTI model, and it needs to be examined further.
4.5. ER UMa Stars
Early years from the discovery of ER UMa-type stars(Kato, Kunjaya 1995; Robertson et al. 1995; Pattersonet al. 1995), it was not feasible to fully analyze periodvariations and O −C diagrams in these systems (Katoet al. 1996b; Kato et al. 2003a). Only recently super-humps in DI UMa (Rutkowski et al. 2009; subsection 3.36)and RZ LMi (Olech et al. 2008) were systematically stud-ied. Although ER UMa showed positive superhumps atleast until 2007 (our unpublished observations) and 2008(AAVSO data),11 the object now predominantly showsnegative superhumps even during superoutbursts at leastsince 2011 (Ohshima et al. 2012) and in quiescence in2008 (Kjurkchieva, Marchev 2010) [there was also a possi-ble signature of negative superhumps in 1998 (Gao et al.1999)], and it is now impossible to follow the evolution ofpositive superhumps during the entire course of a super-outburst of ER UMa as in the 1990s.V1159 Ori, on the other hand, still shows positive super-
humps (subsection 3.29), and it would be very desirableto study this object in detail. The recently recognizedmember of this family, BK Lyn, now shows almost thesame behavior of ER UMa during its “negative super-hump” (present) state.We also studied RZ LMi and found some evidence of
period variation (subsection 3.23). We also suggested acandidate orbital period from photometry, and this needsto be tested by further observations.We list currently known ER UMa stars and their
periods in table 89. The orbital periods were takenfrom Thorstensen et al. (1997) (ER UMa, V1159 Ori),Thorstensen et al. (2002b) (DI UMa), Ringwald et al.(1996) (BK Lyn). The superhump periods were fromKato, Kunjaya (1995) and Ohshima et al. (2012) (ERUMa), Rutkowski et al. (2009) (DI UMa), Olech et al.(2004) (IX Dra), and this work (V1159 Ori, RZ LMi, BKLyn). Although Olech et al. (2004) suggested a possibleorbital period, we did not include it because it is less likelyto detect an orbital signal having a period close to the su-perhump period (as they claimed) from such a limitedcoverage. Since the behavior of IX Dra is very similarto that of ER UMa in the 1990s (Ishioka et al. 2001b),we would expect an ǫ similar to ER UMa. A search forthe definite orbital period is still needed. It would bealso interesting to see whether this object currently showspositive or negative superhumps.
4.6. Superoutbursts of AM CVn Stars
We analyzed the superhumps in a dwarf nova (CR Boo)belonging to AM CVn-type objects (subsection 3.5). CRBoo recently showed a regular pattern of superoutburstssimilar to that of ER UMa (as noted in Kato et al. 2000b).
11 We don’t completely rule out that negative superhumps mayhave appeared during the later course of superoutbursts in 2007and 2008, since we don’t have data during the late course of thesuperoutbursts.

78 T. Kato et al. [Vol. ,
Table 89. List of ER UMa-type stars
Object Porb (d) PSH (d)∗ State†
ER UMa (1995–2008) 0.06366 0.0657 +ER UMa (2011–) 0.06226 −
V1159 Ori 0.062178 0.0643 +RZ LMi (0.059053) 0.05944 +DI UMa 0.054567 0.05531 +IX Dra – 0.06697 +
BK Lyn (2005–) 0.07498 0.07279 −∗The periods of dominant periodicities are given.†positive (+) and negative (−) superhumps.
We recorded a stage B–C transition similar to hydrogen-rich SU UMa-type dwarf novae. This is the first indicationthat superhumps in helium dwarf novae evolve in a similarway to hydrogen-rich SU UMa-type dwarf novae. Sincethis pattern of stage B–C transition was also recordedin the black-hole X-ray transient KV UMa (Kato et al.2009), the presence of stages B and C appear to be ubiq-uitous to all low-q systems. Theoretical studies for theorigin of the superhump stages are required. Althoughthe early stages of the superoutburst was not observed,SDSS J172102 underwent a superoutburst followed by ashort post-superoutburst rebrightening resembling that ofshort-Porb hydrogen-rich SU UMa-type dwarf novae. Thisalso strengthens the similarity of phenomenology betweenhelium-rich and hydrogen-rich SU UMa-type dwarf novae.The peculiar object SBS 1108+574, a hydrogen-rich CV
below the period minimum, also showed distinct stagesB and C as in ordinary short-Porb SU UMa-type dwarfnovae (subsection 3.49). Although the system parametersof this object is similar to those of AM CVn-type stars, thesuperoutburst was much longer than those of AM CVn-type superoutbursts and there were no “dip”-like fadingsduring the superoutburst plateau (cf. Kotko et al. 2012).Such a difference in the behavior may be a result from thedifferent properties of between pure-helium and hydrogen-rich accretion disks and warrants further study.
4.7. Double Periodic Superhumps?
In the present paper, we encountered three unusual ob-jects (CC Scl, MASTER J072948, OT J173516) whichshowed superoutbursts similar to other SU UMa-typedwarf novae but with only low-amplitude and rather ir-regular superhumps. The light curves of these systemsappear to be expressed by a combination of closely sep-arated two periods. In CC Scl, these periods are almostcertainly Porb and positive superhumps, while the situa-tion for MASTER J072948 and OT J173516 is unclear:either positive superhumps with an unusual ǫ or negativesuperhumps. Although these objects comprise only a mi-nority of known SU UMa-type dwarf novae, there mayhave been “overlooked” systems since the amplitudes ofvariations are very small. We cannot explain the unusualbehavior in these systems. If negative superhumps (or atilted disk) were excited as in the present-day ER UMa,
the coexistence of both signals of Porb and negative super-humps and the rather irregular waveform may be easierto reconcile.
5. Summary
We studied the characteristics of superhumps for 86 SUUMa-type dwarf novae whose superoutbursts were mainlyobserved during the 2011–2012 season. Most of the newdata for systems with short orbital periods basically con-firmed the earlier findings.Among WZ Sge-type dwarf novae, BW Scl showed an
O−C variation similar to other WZ Sge-type dwarf no-vae such as V455 And and GW Lib, and this pattern ofperiod variation appears to be common among WZ Sge-type dwarf novae with shortest orbital periods. The WZSge-type object OT J184228.1+483742 showed an unusualpattern of double outbursts composed of an outburst withearly superhumps and another with ordinary superhumps,separated by a temporary fading. We propose an interpre-tation that a very small growth rate of the 3:1 resonancedue to an extremely low mass-ratio led to a quenching ofthe superoutburst before ordinary superhumps appeared.We suspect that this object is a good candidate for a pe-riod bouncer.We studied VW Hyi during its superoutburst in 2011
November–December and subsequent two normal out-bursts. We confirmed the presence of “traditional” latesuperhumps with a ∼0.5 phase shift. These late super-humps persisted until the second next normal outburst.The behavior was very similar to the results of Keplerobservations of V344 Lyr and it is likely these late su-perhumps seem to be common among relatively long-Porb
and high mass-transfer systems.We extended our research to the analysis of positive and
negative superhumps in ER UMa-type dwarf novae, andfound that the current V1159 Ori shows positive super-humps similar to ER UMa in the 1990s. In two extremeER UMa stars (DI UMa and RZ LMi), there is an indi-cation of positive period derivatives. We identified likelyorbital periods for these objects, and both objects likelyhave small mass ratios. The recently identified ER UMa-type object BK Lyn has been in dwarf nova-type state atleast since 2005, and its current variation is dominated bynegative superhumps as in ER UMa at least since 2011.We further examined superhumps in AM CVn-type ob-
jects, and for the first time established the pattern of pe-riod variations very similar to short-period hydrogen-richSU UMa-type dwarf novae, and these objects are indeeda helium analogue of hydrogen-rich SU UMa-type dwarfnovae.We also studied a peculiar object SBS 1108+574, a
hydrogen-rich dwarf nova below the period minimum, andshowed a very similar pattern of period variations to thoseof short-period SU UMa-type dwarf novae. We detecteda likely orbital period in this system and estimated themass ratio to be q = 0.06. This finding suggests that thissecondary is a somewhat evolved star whose hydrogen en-velope was mostly stripped during the mass-exchange.

No. ] Period Variations in SU UMa-Type Dwarf Novae IV 79
We identified a new group of SU UMa-type dwarf novae(CC Scl, MASTER J072948 and OT J173516.9+154708)with low-amplitude superhumps with complex profiles.The complex profile in CC Scl is likely a result of combina-tion of orbital humps and positive superhumps. The casesfor MASTER J072948 and OT J173516.9+154708 are lessclear and the second signal may be negative superhumps.
This work was supported by the Grant-in-Aid forthe Global COE Program “The Next Generation ofPhysics, Spun from Universality and Emergence” fromthe Ministry of Education, Culture, Sports, Science andTechnology (MEXT) of Japan. The authors are grate-ful to observers of VSNET Collaboration and VSOLJ ob-servers who supplied vital data. We acknowledge withthanks the variable star observations from the AAVSOInternational Database contributed by observers world-wide and used in this research. This work is deeply in-debted to outburst detections and announcement by anumber of variable star observers worldwide, includingparticipants of CVNET, BAA VSS alert and AVSONnetworks. We are grateful to the Catalina Real-timeTransient Survey team for making their real-time detec-tion of transient objects available to the public.
Appendix 1. MCMC Analysis of Eclipses
The KW method is widely used to determine the mid-eclipse times of eclipsing binaries. Although this methodis useful for densely sampled light curves, it is difficultto determine the period of eclipsing binaries with sparsesamples. This is particularly the case for TCP J084616 inwhich each eclipse was observed with low time-resolutionand with large photometric errors due to the faintness ofthe object. In such cases, a usual approach to measurethe mid-eclipse times by the KW method and then makea linear regression does not give a good result. We solvedthis problem by extending the application of the MCMCanalysis introduced in Kato et al. (2010).In this problem, D = {yobs(ti)} are the observed mag-
nitudes (corrected for trends if necessary) for the epochs{ti}, parameter space is θ = {P,E0,a, b, c} defined by themodel (ymodel):
φi =1/2− |(ti−E0)/P mod 1− 1/2|
ymodel(φi) = b+ c(a−φi) (φi < a)
ymodel(φi) = b (φi ≥ a),
(A1)
where P and E0 are the period and epoch, respectively,and mod1 means the fractional part. and other pa-rameters define the shape of the light curve. Assumingthat ǫi = yobs(ti)−ymodel(ti) follows a normal distributionN(0,σ2
i ), the likelihood function can be written as
L(θ) =∏
i
1√
2πσ2i
exp
[
−{yobs(ti)− ymodel(ti)}
2
2σ2i
]
,(A2)
and apply MCMC algorithm to this L(θ). A sample ofresults is shown in figures 90, 91 and 92. We used the
0 2000 4000 6000 8000 10000−2420
−2400
−2380
−2360
−2340
Fig. 90. MCMC analysis of TCP J084616: behavior of like-lihood.
Period
Fre
quen
cy0.091370 0.091375 0.091380 0.091385 0.091390 0.091395 0.091400
010
020
030
040
0
Fig. 91. Posterior probablistic function of P of TCPJ084616.
resultant P and E0 in subsection 3.85. This method isalso applicable to usual determination of minima of eclips-ing binaries by appropriately defining the shape of thelight curve. This method is advantageous to classical KWmethod in its plain formulation, robustness of the solu-tion for noisy data, and easy incorporation of errors inindividual measurements.
References
Abbott, T. M. C., Fleming, T. A., & Pasquini, L. 1997, A&A,318, 134
Augusteijn, T., van der Hooft, F., de Jong, J. A., & vanParadijs, J. 1996, A&A, 311, 889
Augusteijn, T., van Kerkwijk, M. H., & van Paradijs, J. 1993,A&A, 267, L55
Augusteijn, T., & Wisotzki, L. 1997, A&A, 324, L57Balanutsa, P., et al. 2012a, Astron. Telegram, 4022Balanutsa, P., et al. 2012b, Astron. Telegram, 4084Balanutsa, P., et al. 2012c, Astron. Telegram, 3935Baraffe, I., Chabrier, G., Barman, T. S., Allard, F., &
Hauschildt, P. H. 2003, A&A, 402, 701Boyd, D., Oksanen, A., & Henden, A. 2006, J. Br. Astron.
Assoc., 116, 187Breedt, E., Gansicke, B. T., Marsh, T. R., Steeghs, D., Drake,
A. J., & Copperwheat, C. M. 2012, MNRAS, 425, 2548Cannizzo, J. K., Smale, A. P., Wood, M. A., Still, M. D., &
Howell, S. B. 2012, ApJ, 747, 117Cannizzo, J. K., Still, M. D., Howell, S. B., Wood, M. A., &
Smale, A. P. 2010, ApJ, 725, 1393Chabrier, G., & Baraffe, I. 1997, A&A, 327, 1039

80 T. Kato et al. [Vol. ,
−0.10 −0.05 0.00 0.05 0.10
2
1
0
−1
Fig. 92. Best-fit model for TCP J084616. Points are obser-vations and line is the model.
Chen, A., O’Donoghue, D., Stobie, R. S., Kilkenny, D., &Warner, B. 2001, MNRAS, 325, 89
Denisenko, D. V., & Sokolovsky, K. V. 2011, Astron. Lett., 37,91
Dillon, M., et al. 2008, MNRAS, 386, 1568Duerbeck, H. W. 1987, Space Sci. Rev., 45, 1Gao, W., Li, Z., Wu, X., Zhang, Z., & Li, Y. 1999, ApJL, 527,
L55Garnavich, P., Littlefield, C., Marion, G. H., Irwin, J.,
Kirshner, R. P., & Vinko, J. 2012, Astron. Telegram, 4112Gessner, H. 1966, Veroff. Sternw. Sonneberg, 7, 61Hambsch, F.-J. 2012, J. American Assoc. Variable Star Obs.,
40, 1003Harvey, D., Skillman, D. R., Patterson, J., & Ringwald, F. A.
1995, PASP, 107, 551Hessman, F. V., & Hopp, U. 1990, A&A, 228, 387Hessman, F. V., Mantel, K.-H., Barwig, H., & Schoembs, R.
1992, A&A, 263, 147Hoffmeister, C. 1949, Erg. Astron. Nachr., 12, 12Hoffmeister, C. 1951, Erg. Astron. Nachr., 12, 14Hoffmeister, C. 1968, Astron. Nachr., 290, 277Howell, S. B., Schmidt, R., DeYoung, J. A., Fried, R., Schmeer,
P., & Gritz, L. 1993, PASP, 105, 579Imada, A., et al. 2006, PASJ, 58, 143Imada, A., Kato, T., Monard, L. A. G. B., Stubbings, R.,
Uemura, M., Ishioka, R., & Nogami, D. 2008a, PASJ, 60,267
Imada, A., et al. 2008b, PASJ, 60, 1151Imada, A., et al. 2009, PASJ, 61, 535Ishioka, R., Kato, T., Matsumoto, K., Uemura, M., Iwamatsu,
H., & Stubbings, R. 2001a, IBVS, 5023Ishioka, R., et al. 2002, PASJ, 54, 581Ishioka, R., Kato, T., Uemura, M., Iwamatsu, H., Matsumoto,
K., Martin, B. E., Billings, G. W., & Novak, R. 2001b,PASJ, 53, L51
Ishioka, R., Sekiguchi, K., & Maehara, H. 2007, PASJ, 59, 929Kato, T. 2001, PASJ, 53, L17Kato, T. 2002a, PASJ, 54, L11Kato, T. 2002b, PASJ, 54, 87
Kato, T., Hanson, G., Poyner, G., Muyllaert, E., Reszelski,M., & Dubovsky, P. A. 2000a, IBVS, 4932
Kato, T., et al. 2009, PASJ, 61, S395Kato, T., Ishioka, R., & Uemura, M. 2002, PASJ, 54, 1029Kato, T., & Kunjaya, C. 1995, PASJ, 47, 163Kato, T., et al. 2012a, PASJ, 64, 21Kato, T., Maehara, H., & Uemura, M. 2012b, PASJ, 64, 62Kato, T., et al. 2010, PASJ, 62, 1525Kato, T., Nogami, D., Baba, H., Hanson, G., & Poyner, G.
2000b, MNRAS, 315, 140Kato, T., Nogami, D., Baba, H., Matsumoto, K., Arimoto, J.,
Tanabe, K., & Ishikawa, K. 1996a, PASJ, 48, L21Kato, T., Nogami, D., & Masuda, S. 1996b, PASJ, 48, L5Kato, T., Nogami, D., & Masuda, S. 2003a, PASJ, 55, L7Kato, T., Nogami, D., Moilanen, M., & Yamaoka, H. 2003b,
PASJ, 55, 989Kato, T., Stubbings, R., Monard, B., Butterworth, N. D., Bolt,
G., & Richards, T. 2004a, PASJ, 56, S89Kato, T., & Uemura, M. 2012, PASJ, 64, 122Kato, T., Uemura, M., Ishioka, R., Nogami, D., Kunjaya, C.,
Baba, H., & Yamaoka, H. 2004b, PASJ, 56, S1Kemp, J., et al. 2012, Society for Astronom. Sciences Ann.
Symp., 31, 7Kjurkchieva, D., & Marchev, D. 2010, Publ. de l’Observatoire
Astronomique de Beograd, 90, 147Kotko, I., Lasota, J.-P., Dubus, G., & Hameury, J.-M. 2012,
A&A, 544, A13Kwee, K. K., & van Woerden, H. 1956, Bull. Astron. Inst.
Netherlands, 12, 327Levitan, D., et al. 2011, ApJ, 739, 68Littlefair, S. P., Dhillon, V. S., Marsh, T. R., & Gansicke, B. T.
2006, MNRAS, 371, 1435Markarian, B. E., & Stepanian, D. A. 1983, Astrofizika, 19,
639Mennickent, R. E., Patterson, J., O’Donoghue, D., Unda, E.,
Harvey, D., Vanmuster, T., & Bolt, G. 1999, Ap&SS, 262,1
Nakano, S., Nishimura, H., Noguchi, T., & Munari, U. 2011,Cent. Bur. Electron. Telegrams, 2818, 1
Nogami, D., Kato, T., Masuda, S., & Hirata, R. 1995, IBVS,4155
Nogami, D., Monard, B., Retter, A., Liu, A., Uemura, M.,Ishioka, R., Imada, A., & Kato, T. 2004, PASJ, 56, L39
Ohshima, T., et al. 2012, PASJ, 64, L3Ohshima, T., et al. 2011, PASJ, submittedOlech, A. 1997, Acta Astron., 47, 281Olech, A., Mularczyk, K., Kedzierski, P., Z loczewski, K.,
Wisniewski, M., & Szaruga, K. 2006, A&A, 452, 933Olech, A., Wisniewski, M., Zloczewski, K., Cook, L. M.,
Mularczyk, K., & Kedzierski, P. 2008, Acta Astron., 58,131
Olech, A., Zloczewski, K., Mularczyk, K., Kedzierski, P.,Wisniewski, M., & Stachowski, G. 2004, Acta Astron., 54,57
Pastukhova, E. N. 1988, Astron. Tsirk., 1534, 17Patterson, J., Jablonski, F., Koen, C., O’Donoghue, D., &
Skillman, D. R. 1995, PASP, 107, 1183Patterson, J., et al. 1997, PASP, 109, 1100Pavlenko, E., et al. 2010a, in AIP Conference Proceedings,
17th European White Dwarf Workshop, ed. K. Werner &T. Rauch (Maryland: AIP), p. 320
Pavlenko, E., Kato, T., Pit, N., Baklanov, A., Antonyuk, K.,& Stein, W. 2012a, Astron. Telegram, 3889, 1

No. ] Period Variations in SU UMa-Type Dwarf Novae IV 81
Pavlenko, E. P., Samsonov, D. A., Antonyuk, O. I., Andreev,M. V., Baklanov, A. V., & Sosnovskij, A. A. 2012b,Astrophysics, 55, 494
Pavlenko, E. P., et al. 2010b, Astron. Rep., 54, 6Pojmanski, G. 2002, Acta Astron., 52, 397Provencal, J. L., et al. 1997, ApJ, 480, 383Ramsay, G., Barclay, T., Steeghs, D., Wheatley, P. J., Hakala,
P., Kotko, I., & Rosen, S. 2011, MNRAS, 419, 2836Ramsay, G., Barclay, T., Steeghs, D., Wheatley, P. J., Hakala,
P., Kotko, I., & Rosen, S. 2012, MNRAS, 419, 2836Rau, A., Roelofs, G. H. A., Groot, P. J., Marsh, T. R.,
Nelemans, G., Steeghs, D., Salvato, M., & Kasliwal, M. M.2010, ApJ, 708, 456
Richards, G. T., et al. 2009, ApJS, 180, 67Richter, G. A. 1990, Mitteil. Veranderl. Sterne, 12, 59Ringwald, F. A., Thorstensen, J. R., Honeycutt, R. K., &
Robertson, J. W. 1996, MNRAS, 278, 125Robertson, J. W., Honeycutt, R. K., Hillwig, T., & Jurcevic,
J. 1998, in ASP Conf. Ser. 137, Wild Stars in the Old West,ed. S. Howell, E. Kuulkers, & C. Woodward (San Francisco:ASP), p. 469
Robertson, J. W., Honeycutt, R. K., Hillwig, T., Jurcevic,J. S., & Henden, A. A. 2000, AJ, 119, 1365
Robertson, J. W., Honeycutt, R. K., & Turner, G. W. 1995,PASP, 107, 443
Rutkowski, A., Olech, A., Wisniewski, M., Pietrukowicz, P.,Pala, J., & Poleski, R. 2009, A&A, 497, 437
Schoembs, R., & Vogt, N. 1980, A&A, 91, 25Schreiber, M. R., Hameury, J.-M., & Lasota, J.-P. 2004, A&A,
427, 621Schwope, A., et al. 2000, Astron. Nachr., 321, 1Shears, J., Hambsch, F.-J., Littlefield, C., Miller, I., Morelle,
E., Pickard, R., Pietz, J., & Sabo, R. 2012a, J. Br. Astron.Assoc., in press (arXiv astro-ph/1209.4062)
Shears, J., et al. 2012b, J. Br. Astron. Assoc., in press (arXivastro-ph/1205.0898)
Skillman, D. R., & Patterson, J. 1993, ApJ, 417, 298Sokolovsky, K. V., Baryshev, K. O., & Korotkiy, S. A. 2012,
Astron. Telegram, 3849Solheim, J.-E. 2010, PASP, 122, 1133Southworth, J., et al. 2008, MNRAS, 391, 591Southworth, J., Marsh, T. R., Gansicke, B. T., Aungwerojwit,
A., Hakala, P., de Martino, D., & Lehto, H. 2007, MNRAS,382, 1145
Stellingwerf, R. F. 1978, ApJ, 224, 953Szkody, P., et al. 2003, AJ, 126, 1499Szkody, P., et al. 2006, AJ, 131, 973Szkody, P., et al. 2005, AJ, 129, 2386Szkody, P., et al. 2007, ApJ, 658, 1188Tappert, C., Augusteijn, T., & Maza, J. 2004, MNRAS, 354,
321Thorstensen, J. R., Fenton, W. H., Patterson, J. O., Kemp, J.,
Krajci, T., & Baraffe, I. 2002a, ApJL, 567, L49Thorstensen, J. R., Patterson, J. O., Kemp, J., & Vennes, S.
2002b, PASP, 114, 1108Thorstensen, J. R., Patterson, J. O., Shambrook, A., &
Thomas, G. 1996, PASP, 108, 73Thorstensen, J. R., & Skinner, J. N. 2012, AJ, 144, 81Thorstensen, J. R., Taylor, C. J., Becker, C. M., & Remillard,
R. A. 1997, PASP, 109, 477Tiurina, N., et al. 2012, Astron. Telegram, 3845Tsugawa, M., & Osaki, Y. 1997, PASJ, 49, 75Uemura, M., et al. 2002, PASJ, 54, L15
Uemura, M., Kato, T., Pavlenko, E., Baklanov, A., & Pietz,J. 2001, PASJ, 53, 539
Uemura, M., et al. 2005, A&A, 432, 261Unda-Sanzana, E., et al. 2008, MNRAS, 388, 889Uthas, H., et al. 2012, MNRAS, 420, 379Vogt, N. 1983, A&A, 118, 95Warner, B. 1995, Cataclysmic Variable Stars (Cambridge:
Cambridge University Press)Warner, B., & Woudt, P. A. 2004, in ASP Conf. Ser. 310,
IAU Colloq. 193: Variable Stars in the Local Group, ed.D. W. Kurtz & K. R. Pollard (San Francisco: ASP), p. 382
Wils, P., Gansicke, B. T., Drake, A. J., & Southworth, J. 2010,MNRAS, 402, 436
Wolf, M., & Wolf, G. 1905, Astron. Nachr., 169, 415Wood, M. A., Still, M. D., Howell, S. B., Cannizzo, J. K., &
Smale, A. P. 2011, ApJ, 741, 105Woudt, P. A., et al. 2012, MNRAS, 427, 1004Yamaoka, H., et al. 2011, Cent. Bur. Electron. Telegrams,
2731, 1