survey summary report: numbers and types of responses, slps · 2018-07-12 · asha 2018 slp schools...
TRANSCRIPT

Survey Summary Report: Numbers and Types of Responses, SLPs
Suggested Citation: American Speech-Language-Hearing Association. (2018). 2018 Schools survey. Survey summary report: Numbers and types of responses, SLPs. Available from www.asha.org.

ASHA 2018 SLP Schools Survey: Survey Summary Report
i
Contents
Sampling and Response Rates ............................................................................................................................................. 1 ASHA Services and Programs: Q 1 ...................................................................................................................................... 2 Workforce: Qs 2–4 ................................................................................................................................................................ 5 Employment and Earnings: Qs 5–13 ................................................................................................................................... 10 Performance Evaluation: Q 14 ............................................................................................................................................ 21 Caseload: Qs 15–21............................................................................................................................................................ 22 Birth Through Five: Q 22 ..................................................................................................................................................... 35 Supervision: Qs 23–25 ........................................................................................................................................................ 38 Ethics: Q 26 ......................................................................................................................................................................... 41 Journals: Q 27 ..................................................................................................................................................................... 44 IDEA: Q 28 .......................................................................................................................................................................... 48 Student Loans: Qs 29–32 .................................................................................................................................................... 57 Demographics: Qs 33–38 .................................................................................................................................................... 61 Appendix ............................................................................................................................................................................. 68
ASHA 2018 SLP Schools Survey: Survey Summary Report
ASHA 2018 SLP Schools Survey: Survey Summary Report
1
Sampling and Response Rates
Probability (nonreplacement) sampling using a stratified systematic technique was used to select a sample of 4,500 ASHA-certified speech-language pathologists with schools as their primary employment facility for the 2018 Schools Survey. The sample was stratified by state, and data have been weighted to reflect their proportion by state within the Association. Small groups, such as speech-language pathologists who work in Wyoming and Idaho, were over sampled so that sufficient numbers from these groups could be included in the sample. An additional 500 ASHA-certified educational audiologists were also randomly selected to participate. Their results are in a separate report. This report is limited to responses from individuals with a Certificate of Clinical Competence in Speech-Language Pathology (CCC-SLP) only. An overall response rate of 48.0% was obtained for SLPs and audiologists combined (2,374 completed surveys from a net sample of 4,946 eligibles). The response rate for SLPs was 48.8% (2,170 completed surveys from a net sample of 4,450 eligible respondents). These percentages are unweighted. Data were weighted for all tables in the report. The “All Facility Types” column throughout the report reflects results for respondents from the six facility types as well as from the 24 respondents who were employed in students’ homes and 20 respondents who were employed in “other” types of facilities, and respondents who did not answer the question about facility type. Therefore, the “All Facility Types” column may not be the sum of the ns in the other six columns. Data are not presented for table cells with fewer than 25 respondents, and administrative offices were excluded for questions where responses were limited to clinical service providers. A description of statistical terms used in the report can be found in the Appendix at the end of the report.

ASHA 2018 SLP Schools Survey: Survey Summary Report
2
ASHA Services and Programs 1. In your opinion, what kind of job is the Association doing in serving its school-based members? (Percentages) Analyses limited to respondents who met the following criterion:
CCC-SLP
Response
Facility Type
All Facility Types
(n ≥ 2,106)
Special Day/ Residential
(n ≥ 80) Preschool (n ≥ 269)
Elementary (n ≥ 1,163)
Secondary (n ≥ 268)
Admin. Office
(n ≥ 48)
Combina-tion
(n ≥ 157)
Overall
Poor 3.2 1.2 1.9 3.1 4.2 0.0 4.5
Fair 21.0 15.9 22.3 22.2 20.0 16.3 22.3
Good 55.0 57.3 51.3 55.2 57.7 59.2 55.4
Excellent 12.2 13.4 12.6 11.8 10.0 18.4 14.0
Don’t know, NA 8.6 12.2 11.9 7.7 8.1 6.1 3.8
Statistical significance: χ2(20) = 23.3, p = .274 Conclusion: There is not enough evidence from the data to say that the responses vary by facility type.
With Advocacy
Poor 8.3 3.7 7.4 9.0 7.5 0.0 10.2
Fair 23.0 22.2 20.4 23.7 24.6 30.0 21.7
Good 43.1 44.4 43.1 42.0 46.6 46.0 44.6
Excellent 10.4 9.9 10.4 10.3 7.8 18.0 14.0
Don’t know, NA 15.1 19.8 18.6 15.0 13.4 6.0 9.6
Statistical significance: χ2(20) = 28.2, p = .105 Conclusion: There is not enough evidence from the data to say that the responses vary by facility type.
(Question 1 continues on next page.)
ASHA 2018 SLP Schools Survey: Survey Summary Report
3
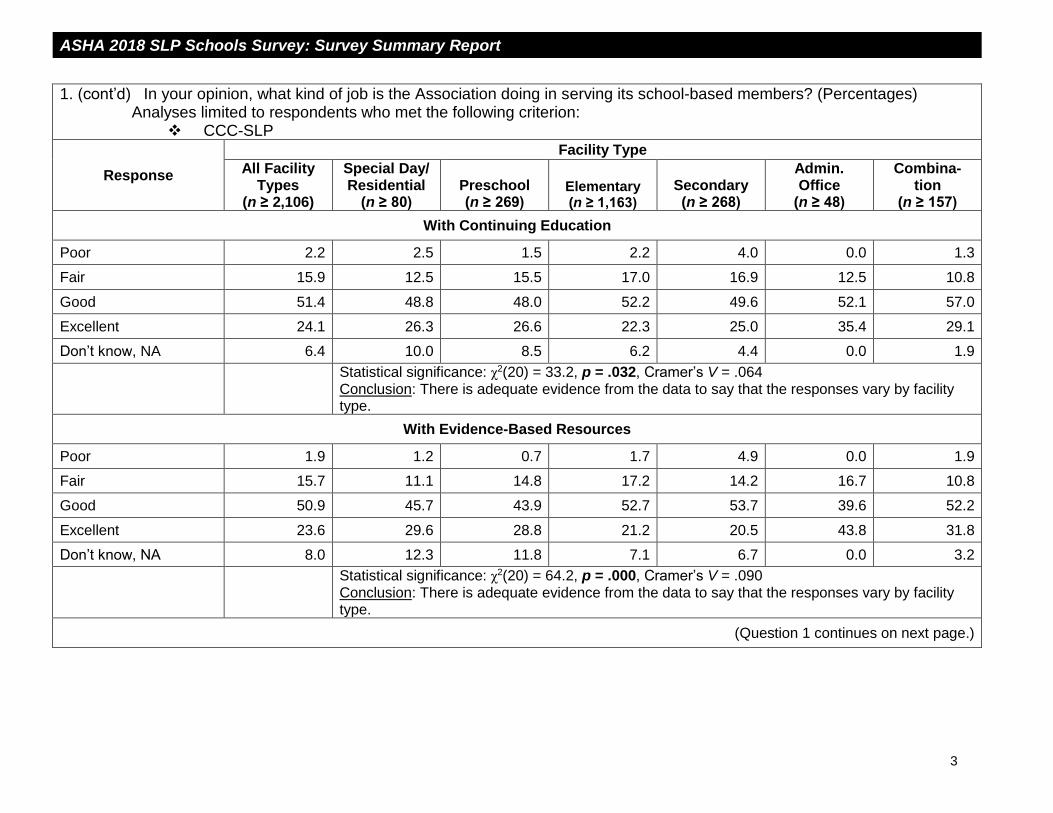
1. (cont’d) In your opinion, what kind of job is the Association doing in serving its school-based members? (Percentages) Analyses limited to respondents who met the following criterion:
CCC-SLP
Response
Facility Type
All Facility Types
(n ≥ 2,106)
Special Day/ Residential
(n ≥ 80) Preschool (n ≥ 269)
Elementary (n ≥ 1,163)
Secondary (n ≥ 268)
Admin. Office
(n ≥ 48)
Combina-tion
(n ≥ 157)
With Continuing Education
Poor 2.2 2.5 1.5 2.2 4.0 0.0 1.3
Fair 15.9 12.5 15.5 17.0 16.9 12.5 10.8
Good 51.4 48.8 48.0 52.2 49.6 52.1 57.0
Excellent 24.1 26.3 26.6 22.3 25.0 35.4 29.1
Don’t know, NA 6.4 10.0 8.5 6.2 4.4 0.0 1.9
Statistical significance: χ2(20) = 33.2, p = .032, Cramer’s V = .064 Conclusion: There is adequate evidence from the data to say that the responses vary by facility type.
With Evidence-Based Resources
Poor 1.9 1.2 0.7 1.7 4.9 0.0 1.9
Fair 15.7 11.1 14.8 17.2 14.2 16.7 10.8
Good 50.9 45.7 43.9 52.7 53.7 39.6 52.2
Excellent 23.6 29.6 28.8 21.2 20.5 43.8 31.8
Don’t know, NA 8.0 12.3 11.8 7.1 6.7 0.0 3.2
Statistical significance: χ2(20) = 64.2, p = .000, Cramer’s V = .090 Conclusion: There is adequate evidence from the data to say that the responses vary by facility type.
(Question 1 continues on next page.)

ASHA 2018 SLP Schools Survey: Survey Summary Report
4
1. (cont’d) In your opinion, what kind of job is the Association doing in serving its school-based members? (Percentages) Analyses limited to respondents who met the following criterion:
CCC-SLP
Response
Facility Type
All Facility Types
(n ≥ 2,106)
Special Day/ Residential
(n ≥ 80) Preschool (n ≥ 269)
Elementary (n ≥ 1,163)
Secondary (n ≥ 268)
Admin. Office
(n ≥ 48)
Combina-tion
(n ≥ 157)
With Questions About School-Based Practice
Poor 2.8 1.3 1.5 3.4 3.0 0.0 2.5
Fair 20.3 13.8 20.4 20.8 21.9 26.5 20.1
Good 49.8 46.3 47.8 50.5 53.3 42.9 49.1
Excellent 14.1 20.0 13.7 13.9 10.4 30.6 15.1
Don’t know, NA 13.0 18.8 16.7 11.5 11.5 0.0 13.2
Statistical significance: χ2(20) = 38.0, p = .009, Cramer’s V = .069 Conclusion: There is adequate evidence from the data to say that the responses vary by facility type.
ASHA 2018 SLP Schools Survey: Survey Summary Report
5
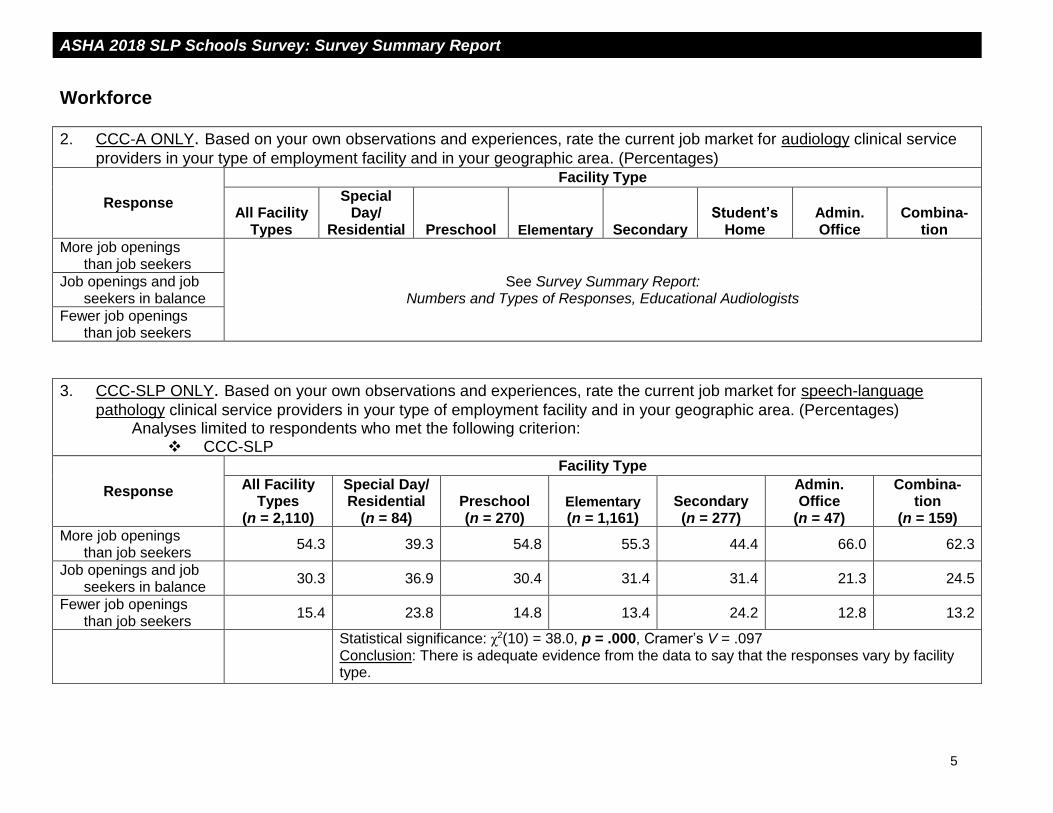
Workforce
2. CCC-A ONLY. Based on your own observations and experiences, rate the current job market for audiology clinical service
providers in your type of employment facility and in your geographic area. (Percentages)
Response
Facility Type
All Facility Types
Special Day/
Residential Preschool Elementary Secondary Student’s
Home Admin. Office
Combina-tion
More job openings than job seekers
See Survey Summary Report: Numbers and Types of Responses, Educational Audiologists
Job openings and job seekers in balance
Fewer job openings than job seekers
3. CCC-SLP ONLY. Based on your own observations and experiences, rate the current job market for speech-language
pathology clinical service providers in your type of employment facility and in your geographic area. (Percentages) Analyses limited to respondents who met the following criterion:
CCC-SLP
Response
Facility Type
All Facility Types
(n = 2,110)
Special Day/ Residential
(n = 84) Preschool (n = 270)
Elementary
(n = 1,161) Secondary (n = 277)
Admin. Office
(n = 47)
Combina-tion
(n = 159)
More job openings than job seekers
54.3 39.3 54.8 55.3 44.4 66.0 62.3
Job openings and job seekers in balance
30.3 36.9 30.4 31.4 31.4 21.3 24.5
Fewer job openings than job seekers
15.4 23.8 14.8 13.4 24.2 12.8 13.2
Statistical significance: χ2(10) = 38.0, p = .000, Cramer’s V = .097 Conclusion: There is adequate evidence from the data to say that the responses vary by facility type.

ASHA 2018 SLP Schools Survey: Survey Summary Report
6
4. What are your greatest challenges as a school-based professional? Select all that apply. (Percentages) Responses were in alphabetical order on survey instrument.
Analyses limited to respondents who met the following criterion: CCC-SLP
Challenge
Facility Type
All Facility Types
(n = 2,170)
Special Day/ Residential
(n ≥ 83) Preschool (n ≥ 279)
Elementary
(n ≥ 1,195) Secondary (n ≥ 278)
Admin. Office
(n ≥ 49)
Combina-tion
(n ≥ 163)
Large amount of paperwork
79.2 67.9 78.9 81.9 71.0 79.6 78.0
Statistical significance: χ2(5) = 23.5, p = .000, Cramer’s V = .107 Conclusion: There is adequate evidence from the data to say that the responses vary by facility type.
High workload/caseload size
71.2 56.0 73.2 73.6 62.4 75.5 71.8
Statistical significance: χ2(5) = 24.5, p = .000, Cramer’s V = .109 Conclusion: There is adequate evidence from the data to say that the responses vary by facility type.
Limited time for collaboration
53.5 36.1 43.6 55.9 51.3 62.0 62.0
Statistical significance: χ2(5) = 30.5, p = .000, Cramer’s V = .122 Conclusion: There is adequate evidence from the data to say that the responses vary by facility type.
Budget constraints 46.9 26.5 50.9 45.7 46.2 46.0 53.0
Statistical significance: χ2(5) = 18.7, p = .002, Cramer’s V = .095 Conclusion: There is adequate evidence from the data to say that the responses vary by facility type.
Incorporating optimal service delivery models
43.6 34.5 42.9 45.5 45.5 60.0 36.6
Statistical significance: χ2(5) = 13.3, p = .021, Cramer’s V = .080 Conclusion: There is adequate evidence from the data to say that the responses vary by facility type.
(Question 4 continues on next page.)

ASHA 2018 SLP Schools Survey: Survey Summary Report
7
4. (cont’d) What are your greatest challenges as a school-based professional? Select all that apply. (Percentages) Responses were in alphabetical order on survey instrument.
Analyses limited to respondents who met the following criterion: CCC-SLP
Challenge
Facility Type
All Facility Types
(n = 2,170)
Special Day/ Residential
(n ≥ 83) Preschool (n ≥ 279)
Elementary
(n ≥ 1,195) Secondary (n ≥ 278)
Admin. Office
(n ≥ 49)
Combina-tion
(n ≥ 163)
Limited understanding of my role by others
37.8 36.9 25.4 40.8 39.4 30.6 36.2
Statistical significance: χ2(5) = 24.7, p = .000, Cramer’s V = .110 Conclusion: There is adequate evidence from the data to say that the responses vary by facility type.
Low salary 36.1 35.7 36.1 36.7 33.0 44.9 39.0
Statistical significance: χ2(5) = 3.5, p = .623 Conclusion: There is not enough evidence from the data to say that the responses vary by facility type.
Out-of-pocket professional expenses
34.7 25.3 37.1 35.3 29.0 22.4 41.1
Statistical significance: χ2(5) = 14.3, p = .014, Cramer’s V = .084 Conclusion: There is adequate evidence from the data to say that the responses vary by facility type.
Medicaid billing 34.0 26.2 32.1 36.5 27.6 38.8 30.7
Statistical significance: χ2(5) = 12.3, p = .031, Cramer’s V = .078 Conclusion: There is adequate evidence from the data to say that the responses vary by facility type.
Inadequate work space and facilities
33.3 41.7 42.9 28.6 29.5 42.9 47.2
Statistical significance: χ2(5) = 44.3, p = .000, Cramer’s V = .147 Conclusion: There is adequate evidence from the data to say that the responses vary by facility type.
(Question 4 continues on next page.)

ASHA 2018 SLP Schools Survey: Survey Summary Report
8
4. (cont’d) What are your greatest challenges as a school-based professional? Select all that apply. (Percentages) Responses were in alphabetical order on survey instrument.
Analyses limited to respondents who met the following criterion: CCC-SLP
Challenge
Facility Type
All Facility Types
(n = 2,170)
Special Day/ Residential
(n ≥ 83) Preschool (n ≥ 279)
Elementary
(n ≥ 1,195) Secondary (n ≥ 278)
Admin. Office
(n ≥ 49)
Combina-tion
(n ≥ 163)
Limited parental involvement and support
30.6 30.1 26.8 32.7 22.6 22.4 35.6
Statistical significance: χ2(5) = 16.4, p = .006, Cramer’s V = .089 Conclusion: There is adequate evidence from the data to say that the responses vary by facility type.
Personnel shortage 23.1 16.9 26.4 21.7 14.3 49.0 33.5
Statistical significance: χ2(5) = 45.9, p = .000, Cramer’s V = .150 Conclusion: There is adequate evidence from the data to say that the responses vary by facility type.
Limited support from the administration
22.9 24.1 26.4 22.0 18.6 12.2 29.3
Statistical significance: χ2(5) = 12.4, p = .030, Cramer’s V = .078 Conclusion: There is adequate evidence from the data to say that the responses vary by facility type.
Lack of training to work with specific disorders or special populations
20.5 22.9 20.7 20.7 22.6 12.2 19.6
Statistical significance: χ2(5) = 3.1, p = .687 Conclusion: There is not enough evidence from the data to say that the responses vary by facility type.
(Question 4 continues on next page.)

ASHA 2018 SLP Schools Survey: Survey Summary Report
9
4. (cont’d) What are your greatest challenges as a school-based professional? Select all that apply. (Percentages) Responses were in alphabetical order on survey instrument.
Analyses limited to respondents who met the following criterion: CCC-SLP
Challenge
Facility Type
All Facility Types
(n = 2,170)
Special Day/ Residential
(n ≥ 83) Preschool (n ≥ 279)
Elementary
(n ≥ 1,195) Secondary (n ≥ 278)
Admin. Office
(n ≥ 49)
Combina-tion
(n ≥ 163)
Ethical challenges 14.1 14.3 16.1 13.5 12.2 12.2 14.7
Statistical significance: χ2(5) = 2.1, p = .832 Conclusion: There is not enough evidence from the data to say that the responses vary by facility type.
Legal challenges (e.g., due process)
13.1 11.9 10.4 12.8 15.1 22.4 15.2
Statistical significance: χ2(5) = 7.4, p = .194 Conclusion: There is not enough evidence from the data to say that the responses vary by facility type.
Travel/distance between schools
7.2 4.8 10.0 6.9 5.4 8.2 7.9
Statistical significance: χ2(5) = 5.8, p = .330 Conclusion: There is not enough evidence from the data to say that the responses vary by facility type.

ASHA 2018 SLP Schools Survey: Survey Summary Report
10
Employment and Earnings
5. Which one of the following categories best describes your employment status? (Percentages) Analyses limited to respondents who met the following criterion:
CCC-SLP
Status
Facility Type
All Facility Types
(n = 2,109)
Special Day/ Residential
(n = 84) Preschool (n = 279)
Elementary
(n = 1,196) Secondary (n = 279)
Admin. Office
(n = 49)
Combina-tion
(n = 164)
Employed full time 84.4 82.1 76.3 86.6 86.7 83.7 83.5
Employed part time 15.6 17.9 23.7 13.4 13.3 16.3 16.5
Not currently employed (SKIP to Q. 27.)
Removed from analyses
Statistical significance: χ2(5) = 20.0, p = .001, Cramer’s V = .099 Conclusion: There is adequate evidence from the data to say that the responses vary by facility type.
ASHA 2018 SLP Schools Survey: Survey Summary Report
11
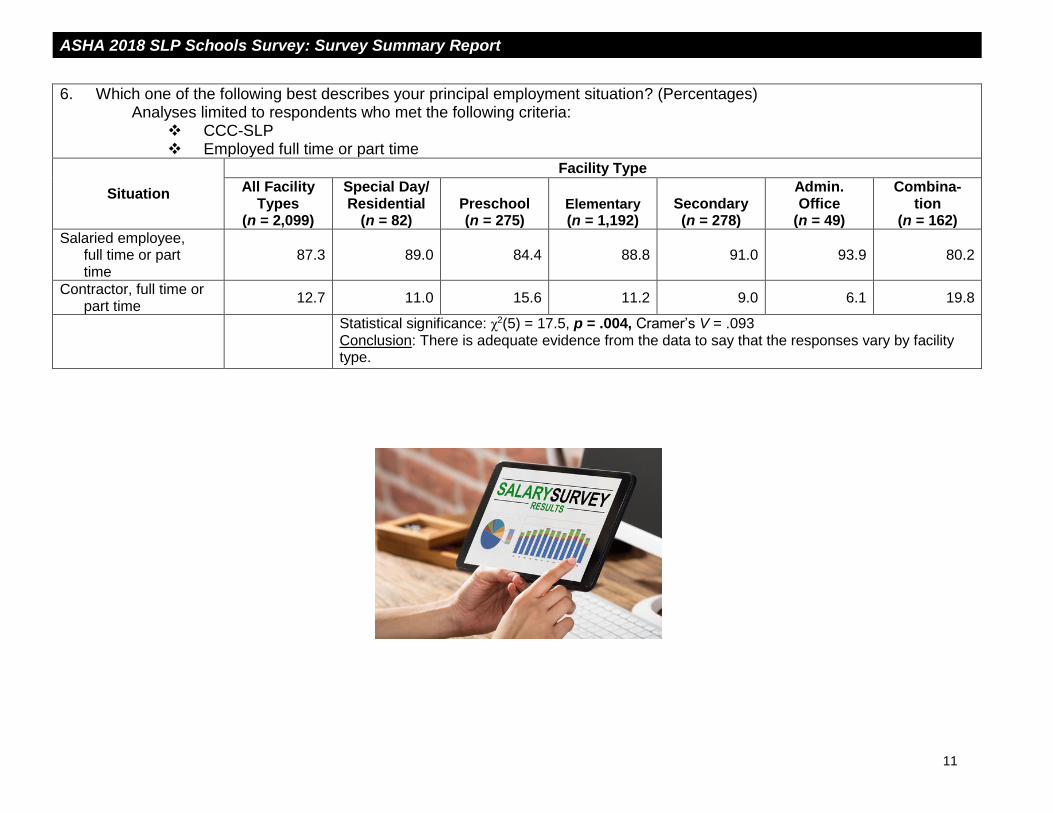
6. Which one of the following best describes your principal employment situation? (Percentages) Analyses limited to respondents who met the following criteria:
CCC-SLP Employed full time or part time
Situation
Facility Type
All Facility Types
(n = 2,099)
Special Day/ Residential
(n = 82) Preschool (n = 275)
Elementary
(n = 1,192) Secondary (n = 278)
Admin. Office
(n = 49)
Combina-tion
(n = 162)
Salaried employee, full time or part time
87.3 89.0 84.4 88.8 91.0 93.9 80.2
Contractor, full time or part time
12.7 11.0 15.6 11.2 9.0 6.1 19.8
Statistical significance: χ2(5) = 17.5, p = .004, Cramer’s V = .093 Conclusion: There is adequate evidence from the data to say that the responses vary by facility type.
ASHA 2018 SLP Schools Survey: Survey Summary Report
12
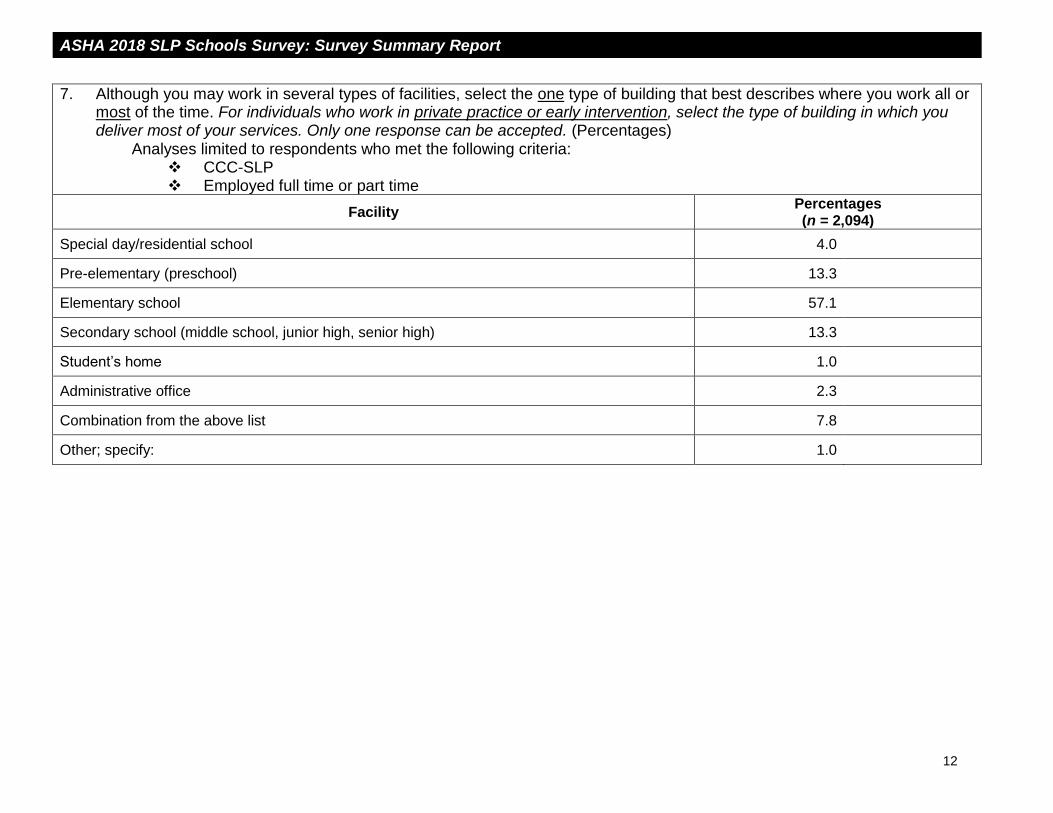
7. Although you may work in several types of facilities, select the one type of building that best describes where you work all or most of the time. For individuals who work in private practice or early intervention, select the type of building in which you deliver most of your services. Only one response can be accepted. (Percentages)
Analyses limited to respondents who met the following criteria: CCC-SLP Employed full time or part time
Facility Percentages (n = 2,094)
Special day/residential school 4.0
Pre-elementary (preschool) 13.3
Elementary school 57.1
Secondary school (middle school, junior high, senior high) 13.3
Student’s home 1.0
Administrative office 2.3
Combination from the above list 7.8
Other; specify: 1.0
ASHA 2018 SLP Schools Survey: Survey Summary Report
13
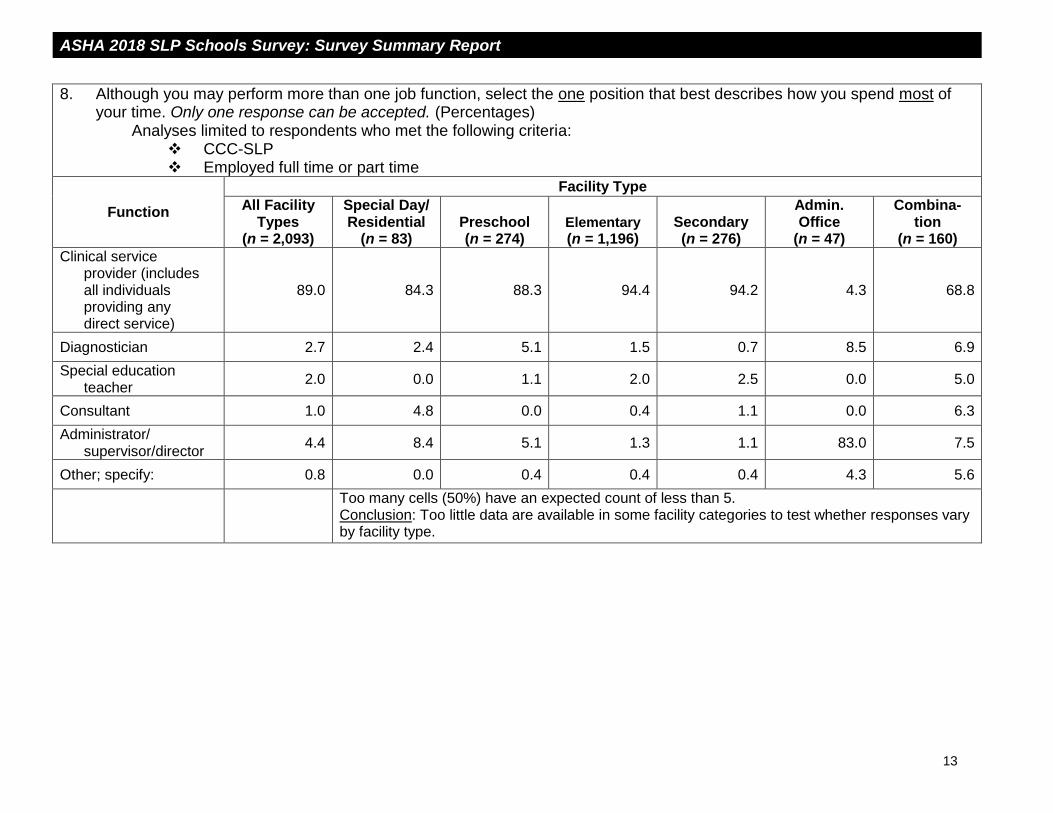
8. Although you may perform more than one job function, select the one position that best describes how you spend most of your time. Only one response can be accepted. (Percentages)
Analyses limited to respondents who met the following criteria: CCC-SLP Employed full time or part time
Function
Facility Type
All Facility Types
(n = 2,093)
Special Day/ Residential
(n = 83) Preschool (n = 274)
Elementary
(n = 1,196) Secondary (n = 276)
Admin. Office
(n = 47)
Combina-tion
(n = 160)
Clinical service provider (includes all individuals providing any direct service)
89.0 84.3 88.3 94.4 94.2 4.3 68.8
Diagnostician 2.7 2.4 5.1 1.5 0.7 8.5 6.9
Special education teacher
2.0 0.0 1.1 2.0 2.5 0.0 5.0
Consultant 1.0 4.8 0.0 0.4 1.1 0.0 6.3
Administrator/ supervisor/director
4.4 8.4 5.1 1.3 1.1 83.0 7.5
Other; specify: 0.8 0.0 0.4 0.4 0.4 4.3 5.6
Too many cells (50%) have an expected count of less than 5. Conclusion: Too little data are available in some facility categories to test whether responses vary by facility type.

ASHA 2018 SLP Schools Survey: Survey Summary Report
14
9. In your primary job, are you paid on an annual basis or an hourly basis? Select one response only. (Percentages) Analyses limited to respondents who met the following criteria:
CCC-SLP Employed full time or part time
Basis
Facility Type
All Facility Types
(n = 2,104)
Special Day/ Residential
(n = 83) Preschool (n = 278)
Elementary
(n = 1,195) Secondary (n = 279)
Admin. Office
(n = 49)
Combina-tion
(n = 160)
Annual salary 86.6 81.9 82.0 89.0 89.2 93.9 81.9
Hourly rate (SKIP to Q. 12.)
13.4 18.1 18.0 11.0 10.8 6.1 18.1
Statistical significance: χ2(5) = 19.3, p = .002, Cramer’s V = .097 Conclusion: There is adequate evidence from the data to say that the responses vary by facility type.

ASHA 2018 SLP Schools Survey: Survey Summary Report
15
10. What is your gross annual income for your primary job, before all deductions? Analyses limited to respondents who met the following criteria:
CCC-SLP Employed full time Annual salary of at least $1
Response
Facility Type
All Facility Types
Special Day/ Residential Preschool Elementary Secondary
Admin. Office
Combina-tion
Worked 9–10 months (academic year)
n = 1,411 n = 35 n = 147 n = 883 n = 211 n = 16 n = 99
25th percentile $53,000 $56,366 $51,717 $52,500 $55,000
(n < 25)
$54,558
50th percentile (Median)
$63,338 $66,201 $62,000 $62,715 $68,000 $64,495
75th percentile $78,000 $84,231 $74,794 $76,000 $84,087 $77,984
Mean $66,440 $74,784 $64,238 $65,549 $70,293 $66,062
Standard deviation $17,694 $26,397 $17,707 $16,905 $18,976 $15,407
Mode $70,000 $52,000 $52,000 $70,000 $70,000 $60,000
Statistical significance: F(5, 1384) = 4.8, p = .000 Conclusion: There is adequate evidence from the data to say that the responses vary by facility type.
(Question 10 continues on next page.)

ASHA 2018 SLP Schools Survey: Survey Summary Report
16
10. (cont’d) What is your gross annual income for your primary job, before all deductions? Analyses limited to respondents who met the following criteria:
CCC-SLP Employed full time Annual salary of at least $1
Response
Facility Type
All Facility Types
Special Day/ Residential Preschool Elementary Secondary
Admin. Office
Combina-tion
Worked 11–12 months (calendar year)
n = 160 n = 27 n = 34 n = 38 n = 7 n = 23 n = 17
25th percentile $62,000 $59,801 $62,000 $69,849
(n < 25) (n < 25) (n < 25)
50th percentile (Median)
$72,000 $71,000 $67,569 $80,000
75th percentile $88,000 $93,729 $79,123 $90,000
Mean $76,200 $75,391 $71,576 $77,307
Standard deviation $21,029 $19,575 $15,760 $15,084
Mode $80,000 $60,000 $70,000 $80,000
Statistical significance: F(5, 140) = 2.1, p = .072 Conclusion: There is not enough evidence from the data to say that the responses vary by facility type.

ASHA 2018 SLP Schools Survey: Survey Summary Report
17
11. For what period of work is this? If you work for 9–10 months but are paid over a 12-month period, select response “1.” Select one response only; then SKIP to Q. 14. (Percentages)
Analyses limited to respondents who met the following criteria: CCC-SLP Employed full time or part time Annual salary of at least $1
Response
Facility Type
All Facility Types
(n = 1,720)
Special Day/ Residential
(n = 66) Preschool (n = 209)
Elementary
(n = 1,005) Secondary (n = 232)
Admin. Office
(n = 43)
Combina-tion
(n = 128)
1 – Work 9 or 10 months per year
90.1 57.6 81.8 96.2 97.0 44.2 84.4
2 – Work 11 or 12 months per year
9.9 42.4 18.2 3.8 3.0 55.8 15.6
3 – Work other period Removed from analyses
Statistical significance: χ2(5) = 271.3, p = .000, Cramer’s V = .401 Conclusion: There is adequate evidence from the data to say that the responses vary by facility type.

ASHA 2018 SLP Schools Survey: Survey Summary Report
18
12. If you are paid on an hourly basis, what is the hourly rate you receive at your primary job? Include your hourly rate before all deductions.
Analyses limited to respondents who met the following criteria: CCC-SLP Hourly salary of at least $1 Worked at least 1 hour per week
Response
Facility Type
All Facility Types
Special Day/ Residential Preschool Elementary Secondary
Admin. Office
Combina-tion
21 or fewer hours
n = 136 n = 7 n = 32 n = 50 n = 19 n = 2 n = 15
25th percentile $44.00
(n < 25)
$45.00 $40.49
(n < 25) (n < 25) (n < 25)
50th percentile (Median)
$54.40 $60.00 $50.00
75th percentile $65.00 $65.00 $62.00
Mean $56.51 $56.49 $55.63
Standard deviation $18.19 $14.20 $20.46
Mode $50.00 $60.00 $50.00
Statistical significance: F(5, 118) = 0.063, p = .997 Conclusion: There is not enough evidence from the data to say that the responses vary by facility type.
(Question 12 continues on next page.)

ASHA 2018 SLP Schools Survey: Survey Summary Report
19
12. (cont’d) If you are paid on an hourly basis, what is the hourly rate you receive at your primary job? Include your hourly rate before all deductions.
Analyses limited to respondents who met the following criteria: CCC-SLP Hourly salary of at least $1 Worked at least 1 hour per week
Response Facility Type
All Facility Types
Special Day/ Residential Preschool Elementary Secondary
Admin. Office
Combina-tion
More than 21 hours
n = 130 n = 4 n = 17 n = 77 n = 9 n = 0 n = 12
25th percentile $38.21
(n < 25) (n < 25)
$39.13
(n < 25) (n < 25) (n < 25)
50th percentile (Median)
$50.00 $51.00
75th percentile $60.00 $60.00
Mean $50.68 $51.09
Standard deviation $16.58 $14.91
Mode $60.00 $60.00
Statistical significance: F(5, 113) = 0.515, p = .764 Conclusion: There is not enough evidence from the data to say that the responses vary by facility type.
ASHA 2018 SLP Schools Survey: Survey Summary Report
20
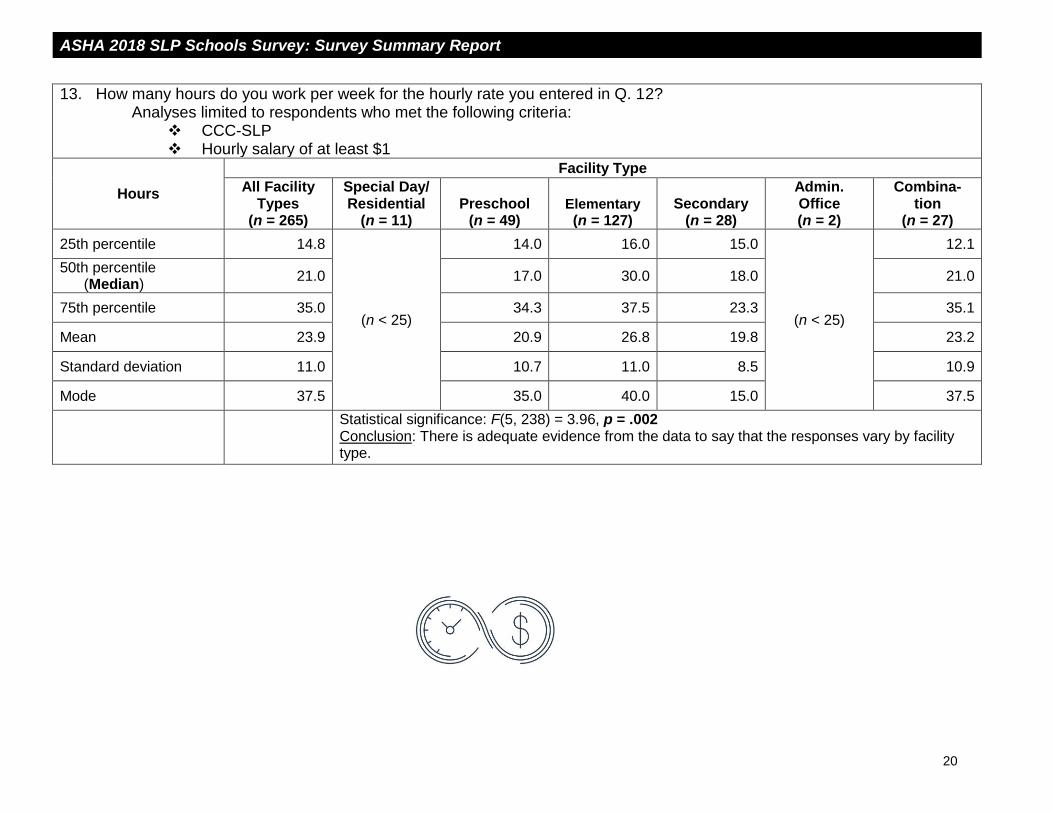
13. How many hours do you work per week for the hourly rate you entered in Q. 12? Analyses limited to respondents who met the following criteria:
CCC-SLP Hourly salary of at least $1
Hours
Facility Type
All Facility Types
(n = 265)
Special Day/ Residential
(n = 11) Preschool
(n = 49) Elementary
(n = 127) Secondary
(n = 28)
Admin. Office (n = 2)
Combina-tion
(n = 27)
25th percentile 14.8
(n < 25)
14.0 16.0 15.0
(n < 25)
12.1
50th percentile (Median)
21.0 17.0 30.0 18.0 21.0
75th percentile 35.0 34.3 37.5 23.3 35.1
Mean 23.9 20.9 26.8 19.8 23.2
Standard deviation 11.0 10.7 11.0 8.5 10.9
Mode 37.5 35.0 40.0 15.0 37.5
Statistical significance: F(5, 238) = 3.96, p = .002 Conclusion: There is adequate evidence from the data to say that the responses vary by facility type.

ASHA 2018 SLP Schools Survey: Survey Summary Report
21
Performance Evaluation
14. What system or tool is used to evaluate your performance? Select all that apply. Analyses limited to respondents who met the following criteria:
CCC-SLP Employed full time or part time
Response
Facility Type
All Facility Types
(n = 2,109)
Special Day/ Residential
(n ≥ 83) Preschool (n = 279)
Elementary
(n ≥ 1,195) Secondary (n ≥ 278)
Admin. Office
(n ≥ 49)
Combina-tion
(n ≥ 163) A performance evaluation system that is also used for classroom teachers
50.6 56.0 58.4 49.7 52.9 26.0 50.0
Statistical significance: χ2(5) = 20.8, p = .001, Cramer’s V = .101 Conclusion: There is adequate evidence from the data to say that the responses vary by facility type.
A performance evaluation system that is customized for audiologists or SLPs
31.9 28.9 24.4 35.2 33.7 32.7 22.6
Statistical significance: χ2(5) = 20.4, p = .001, Cramer’s V = .100 Conclusion: There is adequate evidence from the data to say that the responses vary by facility type.
The ASHA Performance Assessment of Contributions and Effectiveness of SLPs (PACE)
0.8 0.0 0.7 0.7 0.7 0.0 0.0
Too many cells (42%) have an expected count of less than 5. Conclusion: Too little data are available in some facility categories to test whether responses vary by facility type.
(Question 14 continues on next page.)
ASHA 2018 SLP Schools Survey: Survey Summary Report
22
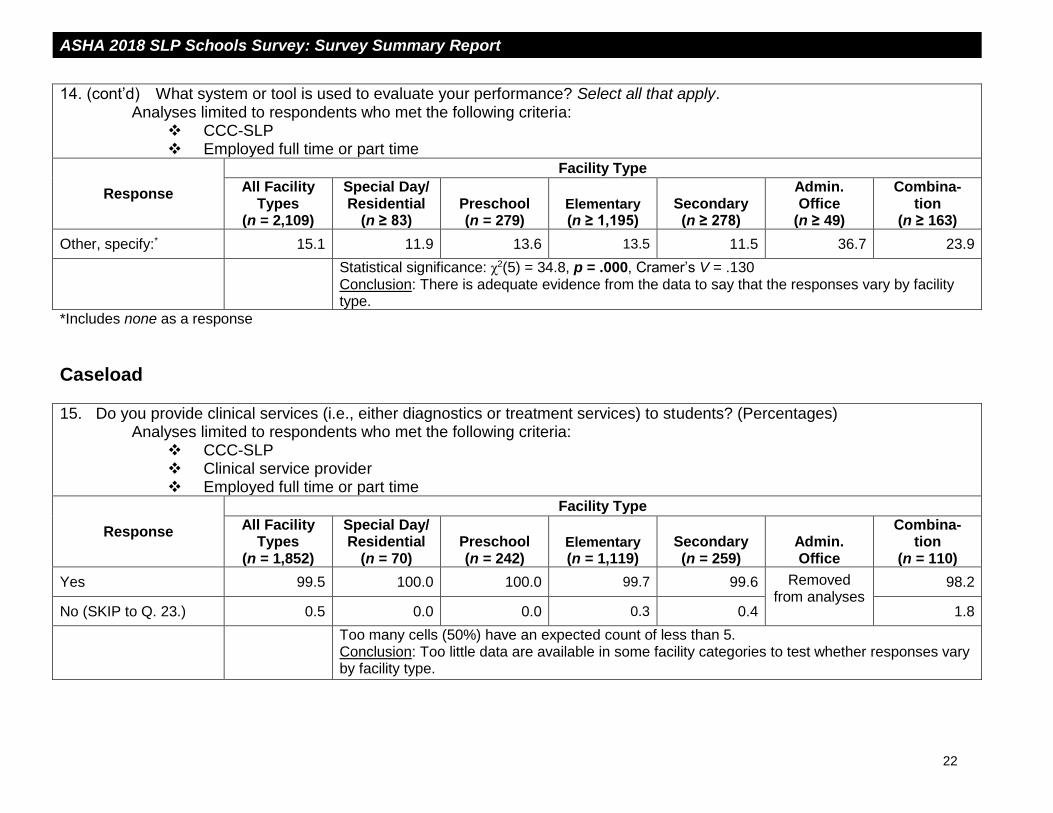
14. (cont’d) What system or tool is used to evaluate your performance? Select all that apply. Analyses limited to respondents who met the following criteria:
CCC-SLP Employed full time or part time
Response
Facility Type
All Facility Types
(n = 2,109)
Special Day/ Residential
(n ≥ 83) Preschool (n = 279)
Elementary
(n ≥ 1,195) Secondary (n ≥ 278)
Admin. Office
(n ≥ 49)
Combina-tion
(n ≥ 163)
Other, specify:* 15.1 11.9 13.6 13.5 11.5 36.7 23.9
Statistical significance: χ2(5) = 34.8, p = .000, Cramer’s V = .130 Conclusion: There is adequate evidence from the data to say that the responses vary by facility type.
*Includes none as a response
Caseload
15. Do you provide clinical services (i.e., either diagnostics or treatment services) to students? (Percentages) Analyses limited to respondents who met the following criteria:
CCC-SLP Clinical service provider Employed full time or part time
Response
Facility Type
All Facility Types
(n = 1,852)
Special Day/ Residential
(n = 70) Preschool (n = 242)
Elementary
(n = 1,119) Secondary (n = 259)
Admin. Office
Combina-tion
(n = 110)
Yes 99.5 100.0 100.0 99.7 99.6 Removed from analyses
98.2
No (SKIP to Q. 23.) 0.5 0.0 0.0 0.3 0.4 1.8
Too many cells (50%) have an expected count of less than 5. Conclusion: Too little data are available in some facility categories to test whether responses vary by facility type.

ASHA 2018 SLP Schools Survey: Survey Summary Report
23
16. What is your average monthly caseload size? Count each student only once. Analyses limited to respondents who met the following criteria:
CCC-SLP Clinical service provider Employed full time Response greater than 0
Response
Facility Type
All Facility Types
(n = 1,539)
Special Day/ Residential
(n = 56) Preschool (n = 177)
Elementary
(n = 968) Secondary (n = 215)
Admin. Office
Combina-tion
(n = 87)
25th percentile 36.0 16 30 40 38
Removed from analyses
32
50th percentile (Median)
48.0 27 40 50 48 48
75th percentile 59.0 45 50 60 60 60
Mean 47.5 34 40 50 48 47
Standard deviation 17.2 24 15 16 17 16
Mode 50.0 16 50 50 60 50
Statistical significance: F(4, 1498) = 24.1, p = .000 Conclusion: There is adequate evidence from the data to say that the responses vary by facility type.

ASHA 2018 SLP Schools Survey: Survey Summary Report
24
17. Indicate how many students you serve monthly in each of the following areas. Students who have overlapping areas of intervention may be counted more than once.
Analyses limited to respondents who met the following criteria: CCC-SLP Clinical service provider Employed full time Response to Q. 16 (caseload size) is at least 1
Area of Intervention
Facility Type
All Facility Types Special Day/Residential Preschool
Percentage who regularly serve clients with this disorder
Number served (mean)*
Percentage who regularly serve clients with this disorder
Number served (mean)*
Percentage who regularly serve clients with this disorder
Number served (mean)*
n = 1,539 n varies n = 56 n varies n = 177 n varies
Acquired brain injury (ABI) 14.6 1.6 18.2 (n < 25) 8.6 (n < 25)
Auditory processing disorder (APD) 31.9 5.3 36.4 (n < 25) 16.3 2.9
Autism spectrum disorder (ASD) 90.2 9.6 90.4 15.7 87.1 8.6
Childhood apraxia of speech (CAS) 60.4 2.9 53.3 3.4 74.3 3.5
Cognitive communication disorders 48.1 9.3 58.6 18.3 39.4 7.0
Dysphagia (swallowing/feeding) 10.5 2.6 32.9 (n < 25) 12.4 (n < 25)
Fluency disorders 67.4 2.5 33.8 (n < 25) 49.7 1.9
Hearing loss 44.8 2.3 28.9 (n < 25) 33.8 2.9
Language disorders: pragmatics/social communication
84.8 11.1 78.5 19.1 74.1 10.1
(Question 17 continues on next page.)
Note. n = 1,539. SLP = speech-language pathologist. *Includes only SLPs who do serve these students.

ASHA 2018 SLP Schools Survey: Survey Summary Report
25
17. (cont’d) Indicate how many students you serve monthly in each of the following areas. Students who have overlapping areas of
intervention may be counted more than once. Analyses limited to respondents who met the following criteria:
CCC-SLP Clinical service provider Employed full time Response to Q. 16 (caseload size) is at least 1
Area of Intervention
Facility Type
All Facility Types Special Day/Residential Preschool
Percentage who regularly serve clients with this disorder
Number served (mean)*
Percentage who regularly serve clients with this disorder
Number served (mean)*
Percentage who regularly serve clients with this disorder
Number served (mean)*
n = 1,539 n varies n = 56 n varies n = 177 n varies
Language disorders: semantics, morphology, syntax
90.8 21.4 66.3 22.4 85.8 18.0
Nonverbal, augmentative and alternative communication (AAC)
60.3 5.3 70.8 12.1 64.5 5.2
Reading and writing (literacy) 30.5 13.6 34.5 (n < 25) 6.0 (n < 25)
Selective mutism 18.6 1.3 10.3 (n < 25) 19.7 1.2
Speech sound disorders 89.9 18.0 68.4 8.8 89.0 17.3
Voice or resonance disorders 18.6 1.7 15.4 (n < 25) 14.7 1.4
(Question 17 continues on next page.)
Note. n = 1,539. SLP = speech-language pathologist. *Includes only SLPs who do serve these students.
ASHA 2018 SLP Schools Survey: Survey Summary Report
26
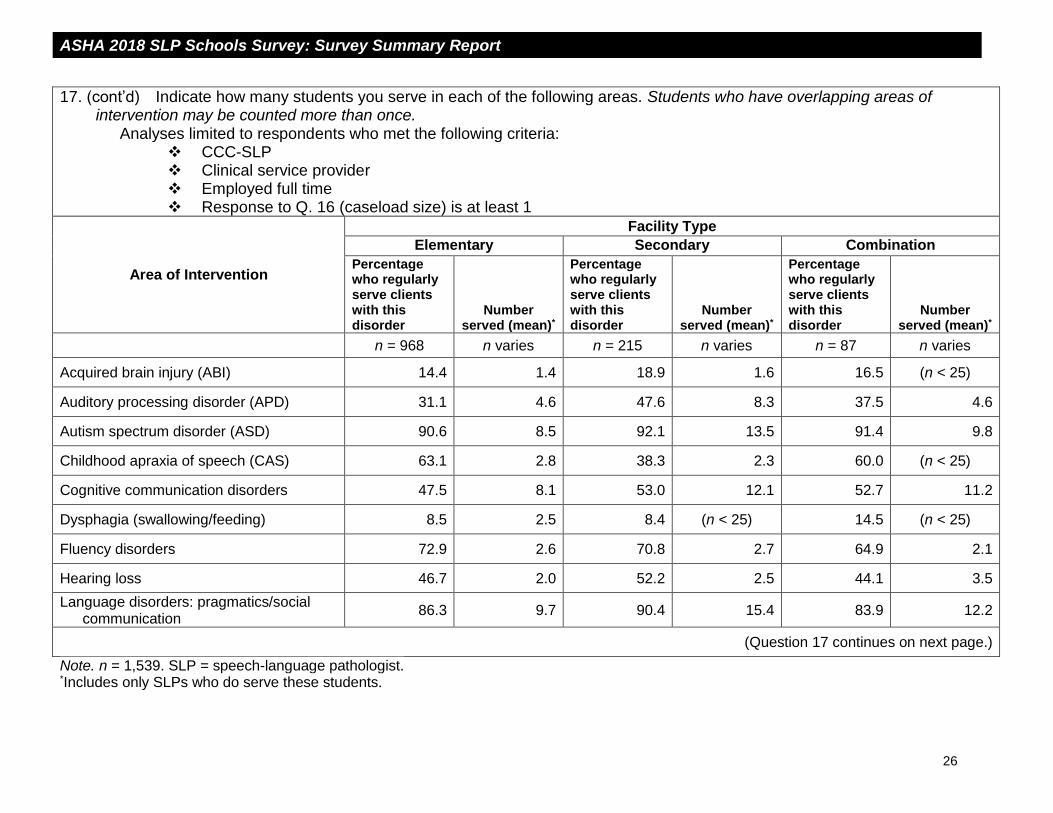
17. (cont’d) Indicate how many students you serve in each of the following areas. Students who have overlapping areas of
intervention may be counted more than once. Analyses limited to respondents who met the following criteria:
CCC-SLP Clinical service provider Employed full time Response to Q. 16 (caseload size) is at least 1
Area of Intervention
Facility Type
Elementary Secondary Combination
Percentage who regularly serve clients with this disorder
Number served (mean)*
Percentage who regularly serve clients with this disorder
Number served (mean)*
Percentage who regularly serve clients with this disorder
Number served (mean)*
n = 968 n varies n = 215 n varies n = 87 n varies
Acquired brain injury (ABI) 14.4 1.4 18.9 1.6 16.5 (n < 25)
Auditory processing disorder (APD) 31.1 4.6 47.6 8.3 37.5 4.6
Autism spectrum disorder (ASD) 90.6 8.5 92.1 13.5 91.4 9.8
Childhood apraxia of speech (CAS) 63.1 2.8 38.3 2.3 60.0 (n < 25)
Cognitive communication disorders 47.5 8.1 53.0 12.1 52.7 11.2
Dysphagia (swallowing/feeding) 8.5 2.5 8.4 (n < 25) 14.5 (n < 25)
Fluency disorders 72.9 2.6 70.8 2.7 64.9 2.1
Hearing loss 46.7 2.0 52.2 2.5 44.1 3.5
Language disorders: pragmatics/social communication
86.3 9.7 90.4 15.4 83.9 12.2
(Question 17 continues on next page.)
Note. n = 1,539. SLP = speech-language pathologist. *Includes only SLPs who do serve these students.

ASHA 2018 SLP Schools Survey: Survey Summary Report
27
17. (cont’d) Indicate how many students you serve in each of the following areas. Students who have overlapping areas of
intervention may be counted more than once. Analyses limited to respondents who met the following criteria:
CCC-SLP Clinical service provider Employed full time Response to Q. 16 (caseload size) is at least 1
Area of Intervention
Facility Type
Elementary Secondary Combination
Percentage who regularly serve clients with this disorder
Number served (mean)*
Percentage who regularly serve clients with this disorder
Number served (mean)*
Percentage who regularly serve clients with this disorder
Number served (mean)*
n = 968 n varies n = 215 n varies n = 87 n varies
Language disorders: semantics, morphology, syntax
92.9 21.3 92.0 24.2 94.9 21.7
Nonverbal, augmentative and alternative communication (AAC)
58.5 4.5 61.2 5.4 70.7 7.1
Reading and writing (literacy) 31.1 12.6 48.2 17.8 33.1 14.2
Selective mutism 18.0 1.4 22.6 1.4 17.3 (n < 25)
Speech sound disorders 93.7 20.8 78.7 7.3 93.3 16.1
Voice or resonance disorders 20.1 1.6 20.0 1.9 9.7 (n < 25)
Note. n = 1,539. SLP = speech-language pathologist. *Includes only SLPs who do serve these students.

ASHA 2018 SLP Schools Survey: Survey Summary Report
28
18. What is the approximate number of students in your caseload receiving the following amount of therapy per week? Analyses limited to respondents who met the following criteria:
CCC-SLP Clinical service provider Employed full time Response to Q. 16 (caseload size) is at least 1
Response
Facility Type
All Facility Types
Special Day/ Residential Preschool Elementary Secondary
Admin. Office
Combina-tion
Up to 1 hour
n = 1,351 n = 43 n = 148 n = 871 n = 186
Removed from analyses
n = 76
25th percentile 26.0 5.4 19.0 30.0 29.5 30.0
50th percentile (Median)
40.0 24.8 34.0 43.0 40.0 44.5
75th percentile 53.0 47.5 46.0 55.0 52.0 56.0
Mean 40.0 27.8 32.9 41.7 39.5 41.5
Standard deviation 19.8 21.5 18.8 19.2 20.2 20.0
Mode 50.0 2.0 30.0 50.0 50.0 30.0
Tests of significance could not be run using the available software.
(Question 18 continues on next page.)

ASHA 2018 SLP Schools Survey: Survey Summary Report
29
18. (cont’d) What is the approximate number of students in your caseload receiving the following amount of therapy per week? Analyses limited to respondents who met the following criteria:
CCC-SLP Clinical service provider Employed full time Response to Q. 16 (caseload size) is at least 1
Response
Facility Type
All Facility Types
Special Day/ Residential Preschool Elementary Secondary
Admin. Office
Combina-tion
Between 1 and 5 hours
n = 890 n = 41 n = 96 n = 572 n = 125
Removed from analyses
n = 44
25th percentile 3.0 5.0 3.0 2.0 4.0 3.0
50th percentile (Median)
7.0 11.0 10.0 6.0 8.0 10.0
75th percentile 20.0 16.0 20.0 17.0 24.0 20.8
Mean 13.0 11.2 14.0 12.3 14.6 14.9
Standard deviation 14.3 7.8 14.0 14.2 13.9 15.7
Mode 2.0 16.0 5.0 2.0 5.0 3.0
Tests of significance could not be run using the available software.
(Question 18 continues on next page.)

ASHA 2018 SLP Schools Survey: Survey Summary Report
30
18. (cont’d) What is the approximate number of students in your caseload receiving the following amount of therapy per week? Analyses limited to respondents who met the following criteria:
CCC-SLP Clinical service provider Employed full time Response to Q. 16 (caseload size) is at least 1
Response Facility Type
All Facility Types
Special Day/ Residential Preschool Elementary Secondary
Admin. Office
Combina-tion
More than 5 hours
n = 31 n = 0 n = 2 n = 24 n = 4
Removed from analyses
n = 0
25th percentile 0.8
(n < 25) (n < 25) (n < 25) (n < 25) (n < 25)
50th percentile (Median)
2.0
75th percentile 12.0
Mean 7.8
Standard deviation 11.6
Mode 0.0
Tests of significance could not be run using the available software.

ASHA 2018 SLP Schools Survey: Survey Summary Report
31
19. How many hours do you spend on each of the following activities in a typical WEEK? Enter “0” if none. (Mean hours)
Analyses limited to respondents who met the following criteria: CCC-SLP Clinical service provider Employed full time Response to Q. 16 (caseload size) is at least 1 Total number of hours for Q. 19 was limited to a maximum of 52 which captured 97% of respondents.
Activity
Facility Type
All Facility Types
(n = 1,423)
Special Day/ Residential
(n = 52) Preschool (n = 163)
Elementary
(n = 892) Secondary (n = 200)
Admin. Office
Combina-tion
(n = 84)
MTSS/RTI activities 2.2 2.2 2.3 2.3 2.0
Removed from analyses
2.2
Diagnostic evaluations (e.g., observation, screening, scoring, analysis)
4.4 4.0 4.9 4.3 4.6 4.3
Direct intervention: classroom based/ integrated services
7.3 9.9 12.2 5.1 9.4 9.5
Direct intervention: pullout
20.2 16.1 16.8 21.8 17.8 19.3
Collaborative consultation
2.3 2.7 2.8 2.0 2.7 2.6
Services to section 504 students
2.2 1.0 1.6 2.1 1.6 8.1
Technological support (e.g., hearing aids/ CIs, AAC)
1.8 2.6 1.5 1.6 2.1 1.9
Supervision 4.0 3.0 3.9 4.4 3.3 3.7
Tests of significance could not be run using the available software.
Note. MTSS = multi-tiered system of support. RTI = response to intervention. CI = cochlear implant. AAC = augmentative and alternative communication.
ASHA 2018 SLP Schools Survey: Survey Summary Report
32
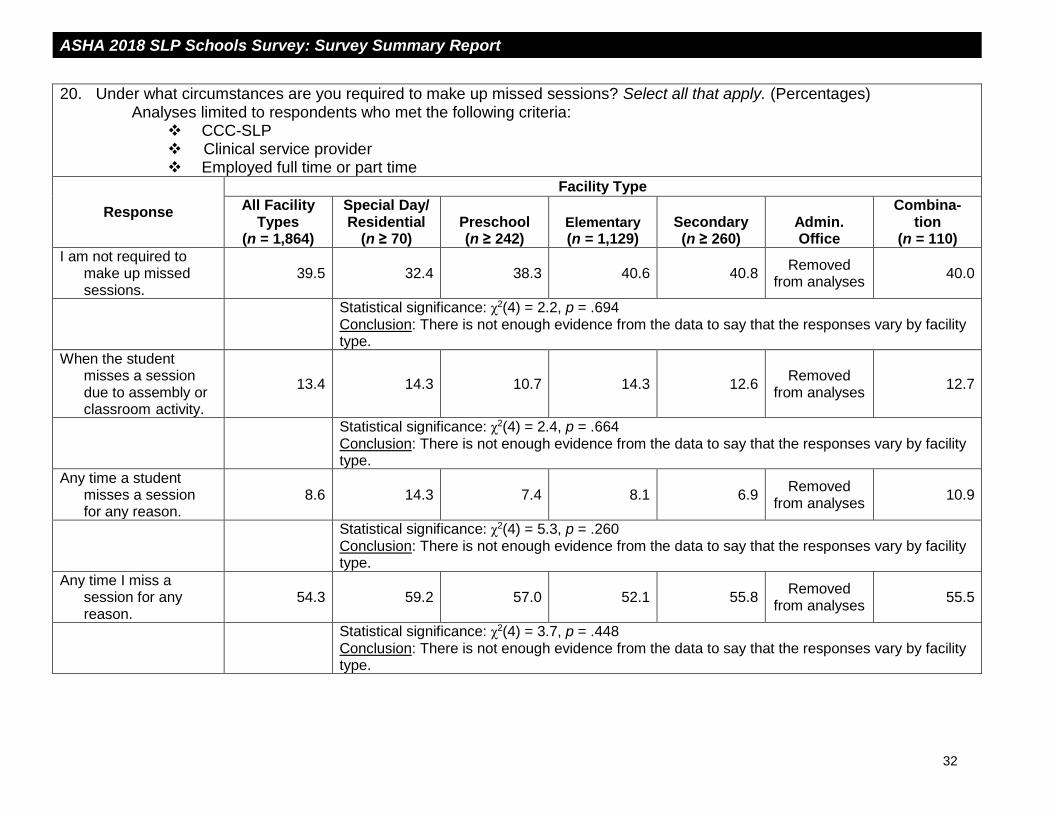
20. Under what circumstances are you required to make up missed sessions? Select all that apply. (Percentages) Analyses limited to respondents who met the following criteria:
CCC-SLP Clinical service provider Employed full time or part time
Response
Facility Type
All Facility Types
(n = 1,864)
Special Day/ Residential
(n ≥ 70) Preschool (n ≥ 242)
Elementary
(n = 1,129) Secondary (n ≥ 260)
Admin. Office
Combina-tion
(n = 110)
I am not required to make up missed sessions.
39.5 32.4 38.3 40.6 40.8 Removed
from analyses 40.0
Statistical significance: χ2(4) = 2.2, p = .694 Conclusion: There is not enough evidence from the data to say that the responses vary by facility type.
When the student misses a session due to assembly or classroom activity.
13.4 14.3 10.7 14.3 12.6 Removed
from analyses 12.7
Statistical significance: χ2(4) = 2.4, p = .664 Conclusion: There is not enough evidence from the data to say that the responses vary by facility type.
Any time a student misses a session for any reason.
8.6 14.3 7.4 8.1 6.9 Removed
from analyses 10.9
Statistical significance: χ2(4) = 5.3, p = .260 Conclusion: There is not enough evidence from the data to say that the responses vary by facility type.
Any time I miss a session for any reason.
54.3 59.2 57.0 52.1 55.8 Removed
from analyses 55.5
Statistical significance: χ2(4) = 3.7, p = .448 Conclusion: There is not enough evidence from the data to say that the responses vary by facility type.
ASHA 2018 SLP Schools Survey: Survey Summary Report
33
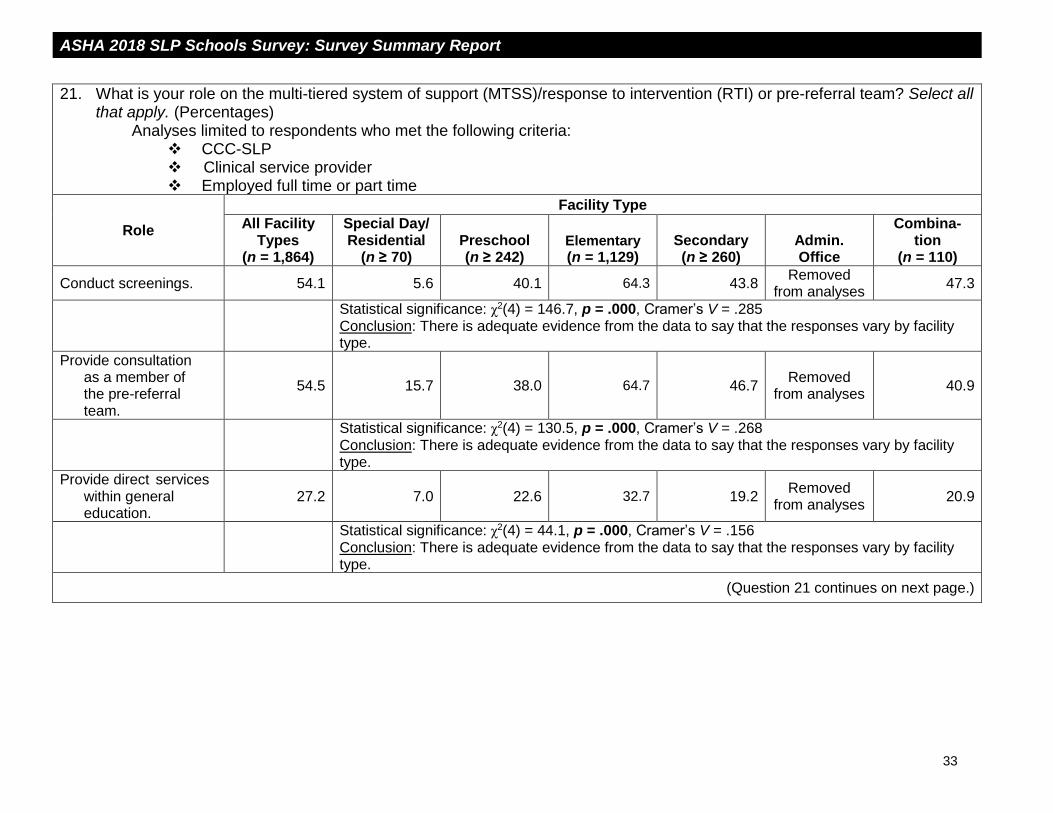
21. What is your role on the multi-tiered system of support (MTSS)/response to intervention (RTI) or pre-referral team? Select all that apply. (Percentages)
Analyses limited to respondents who met the following criteria: CCC-SLP Clinical service provider Employed full time or part time
Role
Facility Type
All Facility Types
(n = 1,864)
Special Day/ Residential
(n ≥ 70) Preschool (n ≥ 242)
Elementary
(n = 1,129) Secondary (n ≥ 260)
Admin. Office
Combina-tion
(n = 110)
Conduct screenings. 54.1 5.6 40.1 64.3 43.8 Removed
from analyses 47.3
Statistical significance: χ2(4) = 146.7, p = .000, Cramer’s V = .285 Conclusion: There is adequate evidence from the data to say that the responses vary by facility type.
Provide consultation as a member of the pre-referral team.
54.5 15.7 38.0 64.7 46.7 Removed
from analyses 40.9
Statistical significance: χ2(4) = 130.5, p = .000, Cramer’s V = .268 Conclusion: There is adequate evidence from the data to say that the responses vary by facility type.
Provide direct services within general education.
27.2 7.0 22.6 32.7 19.2 Removed
from analyses 20.9
Statistical significance: χ2(4) = 44.1, p = .000, Cramer’s V = .156 Conclusion: There is adequate evidence from the data to say that the responses vary by facility type.
(Question 21 continues on next page.)
ASHA 2018 SLP Schools Survey: Survey Summary Report
34
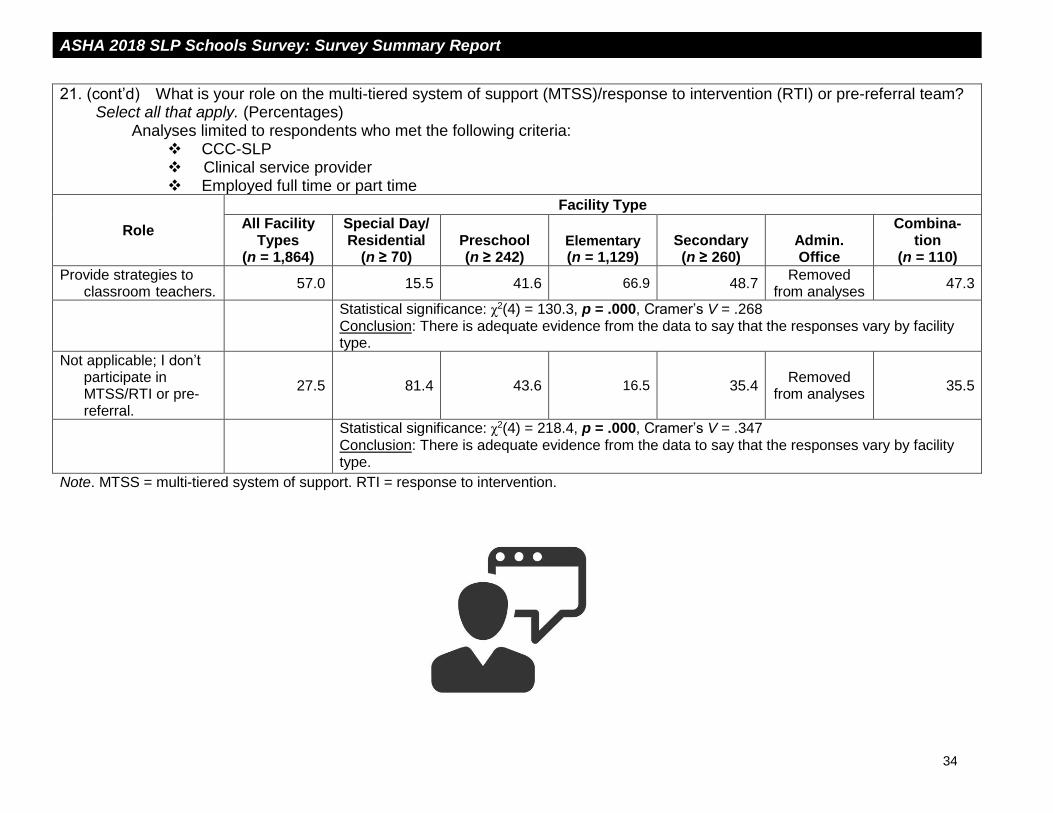
21. (cont’d) What is your role on the multi-tiered system of support (MTSS)/response to intervention (RTI) or pre-referral team? Select all that apply. (Percentages)
Analyses limited to respondents who met the following criteria: CCC-SLP Clinical service provider Employed full time or part time
Role
Facility Type
All Facility Types
(n = 1,864)
Special Day/ Residential
(n ≥ 70) Preschool (n ≥ 242)
Elementary
(n = 1,129) Secondary (n ≥ 260)
Admin. Office
Combina-tion
(n = 110)
Provide strategies to classroom teachers.
57.0 15.5 41.6 66.9 48.7 Removed
from analyses 47.3
Statistical significance: χ2(4) = 130.3, p = .000, Cramer’s V = .268 Conclusion: There is adequate evidence from the data to say that the responses vary by facility type.
Not applicable; I don’t participate in MTSS/RTI or pre- referral.
27.5 81.4 43.6 16.5 35.4 Removed
from analyses 35.5
Statistical significance: χ2(4) = 218.4, p = .000, Cramer’s V = .347 Conclusion: There is adequate evidence from the data to say that the responses vary by facility type.
Note. MTSS = multi-tiered system of support. RTI = response to intervention.

ASHA 2018 SLP Schools Survey: Survey Summary Report
35
Birth Through Five
22. Select up to three (3) of the top issues that affect your work with children 5 and under. (Percentages) Analyses limited to respondents who met the following criteria:
CCC-SLP Clinical service provider
Issue
Facility Type
All Facility Types
(n = 1,620)
Special Day/ Residential
(n ≥ 65) Preschool (n ≥ 236)
Elementary
(n = 968) Secondary (n = 200)
Admin. Office
Combina-tion
(n ≥ 103)
Changing eligibility criteria that exclude children who need services
20.4 12.1 36.0 18.9 7.0 Removed
from analyses 23.3
Statistical significance: χ2(4) = 63.0, p = .000, Cramer’s V = .200 Conclusion: There is adequate evidence from the data to say that the responses vary by facility type.
Inadequate reimbursement or funding for services
11.1 9.1 24.2 8.8 4.5 Removed
from analyses 15.5
Statistical significance: χ2(4) = 57.6, p = .000, Cramer’s V = .191 Conclusion: There is adequate evidence from the data to say that the responses vary by facility type.
Lack of qualified providers to deliver services
15.8 7.6 23.6 16.3 3.0 Removed
from analyses 18.3
Statistical significance: χ2(4) = 40.1, p = .000, Cramer’s V = .160 Conclusion: There is adequate evidence from the data to say that the responses vary by facility type.
(Question 22 continues on next page.)

ASHA 2018 SLP Schools Survey: Survey Summary Report
36
22. (cont’d) Select up to three (3) of the top issues that affect your work with children 5 and under. (Percentages) Analyses limited to respondents who met the following criterion:
CCC-SLP Clinical service provider
Issue
Facility Type
All Facility Types
(n = 1,620)
Special Day/ Residential
(n ≥ 65) Preschool (n ≥ 236)
Elementary
(n = 968) Secondary (n = 200)
Admin. Office
Combina-tion
(n ≥ 103)
Lack of sufficient training or professional development for audiologists or SLPs
9.7 9.1 12.7 10.8 3.5 Removed
from analyses 7.7
Statistical significance: χ2(4) = 12.8, p = .012, Cramer’s V = .090 Conclusion: There is adequate evidence from the data to say that the responses vary by facility type.
Other professionals taking primary role in communication or swallowing services
8.2 9.1 13.1 6.9 4.5 Removed
from analyses 9.7
Statistical significance: χ2(4) = 13.9, p = .008, Cramer’s V = .094 Conclusion: There is adequate evidence from the data to say that the responses vary by facility type.
Parents who are not receptive to coaching
21.9 15.4 29.5 21.9 6.0 Removed
from analyses 27.2
Statistical significance: χ2(4) = 41.5, p = .000, Cramer’s V = .162 Conclusion: There is adequate evidence from the data to say that the responses vary by facility type.
Serving as primary provider in areas outside my scope
8.3 6.1 12.7 8.2 3.0 Removed
from analyses 10.6
Statistical significance: χ2(4) = 14.5, p = .006, Cramer’s V = .096 Conclusion: There is adequate evidence from the data to say that the responses vary by facility type.
(Question 22 continues on next page.)

ASHA 2018 SLP Schools Survey: Survey Summary Report
37
22. (cont’d) Select up to three (3) of the top issues that affect your work with children 5 and under. (Percentages) Analyses limited to respondents who met the following criterion:
CCC-SLP Clinical service provider
Issue
Facility Type
All Facility Types
(n = 1,620)
Special Day/ Residential
(n ≥ 65) Preschool (n ≥ 236)
Elementary
(n = 968) Secondary (n = 200)
Admin. Office
Combina-tion
(n ≥ 103)
None of the above or NA
51.2 69.2 25.0 51.1 84.5 Removed
from analyses 47.6
Statistical significance: χ2(4) = 162.4, p = .000, Cramer’s V = .321 Conclusion: There is adequate evidence from the data to say that the responses vary by facility type.
ASHA 2018 SLP Schools Survey: Survey Summary Report
38
Supervision
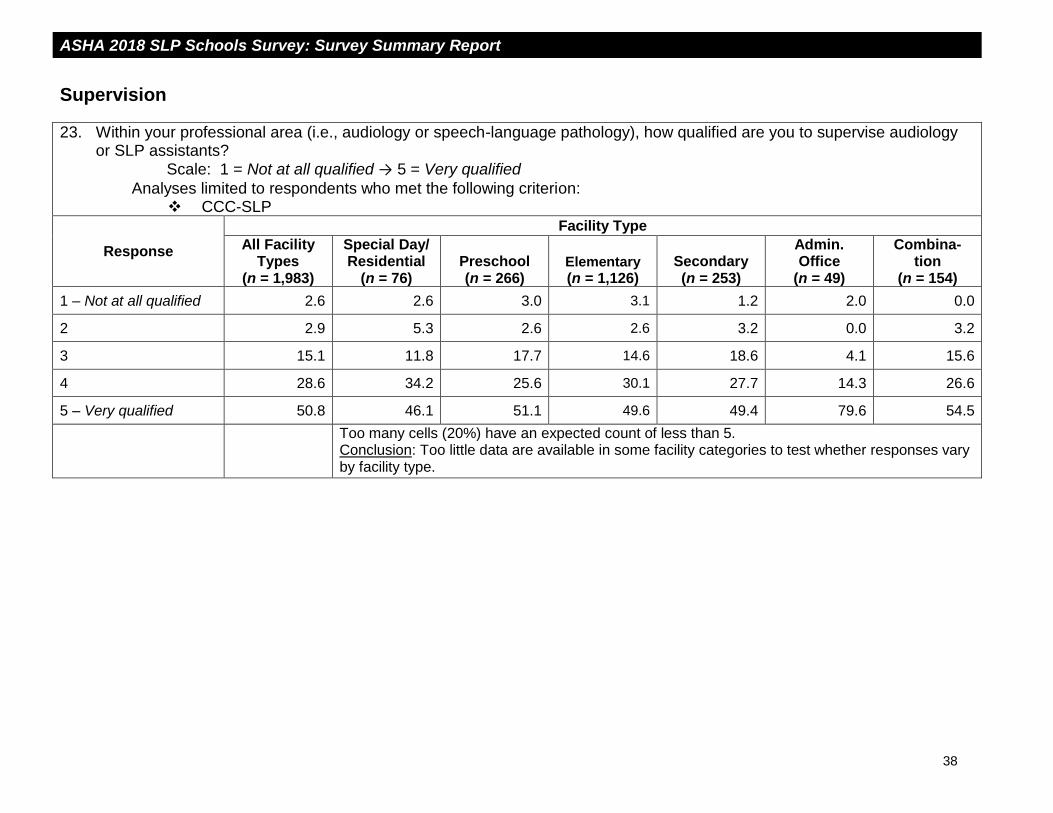
23. Within your professional area (i.e., audiology or speech-language pathology), how qualified are you to supervise audiology or SLP assistants?
Scale: 1 = Not at all qualified → 5 = Very qualified
Analyses limited to respondents who met the following criterion: CCC-SLP
Response
Facility Type
All Facility Types
(n = 1,983)
Special Day/ Residential
(n = 76) Preschool (n = 266)
Elementary
(n = 1,126) Secondary (n = 253)
Admin. Office
(n = 49)
Combina-tion
(n = 154)
1 – Not at all qualified 2.6 2.6 3.0 3.1 1.2 2.0 0.0
2 2.9 5.3 2.6 2.6 3.2 0.0 3.2
3 15.1 11.8 17.7 14.6 18.6 4.1 15.6
4 28.6 34.2 25.6 30.1 27.7 14.3 26.6
5 – Very qualified 50.8 46.1 51.1 49.6 49.4 79.6 54.5
Too many cells (20%) have an expected count of less than 5. Conclusion: Too little data are available in some facility categories to test whether responses vary by facility type.

ASHA 2018 SLP Schools Survey: Survey Summary Report
39
24. How many audiology or SLP assistants do you currently supervise? Put “0” if none. If “0,” skip to Q. 26. Analyses limited to respondents who met the following criteria:
CCC-SLP Clinical service provider or diagnostician Employed full time or part time Response greater than 0
Response
Facility Type
All Facility Types
(n = 240)
Special Day/ Residential
(n = 12) Preschool
(n = 32) Elementary
(n = 145) Secondary
(n = 24) Admin. Office
Combina-tion
(n = 21)
25th percentile 1.0
(n < 25)
1.0 1.0
(n < 25) Removed
from analyses (n < 25)
50th percentile (Median)
1.0 1.0 1.0
75th percentile 1.0 1.0 1.0
Mean 1.4 1.2 1.3
Standard deviation 1.2 0.7 1.0
Mode 1.0 1.0 1.0
Statistical significance: F(4, 228) = 3.7, p = .006 Conclusion: There is adequate evidence from the data to say that the responses vary by facility type.

ASHA 2018 SLP Schools Survey: Survey Summary Report
40
25. How does supervision of the audiology or SLP assistant impact your caseload and workload? “Caseload” is based only on the number of students served, whereas “workload” is based on ALL required and performed activities. (Percentages)
Analyses limited to respondents who met the following criteria: CCC-SLP Clinical service provider or diagnostician Employed full time or part time Response to Q. 24 (number of aides) is greater than 0
Impact
Facility Type
All Facility Types
(n = 238)
Special Day/ Residential
(n = 13) Preschool
(n = 32) Elementary
(n ≥ 143) Secondary
(n ≥ 22) Admin. Office
Combina-tion
(n = 20)
Caseload
Increases my caseload 26.7 (n < 25) 21.9 25.2 (n < 25) Removed
from analyses (n < 25)
Decreases my caseload
35.9 (n < 25) 28.1 41.3 (n < 25) Removed
from analyses (n < 25)
No impact on my caseload
33.3 (n < 25) 43.8 31.5 (n < 25) Removed
from analyses (n < 25)
Don’t know, NA (caseload)
4.0 (n < 25) 6.3 2.1 (n < 25) Removed
from analyses (n < 25)
Too many cells (35%) have an expected count of less than 5. Conclusion: Too little data are available in some facility categories to test whether responses vary by facility type.
Workload
Increases my workload 46.3 (n < 25) 43.8 43.8 (n < 25) Removed
from analyses (n < 25)
Decreases my workload
30.3 (n < 25) 37.5 33.3 (n < 25) Removed
from analyses (n < 25)
No impact on my workload
19.8 (n < 25) 12.5 20.8 (n < 25) Removed
from analyses (n < 25)
Don’t know, NA (workload)
3.7 (n < 25) 6.3 2.1 (n < 25) Removed
from analyses (n < 25)
Too many cells (40%) have an expected count of less than 5. Conclusion: Too little data are available in some facility categories to test whether responses vary by facility type.

ASHA 2018 SLP Schools Survey: Survey Summary Report
41
Ethics
26. Which of the issues below present you with significant ethical challenges? Select all that apply. (Percentages) Responses were in alphabetical order on survey instrument.
Analyses limited to respondents who met the following criterion: CCC-SLP
Challenge
Facility Type
All Facility Types
(n = 2,170)
Special Day/ Residential
(n ≥ 83) Preschool (n = 280)
Elementary
(n ≥ 1,195) Secondary (n = 279)
Admin. Office
(n = 49)
Combina-tion
(n ≥ 163)
Compromising quality of services
40.5 39.3 46.4 44.5 35.1 22.4 33.7
Statistical significance: χ2(5) = 23.3, p = .000, Cramer’s V = .107 Conclusion: There is adequate evidence from the data to say that the responses vary by facility type.
Adhering to administrative and regulatory mandates
20.6 26.2 22.5 22.0 16.8 20.4 17.7
Statistical significance: χ2(5) = 6.4, p = .270 Conclusion: There is not enough evidence from the data to say that the responses vary by facility type.
Completing Medicaid billing
17.8 13.3 18.2 19.5 16.1 16.3 18.3
Statistical significance: χ2(5) = 3.5, p = .624 Conclusion: There is not enough evidence from the data to say that the responses vary by facility type.
(Question 26 continues on next page.)

ASHA 2018 SLP Schools Survey: Survey Summary Report
42
26. (cont’d) Which of the issues below present you with significant ethical challenges? Select all that apply. (Percentages) Responses were in alphabetical order on survey instrument.
Analyses limited to respondents who met the following criterion: CCC-SLP
Challenge
Facility Type
All Facility Types
(n = 2,170)
Special Day/ Residential
(n ≥ 83) Preschool (n = 280)
Elementary
(n ≥ 1,195) Secondary (n = 279)
Admin. Office
(n = 49)
Combina-tion
(n ≥ 163)
Feeling pressured by an employer, administrator, or supervisor to provide or deny a service, report scores, etc. that would be in violation of the ASHA Code of Ethics
12.9 15.5 13.9 12.7 15.1 8.2 16.0
Statistical significance: χ2(5) = 3.6, p = .614 Conclusion: There is not enough evidence from the data to say that the responses vary by facility type.
Supervising support personnel, CFs, etc.
2.3 1.2 2.9 2.3 2.2 4.1 1.8
Too many cells (25%) have an expected count of less than 5. Conclusion: Too little data are available in some facility categories to test whether responses vary by facility type.
Reading confidential or inappropriate information about a student posted by an audiologist or SLP on social media
1.7 3.6 1.4 1.7 2.5 0.0 1.2
Too many cells (42%) have an expected count of less than 5. Conclusion: Too little data are available in some facility categories to test whether responses vary by facility type.
(Question 26 continues on next page.)

ASHA 2018 SLP Schools Survey: Survey Summary Report
43
26. (cont’d) Which of the issues below present you with significant ethical challenges? Select all that apply. (Percentages) Responses were in alphabetical order on survey instrument.
Analyses limited to respondents who met the following criterion: CCC-SLP
Challenge
Facility Type
All Facility Types
(n = 2,170)
Special Day/ Residential
(n ≥ 83) Preschool (n = 280)
Elementary
(n ≥ 1,195) Secondary (n = 279)
Admin. Office
(n = 49)
Combina-tion
(n ≥ 163)
None of the above 39.6 48.2 36.8 38.2 45.9 53.1 45.1
Statistical significance: χ2(5) = 14.3, p = .014, Cramer’s V = .083 Conclusion: There is adequate evidence from the data to say that the responses vary by facility type.
Note. CF = Clinical Fellowship.

ASHA 2018 SLP Schools Survey: Survey Summary Report
44
Journals
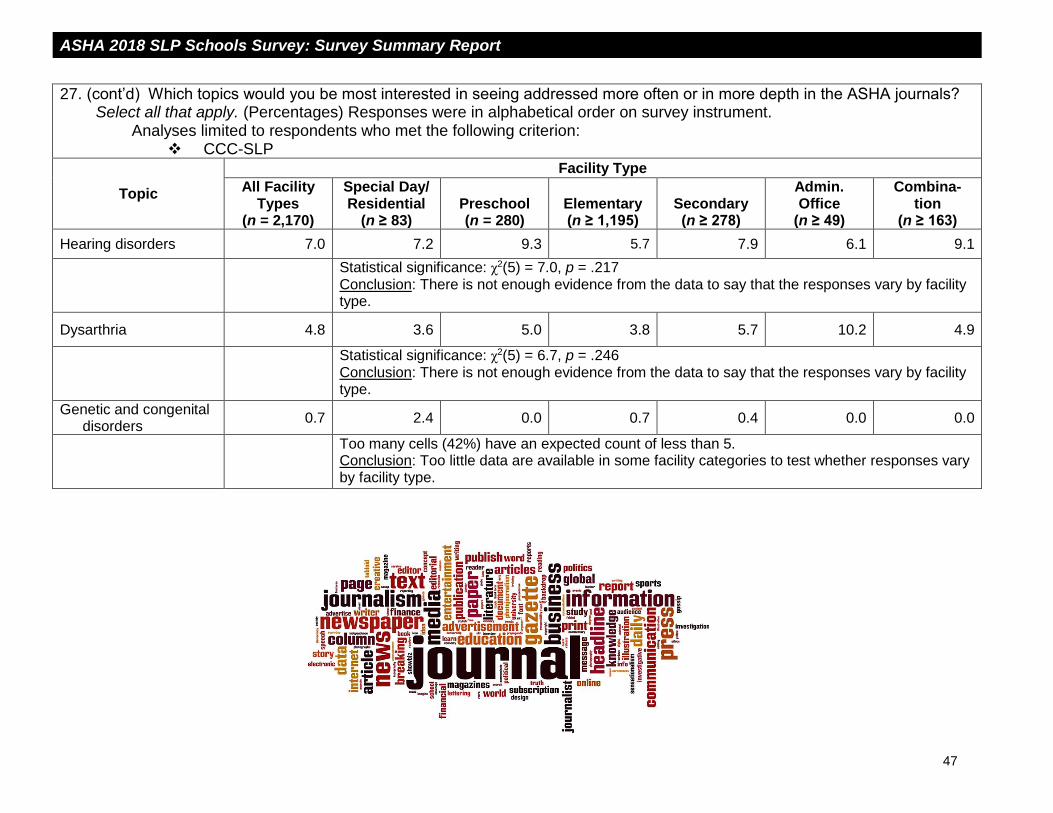
27. Which topics would you be most interested in seeing addressed more often or in more depth in the ASHA journals? Select all that apply. (Percentages) Responses were in alphabetical order on survey instrument.
Analyses limited to respondents who met the following criterion: CCC-SLP
Topic
Facility Type
All Facility Types
(n = 2,170)
Special Day/ Residential
(n ≥ 83) Preschool (n = 280)
Elementary (n ≥ 1,195)
Secondary (n ≥ 278)
Admin. Office
(n ≥ 49)
Combina-tion
(n ≥ 163)
Social communication and pragmatic disorders
60.8 73.8 61.8 58.7 74.2 69.4 54.3
Statistical significance: χ2(5) = 33.3, p = .000, Cramer’s V = .127 Conclusion: There is adequate evidence from the data to say that the responses vary by facility type.
Autism spectrum disorder (ASD)
50.2 67.5 51.8 48.7 54.8 53.1 45.7
Statistical significance: χ2(5) = 14.9, p = .011, Cramer’s V = .085 Conclusion: There is adequate evidence from the data to say that the responses vary by facility type.
Childhood apraxia of speech (CAS)
48.2 34.9 70.0 49.9 23.7 44.9 45.4
Statistical significance: χ2(5) = 128.6, p = .000, Cramer’s V = .250 Conclusion: There is adequate evidence from the data to say that the responses vary by facility type.
Specific language impairment (SLI)
42.5 17.9 35.7 48.4 39.8 42.9 34.1
Statistical significance: χ2(5) = 48.4, p = .000, Cramer’s V = .154 Conclusion: There is adequate evidence from the data to say that the responses vary by facility type.
(Question 27 continues on next page.)

ASHA 2018 SLP Schools Survey: Survey Summary Report
45
27. (cont’d) Which topics would you be most interested in seeing addressed more often or in more depth in the ASHA journals? Select all that apply. (Percentages) Responses were in alphabetical order on survey instrument.
Analyses limited to respondents who met the following criterion: CCC-SLP
Topic
Facility Type
All Facility Types
(n = 2,170)
Special Day/ Residential
(n ≥ 83) Preschool (n = 280)
Elementary (n ≥ 1,195)
Secondary (n ≥ 278)
Admin. Office
(n ≥ 49) Combination
(n ≥ 163)
Augmentative and alternative communication (AAC)
39.9 60.7 39.3 37.2 45.5 49.0 43.3
Statistical significance: χ2(5) = 24.7, p = .000, Cramer’s V = .110 Conclusion: There is adequate evidence from the data to say that the responses vary by facility type.
Fluency disorders 35.1 12.0 27.1 40.5 40.5 26.0 23.2
Statistical significance: χ2(5) = 57.0, p = .000, Cramer’s V = .167 Conclusion: There is adequate evidence from the data to say that the responses vary by facility type.
Reading and writing (literacy)
33.3 28.6 12.1 35.5 43.4 52.0 34.4
Statistical significance: χ2(5) = 80.4, p = .000, Cramer’s V = .198 Conclusion: There is adequate evidence from the data to say that the responses vary by facility type.
Early identification and intervention
31.7 32.5 60.7 28.4 8.6 36.7 31.7
Statistical significance: χ2(5) = 185.9, p = .000, Cramer’s V = .301 Conclusion: There is adequate evidence from the data to say that the responses vary by facility type.
(Question 27 continues on next page.)

ASHA 2018 SLP Schools Survey: Survey Summary Report
46
27. (cont’d) Which topics would you be most interested in seeing addressed more often or in more depth in the ASHA journals? Select all that apply. (Percentages) Responses were in alphabetical order on survey instrument.
Analyses limited to respondents who met the following criterion: CCC-SLP
Topic
Facility Type
All Facility Types
(n = 2,170)
Special Day/ Residential
(n ≥ 83) Preschool (n = 280)
Elementary (n ≥ 1,195)
Secondary (n ≥ 278)
Admin. Office
(n ≥ 49) Combination
(n ≥ 163)
Cultural and linguistic diversity
24.0 18.1 27.9 23.3 21.9 44.0 25.6
Statistical significance: χ2(5) = 15.9, p = .007, Cramer’s V = .088 Conclusion: There is adequate evidence from the data to say that the responses vary by facility type.
Telepractice and computer-based approaches
16.7 12.0 13.6 15.8 17.2 18.0 23.3
Statistical significance: χ2(5) = 9.0, p = .108 Conclusion: There is not enough evidence from the data to say that the responses vary by facility type.
Voice or resonance disorders
10.3 1.2 8.6 11.7 10.8 10.2 9.1
Statistical significance: χ2(5) = 11.1, p = .050 Conclusion: There is not enough evidence from the data to say that the responses vary by facility type.
Traumatic brain injury 9.8 10.7 5.0 8.7 12.2 18.4 14.0
Statistical significance: χ2(5) = 18.5, p = .002, Cramer’s V = .095 Conclusion: There is adequate evidence from the data to say that the responses vary by facility type.
Dysphagia (swallowing/feeding)
8.9 15.7 10.4 7.2 6.1 18.4 12.2
Statistical significance: χ2(5) = 20.5, p = .001, Cramer’s V = .100 Conclusion: There is adequate evidence from the data to say that the responses vary by facility type.
(Question 27 continues on next page.)
ASHA 2018 SLP Schools Survey: Survey Summary Report
47
27. (cont’d) Which topics would you be most interested in seeing addressed more often or in more depth in the ASHA journals? Select all that apply. (Percentages) Responses were in alphabetical order on survey instrument.
Analyses limited to respondents who met the following criterion: CCC-SLP
Topic
Facility Type
All Facility Types
(n = 2,170)
Special Day/ Residential
(n ≥ 83) Preschool (n = 280)
Elementary (n ≥ 1,195)
Secondary (n ≥ 278)
Admin. Office
(n ≥ 49)
Combina-tion
(n ≥ 163)
Hearing disorders 7.0 7.2 9.3 5.7 7.9 6.1 9.1
Statistical significance: χ2(5) = 7.0, p = .217 Conclusion: There is not enough evidence from the data to say that the responses vary by facility type.
Dysarthria 4.8 3.6 5.0 3.8 5.7 10.2 4.9
Statistical significance: χ2(5) = 6.7, p = .246 Conclusion: There is not enough evidence from the data to say that the responses vary by facility type.
Genetic and congenital disorders
0.7 2.4 0.0 0.7 0.4 0.0 0.0
Too many cells (42%) have an expected count of less than 5. Conclusion: Too little data are available in some facility categories to test whether responses vary by facility type.

ASHA 2018 SLP Schools Survey: Survey Summary Report
48
IDEA
28. Rate the importance of each of the issues below in relation to the Individuals with Disabilities Education Act (IDEA). Scale: 1 = Not at all important → 5 = Very important
Analyses limited to respondents who met the following criterion: CCC-SLP
Response
Facility Type
All Facility Types
Special Day/ Residential Preschool Elementary Secondary
Admin. Office
Combina-tion
American Sign Language (ASL)
n = 1,874 n = 73 n = 237 n = 1,027 n = 241 n = 45 n = 146
1 – Not at all important 8.0 8.2 5.1 8.7 9.5 8.9 7.5
2 17.7 15.1 15.6 17.5 21.6 15.6 16.4
3 31.3 26.0 32.5 33.7 24.1 31.1 26.7
4 18.7 23.3 19.4 17.4 18.7 20.0 22.6
5 – Very important 24.3 27.4 27.4 22.7 26.1 24.4 26.7
Statistical significance: χ2(20) = 20.6, p = .420 Conclusion: There is not enough evidence from the data to say that the responses vary by facility type.
(Question 28 continues on next page.)

ASHA 2018 SLP Schools Survey: Survey Summary Report
49
28. (cont’d) Rate the importance of each of the issues below in relation to the Individuals with Disabilities Education Act (IDEA). Scale: 1 = Not at all important → 5 = Very important
Analyses limited to respondents who met the following criterion: CCC-SLP
Response Facility Type
All Facility Types
Special Day/ Residential Preschool Elementary Secondary
Admin. Office
Combina-tion
Connection With the Early Hearing Detection and Intervention Program (EHDI)
n = 1,500 n = 56 n = 181 n = 831 n = 194 n = 36 n = 116
1 – Not at all important 4.9 5.4 1.7 5.2 7.7 5.6 6.9
2 10.1 10.7 7.7 10.3 9.8 5.6 13.8
3 23.1 25.0 22.7 25.3 16.5 33.3 19.0
4 20.3 21.4 17.1 20.0 22.7 25.0 18.1
5 – Very important 41.6 37.5 50.8 39.2 43.3 30.6 42.2
Statistical significance: χ2(20) = 27.0, p = .136 Conclusion: There is not enough evidence from the data to say that the responses vary by facility type.
(Question 28 continues on next page.)

ASHA 2018 SLP Schools Survey: Survey Summary Report
50
28. (cont’d) Rate the importance of each of the issues below in relation to the Individuals with Disabilities Education Act (IDEA). Scale: 1 = Not at all important → 5 = Very important
Analyses limited to respondents who met the following criterion: CCC-SLP
Response Facility Type
All Facility Types
Special Day/ Residential Preschool Elementary Secondary
Admin. Office
Combina-tion
Early Childhood
n = 1,870 n = 67 n = 245 n = 1,032 n = 231 n = 47 n = 142
1 – Not at all important 1.9 1.5 0.4 1.8 4.3 0.0 2.1
2 2.4 3.0 1.2 2.3 3.5 6.4 3.5
3 12.4 14.9 4.9 13.9 13.0 10.6 15.5
4 23.6 26.9 16.3 25.9 18.2 27.7 22.5
5 – Very important 59.7 53.7 77.1 56.1 61.0 55.3 56.3
Too many cells (27%) have an expected count of less than 5. Conclusion: Too little data are available in some facility categories to test whether responses vary by facility type.
(Question 28 continues on next page.)

ASHA 2018 SLP Schools Survey: Survey Summary Report
51
28. (cont’d) Rate the importance of each of the issues below in relation to the Individuals with Disabilities Education Act (IDEA). Scale: 1 = Not at all important → 5 = Very important
Analyses limited to respondents who met the following criterion: CCC-SLP
Response Facility Type
All Facility Types
Special Day/ Residential Preschool Elementary Secondary
Admin. Office
Combina-tion
Early Intervention
n = 1,917 n = 69 n = 249 n = 1,064 n = 237 n = 47 n = 143
1 – Not at all important 1.7 1.4 0.4 1.5 3.4 0.0 3.5
2 1.8 1.4 1.6 1.6 3.8 4.3 1.4
3 8.0 7.2 2.8 9.1 8.0 8.5 11.2
4 19.0 18.8 15.7 19.5 15.6 31.9 16.8
5 – Very important 69.4 71.0 79.5 68.2 69.2 55.3 67.1
Too many cells (37%) have an expected count of less than 5. Conclusion: Too little data are available in some facility categories to test whether responses vary by facility type.
(Question 28 continues on next page.)
ASHA 2018 SLP Schools Survey: Survey Summary Report
52
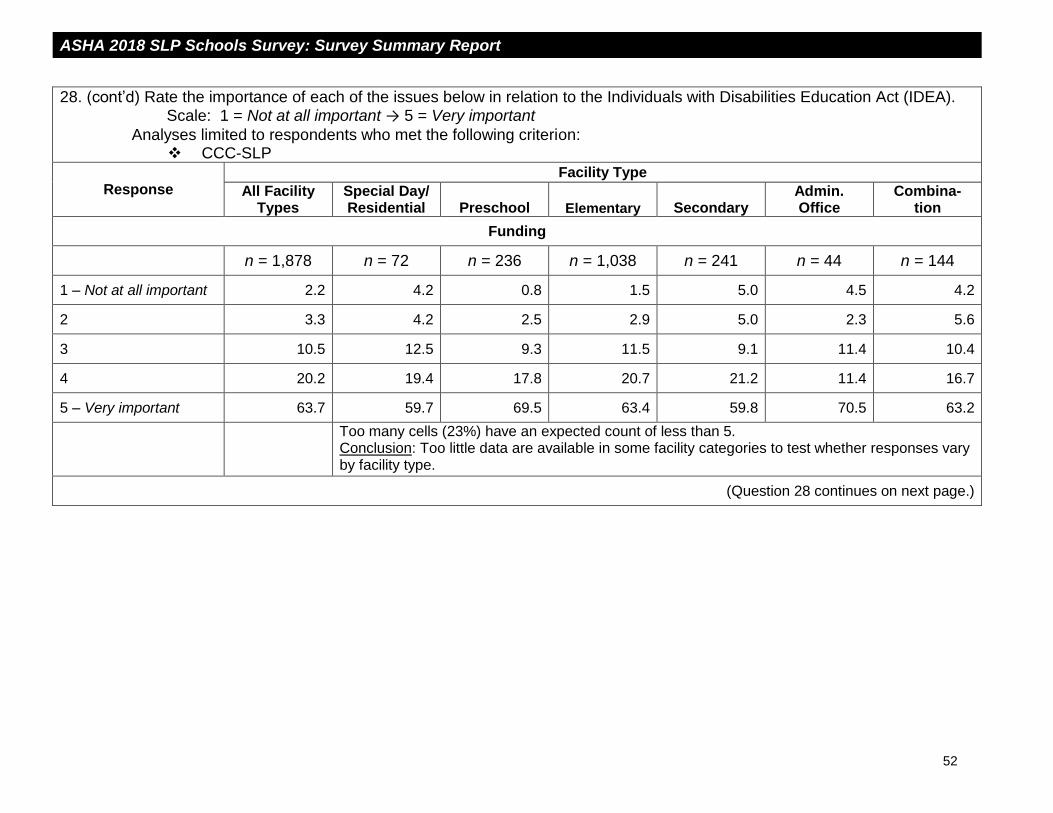
28. (cont’d) Rate the importance of each of the issues below in relation to the Individuals with Disabilities Education Act (IDEA). Scale: 1 = Not at all important → 5 = Very important
Analyses limited to respondents who met the following criterion: CCC-SLP
Response Facility Type
All Facility Types
Special Day/ Residential Preschool Elementary Secondary
Admin. Office
Combina-tion
Funding
n = 1,878 n = 72 n = 236 n = 1,038 n = 241 n = 44 n = 144
1 – Not at all important 2.2 4.2 0.8 1.5 5.0 4.5 4.2
2 3.3 4.2 2.5 2.9 5.0 2.3 5.6
3 10.5 12.5 9.3 11.5 9.1 11.4 10.4
4 20.2 19.4 17.8 20.7 21.2 11.4 16.7
5 – Very important 63.7 59.7 69.5 63.4 59.8 70.5 63.2
Too many cells (23%) have an expected count of less than 5. Conclusion: Too little data are available in some facility categories to test whether responses vary by facility type.
(Question 28 continues on next page.)

ASHA 2018 SLP Schools Survey: Survey Summary Report
53
28. (cont’d) Rate the importance of each of the issues below in relation to the Individuals with Disabilities Education Act (IDEA). Scale: 1 = Not at all important → 5 = Very important
Analyses limited to respondents who met the following criterion: CCC-SLP
Response Facility Type
All Facility Types
Special Day/ Residential Preschool Elementary Secondary
Admin. Office
Combina-tion
IEP Team Independence/Strengthening
n = 1,895 n = 69 n = 236 n = 1,045 n = 247 n = 45 n = 146
1 – Not at all important 2.7 8.7 1.3 2.6 2.8 0.0 2.7
2 8.1 4.3 7.6 8.7 3.6 4.4 13.0
3 26.3 34.8 28.0 28.2 22.7 20.0 16.4
4 29.7 30.4 27.5 28.6 34.8 33.3 30.8
5 – Very important 33.1 21.7 35.6 31.9 36.0 42.2 37.0
Statistical significance: χ2(20) = 45.7, p = .001, Cramer’s V = .080 Conclusion: There is adequate evidence from the data to say that the responses vary by facility type.
(Question 28 continues on next page.)
Note. IEP = Individualized Education Program.
ASHA 2018 SLP Schools Survey: Survey Summary Report
54
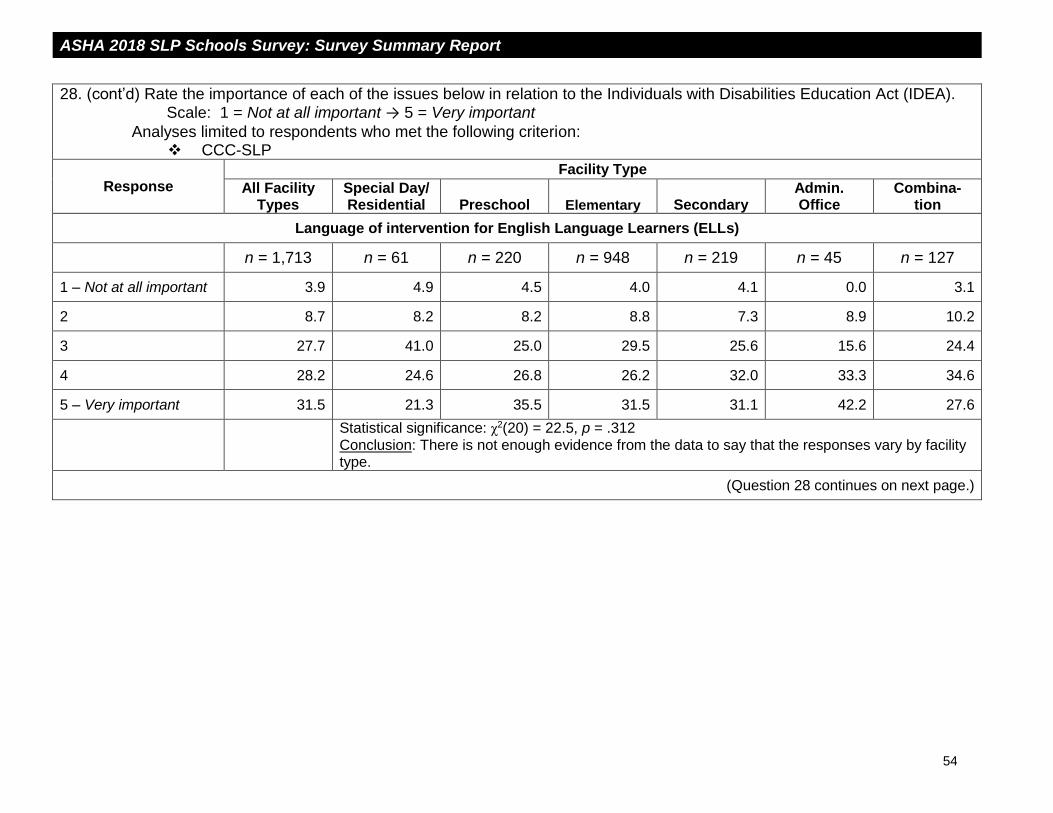
28. (cont’d) Rate the importance of each of the issues below in relation to the Individuals with Disabilities Education Act (IDEA). Scale: 1 = Not at all important → 5 = Very important
Analyses limited to respondents who met the following criterion: CCC-SLP
Response Facility Type
All Facility Types
Special Day/ Residential Preschool Elementary Secondary
Admin. Office
Combina-tion
Language of intervention for English Language Learners (ELLs)
n = 1,713 n = 61 n = 220 n = 948 n = 219 n = 45 n = 127
1 – Not at all important 3.9 4.9 4.5 4.0 4.1 0.0 3.1
2 8.7 8.2 8.2 8.8 7.3 8.9 10.2
3 27.7 41.0 25.0 29.5 25.6 15.6 24.4
4 28.2 24.6 26.8 26.2 32.0 33.3 34.6
5 – Very important 31.5 21.3 35.5 31.5 31.1 42.2 27.6
Statistical significance: χ2(20) = 22.5, p = .312 Conclusion: There is not enough evidence from the data to say that the responses vary by facility type.
(Question 28 continues on next page.)

ASHA 2018 SLP Schools Survey: Survey Summary Report
55
28. (cont’d) Rate the importance of each of the issues below in relation to the Individuals with Disabilities Education Act (IDEA). Scale: 1 = Not at all important → 5 = Very important
Analyses limited to respondents who met the following criterion: CCC-SLP
Response Facility Type
All Facility Types
Special Day/ Residential Preschool Elementary Secondary
Admin. Office
Combina-tion
Paperwork Reduction
n = 1,933 n = 70 n = 244 n = 1,069 n = 248 n = 47 n = 147
1 – Not at all important 4.5 1.4 3.7 5.1 4.4 2.1 4.8
2 4.9 7.1 4.1 4.9 6.5 4.3 4.1
3 17.0 21.4 18.4 15.0 26.2 19.1 12.2
4 19.2 25.7 17.2 18.6 21.0 17.0 20.4
5 – Very important 54.4 44.3 56.6 56.4 41.9 57.4 58.5
Statistical significance: χ2(20) = 36.6, p = .013, Cramer’s V = .071 Conclusion: There is adequate evidence from the data to say that the responses vary by facility type.
(Question 28 continues on next page.)

ASHA 2018 SLP Schools Survey: Survey Summary Report
56
28. (cont’d) Rate the importance of each of the issues below in relation to the Individuals with Disabilities Education Act (IDEA). Scale: 1 = Not at all important → 5 = Very important
Analyses limited to respondents who met the following criterion: CCC-SLP
Response Facility Type
All Facility Types
Special Day/ Residential Preschool Elementary Secondary
Admin. Office
Combina-tion
Treatment of ASD
n = 1,913 n = 70 n = 241 n = 1,055 n = 247 n = 49 n = 145
1 – Not at all important 0.8 0.0 0.0 1.1 0.4 4.1 0.7
2 2.6 1.4 2.9 2.7 1.6 2.0 2.8
3 13.2 5.7 13.3 14.3 10.9 12.2 13.1
4 28.0 25.7 24.9 28.0 27.9 30.6 27.6
5 – Very important 55.4 67.1 58.9 53.9 59.1 51.0 55.9
Too many cells (27%) have an expected count of less than 5. Conclusion: Too little data are available in some facility categories to test whether responses vary by facility type.
Note. ASD = autism spectrum disorder.
ASHA 2018 SLP Schools Survey: Survey Summary Report
57
Student Loans
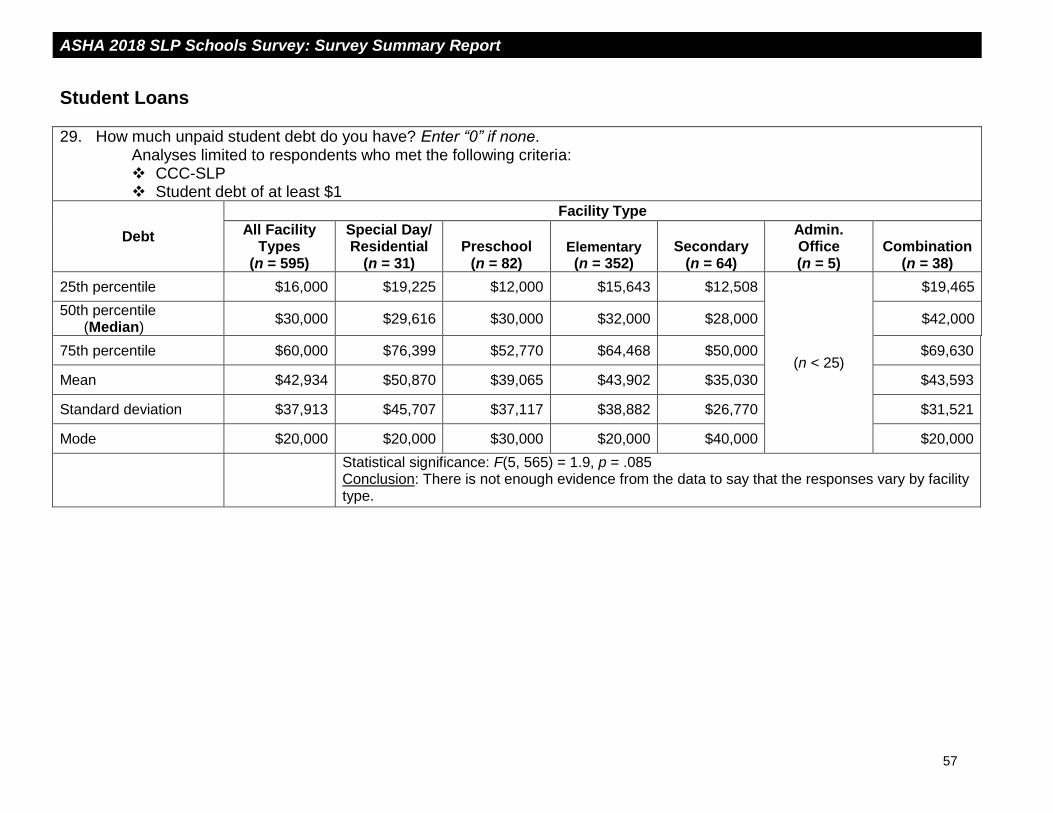
29. How much unpaid student debt do you have? Enter “0” if none. Analyses limited to respondents who met the following criteria:
CCC-SLP Student debt of at least $1
Debt
Facility Type
All Facility Types
(n = 595)
Special Day/ Residential
(n = 31) Preschool
(n = 82) Elementary
(n = 352) Secondary
(n = 64)
Admin. Office (n = 5)
Combination (n = 38)
25th percentile $16,000 $19,225 $12,000 $15,643 $12,508
(n < 25)
$19,465
50th percentile (Median)
$30,000 $29,616 $30,000 $32,000 $28,000 $42,000
75th percentile $60,000 $76,399 $52,770 $64,468 $50,000 $69,630
Mean $42,934 $50,870 $39,065 $43,902 $35,030 $43,593
Standard deviation $37,913 $45,707 $37,117 $38,882 $26,770 $31,521
Mode $20,000 $20,000 $30,000 $20,000 $40,000 $20,000
Statistical significance: F(5, 565) = 1.9, p = .085 Conclusion: There is not enough evidence from the data to say that the responses vary by facility type.

ASHA 2018 SLP Schools Survey: Survey Summary Report
58
30. Are you aware of the federal program that offers $17,500 in loan forgiveness for math, science, and special education teachers? (Percentages)
Analyses limited to respondents who met the following criterion: CCC-SLP
Aware Facility Type
All Facility Types
Special Day/ Residential Preschool Elementary Secondary
Admin. Office
Combina-tion
Includes Those With $0 Student Debt
n = 1,196 n = 47 n = 170 n = 677 n = 146 n = 17 n = 80
Yes 46.2 42.6 40.6 49.3 44.5 (n < 25)
41.3
No (SKIP to Q. 33.) 53.8 57.4 59.4 50.7 55.5 58.8
Statistical significance: χ2(5) = 7.0, p = .221 Conclusion: There is not enough evidence from the data to say that the responses vary by facility type.
Excludes Those With $0 Student Debt
n = 589 n = 31 n = 81 n = 348 n = 63 n = 5 n = 36
Yes 60.6 45.2 53.1 64.7 65.1 (n < 25)
52.8
No (SKIP to Q. 33.) 39.4 54.8 46.9 35.3 34.9 47.2
Statistical significance: χ2(5) = 8.8, p = .116 Conclusion: There is not enough evidence from the data to say that the responses vary by facility type.
ASHA 2018 SLP Schools Survey: Survey Summary Report
59
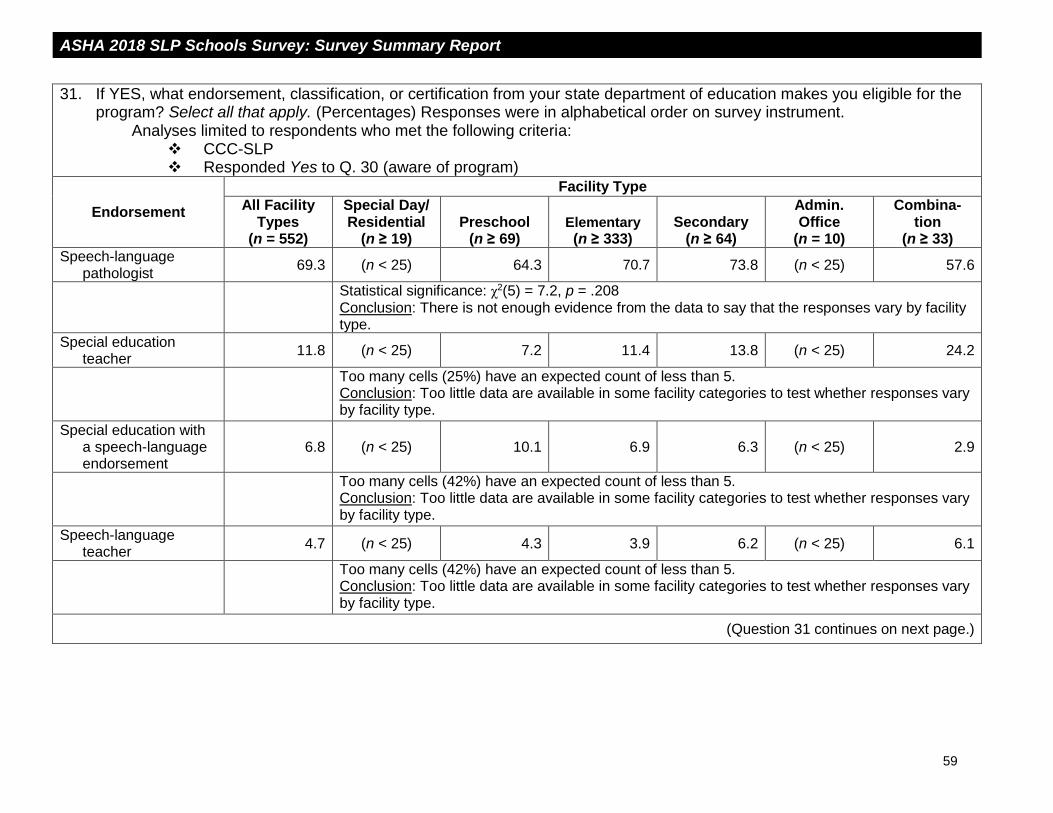
31. If YES, what endorsement, classification, or certification from your state department of education makes you eligible for the program? Select all that apply. (Percentages) Responses were in alphabetical order on survey instrument.
Analyses limited to respondents who met the following criteria: CCC-SLP Responded Yes to Q. 30 (aware of program)
Endorsement
Facility Type
All Facility Types
(n = 552)
Special Day/ Residential
(n ≥ 19) Preschool
(n ≥ 69) Elementary
(n ≥ 333) Secondary
(n ≥ 64)
Admin. Office
(n = 10)
Combina-tion
(n ≥ 33)
Speech-language pathologist
69.3 (n < 25) 64.3 70.7 73.8 (n < 25) 57.6
Statistical significance: χ2(5) = 7.2, p = .208 Conclusion: There is not enough evidence from the data to say that the responses vary by facility type.
Special education teacher
11.8 (n < 25) 7.2 11.4 13.8 (n < 25) 24.2
Too many cells (25%) have an expected count of less than 5. Conclusion: Too little data are available in some facility categories to test whether responses vary by facility type.
Special education with a speech-language endorsement
6.8 (n < 25) 10.1 6.9 6.3 (n < 25) 2.9
Too many cells (42%) have an expected count of less than 5. Conclusion: Too little data are available in some facility categories to test whether responses vary by facility type.
Speech-language teacher
4.7 (n < 25) 4.3 3.9 6.2 (n < 25) 6.1
Too many cells (42%) have an expected count of less than 5. Conclusion: Too little data are available in some facility categories to test whether responses vary by facility type.
(Question 31 continues on next page.)

ASHA 2018 SLP Schools Survey: Survey Summary Report
60
31. (cont’d) If YES, what endorsement, classification, or certification from your state department of education makes you eligible for the program? Select all that apply. (Percentages) Responses were in alphabetical order on survey instrument.
Analyses limited to respondents who met the following criteria: CCC-SLP Responded Yes to Q. 30 (aware of program)
Endorsement
Facility Type
All Facility Types
(n = 552)
Special Day/ Residential
(n ≥ 19) Preschool
(n ≥ 69) Elementary
(n ≥ 333) Secondary
(n ≥ 64)
Admin. Office
(n = 10)
Combina-tion
(n ≥ 33)
Audiologist 0.2 (n < 25) 0.0 0.3 0.0 (n < 25) 0.0
Too many cells (50%) have an expected count of less than 5. Conclusion: Too little data are available in some facility categories to test whether responses vary by facility type.
Other, specify: 4.1 (n < 25) 8.6 2.4 3.1 (n < 25) 11.8
Too many cells (42%) have an expected count of less than 5. Conclusion: Too little data are available in some facility categories to test whether responses vary by facility type.
32. Have you benefited from the federal program described in Q. 30? (Percentages) Analyses limited to respondents who met the following criteria:
CCC-SLP Regardless of current amount of student debt
Benefit
Facility Type
All Facility Types
(n = 1,461)
Special Day/ Residential
(n = 54) Preschool (n = 178)
Elementary
(n = 827) Secondary (n = 184)
Admin. Office
(n = 33)
Combina-tion
(n = 108)
Yes 11.7 0.0 9.6 14.3 8.2 6.1 7.4
No 88.3 100.0 90.4 85.7 91.8 93.9 92.6
Statistical significance: χ2(5) = 18.6, p = .002, Cramer’s V = .116 Conclusion: There is adequate evidence from the data to say that the responses vary by facility type.

ASHA 2018 SLP Schools Survey: Survey Summary Report
61
Demographics
33. Which one of the following best describes where you work? (Percentages) Analyses limited to respondents who met the following criteria:
CCC-SLP Employed full time or part time
Area
Facility Type
All Facility Types
(n = 2,072)
Special Day/ Residential
(n = 84) Preschool (n = 274)
Elementary
(n = 1,183) Secondary (n = 273)
Admin. Office
(n = 48)
Combina-tion
(n = 157)
City/urban area 32.0 33.3 28.5 31.4 31.1 39.6 39.5
Suburban area 46.2 58.3 51.8 45.0 52.4 45.8 32.5
Rural area 21.9 8.3 19.7 23.6 16.5 14.6 28.0
Not employed (SKIP to Q. 35.)
Removed from analyses
Statistical significance: χ2(10) = 35.2, p = .000, Cramer’s V = .093 Conclusion: There is adequate evidence from the data to say that the responses vary by facility type.

ASHA 2018 SLP Schools Survey: Survey Summary Report
62
34. In what state is your primary employment FACILITY located? Use standard post office two-letter code (e.g., ID for Idaho).
Analyses limited to respondents who met the following criteria: CCC-SLP Employed full time or part time
State n State n State n
Alabama (AL) 19 Kentucky (KY) 28 North Dakota (ND) 9
Alaska (AK) 4 Louisiana (LA) 30 Ohio (OH) 83
Arizona (AZ) 33 Maine (ME) 13 Oklahoma (OK) 27
Arkansas (AR) 39 Maryland (MD) 54 Oregon (OR) 28
California (CA) 182 Massachusetts (MA) 77 Pennsylvania (PA) 74
Colorado (CO) 34 Michigan (MI) 71 Rhode Island (RI) 8
Connecticut (CT) 33 Minnesota (MN) 49 South Carolina (SC) 28
Delaware (DE) 9 Mississippi (MS) 17 South Dakota (SD) 8
District of Columbia (DC)
3 Missouri (MO) 46 Tennessee (TN) 26
Florida (FL) 105 Montana (MT) 5 Texas (TX) 117
Georgia (GA) 50 Nebraska (NE) 18 Utah (UT) 17
Hawaii (HI) 6 Nevada (NV) 8 Vermont (VT) 8
Idaho (ID) 7 New Hampshire (NH) 11 Virginia (VA) 39
Illinois (IL) 117 New Jersey (NJ) 90 Washington (WA) 34
Indiana (IN) 33 New Mexico (NM) 19 West Virginia (WV) 15
Iowa (IA) 11 New York (NY) 234 Wisconsin (WI) 45
Kansas (KS) 22 North Carolina (NC) 56 Wyoming (WY) 7
Total 2,108
(Question 34 continues on next page.)
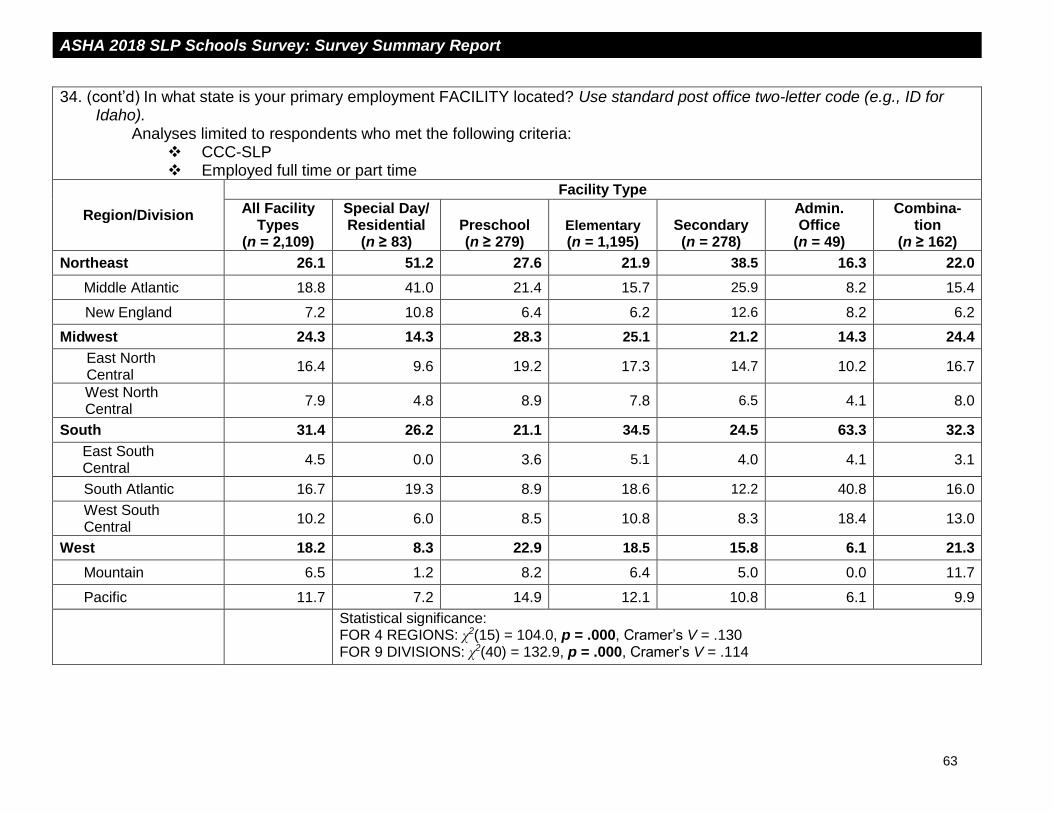
ASHA 2018 SLP Schools Survey: Survey Summary Report
63
34. (cont’d) In what state is your primary employment FACILITY located? Use standard post office two-letter code (e.g., ID for
Idaho). Analyses limited to respondents who met the following criteria:
CCC-SLP Employed full time or part time
Region/Division
Facility Type
All Facility Types
(n = 2,109)
Special Day/ Residential
(n ≥ 83) Preschool (n ≥ 279)
Elementary
(n = 1,195) Secondary (n = 278)
Admin. Office
(n = 49)
Combina-tion
(n ≥ 162)
Northeast 26.1 51.2 27.6 21.9 38.5 16.3 22.0
Middle Atlantic 18.8 41.0 21.4 15.7 25.9 8.2 15.4
New England 7.2 10.8 6.4 6.2 12.6 8.2 6.2
Midwest 24.3 14.3 28.3 25.1 21.2 14.3 24.4
East North Central
16.4 9.6 19.2 17.3 14.7 10.2 16.7
West North Central
7.9 4.8 8.9 7.8 6.5 4.1 8.0
South 31.4 26.2 21.1 34.5 24.5 63.3 32.3
East South Central
4.5 0.0 3.6 5.1 4.0 4.1 3.1
South Atlantic 16.7 19.3 8.9 18.6 12.2 40.8 16.0
West South Central
10.2 6.0 8.5 10.8 8.3 18.4 13.0
West 18.2 8.3 22.9 18.5 15.8 6.1 21.3
Mountain 6.5 1.2 8.2 6.4 5.0 0.0 11.7
Pacific 11.7 7.2 14.9 12.1 10.8 6.1 9.9
Statistical significance: FOR 4 REGIONS: χ2(15) = 104.0, p = .000, Cramer’s V = .130 FOR 9 DIVISIONS: χ2(40) = 132.9, p = .000, Cramer’s V = .114

ASHA 2018 SLP Schools Survey: Survey Summary Report
64
35. Identify the degrees you have earned. Count only actual degrees—not equivalencies or certificates—and do not include
degrees expected but not yet conferred. Select all that apply. (Percentages) Analyses limited to respondents who met the following criterion:
CCC-SLP
Degree
Facility Type
All Facility Types
(n ≥ 2,167)
Special Day/ Residential
(n = 84) Preschool (n ≥ 279)
Elementary
(n ≥ 1,195) Secondary (n = 279)
Admin. Office
(n = 49)
Combina-tion
(n ≥ 163)
Master’s 99.2 100.0 99.6 99.2 98.6 95.9 99.4
AuD 0.1 0.0 0.0 0.2 0.0 0.0 0.0
SLPD or CScD 0.4 0.0 0.7 0.3 0.0 0.0 0.6
PhD 0.9 0.0 0.7 0.8 1.4 2.0 1.2
Other doctorate 0.7 0.0 0.0 0.6 2.2 2.0 0.0
Too many cells (42%—50%) have an expected count of less than 5. Conclusion: Too little data are available in some facility categories to test whether responses vary by facility type.
Highest Degree
Master’s 97.9 100.0 98.6 98.2 96.8 95.9 98.1
Doctorate 2.1 0.0 1.4 1.8 3.2 4.1 1.9
Too many cells (25%) have an expected count of less than 5. Conclusion: Too little data are available in some facility categories to test whether responses vary by facility type.
Note. AuD = doctor of audiology. SLPD = doctor of speech-language pathology. CScD = doctor of communication science. PhD = doctor of philosophy.

ASHA 2018 SLP Schools Survey: Survey Summary Report
65
36. How many years (a) have you been employed in the audiology or speech-language pathology profession, and (b) how many of those years were in schools? Round to the nearest full year. Enter “0” if you have never been employed in the professions.
Analyses limited to respondents who met the following criteria: CCC-SLP Response greater than 0
Years Facility Type
All Facility Types
Special Day/ Residential Preschool Elementary Secondary
Admin. Office
Combina-tion
(a) Total Years in the Professions
n = 2,100 n = 82 n = 271 n = 1,159 n = 275 n = 46 n = 157
25th percentile 8.0 7.1 9.0 8.0 8.0 15.0 10.0
50th percentile (Median)
16.0 15.0 16.0 15.0 17.0 22.0 17.5
75th percentile 25.0 30.0 26.6 23.0 26.0 28.0 27.5
Mean 17.5 18.7 17.7 16.6 18.1 21.8 19.3
Standard deviation 10.8 12.6 10.6 10.2 11.4 9.4 11.9
Mode 5.0 4.0 15.0 5.0 6.0 20.0 17.0
Statistical significance: F(5, 1984) = 4.6, p = .000 Conclusion: There is adequate evidence from the data to say that the responses vary by facility type.
(Question 36 continues on next page.)

ASHA 2018 SLP Schools Survey: Survey Summary Report
66
36. (cont’d) How many years (a) have you been employed in the audiology or speech-language pathology profession, and (b) how many of those years were in schools? Round to the nearest full year. Enter “0” if you have never been employed in the professions.
Analyses limited to respondents who met the following criteria: CCC-SLP Response greater than 0
Years
Facility Type
All Facility Types
Special Day/ Residential Preschool Elementary Secondary
Admin. Office
Combina-tion
(b) Total Years in the Schools
n = 2,098 n = 82 n = 267 n = 1,156 n = 276 n = 48 n = 158
25th percentile 6.0 5.8 7.0 6.0 6.0 12.2 7.0
50th percentile (Median)
13.0 13.0 12.0 12.0 11.6 18.2 15.0
75th percentile 20.0 26.0 19.9 19.0 20.0 24.3 23.0
Mean 14.5 15.4 14.1 13.9 14.3 19.6 16.3
Standard deviation 9.8 11.3 9.5 9.2 9.9 8.6 11.0
Mode 5.0 5.0 12.0 5.0 6.0 15.0 4.0
Statistical significance: F(5, 1980) = 5.0, p = .000 Conclusion: There is adequate evidence from the data to say that the responses vary by facility type.
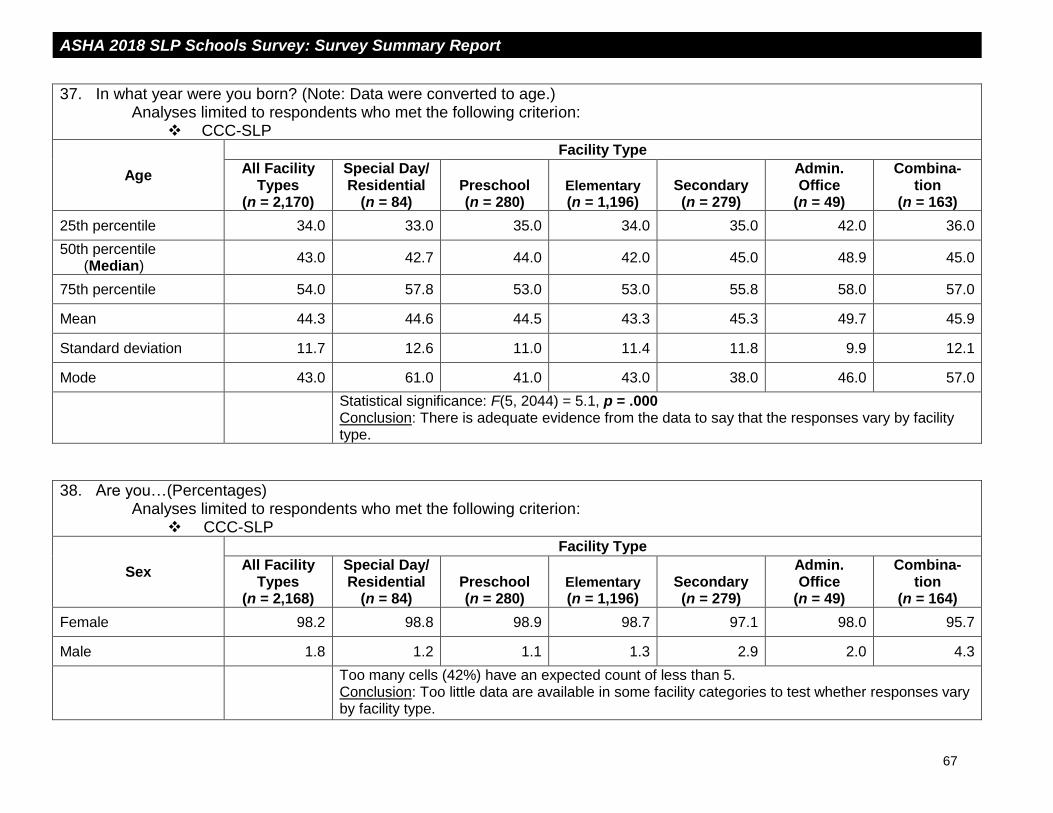
ASHA 2018 SLP Schools Survey: Survey Summary Report
67
37. In what year were you born? (Note: Data were converted to age.) Analyses limited to respondents who met the following criterion:
CCC-SLP
Age
Facility Type
All Facility Types
(n = 2,170)
Special Day/ Residential
(n = 84) Preschool (n = 280)
Elementary
(n = 1,196) Secondary (n = 279)
Admin. Office
(n = 49)
Combina-tion
(n = 163)
25th percentile 34.0 33.0 35.0 34.0 35.0 42.0 36.0
50th percentile (Median)
43.0 42.7 44.0 42.0 45.0 48.9 45.0
75th percentile 54.0 57.8 53.0 53.0 55.8 58.0 57.0
Mean 44.3 44.6 44.5 43.3 45.3 49.7 45.9
Standard deviation 11.7 12.6 11.0 11.4 11.8 9.9 12.1
Mode 43.0 61.0 41.0 43.0 38.0 46.0 57.0
Statistical significance: F(5, 2044) = 5.1, p = .000 Conclusion: There is adequate evidence from the data to say that the responses vary by facility type.
38. Are you…(Percentages) Analyses limited to respondents who met the following criterion:
CCC-SLP
Sex
Facility Type
All Facility Types
(n = 2,168)
Special Day/ Residential
(n = 84) Preschool (n = 280)
Elementary
(n = 1,196) Secondary (n = 279)
Admin. Office
(n = 49)
Combina-tion
(n = 164)
Female 98.2 98.8 98.9 98.7 97.1 98.0 95.7
Male 1.8 1.2 1.1 1.3 2.9 2.0 4.3
Too many cells (42%) have an expected count of less than 5. Conclusion: Too little data are available in some facility categories to test whether responses vary by facility type.

ASHA 2018 SLP Schools Survey: Survey Summary Report
68
Appendix
Summary Report Statistics
ASHA 2018 SLP Schools Survey: Survey Summary Report
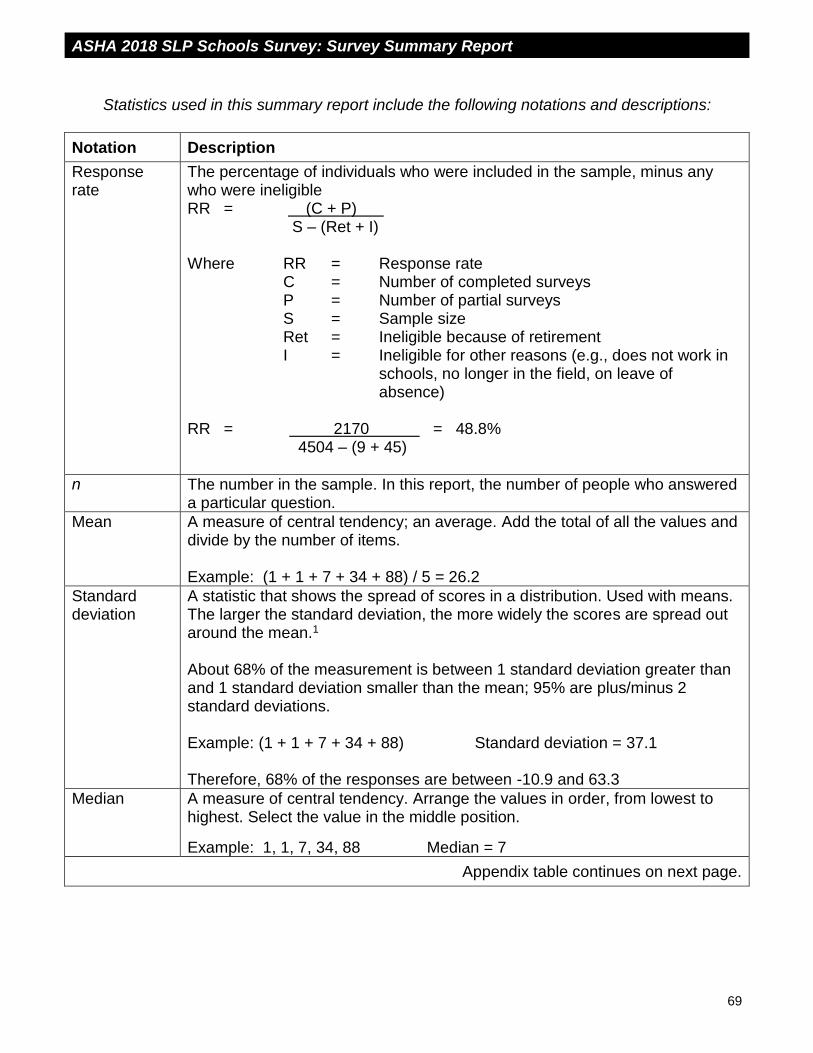
ASHA 2018 SLP Schools Survey: Survey Summary Report
69
Statistics used in this summary report include the following notations and descriptions:
Notation Description
Response rate
The percentage of individuals who were included in the sample, minus any who were ineligible RR = (C + P) S – (Ret + I) Where RR = Response rate C = Number of completed surveys P = Number of partial surveys S = Sample size Ret = Ineligible because of retirement I = Ineligible for other reasons (e.g., does not work in schools, no longer in the field, on leave of absence) RR = 2170 = 48.8% 4504 – (9 + 45)
n The number in the sample. In this report, the number of people who answered a particular question.
Mean A measure of central tendency; an average. Add the total of all the values and divide by the number of items. Example: (1 + 1 + 7 + 34 + 88) / 5 = 26.2
Standard deviation
A statistic that shows the spread of scores in a distribution. Used with means. The larger the standard deviation, the more widely the scores are spread out around the mean.1 About 68% of the measurement is between 1 standard deviation greater than and 1 standard deviation smaller than the mean; 95% are plus/minus 2 standard deviations. Example: (1 + 1 + 7 + 34 + 88) Standard deviation = 37.1 Therefore, 68% of the responses are between -10.9 and 63.3
Median A measure of central tendency. Arrange the values in order, from lowest to highest. Select the value in the middle position.
Example: 1, 1, 7, 34, 88 Median = 7
Appendix table continues on next page.

7/10/18
ASHA 2018 SLP Schools Survey: Survey Summary Report
70
Notation Description
Mode A measure of central tendency; an average. The value that occurs more frequently than any other value.
Example: 1, 1, 7, 34, 88 Mode = 1
Statistical significance
Describes whether a value is larger or smaller than would be expected by chance alone. Note that a large sample size can lead to results that are “statistically significant” even though the results themselves may not have substantive or practical significance. This is particularly true for chi-square (χ2) tests.1
Chi-square (χ2)
A test used to assess the statistical significance of a finding where the variables being assessed are nominal (e.g., annual salary and hourly salary) or ordinal (e.g., excellent, good, fair, and poor). It measures whether there are statistically significant differences between the observed frequencies and the expected frequencies of two variables. The larger the observed frequency is in comparison with the expected frequency, the larger the χ2 statistic and the
more likely the difference is statistically significant. When the sample size is large, large χ2 values (that is, ones that that are statistically significant) can be obtained even for weak associations.1
Cramer’s V A measure of the strength of the association, used with χ2 statistics to identify the meaningfulness of a relationship. The χ2 value may be large with a small probability (p < .05) of having occurred by chance. That is, it is “statistically significant at the .05 level.” Cramer’s V is a measure of how strong (practically important) the relationship is between the variables. The larger the Cramer’s V, the stronger the association.
ANOVA (F) F is the statistic computed when conducting an analysis of variance (ANOVA). Analysis of variance measures the differences between means on two or more variables. It is used when independent variables are categorical and a dependent variable is continuous.1
p Probability. Found in expressions such as p = .003 meaning “The probability that this result could have been produced by chance is 1 in 3/1000ths. The smaller the number, the less likely that the result was due to chance. The p value is the actual probability associated with an obtained statistical result, such as χ2 or F.1
df Degrees of freedom. The number of values that are free to vary when computing a statistic. Used in interpreting both a χ2 and an F ratio. It is calculated in a cross-tabulation as (R – 1) (C – 1) or (the number of rows minus 1) times (the number of columns minus 1). In a 3 × 4 table, df would be 6.
1 Vogt, W. P. (1993). Dictionary of statistics and methodology. Newbury Park, CA: Sage.