survey questionnaires and graphs
TRANSCRIPT

Survey questionnaires and graphs
Ioana Schiopu-Kratina, Kyle Trepanier 1 andChristina Maria Zamfirescu2
1University of Ottawa, Department of Mathematics and Statistics
2Hunter College and Graduate Center-CUNY, Department of Computer science and
Mathematics
QDET2Miami, Florida
November 9-13, 2016

Surveyquestionnaires and
graphs
Introduction
The probabilityspace
Thetransformations
Conclusion andfuture work
References
Overview
1 Introduction
2 The probability space
3 The transformations
4 Conclusion and future work
5 References
2 / 23

Surveyquestionnaires and
graphs
Introduction
The probabilityspace
Thetransformations
Conclusion andfuture work
References
1.1 Motivation for this research
• Data collection is the most expensive part of running a survey.
• The quality of the published data depends on the design andlength of the questionnaire.
• The use of computers has opened the door to the development oflarge and complex questionnaires, which should be well structured.
• Theoretical research on the structure of questionnaires was doneby Picard (1965) and Parkhomenko (2010). More research isrequired.
3 / 23
Surveyquestionnaires and
graphs
Introduction
The probabilityspace
Thetransformations
Conclusion andfuture work
References
1.2 The challenge
• Our examples are based on a version of the module“Most Recent Employment” (EM), of the 2008 “Access andSupport to Education and Training Survey” (ASETS). ASETS has47 modules with 4 - 25 questions/module.
• The content and number of questions of ASETS was determinedby many analysts, who had different interests.
The logical link among questions was not always apparent.
It is difficult to place a variety of questions within a commonquestionnaire.
• We propose practical rules to structure questionnaires usinggraphs.
4 / 23

Surveyquestionnaires and
graphs
Introduction
The probabilityspace
Thetransformations
Conclusion andfuture work
References
1.3 Our requirements
• The coverage (target) of each question should be apparent.
• For each surveyed subpopulation, the questions should besequenced in a logical order.
• The paths followed by important subpopulations should beapparent in the questionnaire.
• While the structure may change, the content of the questionsshould be preserved.
• The burden on respondents should be minimal.
• We apply a set of transformations to attain the above stated goals.
5 / 23
Surveyquestionnaires and
graphs
Introduction
The probabilityspace
Thetransformations
Conclusion andfuture work
References
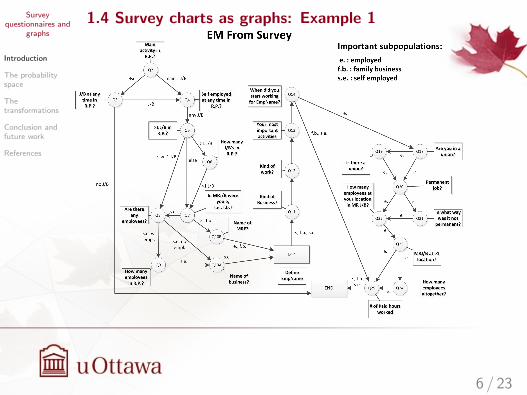
1.4 Survey charts as graphs: Example 1
6 / 23

Surveyquestionnaires and
graphs
Introduction
The probabilityspace
Thetransformations
Conclusion andfuture work
References
1.4 Survey charts as graphs: Example 2
7 / 23
A
• The survey chart A is a directed, acyclic graph, with rootR = Q4 and a node ENDA . The path Q5Q7Q8 is empty.• The directed tree on the right represents A . Here Q7, withtwo parents in A , appears twice in the tree.

Surveyquestionnaires and
graphs
Introduction
The probabilityspace
Thetransformations
Conclusion andfuture work
References
2.1 Basic definitions
Definition 1. A flow fi = RQi1...QinFi in A is a string of questions(nodes) connected by arcs, which starts at the root R and continuesto ENDA . The conditions defining all its arcs are consistent, so asurveyed population could travel through the flow.
The elementary event Fi stands for the category of individuals thattravel through fi . It is part of ENDA .
Definition 2. An analytical outcome ω of a questionnaire qis a minimal group of individuals defined by their specific answers toquestions in a flow.
The set of all analytical outcomes Ωq is the analytical potential of q.
8 / 23
Surveyquestionnaires and
graphs
Introduction
The probabilityspace
Thetransformations
Conclusion andfuture work
References
2.1 Basic definitions: Example 3
9 / 23
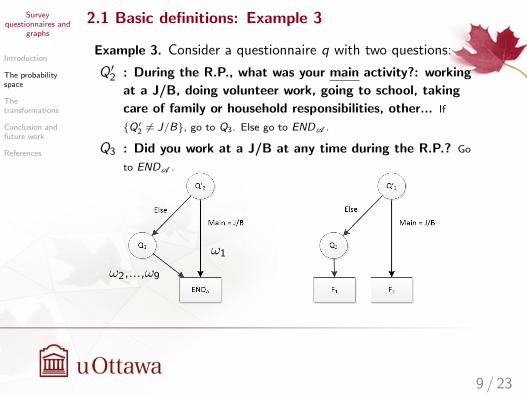
Example 3. Consider a questionnaire q with two questions:
Q ′2 : During the R.P., what was your main activity?: working
at a J/B, doing volunteer work, going to school, taking
care of family or household responsibilities, other... If
Q′2 6= J/B, go to Q3. Else go to ENDA .
Q3 : Did you work at a J/B at any time during the R.P.? Go
to ENDA .
ω1
ω2,...,ω9

Surveyquestionnaires and
graphs
Introduction
The probabilityspace
Thetransformations
Conclusion andfuture work
References
2.2 Probabilities of flows and events
• Consider (Ωq, σA(Fi , i = 1, · · · ,N), PA), where the elementary
event Fi is assigned a probability pi of occurrence,N∑i=1
pi = 1.
• Important particular case: pi = 1N , i = 1, ...,N. This is useful
when there are many elementary events, but can be misleadingotherwise.
Definition 3. The coverage of a question Q is:coverA(Q) :=
⋃1≤i≤N:Q∈fi
fi , and
(1) PA(Q) =∑
1≤i≤N:Q∈fi
pi ,
where pi is the probability of fi .
10 / 23

Surveyquestionnaires and
graphs
Introduction
The probabilityspace
Thetransformations
Conclusion andfuture work
References
2.2 Probabilities of flows and events
• If q has M questions, the expected number of questions is:
(2) EA =M−1∑j=0
PA(Qj)
• We minimize (2). When every path can be travelled,
(3) PA(Q) =∑
i∈IN(Q)
∑j∈OUT (Q)
PA(fij(Q))
where fij(Q) = RQi1 · · ·QikQQj ,k+2 · · ·Fij . Here the flow fij(Q) isput together from an “incoming” flow fi (Q) and an “outgoing” flowfj(Q).
11 / 23

Surveyquestionnaires and
graphs
Introduction
The probabilityspace
Thetransformations
Conclusion andfuture work
References
2.2 Probabilities of flows and events
When pi = 1N , i = 1 · · ·N, (4) becomes:
PA(Q) =card(IN(Q))× card(OUT (Q))
N
• Survey charts visually pack information, but may contain emptypaths.
• One must partition the flows into categories of flows, within whichall paths are travelled.
• In calculating PA(Q), one must account for categories of flows.
• The categories correspond to analytically significantsubpopulations.
12 / 23

Surveyquestionnaires and
graphs
Introduction
The probabilityspace
Thetransformations
Conclusion andfuture work
References
2.3 Categories of flows: Example 4
13 / 23

Surveyquestionnaires and
graphs
Introduction
The probabilityspace
Thetransformations
Conclusion andfuture work
References
2.3 Categories of flows: Example 4
14 / 23

Surveyquestionnaires and
graphs
Introduction
The probabilityspace
Thetransformations
Conclusion andfuture work
References
2.3 Categories of flows: Example 4
15 / 23

Surveyquestionnaires and
graphs
Introduction
The probabilityspace
Thetransformations
Conclusion andfuture work
References
3.1 Overview of transformations
• Transformation 1: Reverses the order of Qa and Qb, when Qb is adescendent of Qa in A , which collects more information than Qa.The transformed survey chart A ′ has EA ′ ≤ EA .
• Transformation 2: When possible, joins two similar questions withdisjoint coverage in A , and moves the new question “closer” to theroot in A ′.
• The transformations preserve the analytical potential.
• These transformations bring a survey chart closer to a tree, somore information is collected earlier in the survey.
16 / 23

Surveyquestionnaires and
graphs
Introduction
The probabilityspace
Thetransformations
Conclusion andfuture work
References
3.2 Consequences of transformations
• The coverage of each question is easily read off A ′.
• The number of categories of flows can be reduced and it is easierto follow important subpopulations through A ′ ( s.e., e., f.b.).
• EA ′ ≤ EA
• The transformed survey chart points to questions that could beremoved.
• We may move questions with high indegree closer to the root(e.g., Q25) of EM From Survey.
17 / 23

Surveyquestionnaires and
graphs
Introduction
The probabilityspace
Thetransformations
Conclusion andfuture work
References
3.2 Consequences of transformations: Example 4
18 / 23

Surveyquestionnaires and
graphs
Introduction
The probabilityspace
Thetransformations
Conclusion andfuture work
References
3.2 Consequences of transformations: Example 5
19 / 23

Surveyquestionnaires and
graphs
Introduction
The probabilityspace
Thetransformations
Conclusion andfuture work
References
3.2 Consequences of transformations: Example 5
20 / 23
Removed:Q2,Q4,Q5,Q8
Combined:Q20 & Q21 → Q ′20Q9 & Q22 → Q ′22

Surveyquestionnaires and
graphs
Introduction
The probabilityspace
Thetransformations
Conclusion andfuture work
References
4.1 Conclusion and future work
• Starting with a flow chart used in practice, we construct a newtype of graph, the survey chart.
• We perform transformations on a survey chart to make thecorresponding questionnaire more amenable to analysis.
• We minimize the expected number of questions in a questionnaire,while preserving its analytical content.
• Future research includes devising an algorithm for findingcategories, and collecting information more efficiently.
21 / 23

Surveyquestionnaires and
graphs
Introduction
The probabilityspace
Thetransformations
Conclusion andfuture work
References
22 / 23
Thank you!
Surveyquestionnaires and
graphs
Introduction
The probabilityspace
Thetransformations
Conclusion andfuture work
References
References
Parkhomenko, P.P. (2010). Questionnaires and OrganizationalHierarchies. Automation and Remote Control 71(6), pp124-134.
Picard, C., Theorie des Questionnaires, Gauthier-Villars Paris,Les Grands Problmes des Sciences XX, 1965.
Schiopu Kratina, Ioana; Zamfirescu, Christina Maria; Trepanier,Kyle; Marques, Lennon. Survey questionnaires and graphs.Electron. J. Statist. 9 (2015), no. 2, 2202–2254.doi:10.1214/15-EJS1067.http://projecteuclid.org/euclid.ejs/1444308086.
23 / 23