survey on financial inclusion and access (sofia) · pdf filefor a copy of the survey...
TRANSCRIPT

Survey on Financial Inclusion and Access (SOFIA)
Implemented by
Focus Note on Selected Districts
Survey on Financial Inclusion and Access (SOFIA) Focus Note on Selected Districts
2
About the SOFIA Focus Notes
The SOFIA Focus Notes are a series of papers that explore particular subjects, using data generated under the SOFIA survey (of 2017). Building on the findings and analysis presented in the main headline report for SOFIA, this SOFIA Focus Note on Selected Districts presents the analyses of the survey results for a pre-determined list of districts in the provinces of East Java, NTB, NTT and South Sulawesi. These districts include:
• Kediri (Kabupaten and Kota) in East Java• Malang (Kabupaten and Kota) in East Java• Lombok Timur in NTB • Bima (Kabupaten and Kota) in NTB • Lombok Utara in NTB• Sikka in NTT • Manggarai in NTT • Sabu Raijua in NTT • Luwu Utara in South Sulawesi, and • Toraja Utara in South Sulawesi.
Consistent with the main headline report, the results presented in this Focus Note cover the adult population (i.e. those aged 17 years and older) in the provinces of East Java, NTB, NTT and South Sulawesi.
The SOFIA Focus Notes series include:• Focus Note on Agriculture• Focus Note on Gender• Focus Note on Selected Districts
Kementerian Perencanaan Pembangunan Nasional /Badan Perencanaan Pembangunan Nasional (BAPPENAS)Jalan Taman Suropati No. 2 Jakarta 10310Telp: 021 3193 6207 | Fax: 021 3145 374 Email: [email protected] | [email protected]
For feedback on the contents of this note or to request further information regarding SOFIA, please contact [email protected] or [email protected]. For a copy of the survey questionnaire, headline report and other materials on SOFIA, please see: http://www.opml.co.uk/projects/survey-financial-inclusion-and-access-sofia.
© November 2017
i
Table of contents
About SOFIA
1 Introduction
2 Useoffinancialservicesintheselecteddistricts
2.1 The financial access strand: overall use of financial
services
2.2 Access to and use of savings products
2.3 Access to and use of loans
3 Opportunitiestoexpandfinancialservicesintheselected
districts
3.1 Kediri and Malang in East Java
3.2 Sikka, Sabu Raijua and Manggarai in NTT
AnnexA Definingthe‘FinancialAccessStrand’
ii
1
2
2
4
5
8
8
10
12

ii
About SOFIA
The Survey on Financial Inclusion and Access (SOFIA) is a survey project implemented in Indonesia, which seeks to measure and profile levels of access to and use of financial services by all adults across income ranges and other demographics. The survey results, findings and analyses are intended for use by key stakeholders in Indonesia such as policymakers, regulators, and financial service providers.
SOFIA builds on the FinScope methodology, a survey instrument used in many other countries as part of broader initiatives to support the financial inclusion agenda.
SOFIA is intended to be a national financial access survey of adults, which would have succeeding rounds over the years. This very first implementation of SOFIA (2017) covers four provinces in eastern Indonesia, namely EastJava,WestNusaTenggara(NTB),EastNusaTenggara(NTT) and SouthSulawesi, with a total sample size of 20,000 individuals.
SOFIA aims to:
• Measure the levels of financial inclusion (i.e. the proportion of the population using financial products and services – both formal and informal);
• Describe the landscape of access (i.e. the type of products and services used by financially included individuals);
• Identify the drivers of, and barriers to usage of financial products and services;• Stimulate evidence-based dialogue that can ultimately lead to effective
public and private sector interventions that can increase and deepen financial inclusion and financial literacy strategies; and
• Provide a basis of comparison of the level of financial inclusion (in Indonesia over time and against other countries), and baseline information through which the impact of interventions to enhance access could be assessed by means of follow-up surveys.

Survey on Financial Inclusion and Access (SOFIA) Focus Note on Selected Districts
iii
This survey project was implemented by Oxford Policy Management Ltd. (OPML) in 2016-17, in partnership with the Ministry of National Development Planning (BAPPENAS), and the Governments of Australia and Switzerland.
NTTPopulation: 5.1 mRespondents: 4,329EAs: 273 villages
NTBPopulation: 4.7 m
Respondents: 3,518EAs: 220 villages
SouthSulawesiPopulation: 8.4 mRespondents: 4,919EAs: 310 villages
EastJavaPopulation: 38.8 mRespondents: 6,873
EAs: 447 villages
93 4 20,0001,250Enumeration Areas
(EAs) (villages)individual
respondentsdistricts provinces
in eastern Indonesia
EAs: Enumeration Areas
iii
Survey on Financial Inclusion and Access (SOFIA) Focus Note on Selected Districts

1
IntroductionThis paper presents findings from the SOFIA survey in relation to ten districts (in the provinces of East Java, NTB, NTT and South Sulawesi), which have been selected in the course of the survey’s design process. The inclusion of these ten districts in the sampling process was based on the consensus reached between various stakeholders – i.e. conducting a financial access survey that would produce results that are statistically significant down to district (kabupatan/kota) level would be ideal, but would be prohibitively expensive (even for a survey covering only eastern Indonesia).
A survey that produces results up to provincial level would be very useful to government stakeholders and development partners. However, for banks, although they could benefit from such a survey, more granular information would be of much greater use. In view of this, the SOFIA survey therefore incorporated the inclusion of a pre-identified list of districts – for which statistically significant results may be produced.
The selection of these ten districts entailed the following process:
• Five (5) stakeholder groups1 were asked to submit their proposed districts – given a total of 94 (for the provinces: East Java, NTB, NTT and South Sulawesi). This resulted in a shortlist of 35 districts.
• Each of these 35 districts were allocated scores that reflect the number of times the district may have been proposed by (and therefore considered to be a district of interest to) the respective stakeholders. Out of these 35 districts, the first 5 districts garnering the highest scores were selected. This included Lombok Timur in NTB, Kediri and Malang in East Java, and Sikka and Manggarai in NTT.
• Following this, the remaining 30 districts were provided an ‘aggregate score’ that combines the “poverty score”, the “bank score”, and the “province score”.2 The districts with the highest aggregate scores represent those that are among the poorest and the least banked among all the proposed districts. This facilitated the selection of the remaining districts, which are: Lombok Utara and Bima in NTB, Toraja Utara and Luwu Utara in South Sulawesi, and Sabu Raijuwa in NTT.
Consistent with this current round of the SOFIA survey, the findings presented in this paper consider the experience and perspective of adults (i.e. those aged 17 years and older) in the four provinces of East Java, NTB, NTT and South Sulawesi. It is important to note that the analysis of SOFIA results examine financial inclusion from the consumer’s perspective, exploring issues of access and usage, and does not map the supply of financial services.
OverviewofthispaperThis paper covers two key sections. The next section (in Section 2) describes the landscape in terms of people’s overall use of financial services and thereafter explores the use of savings and credit among adults in the ten selected districts. The paper then closes in Section 3 by discussing opportunities specific to certain districts, given the results of the survey.
1 These include: (a) the GOI as represented by Bappenas, (b) DFAT/SAFIRA, (c) SECO, (d) Bank Mandiri, and (e) Bank BNI.
2 (a) The poverty score shows the level of poverty of the district (denoted by the proportion of poor households), relative to all 94 districts (in the 4 provinces). A higher poverty score denotes a poorer district. (b) The bank score shows the level of “bankedness” in the district (denoted by the number of bank branches per individual), relative to all other districts. (c) The province score, on the other hand, allocates a score of 1 (a lower score) to districts in East Java and South Sulawesi, and a score of 2 (a higher score) to districts in NTB and NTT.
01
2
Use of financial services in the selected districts
2.1 The financial access strand: overall use of financial services
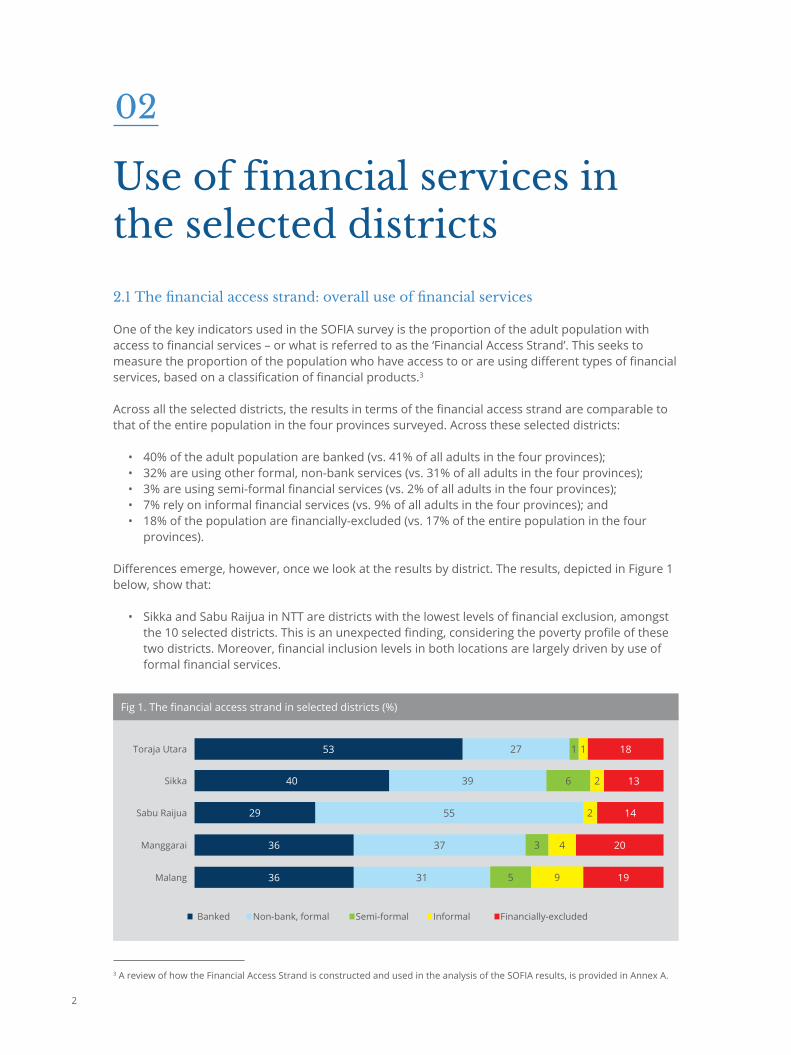
One of the key indicators used in the SOFIA survey is the proportion of the adult population with access to financial services – or what is referred to as the ‘Financial Access Strand’. This seeks to measure the proportion of the population who have access to or are using different types of financial services, based on a classification of financial products.3
Across all the selected districts, the results in terms of the financial access strand are comparable to that of the entire population in the four provinces surveyed. Across these selected districts:
• 40% of the adult population are banked (vs. 41% of all adults in the four provinces);• 32% are using other formal, non-bank services (vs. 31% of all adults in the four provinces);• 3% are using semi-formal financial services (vs. 2% of all adults in the four provinces);• 7% rely on informal financial services (vs. 9% of all adults in the four provinces); and• 18% of the population are financially-excluded (vs. 17% of the entire population in the four
provinces).
Differences emerge, however, once we look at the results by district. The results, depicted in Figure 1 below, show that:
• Sikka and Sabu Raijua in NTT are districts with the lowest levels of financial exclusion, amongst the 10 selected districts. This is an unexpected finding, considering the poverty profile of these two districts. Moreover, financial inclusion levels in both locations are largely driven by use of formal financial services.
Fig 1. The financial access strand in selected districts (%)
Toraja Utara
Sikka
Sabu Raijua
Manggarai
Malang
1
6
3
5
27
39
55
37
31
18
13
14
20
19
1
2
2
4
9
3 A review of how the Financial Access Strand is constructed and used in the analysis of the SOFIA results, is provided in Annex A.
02
53
40
29
36
36
Banked Non-bank, formal Informal Financially-excludedSemi-formal
Survey on Financial Inclusion and Access (SOFIA) Focus Note on Selected Districts
3
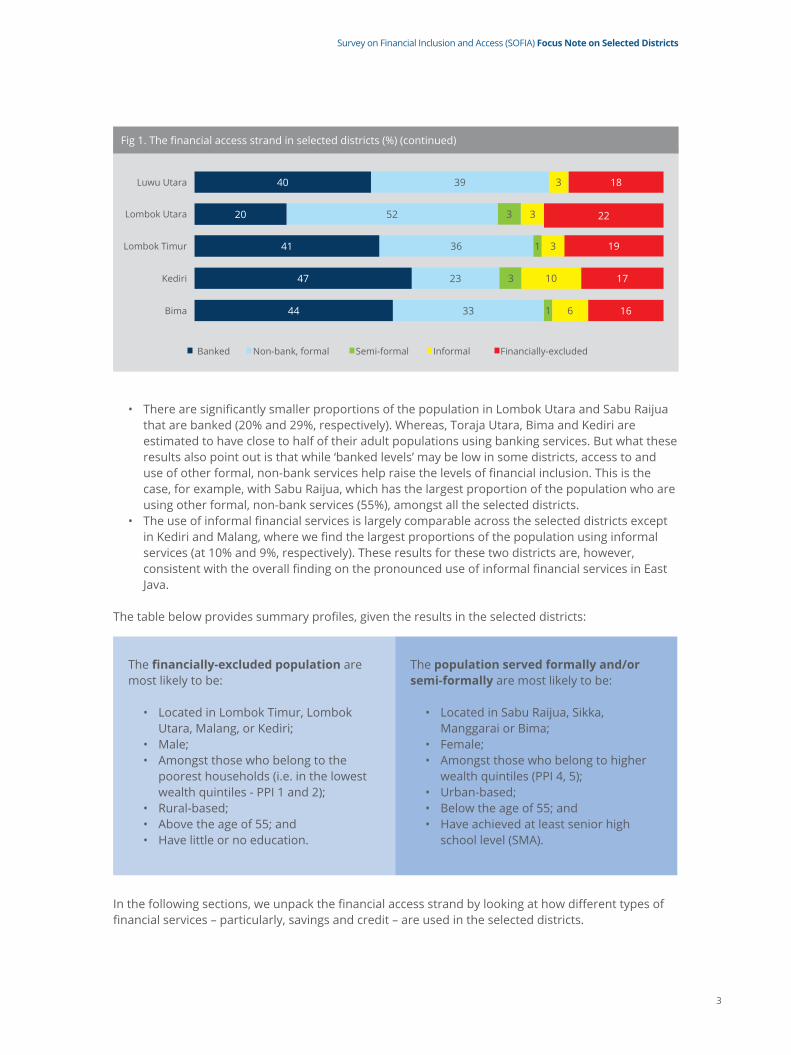
Fig 1. The financial access strand in selected districts (%) (continued)
Luwu Utara
Lombok Utara
Lombok Timur
Kediri
Bima
3
1
1
3
39
36
52
23
33
18
19
22
17
16
3
10
3
3
6
40
41
20
47
44
Banked Non-bank, formal Informal Financially-excludedSemi-formal
• There are significantly smaller proportions of the population in Lombok Utara and Sabu Raijua that are banked (20% and 29%, respectively). Whereas, Toraja Utara, Bima and Kediri are estimated to have close to half of their adult populations using banking services. But what these results also point out is that while ‘banked levels’ may be low in some districts, access to and use of other formal, non-bank services help raise the levels of financial inclusion. This is the case, for example, with Sabu Raijua, which has the largest proportion of the population who are using other formal, non-bank services (55%), amongst all the selected districts.
• The use of informal financial services is largely comparable across the selected districts except in Kediri and Malang, where we find the largest proportions of the population using informal services (at 10% and 9%, respectively). These results for these two districts are, however, consistent with the overall finding on the pronounced use of informal financial services in East Java.
The table below provides summary profiles, given the results in the selected districts:
Thefinancially-excludedpopulation are most likely to be:
• Located in Lombok Timur, Lombok Utara, Malang, or Kediri;
• Male;• Amongst those who belong to the
poorest households (i.e. in the lowest wealth quintiles - PPI 1 and 2);
• Rural-based;• Above the age of 55; and• Have little or no education.
The populationservedformallyand/orsemi-formally are most likely to be:
• Located in Sabu Raijua, Sikka, Manggarai or Bima;
• Female;• Amongst those who belong to higher
wealth quintiles (PPI 4, 5);• Urban-based;• Below the age of 55; and• Have achieved at least senior high
school level (SMA).
In the following sections, we unpack the financial access strand by looking at how different types of financial services – particularly, savings and credit – are used in the selected districts.

Survey on Financial Inclusion and Access (SOFIA) Focus Note on Selected Districts
4
4 Across the 10 districts, it is estimated that 37% of savers save via banks. The vast majority (94%) of bank-based savings are done through commercial banks, while the rest (6%) use regional banks or BPDs.
2.2 Access to and use of savings products
Across the 10 districts, a significantly higher proportion of the population who save do so outside the financial system – compared with the results generated for the entire population in the four provinces surveyed. The overall level of exclusion when it comes to savings is higher: 50% of the population who save (in the selected districts) do so by 'keeping money at home or in a safe place'. The results, depicted in Figure 2 below, show that:
• The highest levels of exclusion in terms of savings are in Lombok Utara (74%) and Sabu Raijua (73%). These are also the districts with the lowest proportion of the population who save via banks.
• In contrast, Toraja Utara (52%), Kediri (45%), and Bima (43%) have the highest proportions of adults who save via banks.4 These results are consistent with those presented in terms of the overall financial access strand. However, despite the relatively high proportion of people who save in banks in these three districts, it is important to note that there are still sizeable proportions of savers who save outside the financial system in these locations; in the case of Bima, as much as 50% of active savers are estimated to be financially-excluded.
• While the use of semi-formal financial services (e.g. saving in an account held at a cooperative) is minimal over all, in some districts there is evidence of significantly more widespread use of these services. This is, for example, depicted in the results for Sikka and Manggarai – where as much as 19% (in the case of Sikka) use semi-formal mechanisms for saving.
Fig 2. How people save in the selected districts (%)
Toraja Utara
Sikka
Sabu Raijua
Manggarai
Malang
4
19
8
3
43
43
73
53
46
1
1
3
9
17
52
35
26
30
34
Banked Non-bank, formal Informal Financially-excludedSemi-formal
Luwu Utara
Lombok Utara
Lombok Timur
Kediri
Bima
1
1
2
2
62
59
74
41
50
2
12
4
4
7
35
36
20
45
43

Survey on Financial Inclusion and Access (SOFIA) Focus Note on Selected Districts
5
5 The survey results indicate that 100% of bank-based borrowing in these districts are done through commercial banks. (There are no reported loans accessed from rural banks (BPRs) nor regional banks (BPDs).) None of the borrowers have reported accessing KUR loans. (Kredit Usaha Rakyat, or KUR, is a loan product aimed at supporting the working capital and/or investment requirements of micro, small and medium enterprises and cooperatives (usaha mikro kecil menengah dan koperasi, or UMKMK) in the productive enterprise sector. The product is offered through banks and comes with a guarantee provided by the government.)
The other interesting findings emerging from the analysis of savings behaviour in the selected districts are summarised below:
• Respondents were asked to report their savings balance and the results show a wide variation in values reported: 38% of those who save, save less than IDR100,000, and 41% of savers indicated that they save more than IDR50,000,000. Interestingly, a higher savings balance does not necessarily mean that savings are being kept in a bank account: over 22% of those who reported saving over IDR50,000,000 do so outside the financial system (i.e. they keep their savings at home / in a safe place).
• There are also marked gender differences. 55% of the male savers are excluded, compared to 43% of female savers. However, a higher proportion of male savers (39%) use banks to store their savings, compared to only 36% of female savers. On the other hand, female savers in these districts are more likely to use informal savings mechanisms (17% vs. 4% of male savers).
• In terms of income source, over 40% of those who are salaried and 60% of those who rely on NGOs or government assistance for their income save outside the financial system. Only 40% of those who generate their income through entrepreneurial activity and 46% of those who receive wages/salaries are banked.
• The highest proportions of financially-excluded individuals are in the 65+ age group (69%), followed by those aged 55-64 (53%) and those under the age of 24 (43%).
• The top-three purposes for saving reported in these selected districts are consistent with the findings for the entire population (four provinces), as well as with other demographic groups and segments we have so far looked into. These are to cover basic needs (26%), to pay for education expenses/school fees (21%), and to meet the cost of emergencies (21%).
• Drivers of usage: Those who save informally do so primarily because this allows them quick access to their saved amounts and to save small amounts – which they wouldn’t otherwise be able to do if they saved in banks. On the other hand, those who use banks and semi-formal institutions to save do so primarily because they trust the institution and consider the processes simple.
2.3 Access to and use of loans
When we look at how people borrow money in the selected districts, the access strand looks remarkably different from the savings access strand. The results in terms of the sources of credit among borrowers in the selected districts, depicted in Figure 3 below, show that:
• A significantly higher proportion of borrowers in these districts access credit outside the financial system. 63% rely on family and friends for loans (or are considered financially-excluded in terms of borrowing). Lombok Timur, Toraja Utara and Sabu Raijua are the districts with the highest proportions of borrowers who are excluded (at 83%, 76% and 75%, respectively). These results on exclusion are particularly compelling in the case of Lombok Timur and Sabu Raijua, given that these districts also have the largest proportions of savers who are excluded.
• The proportion of borrowers in these selected districts who access loans from informal sources are comparable to what is observed in terms of the prevalence of informal saving: 8% borrow informally, compared to 11% who save informally.
• The biggest difference (when comparing the savings and credit strands) are seen in terms of those who are banked and are using semi-formal financial services. - While more than a third save in banks, only 12% of borrowers access loans from banks.5 - And while only a small proportion (3%) of savers save through semi-formal institutions such
as cooperatives, we find a larger proportion of borrowers deriving their loans from semi-formal sources (14%). In districts such as Sikka, Manggarai and Malang, the role played by semi-formal providers of credit is significant and drives up levels of inclusion in these locations.

Survey on Financial Inclusion and Access (SOFIA) Focus Note on Selected Districts
6
Fig 3. How people borrow in the selected districts (%)
Toraja Utara
Sikka
Sabu Raijua
Manggarai
Malang
Luwu Utara
Lombok Utara
Lombok Timur
Kediri
Bima
11
28
6
21
18
5
11
6
14
7
2
1
1
4
5
6
6
3
2
1
76
61
75
64
55
65
71
83
55
66
3
4
11
5
10
9
7
2
12
12
8
6
7
6
12
15
5
6
17
14
Banked Non-bank, formal Informal Financially-excludedSemi-formal
Only a small proportion (3%) of borrowers in these districts access loans from other formal, non-bank credit providers. Most of this type of borrowing (84%) is done through multi-finance companies, while the rest use loans extended by pawnshops.
The other interesting findings emerging from the analysis of borrowing behaviour in the selected districts are summarised below:
• Respondents were asked to report the value of their most recent loans and the results show a wide variation in values reported: 38% of active borrowers had loan sizes in excess of IDR50,000,000, 22% borrowed amounts below IDR100,000 and 11% borrowed between IDR100,000 to 500,000. Similar to what we found in terms of savings, those who accessed relatively larger loan amounts did not necessarily borrow from banks: only a little over a third (39.6%) of those who borrowed in excess of IDR50,000,000 got their loans through commercial banks.
• There are also marked gender differences. A significantly higher proportion of male borrowers accessed loans from banks (16% vs 7% of female borrowers); whereas, female borrowers were slightly more likely to get loans from semi-formal providers or through informal means (26% vs 18% of male borrowers). Unlike the results in terms of savings, however, there is a slightly higher proportion of female borrowers who are excluded compared to males.
• In terms of income source, borrowing from formal and semi-formal financial institutions appear to favour pensioners, entrepreneurs and salaried individuals. Whereas, those who rely on others or NGO/Government assistance for their main income constitute the bulk of those who borrow outside the financial system.
• Borrowing through formal institutions is also most pronounced among individuals in the 35-54 age group. Those over the age of 65 and under the age of 24 had the highest proportions of excluded individuals, when it comes to borrowing.

Survey on Financial Inclusion and Access (SOFIA) Focus Note on Selected Districts
7
Fig 4. Prevalence of borrowing in-kind and their sources (%)
• Similar to the top-three purposes for which people save, people borrowed money to pay for consumption and basic needs (35.5%), education expenses / school fees (15.9%), and to cover emergencies (7.2%). That said, the other purposes for credit cited by active borrowers in the selected districts include starting a business (5%) and buying land (4%).
• The table below summarises the drivers of formal/semi-formal borrowing, as well as those of informal borrowing. In both cases, borrowers valued most the simplicity of the process and being able to access the loan quickly.
Driversofformal/semi-formalborrowing:
• Processes are simple • Get the money quickly• Lower interest rate• Loan amount works for me • Loan instalments are affordable • Loan repayment schedule works
Driversofinformalborrowing:
• Processes are simple• Get the money quickly• Loan repayment schedule works • No collateral required • Lower interest rate • Loan amount works for me
Non-cashborrowing
In these selected districts, a significant proportion of the population (19%) said that they have ‘borrowed in-kind’ over the past year. These are essentially purchases made by individuals, which they paid for partially or in instalments. This type of borrowing was largely for personal use (93%), and only a small proportion indicated using this type of credit for business purposes. Almost all the reported borrowing in-kind (98%) were paid back in cash.
Those who have non-cash credit are more likely to be female: 66% of those who reported borrowing in-kind are women. 24.5% of them were in the 35-44 age group, 28% are 25-34 years old, and 15% are in the 45-54 age group. This type of borrowing also appears to be most pronounced in rural areas: 51.6% of those who have non-cash credit are rural-based.
Interestingly, while over 40.7% of those who have non-cash loans rely on other household members for their income, this type of borrowing is still pronounced when we look at entrepreneurs (who constitute 26% of those who had non-cash credit), as well as those who receive wages/salaries (26%).
There are many different suppliers of this type of credit. The results, depicted in Figure 4 below, show that ‘in-kind credit’ is mainly provided by general merchandise retailers (46%) and buyers or traders (33%).
19
81
33.2Buyer/trader
General merchandise
retailer
Friendsand family
Others
Bank
Processor
Other companies I do business with
Did you purchase something that you paid for partially or in instalments?
Yes No
Supplier of raw material
Employer
45.61.0
0.6
0.9
0.4
14.5
3.5
0.5

8
Opportunities to expand financial services in the selected districts
03
There are a number districts where the survey results point to opportunities to expand the provision of financial services – especially those provided by formal financial institutions such as banks.
3.1 Kediri and Malang in East Java
There a number of demographic characteristics of Kediri which are favourable to financial service providers, especially banks.
• Amongst the selected districts, Kediri has the highest proportion of sub-districts that are classified as urban.
• The population in this district also tends to have higher levels of education: the SOFIA survey results indicate that more than three-quarters (82%) of the district’s adult population have completed higher education levels.
• A significant proportion of the population in Kediri are also estimated to be among the non-poor – with 57.6% of the population falling under PPI Quintile 3.
• The population in the district are young and economically active: 72% are below the age of 54, with the majority concentrated in the 25-54 age group.
• Kediri also has a high proportion of salaried individuals and entrepreneurs (56%).
Despite these favourable demographic characteristics, however, a high proportion of the population do not use formal, semi-formal or even informal financial services. They save money in their homes or rely solely on family and friends to meet their credit needs. As Figure 5 below shows, even with a high proportion of savers who save through banks (45%), most borrowing and receipt of remittances in Kediri are carried out outside the financial system.
Fig 5. How people in Kediri save, borrow and receive remittances (%)
Borrowing
Saving
Receiving remittances
14
2
2
3
55
41
79
12
12
17
45
18
Banked Non-bank, formal Informal Financially-excludedSemi-formal

Survey on Financial Inclusion and Access (SOFIA) Focus Note on Selected Districts
9
Fig 6. How people in Malang save, borrow and receive remittances (%)
Borrowing
Saving
Receiving remittances
18
3
5 55
46
78
10
17
1
12
34
16
Banked Non-bank, formal Informal Financially-excludedSemi-formal
It is meaningful to point out that more than 63% of those who are financially-excluded in Kediri belong to PPI Quintile 3. The assumption is that this segment of individuals have resources to save and are financially able to service loans (should they have credit requirements).
The survey results show that over 70% of those who are financially-excluded in terms of saving (i.e. these individuals are neither saving formally nor informally) are reportedly saving amounts in excess of IDR50,000,000. Most of this saving is, however, only being ‘kept at home or in a safe place’. 70% of these individuals are also borrowing in excess of IDR50,000,000 – mainly in the form of borrowing from family and friends. Moreover, all these individuals who are not saving and borrowing from formal financial service providers are actively remitting cash; but this is done mainly by directly handing over cash to the recipients.
In addition to this, there are significant overlaps between the use of formal and informal services across the different financial products - i.e. savings, credit and sending of remittances. Some individuals use banks to save money, but at the same time rely only on informal channels to access credit. Likewise, when we look at those who are making money transfers outside the financial system, it is interesting to note that approximately 68%of these individuals are anyway saving in a bank account. These overlaps in the use of different types of financial services suggest opportunities for formal financial institutions to consider cross-selling of other services beyond the provision of savings accounts.
A similar case is observed in terms of Malang, whose population appear to share similar demographic characteristics as those in Kediri.
• 55% of the population in Malang belong to households that are classified under PPI Quintile 3 (non-poor).
• It also has a population with higher education levels achieved. • Its population is largely young, with 75% of the population below the age of 55, given the results
of the survey. • Similar to Kediri, we find a high proportion (53%) of the population in Malang deriving their
income from wages/salaries or entrepreneurial activity.
Despite these characteristics, more than half of the population in Malang who save do so outside the financial system. The financially-excluded population is even higher when we look at credit only: 55% borrow mainly from family and friends. And the vast majority (78%) of those who receive remittances do so outside the financial system. These results are depicted in Figure 6 below.
5
Survey on Financial Inclusion and Access (SOFIA) Focus Note on Selected Districts
10
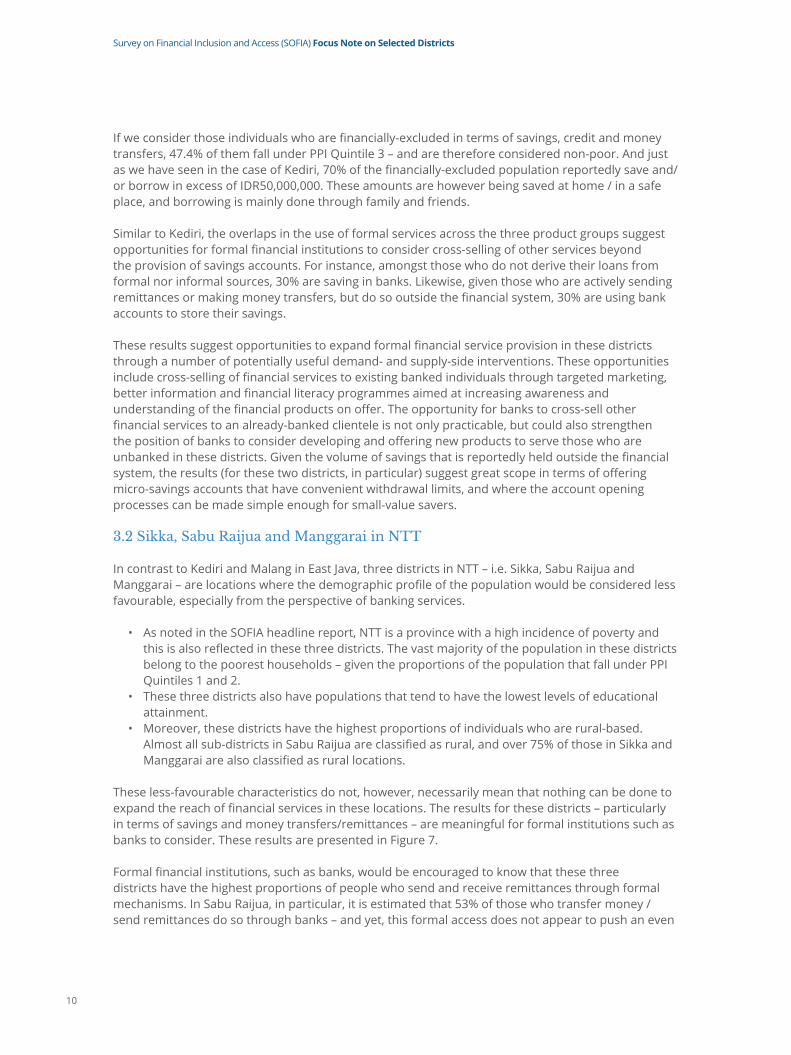
If we consider those individuals who are financially-excluded in terms of savings, credit and money transfers, 47.4% of them fall under PPI Quintile 3 – and are therefore considered non-poor. And just as we have seen in the case of Kediri, 70% of the financially-excluded population reportedly save and/or borrow in excess of IDR50,000,000. These amounts are however being saved at home / in a safe place, and borrowing is mainly done through family and friends.
Similar to Kediri, the overlaps in the use of formal services across the three product groups suggest opportunities for formal financial institutions to consider cross-selling of other services beyond the provision of savings accounts. For instance, amongst those who do not derive their loans from formal nor informal sources, 30% are saving in banks. Likewise, given those who are actively sending remittances or making money transfers, but do so outside the financial system, 30% are using bank accounts to store their savings.
These results suggest opportunities to expand formal financial service provision in these districts through a number of potentially useful demand- and supply-side interventions. These opportunities include cross-selling of financial services to existing banked individuals through targeted marketing, better information and financial literacy programmes aimed at increasing awareness and understanding of the financial products on offer. The opportunity for banks to cross-sell other financial services to an already-banked clientele is not only practicable, but could also strengthen the position of banks to consider developing and offering new products to serve those who are unbanked in these districts. Given the volume of savings that is reportedly held outside the financial system, the results (for these two districts, in particular) suggest great scope in terms of offering micro-savings accounts that have convenient withdrawal limits, and where the account opening processes can be made simple enough for small-value savers.
3.2 Sikka, Sabu Raijua and Manggarai in NTT In contrast to Kediri and Malang in East Java, three districts in NTT – i.e. Sikka, Sabu Raijua and Manggarai – are locations where the demographic profile of the population would be considered less favourable, especially from the perspective of banking services.
• As noted in the SOFIA headline report, NTT is a province with a high incidence of poverty and this is also reflected in these three districts. The vast majority of the population in these districts belong to the poorest households – given the proportions of the population that fall under PPI Quintiles 1 and 2.
• These three districts also have populations that tend to have the lowest levels of educational attainment.
• Moreover, these districts have the highest proportions of individuals who are rural-based. Almost all sub-districts in Sabu Raijua are classified as rural, and over 75% of those in Sikka and Manggarai are also classified as rural locations.
These less-favourable characteristics do not, however, necessarily mean that nothing can be done to expand the reach of financial services in these locations. The results for these districts – particularly in terms of savings and money transfers/remittances – are meaningful for formal institutions such as banks to consider. These results are presented in Figure 7.
Formal financial institutions, such as banks, would be encouraged to know that these three districts have the highest proportions of people who send and receive remittances through formal mechanisms. In Sabu Raijua, in particular, it is estimated that 53% of those who transfer money / send remittances do so through banks – and yet, this formal access does not appear to push an even
Survey on Financial Inclusion and Access (SOFIA) Focus Note on Selected Districts
11
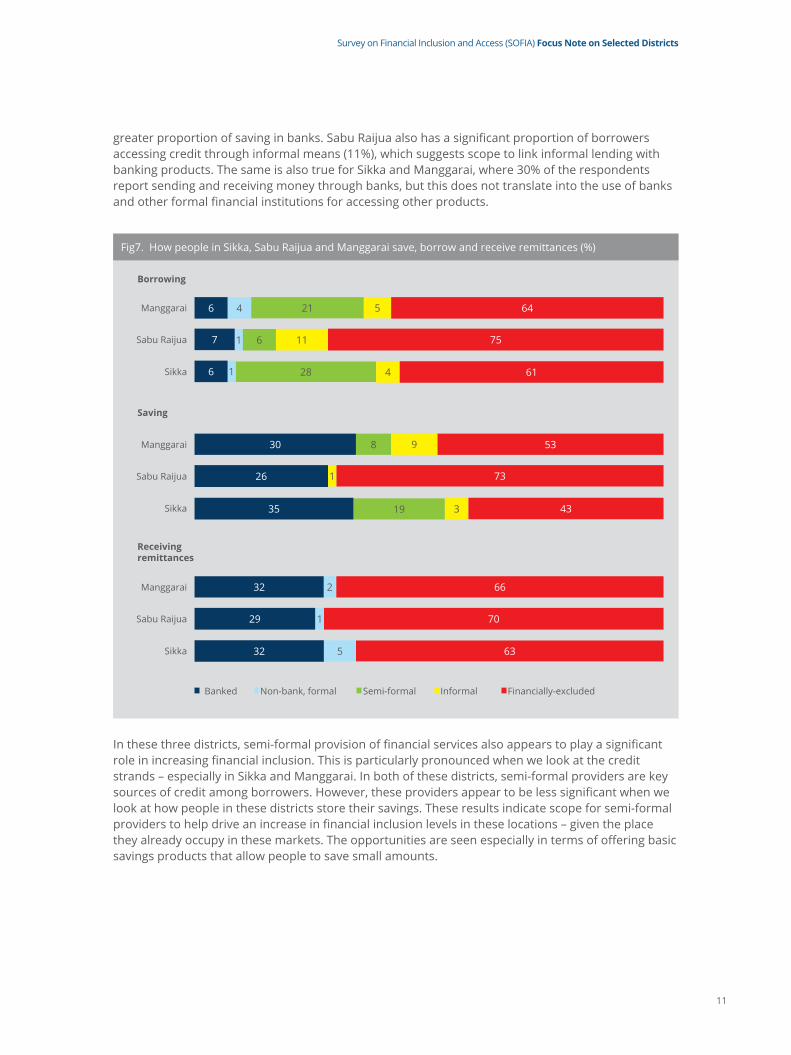
greater proportion of saving in banks. Sabu Raijua also has a significant proportion of borrowers accessing credit through informal means (11%), which suggests scope to link informal lending with banking products. The same is also true for Sikka and Manggarai, where 30% of the respondents report sending and receiving money through banks, but this does not translate into the use of banks and other formal financial institutions for accessing other products.
Fig7. How people in Sikka, Sabu Raijua and Manggarai save, borrow and receive remittances (%)
Manggarai
Manggarai
Manggarai
Borrowing
Saving
Receivingremittances
Sabu Raijua
Sabu Raijua
Sabu Raijua
Sikka
Sikka
Sikka
21
28
8
19 3
4
4
5 64
53
66
75
73
70
61
43
63
9
111
1
1
1
6
6
6
30
32
7
26
29
35
32
Banked Non-bank, formal Informal Financially-excludedSemi-formal
5
2
In these three districts, semi-formal provision of financial services also appears to play a significant role in increasing financial inclusion. This is particularly pronounced when we look at the credit strands – especially in Sikka and Manggarai. In both of these districts, semi-formal providers are key sources of credit among borrowers. However, these providers appear to be less significant when we look at how people in these districts store their savings. These results indicate scope for semi-formal providers to help drive an increase in financial inclusion levels in these locations – given the place they already occupy in these markets. The opportunities are seen especially in terms of offering basic savings products that allow people to save small amounts.

12
Annex A - Defining the 'Financial Access Strand'
One of the key indicators of interest is theproportionoftheadultpopulationwithaccesstofinancialservices – or what is commonly referred to as the ‘Financial Access Strand’. This seeks to measure the proportion of the population who have access to or are using different types of financial services, based on a classification of financial products. The Access Strand, as introduced under the FinScope surveys, focuses on the financial system in its broadest sense and assumes that all adults in a country will fall into one of the broad segments.
In SOFIA, access to financial products and services is classified as:• Banked; • Formal, non-bank; • Semi-formal; • Informal; or • Financially-excluded.
The overlaps in the usage of products are taken out in the Access Strand. For example, an individual who uses banking services as well as informal services is classified as ‘banked’.
The Financial Access Strand is specifically constructed to illustrate the extent of:• Financialexclusion: The percentage of adults who do not use any financial services for the
purposes of cash-flow management, risk management, asset-building or productive investment. These individuals rely only on themselves, other household members, family and/or friends for these purposes.
• Informallyserved: The percentage of adults who rely only (purely) on informal financial services (i.e. financial services that are not provided by an institution that is formally regulated or supervised).
• Semi-formallyserved: The percentage of adults who use semi-formal financial services - i.e. those services provided by institutions that are supervised but are not regulated by the financial services authority, such as cooperatives. Although these individuals may also use informal services, they do not use any financial services provided by institutions that are formally regulated.
• Formalinclusion: The percentage of adults who use services provided by institutions that are regulated by the financial services authority. Formal inclusion is not exclusive – these individuals may or may not use other types of services (semi-formal and/or informal services) as well. They are, however, distinguished by their usage of formal services. Those who are formally included are further broken down into those who are:
- Non-bank,formally-included – the percentage of adults who use formal financial services but not services provided by banks. These are non-bank formal financial institutions, such as multi-finance companies, authorized payment service providers, etc.
- Banked – the percentage of adults who use services offered by banks. These include commercial banks, rural banks (BPRs) and regional development banks (BPDs). These individuals may or may not use non-bank formal services as well. They are, however, distinguished by their use of commercial bank services.

Survey on Financial Inclusion and Access (SOFIA) Focus Note on Selected Districts
13
The table below provides details to distinguish formal, semi-formal and informal financial services.
In constructing the Access Strand for the purposes of SOFIA, we have set out five categories, namely: Banked; Formal, non-bank; Semi-formal; Informal; and Financially-excluded. These are further explained in the table below.
Formal Semi-formal Informal
Regulatorystatus
Regulated and supervised by the Financial Services Authority
Not subject to the same supervision as formal financial institutions
Operates outside the legal and regulatory framework (for financial services)
Typesofproviders
Banks:Commercial banksBPDsBPRs
Savings and credit cooperativesCredit schemes or programmes that are not delivered through banks
ArisanMoneylenderInformal savings collectorEmployerIndividuals whom people do business with – e.g. buyer/trader, processor, supplier
Non-banks:Multi-finance companiesVenture capital firmPeer-to-peer/internet lending/crowdfundingPawnshop (except pawning services)
Banked Formal, non-bank
Semi-formal Informal Financially excluded
Using financial products or services offered by…
Financial institutions that are recognised as banks
Non-bank financial institutions that are regulated / supervised by the financial services regulatory authority (OJK)
Non-bank financial institutions that are not regulated / supervised by the financial services regulatory authority (OJK)
(a) money-lenders, (b) village-based informal associations
Does not use financial services from any formal or semi-formal institution, nor through informal means
Examples of providers of financial services
Commercial banksBPDsBPRs
Multi-finance companies
Savings and credit cooperatives
Arisan “I keep my extra cash/savings at home.”
Survey on Financial Inclusion and Access (SOFIA) Focus Note on Selected Districts
14
In developing the access strand, weconsider‘usage’offinancialservices,whichdoesnotnecessarilymeanownership. For example, a person may be able to use banking services but not necessarily own a bank account him/herself. S/he may be using an account that belongs to a household member – e.g. when receiving transfers (due her), a wife uses her husband’s bank account.
It is also important to point out that financially-excluded individuals are those who do not use services that fall under the formal, semi-formal or informal categories. E.g. they may be keeping their savings at home or borrowing money from their family members or friends. The financially-excluded group does not, however, include those who are not using financial services – e.g. those who are not saving at all, are not borrowing money, are not making any payments or transfers, etc.

Implemented by
Kementerian Perencanaan Pembangunan Nasional /Badan Perencanaan Pembangunan Nasional (BAPPENAS)Jalan Taman Suropati No. 2 Jakarta 10310Telp: 021 3193 6207 | Fax: 021 3145 374 Email: [email protected] | [email protected]