survey of integrated reports in japan 2016€¦ · directions based on a big-picture view and...
TRANSCRIPT

kpmg.com/ jp
March 2017
Survey of Integrated Reports in Japan 2016Integrated Reporting Advisory GroupKPMG in Japan

Survey of Integrated Reports in Japan 2016
“The number of companies issuing integrated reports has not
only increased; the content has improved.
Most companies that issue integrated reports explain exactly
what they must do to increase long-term corporate value.
Moreover, they appear to recognize their company’s core
values that help support long-term value, and dispassionately
assess ESG items that underpin sustainability. Nevertheless,
problems can still be found in some reports. Reports that are
overly bullish, exaggerated, and full of catchphrases are also
increasing in number.
A return to greater simplicity in such reports is recommended.
Mr. Arthur Levitt, former chairman of the U.S. Securities and
Exchange Commission (SEC), requested that documents
submitted to the SEC be written in plain (i.e., simple but
tasteful) English. I hope that Japanese companies too will
follow that advice in their integrated reports. All companies
have room for improvement. I think that a more modest and
forthcoming tone of voice is needed. We must not forget that
an integrated report should be a good tool for creating dialog
with sophisticated investors.”
Chair of the UK Corporate Reporting Council and Board member, FRC Former CEO, IIRC
― Paul Druckman Professor, Graduate School of International Management, Aoyama Gakuin University
― Tetsuo Kitagawa Chairman, Arabesque Partners Visiting Professor of Management Practice, Said Business School, Oxford University
― Robert G. Eccles
“I am very encouraged to see the progress integrated
reporting has made in the Japanese business
community in the last three years. There are now some
279 companies publishing integrated reports on a
completely voluntary basis without any government
regulation. I think this shows that Japanese executives
recognize the benefits of integrated reporting to
themselves to drive integrated thinking.
They also recognize that it gives their shareholders and
other key stakeholders a better understanding of how
they are using and impacting the six capitals as they
create value over the long-term.
I’m hoping that the number of Japanese companies
publishing integrated reports continues to increase.
Equally important, I hope they continue to strive to
improve their quality since there is clearly a learning
process involved.”
“The significant number of Japanese companies
producing integrated reports has been noticed across
the world and seen as a demonstration of the Japanese
Revitalisation Strategy― a bold move for the economy.
The next phase for Japanese companies is surely to
focus on communicating the business model and its
connectivity, whilst giving clarity on long term strategy.
Japan has far more companies over 100 years old than
any economy in the world, so such thinking is intrinsic
― my message is to show it.”
In this, the third year this survey report has been issued, KPMG has solicited the observations of thought leaders on integrated reporting in Japan, the United States, and Europe about Japanese companies.
© 2017 KPMG AZSA LLC, a limited liability audit corporation incorporated under the Japanese Certified Public Accountants Law and a member firm of the KPMG network of independent member firms affiliated with KPMG International Cooperative (“KPMG International”), a Swiss entity. All rights reserved.
Survey of Integrated Reports in Japan 2016
Foreword
About the survey/About the Issuing Companies
Key Findings
Executive Summary
Value creation
Governance
Materiality
Risks and opportunities
Performance
Strategic focus and connectivity
Basic information
List of Japanese Companies Issuing Integrated Reports in 2016
Conclusion
Survey Team
01
02
03
04
05
07
11
16
19
23
27
31
37
39
40
Contents
02Foreword
The societies in which we live are full of diversity. With all manner of exchange taking place around the world,
the key to coping with the speed and complexity of change and fulfilling social responsibilities is determining
how to take advantage of diversity in dealing with challenges, and in actual conduct. Today, with traditional rules
and values in disarray, the time has come for companies and individuals to reexamine their responsibilities to
society and the future, and to act proactively.
During the so-called “lost 20 years,” amid changing social values and increasing diversity, KPMG has highlighted
the importance of corporate communications as one initiative that makes companies more competitive, helps
them fulfill their social responsibilities, and raises their medium- to long-term value. As a tool for examining this
issue, KPMG has continued to survey current integrated reports over the last three years. Japanese corporate
initiatives are also considered part of the government’s growth strategy and are the object of great interest
from other countries. The English version of our survey report has been read extensively outside Japan.
Management has the responsibility for corporate change. In the spotlight today are the leadership and quality of
managers who proactively seize upon change as an opportunity to make reforms and venture out in new
directions based on a big-picture view and long-term perspective. Integrated thinking to leverage diversity and
create sustainable value helps support the decision-making and development of managers who are striving for
change.
When a managers’ positive attitude about change is revealed in an integrated report, it inspires greater
confidence from investors and other stakeholders, leading to greater corporate dynamism.
The phrase “Inspire Confidence, Empower Change” captures KPMG’s reason for being. While leveraging the
diversity fostered by our global network, we will continue to fulfill the responsibilities entrusted to us.
We hope that this survey will provide some helpful suggestions to all
who are striving for change.
Foreword
Chairman, KPMG in Japan
Tsutomu Takahashi
© 2017 KPMG AZSA LLC, a limited liability audit corporation incorporated under the Japanese Certified Public Accountants Law and a member firm of the KPMG network of independent member firms affiliated with KPMG International Cooperative (“KPMG International”), a Swiss entity. All rights reserved.

279companies
36% 16%
33%
・・・・・・・・・・・・・・・・・・・・・・・・・・・・・・・・・・・・・・・・・・・・・・・・・・・・・・・・・・・・・
・・・・・・・・・・・・・・・・・・・・・・・・・・・・・・・・・・・・・・・・・・・・・・・・・・・・・・・・・・・・・・・・・・・・・・
・・・・・・・・・・・・・・・・・・・・・・・・・・・・・・・・・・・・・・・・・・・・・・・・・・・・・・・・・・・・・・・・・・・・・・・・・・・・・・・・・・・・・・・・・・・・・・・・・・・・・・・・・・・・・・・・・・・・・・・・・・
Amid a growing need for constructive dialog between companies and investors, the integrated report has attracted attention as a communication tool, and the number of companies issuing one has steadily increased year by year.
Since 2014, the KPMG Japan Integrated Reporting Advisory Group has been continuously investigating the disclosure trends among Japanese companies that issue integrated reports.
In order that the voluntary efforts of companies that issue integrated reports help to raise value by enhancing dialog between companies and investors, and thereby increasing the competitive edge of Japanese companies, it is worthwhile to look at the existing situation and highlight some achievements and challenges.
Therefore, we decided to continue to survey integrated reports, targeting reports issued in 2016.
A broadly agreed-upon definition of the integrated report does not yet exist. Therefore, KPMG uses the List of Japanese Companies Issuing Self-Declared Integrated Reports in 2016 which is issued by the Corporate Value Reporting Lab. We survey and analyze reports of all of 279 companies in their List.
According to the latest survey by the Corporate Value Reporting Lab, 141 companies issued integrated reports in 2014, and 220 companies in 2015. However, information on past comparisons contained in this text is based on the number of issuing companies at the time that each survey was conducted.
Survey items have been selected taking into account the content that is expected in integrated reports and its significance for investors, who are assumed to be the primary readers.
After establishing criteria and assigning each of our members to a specific report section, the survey was conducted on the general principle that each member would verify all reports for his/her assigned section.
Background and purposeAbout the survey
About the Issuing Companies
Scope
Methodology
03 About the survey/About the Issuing Companies
Index attributes of issuing companies
Nikkei 225 component percentage
JPX-Nikkei 400 component percentage
26 3462
96
141
220
2010 2011 2012 2013 2014 2015 2016
The number of companies issuedintegrated reports in 2016 50%
37%
List of Japanese Companies Issuing Integrated Reports p.37 >
2014 Survey: 142 companies (as of December 31, 2014)2015 Survey: 205 companies (as of December 31, 2015)
Over JPY 1 trillion
JPY 500 billion to under JPY 1 trillion
JPY 100 billion to under JPY 500 billion
JPY 50 billion to under JPY 100 billion
8%
Under JPY 50 billion5% 2%
Unlisted
Revenue of issuing companies
94
44
100
2214
5
n=225
n=400
n=279
113
146
+59
© 2017 KPMG AZSA LLC, a limited liability audit corporation incorporated under the Japanese Certified Public Accountants Law and a member firm of the KPMG network of independent member firms affiliated with KPMG International Cooperative (“KPMG International”), a Swiss entity. All rights reserved.
・・・・・・・・・・・・・・・・・・・・・・・・・・・・・・・・・・・・・・・・・・・・・・・・・・・・・・・・・・・・・
・・・・・・・・・・・・・・・・・・・・・・・・・・・・・・・・・・・・・・・・・・・・・・・・・・・・・・・・・・・・・
・・・・・・・・・・・・・・・・・・・・・・・・・・・・・・・・・・・・・・・・・・・・・・・・・・・・・・・・・・・・・
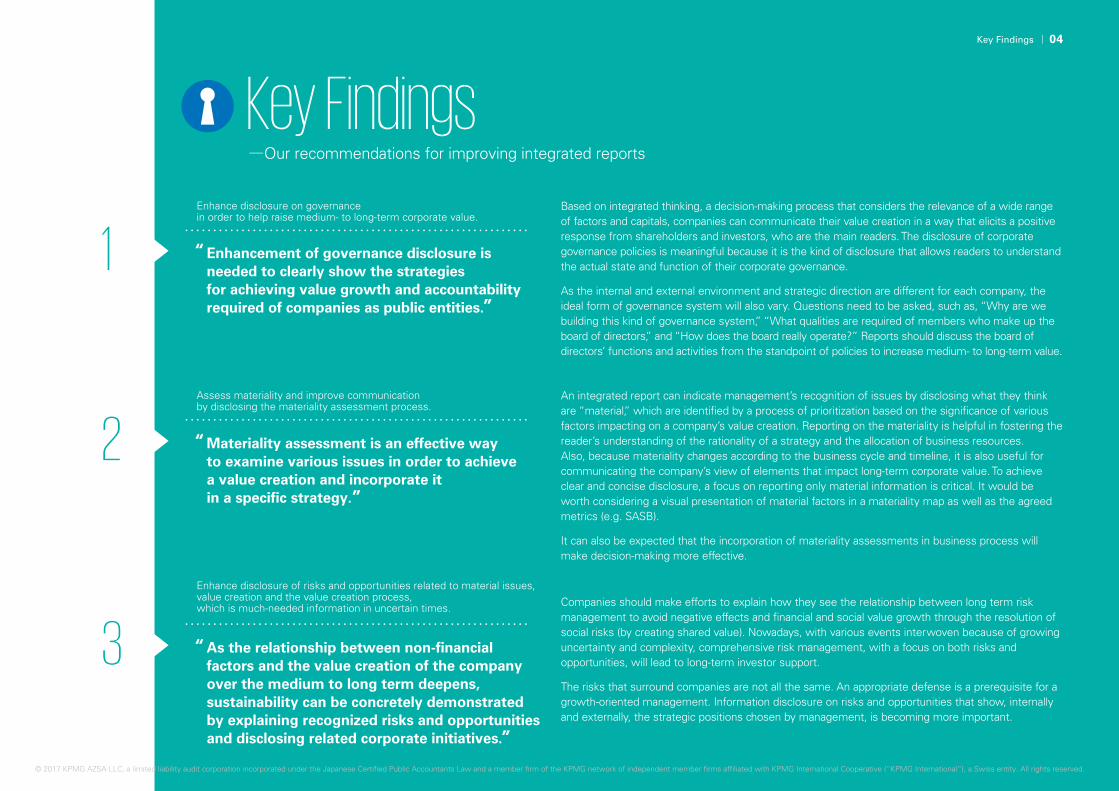
Key Findings Enhance disclosure on governance in order to help raise medium- to long-term corporate value.
Based on integrated thinking, a decision-making process that considers the relevance of a wide range of factors and capitals, companies can communicate their value creation in a way that elicits a positive response from shareholders and investors, who are the main readers. The disclosure of corporate governance policies is meaningful because it is the kind of disclosure that allows readers to understand the actual state and function of their corporate governance.
As the internal and external environment and strategic direction are different for each company, the ideal form of governance system will also vary. Questions need to be asked, such as, “Why are we building this kind of governance system,” “What qualities are required of members who make up the board of directors,” and “How does the board really operate?” Reports should discuss the board of directors’ functions and activities from the standpoint of policies to increase medium- to long-term value.
―Our recommendations for improving integrated reports
Enhancement of governance disclosure is needed to clearly show the strategies for achieving value growth and accountability required of companies as public entities.
1
Assess materiality and improve communication by disclosing the materiality assessment process.
Enhance disclosure of risks and opportunities related to material issues, value creation and the value creation process, which is much-needed information in uncertain times.
An integrated report can indicate management’s recognition of issues by disclosing what they think are “material,” which are identified by a process of prioritization based on the significance of various factors impacting on a company’s value creation. Reporting on the materiality is helpful in fostering the reader’s understanding of the rationality of a strategy and the allocation of business resources. Also, because materiality changes according to the business cycle and timeline, it is also useful for communicating the company’s view of elements that impact long-term corporate value. To achieve clear and concise disclosure, a focus on reporting only material information is critical. It would be worth considering a visual presentation of material factors in a materiality map as well as the agreed metrics (e.g. SASB).
It can also be expected that the incorporation of materiality assessments in business process will make decision-making more effective.
Materiality assessment is an effective way to examine various issues in order to achieve a value creation and incorporate it in a specific strategy.
2
Companies should make efforts to explain how they see the relationship between long term risk management to avoid negative effects and financial and social value growth through the resolution of social risks (by creating shared value). Nowadays, with various events interwoven because of growing uncertainty and complexity, comprehensive risk management, with a focus on both risks and opportunities, will lead to long-term investor support.
The risks that surround companies are not all the same. An appropriate defense is a prerequisite for a growth-oriented management. Information disclosure on risks and opportunities that show, internally and externally, the strategic positions chosen by management, is becoming more important.
As the relationship between non-financial factors and the value creation of the company over the medium to long term deepens, sustainability can be concretely demonstrated by explaining recognized risks and opportunities and disclosing related corporate initiatives.
3
“
”
“
”
“
”
04Key Findings
© 2017 KPMG AZSA LLC, a limited liability audit corporation incorporated under the Japanese Certified Public Accountants Law and a member firm of the KPMG network of independent member firms affiliated with KPMG International Cooperative (“KPMG International”), a Swiss entity. All rights reserved.
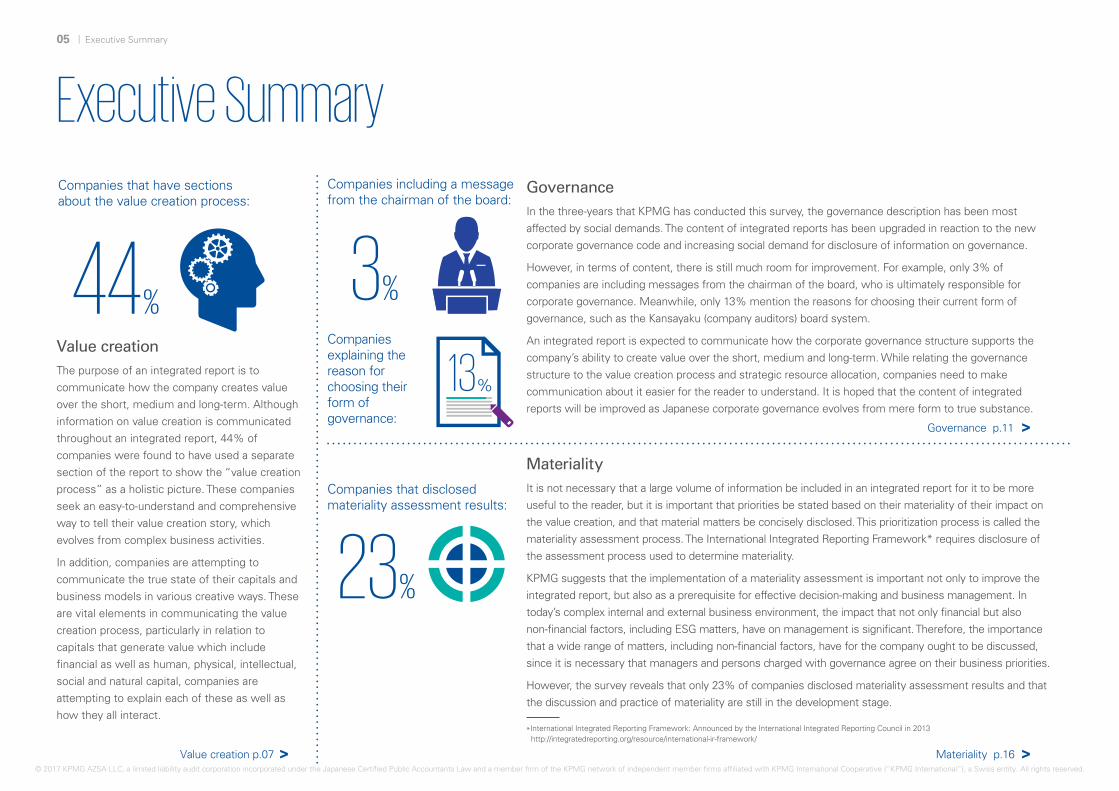
Value creationThe purpose of an integrated report is to communicate how the company creates value over the short, medium and long-term. Although information on value creation is communicated throughout an integrated report, 44% of companies were found to have used a separate section of the report to show the “value creation process” as a holistic picture. These companies seek an easy-to-understand and comprehensive way to tell their value creation story, which evolves from complex business activities.
In addition, companies are attempting to communicate the true state of their capitals and business models in various creative ways. These are vital elements in communicating the value creation process, particularly in relation to capitals that generate value which include financial as well as human, physical, intellectual, social and natural capital, companies are attempting to explain each of these as well as how they all interact.
GovernanceIn the three-years that KPMG has conducted this survey, the governance description has been most affected by social demands. The content of integrated reports has been upgraded in reaction to the new corporate governance code and increasing social demand for disclosure of information on governance.
However, in terms of content, there is still much room for improvement. For example, only 3% of companies are including messages from the chairman of the board, who is ultimately responsible for corporate governance. Meanwhile, only 13% mention the reasons for choosing their current form of governance, such as the Kansayaku (company auditors) board system.
An integrated report is expected to communicate how the corporate governance structure supports the company’s ability to create value over the short, medium and long-term. While relating the governance structure to the value creation process and strategic resource allocation, companies need to make communication about it easier for the reader to understand. It is hoped that the content of integrated reports will be improved as Japanese corporate governance evolves from mere form to true substance.
MaterialityIt is not necessary that a large volume of information be included in an integrated report for it to be more useful to the reader, but it is important that priorities be stated based on their materiality of their impact on the value creation, and that material matters be concisely disclosed. This prioritization process is called the materiality assessment process. The International Integrated Reporting Framework* requires disclosure of the assessment process used to determine materiality.
KPMG suggests that the implementation of a materiality assessment is important not only to improve the integrated report, but also as a prerequisite for effective decision-making and business management. In today’s complex internal and external business environment, the impact that not only financial but also non-financial factors, including ESG matters, have on management is significant. Therefore, the importance that a wide range of matters, including non-financial factors, have for the company ought to be discussed, since it is necessary that managers and persons charged with governance agree on their business priorities.
However, the survey reveals that only 23% of companies disclosed materiality assessment results and that the discussion and practice of materiality are still in the development stage.
Executive Summary
44%
Companies that have sections about the value creation process:
13%
Companies including a message from the chairman of the board:
Companies explaining the reason for choosing their form of governance:
05 Executive Summary
23%
3%
Companies that disclosed materiality assessment results:
・・・・・・・・・・・・・・・・・・・・・・・・・・・・・・・・・・・・・・・・・・・・・・・・・・・・・・・・・・・・・・・・・・・・・・・・・・・・・・・・・・・・・・・・・・・・・・・・・・・・・・
・・・・・・・・・・・・・・・・・・・・・・・・・・・・・・・・・・・・・・・・・・・・・・・・・・・・・・・・・・・・・・・・・・・・・・・・・・・・・・・・・・・・・・・・・・・・・・・・・・・・・・・・・・・・・・・・・・・・・・・・・・・・・・・・・・・・・・・・・・・
Value creation p.07 >
Governance p.11 >
Materiality p.16 >
*International Integrated Reporting Framework: Announced by the International Integrated Reporting Council in 2013 http://integratedreporting.org/resource/international-ir-framework/
© 2017 KPMG AZSA LLC, a limited liability audit corporation incorporated under the Japanese Certified Public Accountants Law and a member firm of the KPMG network of independent member firms affiliated with KPMG International Cooperative (“KPMG International”), a Swiss entity. All rights reserved.

53% 71% 29% 85%
24%
3%
Executive Summary
Risks and OpportunitiesInformation on risks and opportunities is an important factor enabling readers to judge whether companies are able to create long-term value, including managing their key business risks, in today’s complex, rapidly changing age.
In past years, about half of all companies disclosed risk information in a separate section of their integrated reports. Most companies used a considerable number of pages to explain risk information, but the content they provided was often ’boiler-plate’, over-generalized, or a style that was difficult for readers to understand. However, in the process of conducting this survey, KPMG found that companies are now trying to explain the subject of risk in more specific terms, for instance by providing supplementary explanations based on the results of sensitivity analysis.
With the critical importance of capitals other than financial capital (e.g. intellectual and human) to value creation, the next challenge for companies is, first, to explain how their management assesses social issues and rapid change in a more multifaceted way than older approaches, which focused on risk and compliance that only impact the financials, and second, to convert risks into opportunities that have a positive impact on business.
PerformanceTo communicate the achievement of strategic goals and future outlook in a comprehensive manner, companies must effectively connect and provide quantitative as well as qualitative information. It is hoped that key performance indicators (KPI) that companies use for business management purposes can be shown via the integrated report.
The survey revealed that 71% of KPIs disclosed were finance-related, far exceeding the 29% total for non-financial KPIs, such as human and intellectual. At Japanese companies, it was found that traditional financial KPIs, such as sales, profit and capital efficiency, are more strongly emphasized.
However, nowadays, with the emphasis on non-financial capital inputs, outputs, and outcomes in the long-term sustainable value creation process, reader interest in the integrated report has become less focused on financial KPIs. In the years ahead, KPMG forecasts that forward-thinking business leaders will emphasize a broader group of KPIs than only financial KPIs, and that their disclosure in integrated reports will change.
Strategic focus and connectivityThis survey sought to examine the interconnectivity of the various pieces of information given in integrated reports. A survey item on connectivity was added to verify whether a holistic picture of value creation was being communicated in an interconnected and accessible manner.
Specifically, the “strategy” and the “management plan” are considered important drivers of long-term value creation in a company. The survey investigated whether the strategy or management plan were disclosed and whether the strategy, business plan and each item (business model/capital, governance, risks and opportunities, and performance) had been explained in relation to each to other. The survey found that the percentage of companies that disclosed their strategy or business plan was 85%, and that many companies explained the path to value creation. However, it was found that each item had not been explained in relation to the strategy or management plan. This was particularly the case in the governance section.
This indicates that “integrated thinking,” a model of decision-making that considers the relationship of various factors and capitals, has not yet taken root. As more integrated thinking is practiced within a company, connectivity will be more naturally reported in the integrated report.
Companies that disclosed risk information in a separate section:
Percentage of disclosed KPIs that were:
Non-financialFinancial
Governance system
Business model
Disclosure of strategy or management plan:
Explanation of relationship to strategy or management plan:
06
・・・・・・・・・・・・・・・・・・・・・・・・・・・・・・・・・・・・・・・・・・・・・・・・・・・・・・・・・・・・・・・・・・・・・・・・・・・・・・・・・・・・・・・・・・・・・・・・・・・・・・
・・・・・・・・・・・・・・・・・・・・・・・・・・・・・・・・・・・・・・・・・・・・・・・・・・・・・・・・・・・・・・・・・・・・・・・・・・・・・・・・・・・・・・・・・・・・・・・・・・・・・・Risks and Opportunities p.19 > Performance p.23 > Strategic focus and connectivity p.27 >© 2017 KPMG AZSA LLC, a limited liability audit corporation incorporated under the Japanese Certified Public Accountants Law and a member firm of the KPMG network of independent member firms affiliated with KPMG International Cooperative (“KPMG International”), a Swiss entity. All rights reserved.

44%
56%
An integrated report is a communication tool for conveying a
sustainable value creation story from a long-term perspective.
To create value based on the capital and strength of a company,
it is important that companies present business models and
their outputs and outcomes in order to convince others of their
sustainable growth potential.
Last year’s survey studied the relationship between capitals
and the business model as a first step to understanding the
overall picture of value creation. This year, to more fully explore
the connectivity to the value creation story, this survey has
examined the relationship between strategy and capital, and
strategy and business model.
(Refer to the section “Strategic focus and connectivity” on page 27)
Value CreationThe integrated report as a tool to communicate
the value creation story
Section on the value creation process
Value creation
Value creation is the most important theme in corporate activities, and one of the chief objectives of an integrated report is to accurately communicate that. The important question is how to communicate the mechanism that creates financial and social value in manner that is easy to understand. To create a clear explanation, the company must first carefully consider the characteristics of value that it wishes to create and have a comprehensive understanding of that process.
Survey results revealed the intention and tendency of issuers to communicate in an accessible manner by focusing on describing the value creation process. The reason that over 40% of companies explicitly include a description of the value creation process in the table of contents is likely a sign of such an awareness.
To communicate the value creation story in a readily understandable way, the relevance of capitals, the source of value creation, and the business model, the mechanism, must be explained comprehensively. In addition to a long-term vision, insight into changes in the external environment with reference to the timeframe of the company’s business, and an explanation of the impact those changes have on capitals used for the conduct of business, should be effective in making a compelling case for sustainable growth potential. Further, the credibility of that explanation increases by concretely showing the past results of strategy execution and its relevance to the current strategy and future prospects.
Explaining the mechanism of value creation and gaining the reader’s understanding of the potential for sustainable growth are major and constant challenges for companies, which are social entities. Using the integrated report to foster recurring dialog with a wide range of stakeholders, including investors, about value creation, and sharing and utilizing their feedback within the company should not only help improve the quality of the integrated report as a tool, but lead to social contributions through the acquisition of financial value on the back of increased competitiveness and efficient capital utilization.
Yes
No
n=279 companies
Nearly half of the surveyed companies established sections for explaining the value creation process in their integrated report and placed an emphasis on telling their value creation story.
123 companies
156 companies
“
”
KPMG’s Recommendation
To communicate the value creation story, explain the capitals and business model in an accessible and comprehensive way.
07 Value Creation
© 2017 KPMG AZSA LLC, a limited liability audit corporation incorporated under the Japanese Certified Public Accountants Law and a member firm of the KPMG network of independent member firms affiliated with KPMG International Cooperative (“KPMG International”), a Swiss entity. All rights reserved.
Mentioned
Companies that disclosed capitals
Mentioned social and relationship capital and natural capital
20162015
n=205companies
n=279companies Approach to
capitals
Generic term for capitals 48%52%
6%
58% 36%
39%
28%
Social and relationship capital
Natural capital
Mentioned
74%
45%
Follow the terms for capitals of the IIRCOwn classification
Input and output
Other
Input only
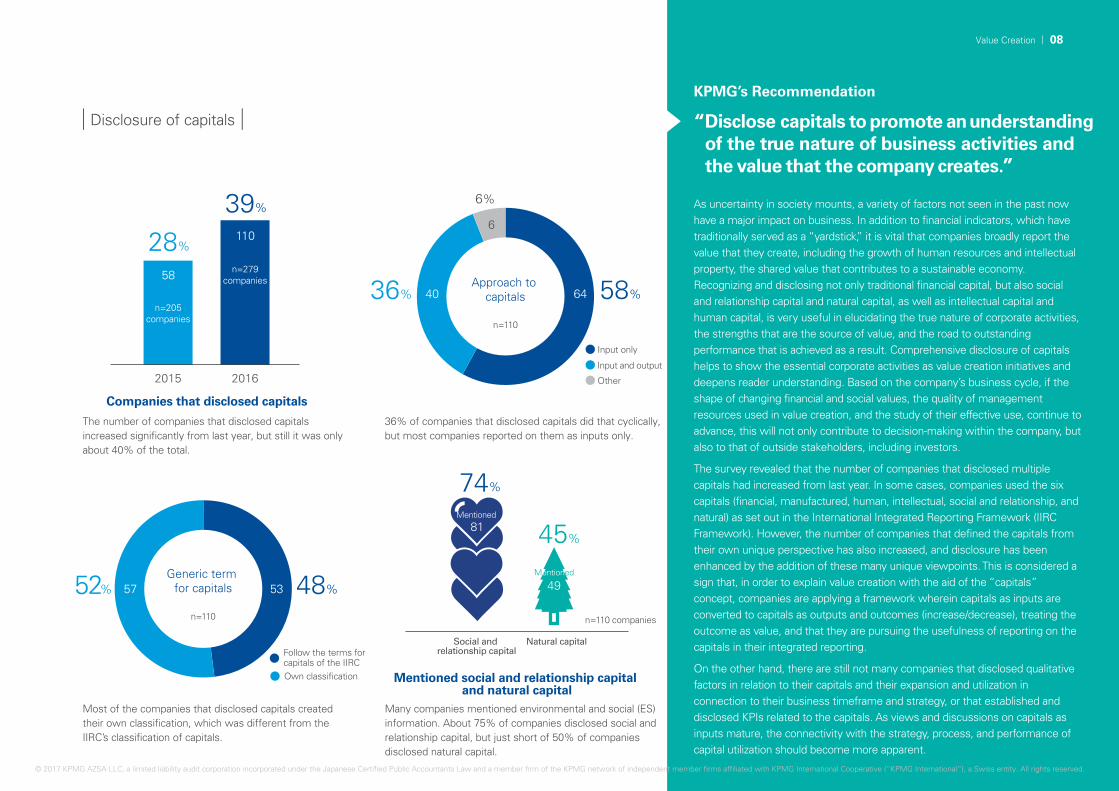
Disclosure of capitals Disclose capitals to promote an understanding of the true nature of business activities and the value that the company creates.
As uncertainty in society mounts, a variety of factors not seen in the past now have a major impact on business. In addition to financial indicators, which have traditionally served as a “yardstick,” it is vital that companies broadly report the value that they create, including the growth of human resources and intellectual property, the shared value that contributes to a sustainable economy. Recognizing and disclosing not only traditional financial capital, but also social and relationship capital and natural capital, as well as intellectual capital and human capital, is very useful in elucidating the true nature of corporate activities, the strengths that are the source of value, and the road to outstanding performance that is achieved as a result. Comprehensive disclosure of capitals helps to show the essential corporate activities as value creation initiatives and deepens reader understanding. Based on the company’s business cycle, if the shape of changing financial and social values, the quality of management resources used in value creation, and the study of their effective use, continue to advance, this will not only contribute to decision-making within the company, but also to that of outside stakeholders, including investors.
The survey revealed that the number of companies that disclosed multiple capitals had increased from last year. In some cases, companies used the six capitals (financial, manufactured, human, intellectual, social and relationship, and natural) as set out in the International Integrated Reporting Framework (IIRC Framework). However, the number of companies that defined the capitals from their own unique perspective has also increased, and disclosure has been enhanced by the addition of these many unique viewpoints. This is considered a sign that, in order to explain value creation with the aid of the “capitals” concept, companies are applying a framework wherein capitals as inputs are converted to capitals as outputs and outcomes (increase/decrease), treating the outcome as value, and that they are pursuing the usefulness of reporting on the capitals in their integrated reporting.
On the other hand, there are still not many companies that disclosed qualitative factors in relation to their capitals and their expansion and utilization in connection to their business timeframe and strategy, or that established and disclosed KPIs related to the capitals. As views and discussions on capitals as inputs mature, the connectivity with the strategy, process, and performance of capital utilization should become more apparent.
The number of companies that disclosed capitals increased significantly from last year, but still it was only about 40% of the total.
36% of companies that disclosed capitals did that cyclically, but most companies reported on them as inputs only.
Most of the companies that disclosed capitals created their own classification, which was different from the IIRC’s classification of capitals.
Many companies mentioned environmental and social (ES) information. About 75% of companies disclosed social and relationship capital, but just short of 50% of companies disclosed natural capital.
n=110
n=110 n=110 companies
53
6440
58
110
81
4957
6
“
”
KPMG’s Recommendation
08Value Creation
© 2017 KPMG AZSA LLC, a limited liability audit corporation incorporated under the Japanese Certified Public Accountants Law and a member firm of the KPMG network of independent member firms affiliated with KPMG International Cooperative (“KPMG International”), a Swiss entity. All rights reserved.

36%
43%
21%21%
39%
40%
48%52%
Business models and the capitals
Companies that disclosed differentiation
factors within their business models
Companies that disclosed their business model
Disclosure of business model
Attempts to use diagrams as a way to logically explain the value creation process were seen. Diagrams that comprehensively show the business model, which is the core of the value creation story, the capitals, which are used in the story, and a variety of external factors that affect them, are also helpful not only to promote an understanding of the value creation process, but also to present a holistic picture of what is explained in the integrated report.
The survey results revealed that many companies want to communicate their value creation mechanism in an accessible manner. More than half of the companies clearly stated that their business model is a mechanism for value creation that utilizes key capitals and clearly demonstrates differentiation factors (key capitals or activities) that assure long-term competitive advantage.
What is called for now is the disclosure of business models that persuasively shows the company’s ability to maintain sustainable value creation while retaining a competitive advantage employing its diverse capitals in a future environment of great uncertainty. Presentation enhancement is effective for gaining the support of a wide range of stakeholders who influence the company’s value creation, especially investors who have a medium- to long-term perspective.
Disclosed
Not disclosed
Sufficiently explained
Somewhat explained
Insufficiently explained
Sufficiently explained
Somewhat explained
Insufficiently explained
Nearly half of the companies disclosed their business model, and most of them presented it using diagrams.
60% of the companies that disclosed their business model explained its relationship to the capitals.
About 80% of companies that disclosed their business model clearly showed the differentiation factors that reflect their competitive advantage in their business model.
144
54
52
58
48
2929
135
n=279
n=135 n=135
“
”
KPMG’s Recommendation
Disclose the business model as an effective way to communicate competitive advantage and the capacity to capitalize on it.
09 Value Creation
© 2017 KPMG AZSA LLC, a limited liability audit corporation incorporated under the Japanese Certified Public Accountants Law and a member firm of the KPMG network of independent member firms affiliated with KPMG International Cooperative (“KPMG International”), a Swiss entity. All rights reserved.
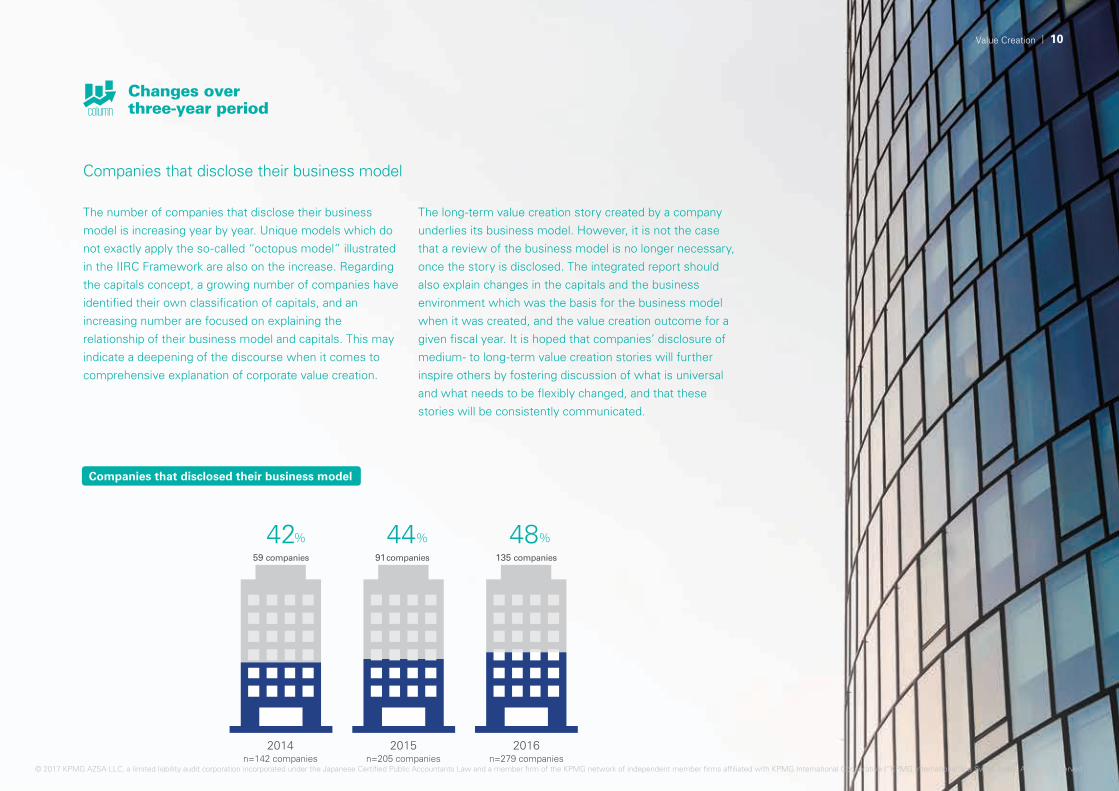
The number of companies that disclose their business
model is increasing year by year. Unique models which do
not exactly apply the so-called “octopus model” illustrated
in the IIRC Framework are also on the increase. Regarding
the capitals concept, a growing number of companies have
identified their own classification of capitals, and an
increasing number are focused on explaining the
relationship of their business model and capitals. This may
indicate a deepening of the discourse when it comes to
comprehensive explanation of corporate value creation.
Companies that disclose their business model
column
59 companies 135 companies91companies
Companies that disclosed their business model
42% 44% 48%
The long-term value creation story created by a company
underlies its business model. However, it is not the case
that a review of the business model is no longer necessary,
once the story is disclosed. The integrated report should
also explain changes in the capitals and the business
environment which was the basis for the business model
when it was created, and the value creation outcome for a
given fiscal year. It is hoped that companies’ disclosure of
medium- to long-term value creation stories will further
inspire others by fostering discussion of what is universal
and what needs to be flexibly changed, and that these
stories will be consistently communicated.
2014n=142 companies
2015n=205 companies
2016n=279 companies
Changes over three-year period
10Value Creation
© 2017 KPMG AZSA LLC, a limited liability audit corporation incorporated under the Japanese Certified Public Accountants Law and a member firm of the KPMG network of independent member firms affiliated with KPMG International Cooperative (“KPMG International”), a Swiss entity. All rights reserved.

Company with Kansayaku board
(93 companies)
Company with audit and supervisory committee
(29 companies)
Company with Kansayaku board - hybrid
(119 companies)
Company with three committees (29 companies)
With Japan’s Corporate Governance Code introduced in 2015,
initiatives to strengthen corporate governance appear to be
progressing, according to the information obtained from this
year’s integrated reports. However, it has been pointed out by
shareholders and investors that, since information on
governance is scattered across several media, it is not easy to
access information that aids decision-making, and that
therefore it is difficult to gain a full understanding of
governance effectiveness.
The integrated report is a disclosure medium capable of
communicating corporate governance in a non-rule-bound
manner, while relating it to the medium- and long-term value
creation process and strategic resource allocation.
For this survey, KPMG conducted research under the
assumption that integrated reports with the above-mentioned
capability are being effectively used to provide information on
governance effectiveness and an awareness of future
challenges. Moreover, KPMG selected survey items under the
assumption that the strengthening of governance due to the
application of the Corporate Governance Code is beginning to
be reflected in disclosures.
Note: In this section, among 279 issuing companies, 271 were surveyed, excluding six that do not disclose governance information and two auditing firms that do not apply the corporate governance code.
GovernanceUtilizing the integrated report to tell a comprehensive story
about governance initiatives aimed at raising medium- to long-term
corporate value
Overview/Governance Approach/
Governance Design Policy Description
Number of pages in the corporate governance section Average number of pages by form of governanceOver half of the companies devoted five pages or more to governance, with the average being six pages.
Just as last year, companies with three committees and hybrid-type companies with Kansayaku (company auditors) board tended to have more pages.
Explained the reason for choosing their form of governance
Only 3% (9 companies) had a separate message from the chairman of the board in the governance section.
In many cases, companies with three committees and companies with Kansayaku (company auditors) board - hybrid explained the reason for their choice.
Contained a message from the chairman
3%
97%
Contained
Not contained
n=271 companies
n=270*
Average
6.0pages
n=270companiesThe following is excluded from the 271 companies
・ HTML version only: 1 company
n=271 companies
8.3 pages
6.9 pages
5.3 pages
4.3 pages
Company with Kansayaku board
19%
36%24%
21%
Explained35
7
Company with Kansayaku board - hybrid10
Company with audit and supervisory committee6
Company with three committees12
Not explained
236
13%
87%
*The following is excluded from the 271 companies
・ HTML version only: 1 company
3 to 4 pages1 to 2 pages
5 to 9 pages10 pages or more
262companies
9 companies
11 Governance
© 2017 KPMG AZSA LLC, a limited liability audit corporation incorporated under the Japanese Certified Public Accountants Law and a member firm of the KPMG network of independent member firms affiliated with KPMG International Cooperative (“KPMG International”), a Swiss entity. All rights reserved.
Explained approach to the independence of external directors
6%
94%
Explained
Not explained
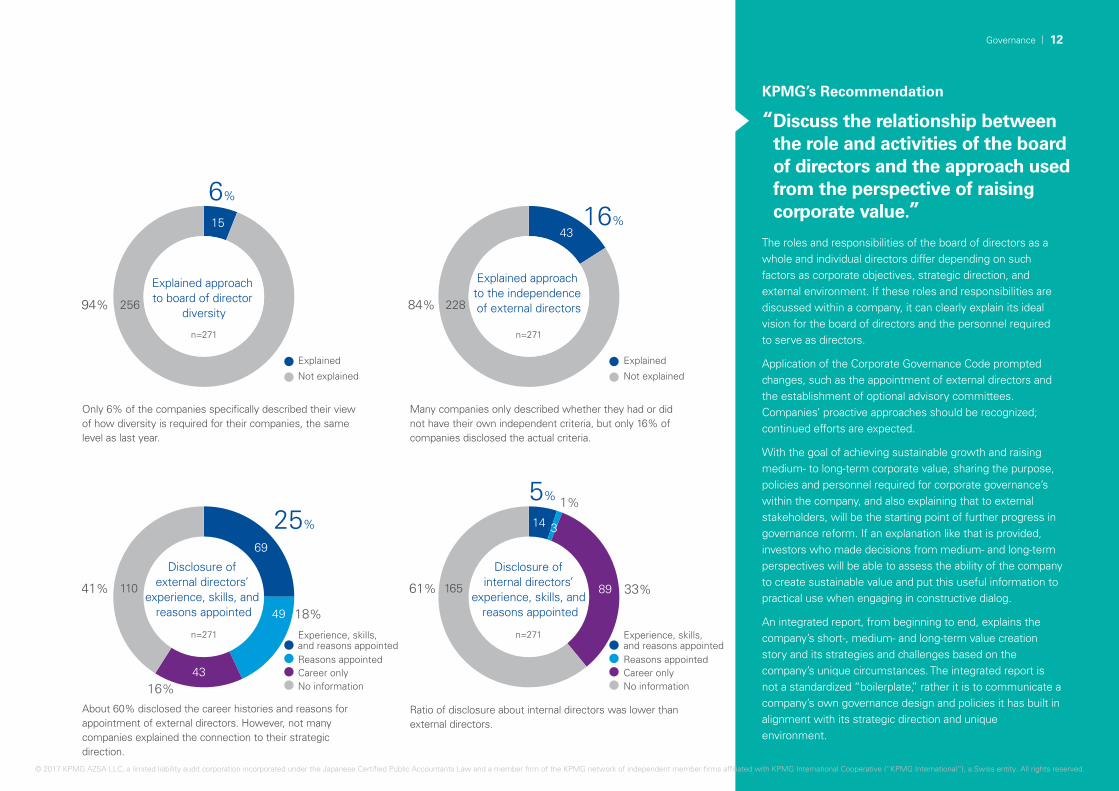
The roles and responsibilities of the board of directors as a whole and individual directors differ depending on such factors as corporate objectives, strategic direction, and external environment. If these roles and responsibilities are discussed within a company, it can clearly explain its ideal vision for the board of directors and the personnel required to serve as directors.
Application of the Corporate Governance Code prompted changes, such as the appointment of external directors and the establishment of optional advisory committees. Companies’ proactive approaches should be recognized; continued efforts are expected.
With the goal of achieving sustainable growth and raising medium- to long-term corporate value, sharing the purpose, policies and personnel required for corporate governance’s within the company, and also explaining that to external stakeholders, will be the starting point of further progress in governance reform. If an explanation like that is provided, investors who made decisions from medium- and long-term perspectives will be able to assess the ability of the company to create sustainable value and put this useful information to practical use when engaging in constructive dialog.
An integrated report, from beginning to end, explains the company’s short-, medium- and long-term value creation story and its strategies and challenges based on the company’s unique circumstances. The integrated report is not a standardized “boilerplate,” rather it is to communicate a company’s own governance design and policies it has built in alignment with its strategic direction and unique environment.
About 60% disclosed the career histories and reasons for appointment of external directors. However, not many companies explained the connection to their strategic direction.
Ratio of disclosure about internal directors was lower than external directors.
Disclosure of external directors’
experience, skills, and reasons appointed
25%
18%
16%
41%
Disclosure of internal directors’
experience, skills, and reasons appointed
61%
Only 6% of the companies specifically described their view of how diversity is required for their companies, the same level as last year.
Many companies only described whether they had or did not have their own independent criteria, but only 16% of companies disclosed the actual criteria.
Explained approach to board of director
diversity
16%
84%
5% 1%
33%
Career onlyNo information
Reasons appointed
Experience, skills, and reasons appointed
Experience, skills, and reasons appointed
Career onlyNo information
Reasons appointed
256 228
1543
110 165
69
14 3
89
49
43
n=271
Explained
Not explained
n=271
n=271 n=271
“
”
KPMG’s Recommendation
Discuss the relationship between the role and activities of the board of directors and the approach used from the perspective of raising corporate value.
12Governance
© 2017 KPMG AZSA LLC, a limited liability audit corporation incorporated under the Japanese Certified Public Accountants Law and a member firm of the KPMG network of independent member firms affiliated with KPMG International Cooperative (“KPMG International”), a Swiss entity. All rights reserved.

Board evaluation
About one-third disclosed whether or not they conducted a board evaluation, indicating that the practice is becoming more common.
Of the 90 companies that stated that a board evaluation was conducted, 49, or more than half, also explained the evaluation process.
33%
67%
Disclosed
Not disclosed
Disclosed
Not disclosed
Disclosed
Not disclosed
Disclosed
Not disclosed
Disclosed
Not disclosed
Disclosure of board evaluation is conducted
n=271
18%
82%
Disclosure of board evaluation process
Few companies disclosed concrete agendas or examples of board decisions, so it is difficult to know the content of board’s discussions from their reports.
Disclosure of the board of directors’
agenda
5%
95%
54 companies, five more than the number of companies that disclosed the evaluation process, disclosed issues identified as a result.
Of the 54 companies that disclosed issues identified as results, 26, or about half, disclosed polices for dealing with those issues.
Disclosure of results of evaluation
20%
80%Disclosure of policies dealing with results
from evaluation
10%
90%
External directors only
Disclosed concerning all directors
No information
The percentage of companies that disclosed the status of external directors only, and not of all directors, is increasing.
Disclosure of board of directors’ attendance
6%
29%65%
181
90
222
49
258
13
217
54
245 178
16
77
26
n=271
n=271 n=271
n=271
n=271
13 Governance
© 2017 KPMG AZSA LLC, a limited liability audit corporation incorporated under the Japanese Certified Public Accountants Law and a member firm of the KPMG network of independent member firms affiliated with KPMG International Cooperative (“KPMG International”), a Swiss entity. All rights reserved.
55%
In the integrated report, in addition to governance design concepts and polices that are company-specific, it is vital to communicate how day-to-day governance is practiced according to the company’s vision and strategic direction, and how the defined roles and responsibilities are being fulfilled. It is also effective to communicate the role of governance in the management cycle which is to identify challenges against a vision and strategic objectives of the company and to aim for continuous improvement.
For example, in many cases, directors’ attendance to board meetings is disclosed as supplementary information that explains whether directors are fulfilling their expected roles. However, maintaining an attendance rate above a certain level is a minimum requirement and may not be compelling information itself. Information that provides insights on what was discussed at the board, what kind of policy was decided through what process, and the rationale behind decisions made would help further understand governance’s effectiveness.
As for remuneration, simply disclosing the amount of compensation without explaining the system for how incentives are given or how they are evaluated in terms of growth in medium- and long-term corporate value, does not provide truly useful information.
It is hoped that more information will be disclosed which helps readers understand that the company is practicing effective governance which supports its medium- and long-term value creation, and that the company has introduced a monitoring function that promotes continuous improvement.
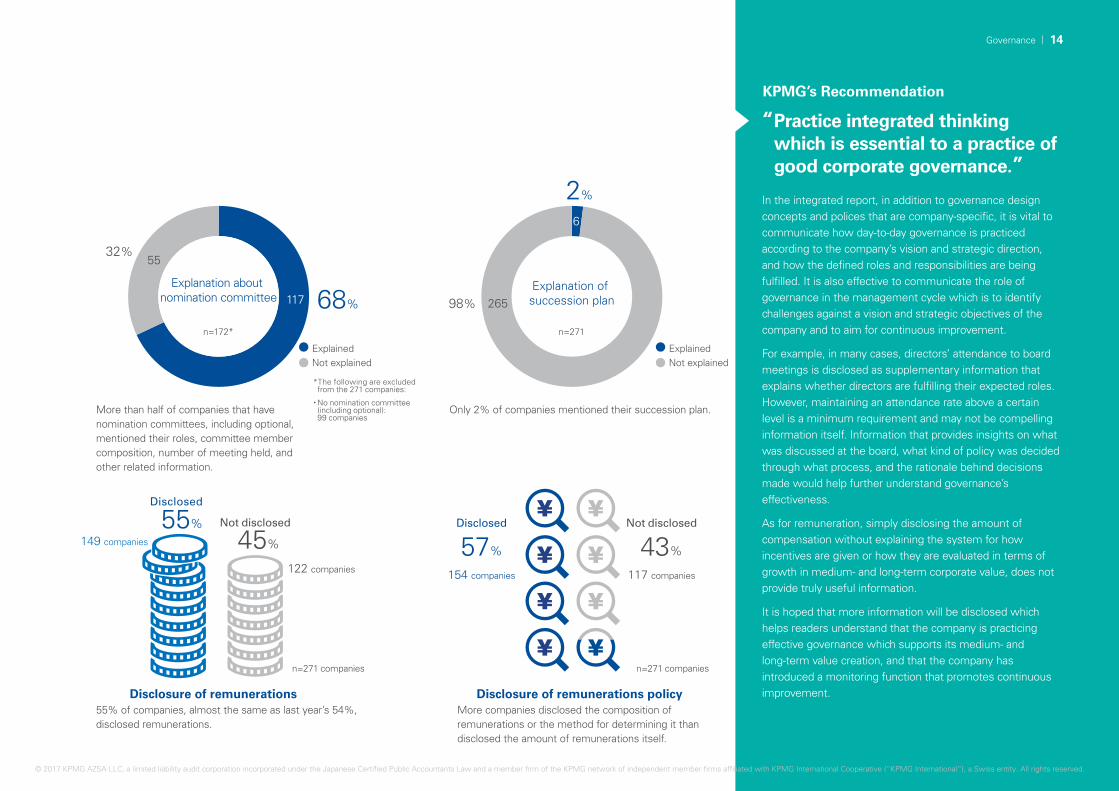
More than half of companies that have nomination committees, including optional, mentioned their roles, committee member composition, number of meeting held, and other related information.
Explanation about nomination committee 68%
32%
ExplainedNot explained
ExplainedNot explained
*The following are excluded from the 271 companies:
・No nomination committee (including optional): 99 companies
Only 2% of companies mentioned their succession plan.
Explanation of succession plan
2%
98%
55% of companies, almost the same as last year’s 54%, disclosed remunerations.
Disclosure of remunerations
Not disclosed
More companies disclosed the composition of remunerations or the method for determining it than disclosed the amount of remunerations itself.
Disclosure of remunerations policy
57% 43%
Disclosed Not disclosed
Disclosed
55
265
149 companies
122 companies 154 companies 117 companies
117
6
n=271
n=271 companiesn=271 companies
n=172*
45%
“
”
KPMG’s Recommendation
Practice integrated thinking which is essential to a practice of good corporate governance.
14Governance
© 2017 KPMG AZSA LLC, a limited liability audit corporation incorporated under the Japanese Certified Public Accountants Law and a member firm of the KPMG network of independent member firms affiliated with KPMG International Cooperative (“KPMG International”), a Swiss entity. All rights reserved.
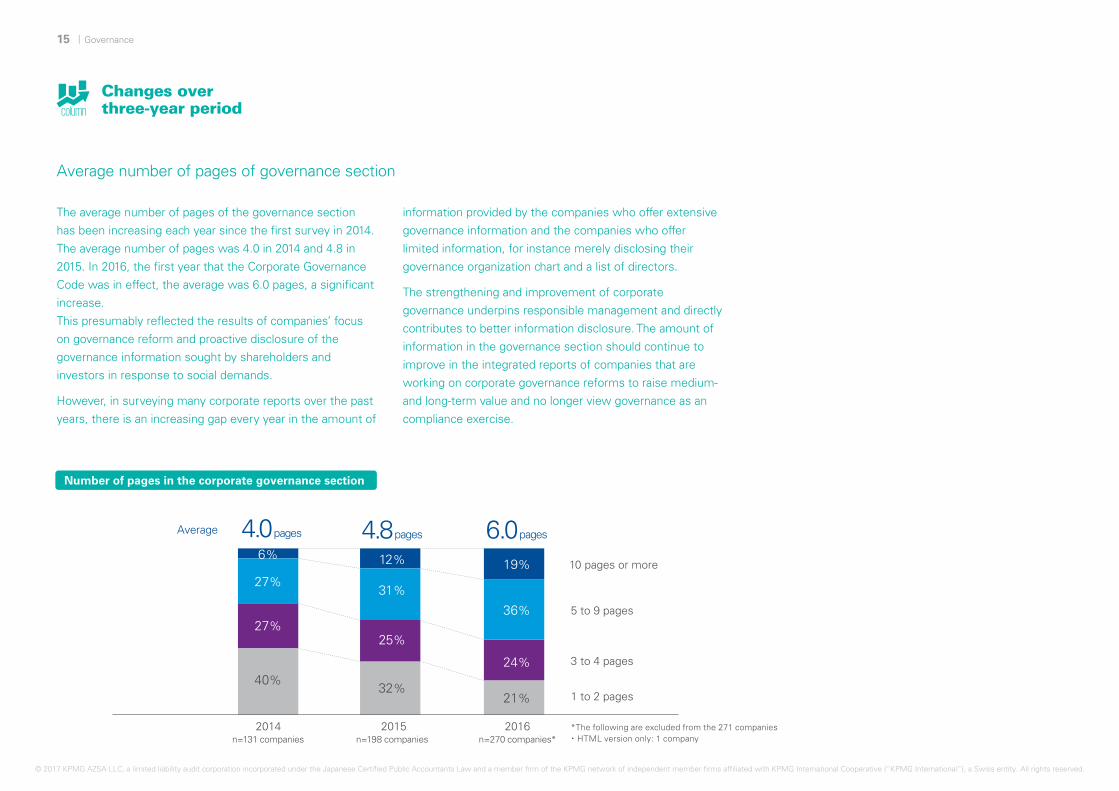
The average number of pages of the governance section
has been increasing each year since the first survey in 2014.
The average number of pages was 4.0 in 2014 and 4.8 in
2015. In 2016, the first year that the Corporate Governance
Code was in effect, the average was 6.0 pages, a significant
increase.
This presumably reflected the results of companies’ focus
on governance reform and proactive disclosure of the
governance information sought by shareholders and
investors in response to social demands.
However, in surveying many corporate reports over the past
years, there is an increasing gap every year in the amount of
Average number of pages of governance section
Number of pages in the corporate governance section
information provided by the companies who offer extensive
governance information and the companies who offer
limited information, for instance merely disclosing their
governance organization chart and a list of directors.
The strengthening and improvement of corporate
governance underpins responsible management and directly
contributes to better information disclosure. The amount of
information in the governance section should continue to
improve in the integrated reports of companies that are
working on corporate governance reforms to raise medium-
and long-term value and no longer view governance as an
compliance exercise.
1 to 2 pages
3 to 4 pages
5 to 9 pages
10 pages or more
2014 2015 2016
32%
25%
31%
12%
4.8 pages
40%
27%
27%
6%
4.0 pages
21%
24%
36%
19%
6.0 pages
*The following are excluded from the 271 companies・ HTML version only: 1 company
Average
column
Changes over three-year period
n=131 companies n=198 companies n=270 companies*
15 Governance
© 2017 KPMG AZSA LLC, a limited liability audit corporation incorporated under the Japanese Certified Public Accountants Law and a member firm of the KPMG network of independent member firms affiliated with KPMG International Cooperative (“KPMG International”), a Swiss entity. All rights reserved.
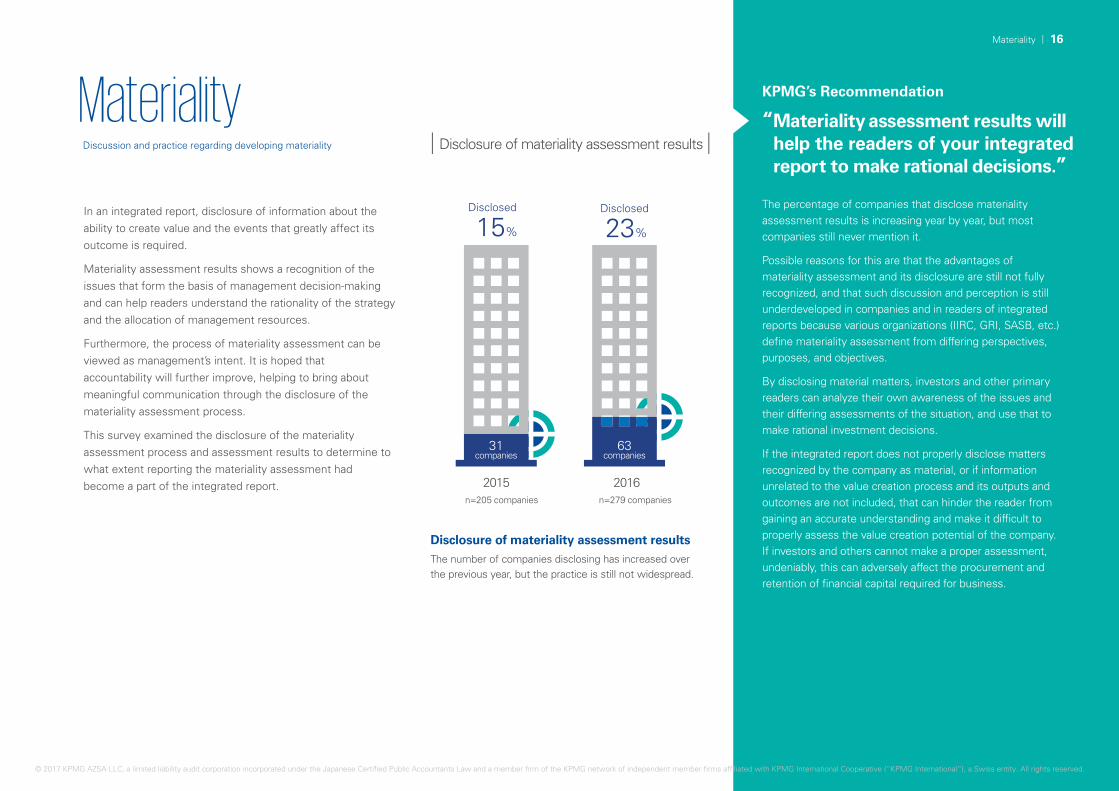
In an integrated report, disclosure of information about the ability to create value and the events that greatly affect its outcome is required.
Materiality assessment results shows a recognition of the issues that form the basis of management decision-making and can help readers understand the rationality of the strategy and the allocation of management resources.
Furthermore, the process of materiality assessment can be viewed as management’s intent. It is hoped that accountability will further improve, helping to bring about meaningful communication through the disclosure of the materiality assessment process.
This survey examined the disclosure of the materiality assessment process and assessment results to determine to what extent reporting the materiality assessment had become a part of the integrated report.
MaterialityDiscussion and practice regarding developing materiality Disclosure of materiality assessment results
The percentage of companies that disclose materiality assessment results is increasing year by year, but most companies still never mention it.
Possible reasons for this are that the advantages of materiality assessment and its disclosure are still not fully recognized, and that such discussion and perception is still underdeveloped in companies and in readers of integrated reports because various organizations (IIRC, GRI, SASB, etc.) define materiality assessment from differing perspectives, purposes, and objectives.
By disclosing material matters, investors and other primary readers can analyze their own awareness of the issues and their differing assessments of the situation, and use that to make rational investment decisions.
If the integrated report does not properly disclose matters recognized by the company as material, or if information unrelated to the value creation process and its outputs and outcomes are not included, that can hinder the reader from gaining an accurate understanding and make it difficult to properly assess the value creation potential of the company. If investors and others cannot make a proper assessment, undeniably, this can adversely affect the procurement and retention of financial capital required for business.
Disclosure of materiality assessment resultsThe number of companies disclosing has increased over the previous year, but the practice is still not widespread.
2015 2016
15% 23%
Disclosed Disclosed
31companies
n=205 companies n=279 companies
63companies
“
”
KPMG’s Recommendation
Materiality assessment results will help the readers of your integrated report to make rational decisions.
16Materiality
© 2017 KPMG AZSA LLC, a limited liability audit corporation incorporated under the Japanese Certified Public Accountants Law and a member firm of the KPMG network of independent member firms affiliated with KPMG International Cooperative (“KPMG International”), a Swiss entity. All rights reserved.

Disclosure of materiality assessment targets and purposes
81% of companies assessed CSR items only, in the same manner as a sustainability report
Only a few companies conducted materiality assessment with the purpose of selecting report disclosure targets.
Materiality assessment targets
19% 3%
8%6%
81% CSR items only
Holistic picture of value creation
Selection of report disclosure and activity targets
Selection of report disclosure targets
Purpose of materiality assessment
Unknown
The survey found that most companies that disclose materiality assessment results assess only CSR items and do not include wider matters that affect the company’s ability to create value.
Presumably, this is one of the reasons that current integrated reports are developed based on the annual report and CSR (sustainability) report. In the CSR report, companies disclose initiatives that fulfill their social responsibilities to various stakeholders. Historically, the material assessment of those initiatives, and their disclosure, has been conducted based on GRI guidelines.
For companies to sustainably achieve value creation over the medium to long term, it is essential that they have the consent and cooperation of all key stakeholders, and they certainly must conduct a materiality assessment of CSR items. However, if they leave it only at that, they will not have assessed all matters that influence their ability to create value, and it will be difficult to achieve the goal of accurately communicating to readers how the company creates value.
KPMG believes that the materiality assessment should not only target CSR items, but all events related to the ability to create value.
Selection of activity targets
51
12
522
45
83%
n=63
n=63 companies
“
”
KPMG’s Recommendation
Make not only CSR items, but wider matters related to the ability to create value, subject to materiality assessment.
17 Materiality
© 2017 KPMG AZSA LLC, a limited liability audit corporation incorporated under the Japanese Certified Public Accountants Law and a member firm of the KPMG network of independent member firms affiliated with KPMG International Cooperative (“KPMG International”), a Swiss entity. All rights reserved.

Many companies that disclosed materiality assessment results also disclosed their decision process, but there was a difference in the extent of that disclosure. Many companies did not specifically disclose who (which department) did what and how, but just like last year, only a few companies mentioned the involvement of those charged with governance. There remains significant room for improvement in terms of explaining the process for determining materiality.
In management decision-making, it is essential to accurately ascertain the matters that influence the company’s ability to create value and the outcome of value creation and its timeline. As a result, the optimal allocation of resources for implementing the strategy will be achieved. In business decision-making, events that have a major impact will be closely examined and assessed. Conducting a comprehensive materiality assessment along a timeline that conforms to the business cycle and incorporating it in the process of formulating the long-term strategy and medium-term management plan, will foster rapid decision-making and integrated thinking, and lead to more effective utilization of limited management resources.
Materiality is company-specific, and it is therefore determined by the company itself. KPMG believes that materiality assessment should be incorporated into management process and performed by those charged with governance.
Disclosure of the assessment process will lead to greater understanding and transparency of the disclosed materiality.
Disclosure of materiality assessment process
Among companies that disclosed the materiality assessment process, many explained in detail using diagrams and other means.
Disclosure of the materiality
assessment process 75%
25%
Disclosed
Not disclosed
Disclosed
Not disclosed
Only 10% of companies clearly stated the involvement of those charged with governance, such as the board of directors, in materiality assessment.
Disclosure of involvement of
those charged with governance
10%
90%
16
5747
6
n=63 n=63
KPMG’s Recommendation
Foster greater understanding and transparency of your materiality assessment through disclosure of the assessment process.
“
”
KPMG’s Recommendation
Foster greater understanding and transparency of your materiality assessment through disclosure of the assessment process.
18Materiality
© 2017 KPMG AZSA LLC, a limited liability audit corporation incorporated under the Japanese Certified Public Accountants Law and a member firm of the KPMG network of independent member firms affiliated with KPMG International Cooperative (“KPMG International”), a Swiss entity. All rights reserved.
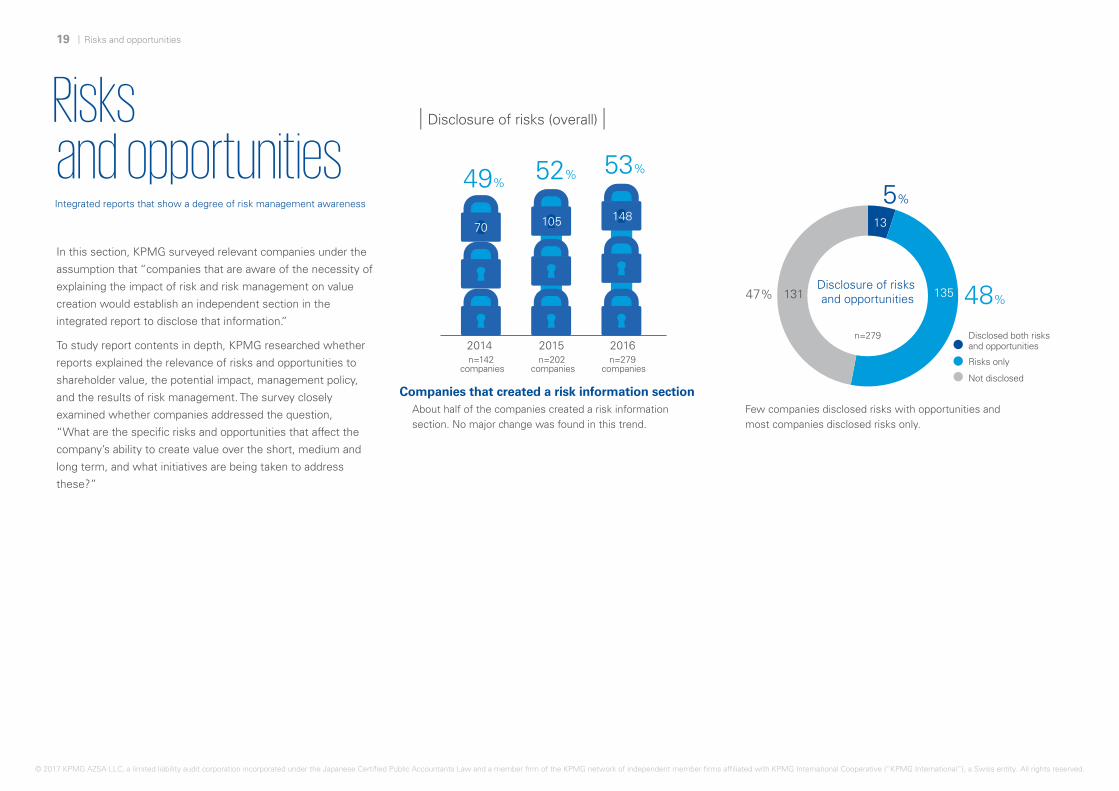
49%52% 53%
70 105 1485%
48%
2014 2015 2016
In this section, KPMG surveyed relevant companies under the
assumption that “companies that are aware of the necessity of
explaining the impact of risk and risk management on value
creation would establish an independent section in the
integrated report to disclose that information.”
To study report contents in depth, KPMG researched whether
reports explained the relevance of risks and opportunities to
shareholder value, the potential impact, management policy,
and the results of risk management. The survey closely
examined whether companies addressed the question,
“What are the specific risks and opportunities that affect the
company’s ability to create value over the short, medium and
long term, and what initiatives are being taken to address
these?”
Risks and opportunitiesIntegrated reports that show a degree of risk management awareness
Disclosure of risks (overall)
Disclosure of risks and opportunities47%
Risks only
Not disclosed
Disclosed both risks and opportunities
Companies that created a risk information sectionAbout half of the companies created a risk information section. No major change was found in this trend.
Few companies disclosed risks with opportunities and most companies disclosed risks only.
135
13
131
n=279 companies
n=279
n=202 companies
n=142 companies
19 MaterialityRisks and opportunities
© 2017 KPMG AZSA LLC, a limited liability audit corporation incorporated under the Japanese Certified Public Accountants Law and a member firm of the KPMG network of independent member firms affiliated with KPMG International Cooperative (“KPMG International”), a Swiss entity. All rights reserved.

Disclosure of risks (details)
The survey revealed that an increasing number of companies are trying to explain risks in a more concrete and easy-to-understand manner, such as mentioning sensitivity analysis. Also noted was the approach of seeking to communicate proactively to readers about how those risks are managed.
However, few companies (less than 10%) mentioned the relevance of risk to strategy or opportunities together. Assuming that investors are the report’s primary readers, it is necessary to enable them to understand not only operational risks, but also the risks of executing the strategy that could have a significant impact on value creation. At the same time, it is vital to mention projected risks related to the growth strategy and management resource allocation.
KPMG believes that explaining risks associated with the selection of a given strategy increases the trustworthiness of companies and fosters the establishment and maintenance of good trusting relationships.
Risks and opportunities are two sides of the same coin. For instance, when it comes to non-financial capital such as human rights and the environment (social and relationship, and natural capital), companies are apt to emphasize only the aspect of risk management that they believe risks damage to corporate value and therefore should be avoided. However, when viewed as an “opportunity” to solve social problems, it is also important to consider aspects that can lead to activities to increase corporate value. The importance of non-financial capital in value creation is growing, and the longer the timeline, the greater the impact the company’s management approach to risks and opportunities will have on results, and the more outside interest will increase.
To maintain accountability, it is expected to disclose the more sophisticated risk and opportunity information.
Even companies that disclosed potential impact did not explain it with all risks.
Disclosure of risk management information is necessary to assess risk responsiveness, but only about 30% disclosed it.
Identification of potential impact of
risks
18%
Explanation of risk management policy and its achievement
32%
70% of companies analyzed company-specific situations and disclosed specific risks
70% of companies disclosed risks in relation to shareholder value.
Disclosure of risks specific to the organization 70%
Disclosed
Not disclosed
Explanation of relevance to
shareholder value 70%
Explained
Not explained
Explained
Not explained
Explained
Not explained
103
27
47
104
30%45
82% 121 68% 101
30%44
n=148 n=148
n=148 n=148
“
”
Relate risk recognition to opportunities to ensure more transparent and reliable disclosure.
KPMG’s Recommendation
20Risks and opportunities
© 2017 KPMG AZSA LLC, a limited liability audit corporation incorporated under the Japanese Certified Public Accountants Law and a member firm of the KPMG network of independent member firms affiliated with KPMG International Cooperative (“KPMG International”), a Swiss entity. All rights reserved.
Mention of cyber security
42% of companies (63 out of 148 companies) listed cyber security as a
risk.
According to the business reporting survey conducted by KPMG in
2016, many companies have disclosed their responses to cyber
security risks and IT problems, mainly in the United States, Germany
and France.
Cyber security threats appear to be getting worse due to the
increasing number of threats from groups with technical expertise that
are clearly targeting specific organizations and the diversification of
attack methods. In the decision-making bodies of companies, such as
the board of directors, there is much discussion about the shared
awareness of this crisis and countermeasures for such attacks.
Once a company becomes the target of cyber-attacks, the risk of a
significant impact on corporate value is immediately apparent.
Naturally, concerns and interests about the measures companies are
taking against cyber security threats have been increasing.
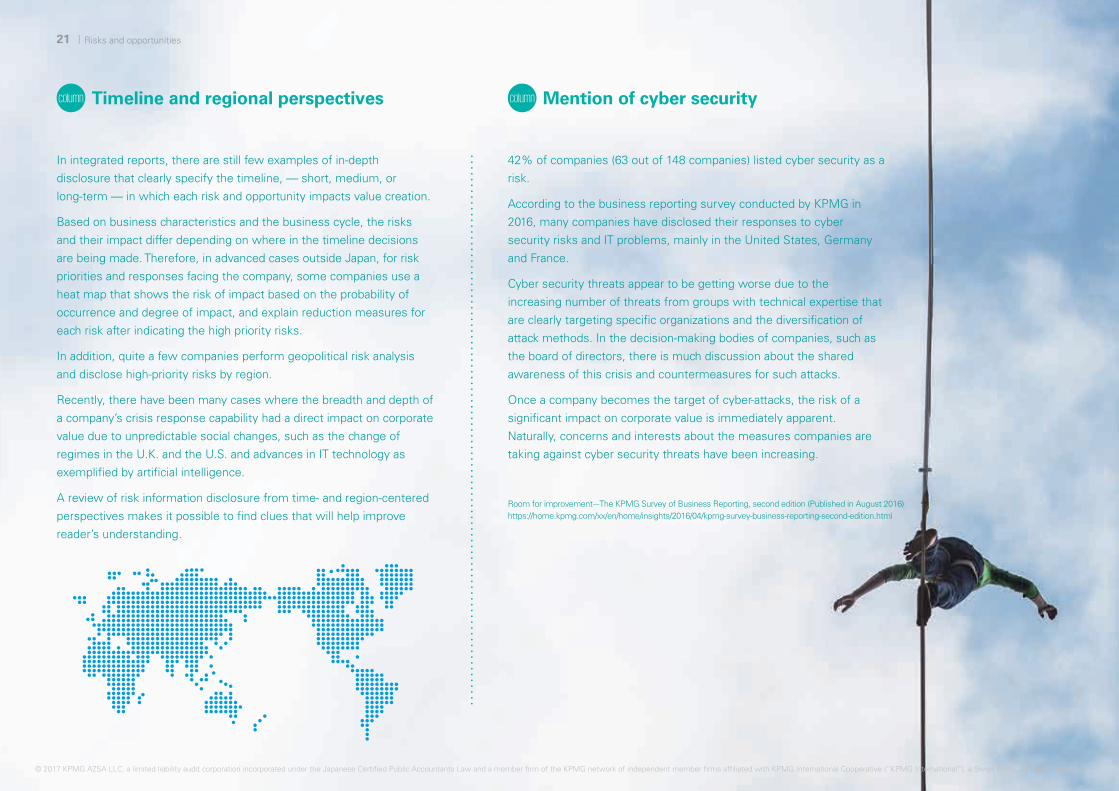
Timeline and regional perspectives
In integrated reports, there are still few examples of in-depth
disclosure that clearly specify the timeline, — short, medium, or
long-term — in which each risk and opportunity impacts value creation.
Based on business characteristics and the business cycle, the risks
and their impact differ depending on where in the timeline decisions
are being made. Therefore, in advanced cases outside Japan, for risk
priorities and responses facing the company, some companies use a
heat map that shows the risk of impact based on the probability of
occurrence and degree of impact, and explain reduction measures for
each risk after indicating the high priority risks.
In addition, quite a few companies perform geopolitical risk analysis
and disclose high-priority risks by region.
Recently, there have been many cases where the breadth and depth of
a company’s crisis response capability had a direct impact on corporate
value due to unpredictable social changes, such as the change of
regimes in the U.K. and the U.S. and advances in IT technology as
exemplified by artificial intelligence.
A review of risk information disclosure from time- and region-centered
perspectives makes it possible to find clues that will help improve
reader’s understanding.
Room for improvement—The KPMG Survey of Business Reporting, second edition (Published in August 2016)https://home.kpmg.com/xx/en/home/insights/2016/04/kpmg-survey-business-reporting-second-edition.html
21 Risks and opportunities
© 2017 KPMG AZSA LLC, a limited liability audit corporation incorporated under the Japanese Certified Public Accountants Law and a member firm of the KPMG network of independent member firms affiliated with KPMG International Cooperative (“KPMG International”), a Swiss entity. All rights reserved.
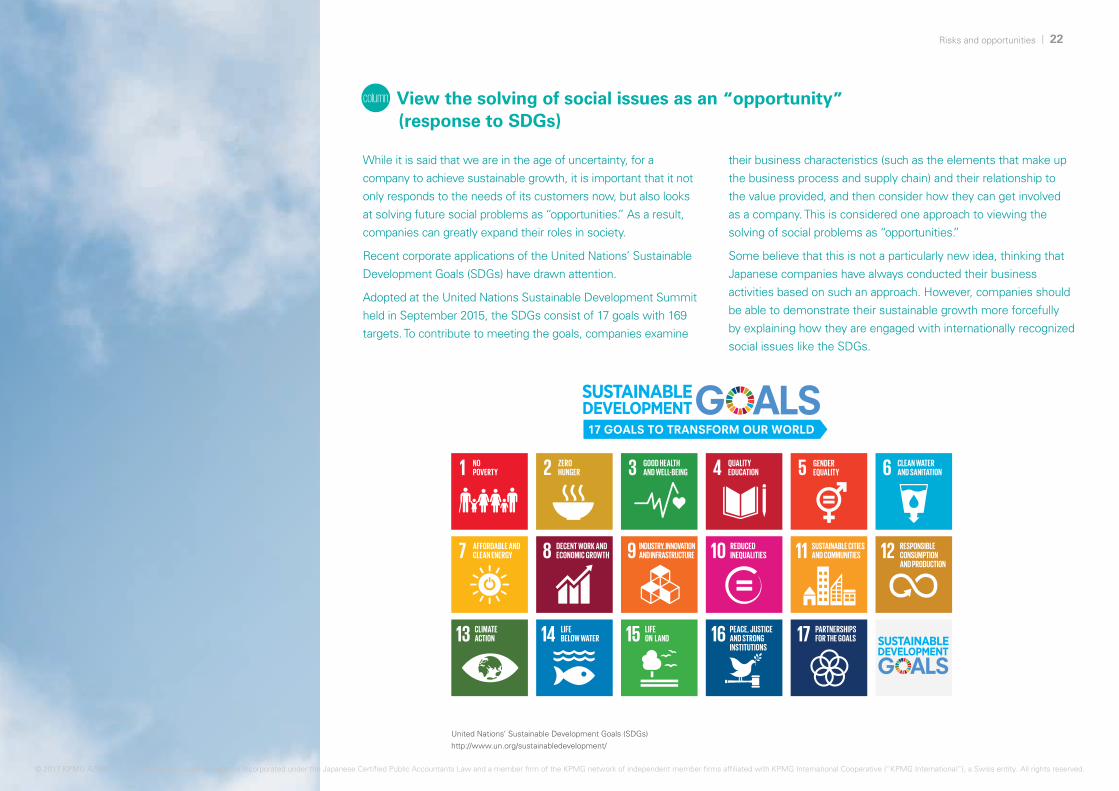
View the solving of social issues as an “opportunity” (response to SDGs)
While it is said that we are in the age of uncertainty, for a
company to achieve sustainable growth, it is important that it not
only responds to the needs of its customers now, but also looks
at solving future social problems as “opportunities.” As a result,
companies can greatly expand their roles in society.
Recent corporate applications of the United Nations’ Sustainable
Development Goals (SDGs) have drawn attention.
Adopted at the United Nations Sustainable Development Summit
held in September 2015, the SDGs consist of 17 goals with 169
targets. To contribute to meeting the goals, companies examine
United Nations’ Sustainable Development Goals (SDGs)http://www.un.org/sustainabledevelopment/
their business characteristics (such as the elements that make up
the business process and supply chain) and their relationship to
the value provided, and then consider how they can get involved
as a company. This is considered one approach to viewing the
solving of social problems as “opportunities.”
Some believe that this is not a particularly new idea, thinking that
Japanese companies have always conducted their business
activities based on such an approach. However, companies should
be able to demonstrate their sustainable growth more forcefully
by explaining how they are engaged with internationally recognized
social issues like the SDGs.
22Risks and opportunities
© 2017 KPMG AZSA LLC, a limited liability audit corporation incorporated under the Japanese Certified Public Accountants Law and a member firm of the KPMG network of independent member firms affiliated with KPMG International Cooperative (“KPMG International”), a Swiss entity. All rights reserved.
The integrated report should not only explain what strategic
goals the company set and what initiatives it will take to create
value. It must also present progress and information which
forms the basis for determining future development,
in a manner that is easy to understand.
It is possible to report more objective and concrete results by
offering quantitative descriptions, not only using sentences and
charts, but also using Key Performance Indicators (KPIs) for
measuring progress. Further, the potential for achieving the
company’s strategic goals and the validity of that effort can be
shown by disclosing KPI changes over time and by using KPIs
that are comparable with those of competitors.
In this survey, targeting the highlight information section where
KPIs are summarized, KPMG examined what kind of
quantitative information the company thought was significant
and how it was disclosed. Since the information on capitals,
especially those other than financial capital, is considered vital,
as a feature of the integrated report, KPMG conducted an
analysis from the standpoint of the six capitals (financial,
manufactured, intellectual, human, social and relationship,
and natural).
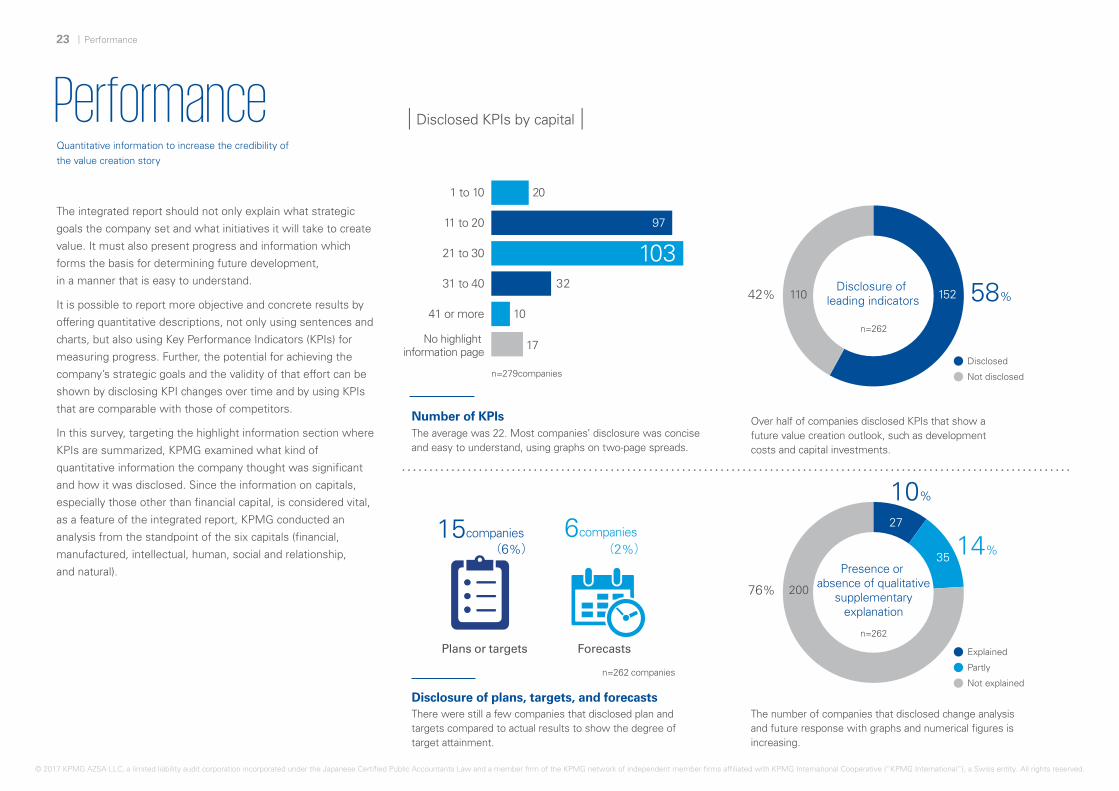
PerformanceQuantitative information to increase the credibility of
the value creation story
Disclosed KPIs by capital
Number of KPIsThe average was 22. Most companies’ disclosure was concise and easy to understand, using graphs on two-page spreads.
Disclosure of plans, targets, and forecastsThere were still a few companies that disclosed plan and targets compared to actual results to show the degree of target attainment.
The number of companies that disclosed change analysis and future response with graphs and numerical figures is increasing.
Over half of companies disclosed KPIs that show a future value creation outlook, such as development costs and capital investments.
Presence or absence of qualitative
supplementary explanation
15companies
76%
Disclosure of leading indicators 58%42%
Disclosed
Not disclosedn=279companies
1 to 10
No highlight information page
Plans or targets
6companies
Forecasts
31 to 40
41 or more
11 to 20
21 to 30
10%
14%
200
27
35
110 152
20
10
17
32
97
103
Explained
Partly
Not explained
n=262
n=262
n=262 companies
(6%) (2%)
23 Performance
© 2017 KPMG AZSA LLC, a limited liability audit corporation incorporated under the Japanese Certified Public Accountants Law and a member firm of the KPMG network of independent member firms affiliated with KPMG International Cooperative (“KPMG International”), a Swiss entity. All rights reserved.

Financial capital
Human capital
Natural capital
Manufactured capital
Intellectual capital
Social and relationship capital
Others 29%
Disclosed KPI by capital
Disclosure ratio of KPI by capitalThe disclosure ratio of KPIs measuring the five capitals other than financial capital to KPIs measuring financial capital is increasing year by year, indicating that companies’ awareness is changing.
Top three disclosed KPI by capitalCompanies are using a variety of KPIs to communicate their diverse capital.
Many companies disclosed by making a distinction between financial and non-financial capitals, showing that companies sought to emphasize non-financial information disclosure.
39%
Performance is a representation of the achievement of strategic targets. It is therefore necessary to disclose KPIs established as strategic targets and KPIs related to measures taken. When making disclosure, it is not only important to list KPIs, but also to explain in an accessible manner their relationship with the capitals that affect output and their relationship with the value creation process, including the reasons that the particular KPIs were selected.
Furthermore, if a company compares the actual results with target values and discloses them, and the target values are not achieved, the best approach to showing the achievement of the strategic goal more clearly is to give an analysis of why performance fell short and the steps that will be taken to improve.
Performance section along with quantitative information serves the function of providing information for determining financial success and business outlook to stakeholders. Some companies disclose only numerical data as short-term forecasts. However, with a view to creating value over the medium and long term, information that firmly points out the business growth and trends in the long term, and offers suggestions to aid stakeholders’ decision-making (leading indicators), is valuable (see column on p.26).
It is important to disclose not only financial, but also non-financial KPIs, in order to show the holistic picture of value creation. The survey found that, although the disclosure ratio has slightly declined, financial KPIs remain the central focus of disclosure. In addition to sales and operating income, a high percentage of indicators that are frequently used for making investment decisions, such as return on equity (ROE) and dividends per share, were disclosed.
On the other hand, there is still room for improvement in reporting both the quality and quantity of non-financial KPIs. The CEO messages or other sections of most reports clearly stated that “intangible capital,” such as human and intellectual capital, significantly affected the company’s value creation. There is also the major challenge of sustainable development, a challenge shared globally. The magnitude of companies’ responsibility for natural capital and social and relationship capital has been pointed out, and companies are expected to have accountability for their approach. The enhancement of non-financial KPI disclosure can convey the likelihood that a company will successfully create value. KPMG also believes that not only disclosure, but the monitoring of non-financial KPIs and the active use of that information, contributes to rapid decision-making and increased competitiveness.
6%
55%Capitals disclosed
101
145
16
Capital name is clearly stated
Only financial and non-financial categories No categories2014 2015
74% 73%
10 9
73
37
33
2 41 1
2016
71%
10
83
3
41
n=262companies
Financial capital
92%87% 83%
59%
25%
11%
39%
16% 15%
44%
4% 3%
40%
14%
5% 4% 3% 2%
Human capital
Natural capital
Intellectual capital
Manufactured capital
Social and relationship capital
Sales
Net inc
ome
Operat
ing in
com
e
Numbe
r of e
mplo
yees
Numbe
r of f
emale
man
agers
Numbe
r of f
emale
emplo
yees
Emiss
ions o
f CO2
Was
te
Energ
y con
sum
ption
Amou
nt of
capit
al inv
estm
ent
Numbe
r of p
roduc
tion b
ases
/
sales
offic
es
Numbe
r of c
ompa
nies
R&D expe
nses
Ratio o
f R&D ex
pens
es
Numbe
r of p
atents
Socia
l con
tributi
ons
Socia
l con
tributi
on ev
ents
Custom
er sa
tisfac
tion
n=134 n=199 n=262 companies
n=262
“
”
KPMG’s Recommendation
Select KPIs to convey your decision-making perspective and commitment to results and accountability.
24Performance
© 2017 KPMG AZSA LLC, a limited liability audit corporation incorporated under the Japanese Certified Public Accountants Law and a member firm of the KPMG network of independent member firms affiliated with KPMG International Cooperative (“KPMG International”), a Swiss entity. All rights reserved.
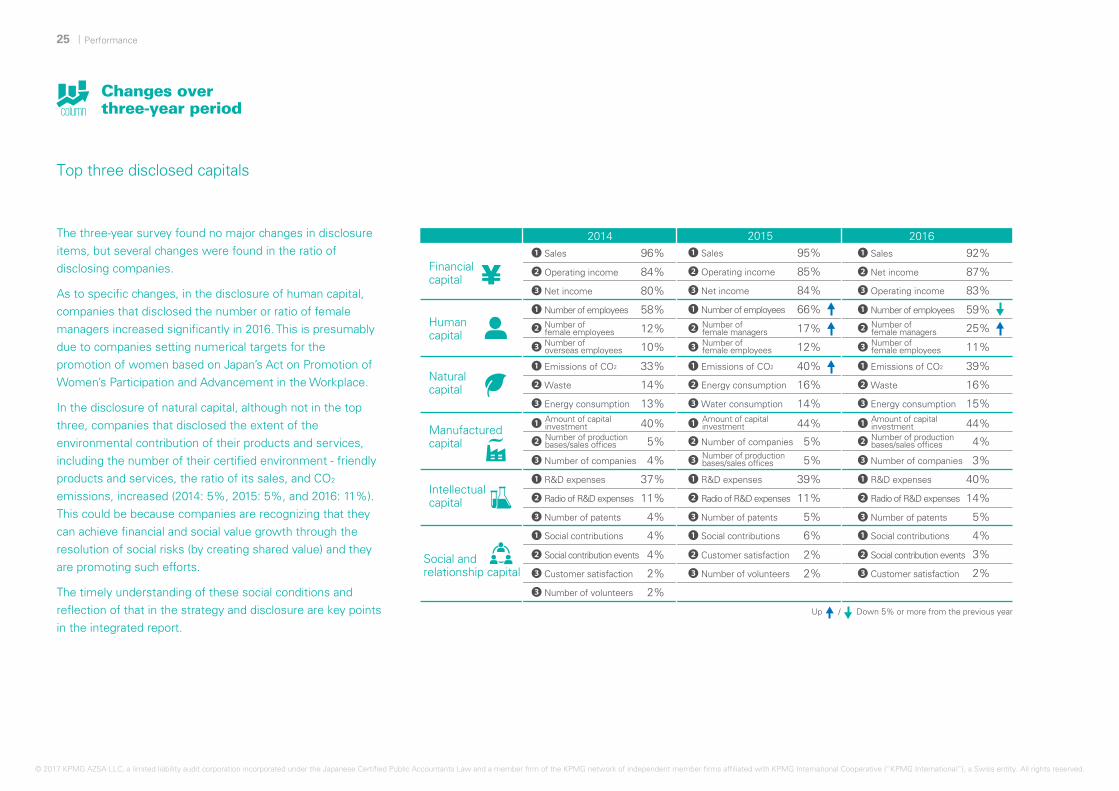
15%
The three-year survey found no major changes in disclosure items, but several changes were found in the ratio of disclosing companies.
As to specific changes, in the disclosure of human capital, companies that disclosed the number or ratio of female managers increased significantly in 2016. This is presumably due to companies setting numerical targets for the promotion of women based on Japan’s Act on Promotion of Women’s Participation and Advancement in the Workplace.
In the disclosure of natural capital, although not in the top three, companies that disclosed the extent of the environmental contribution of their products and services, including the number of their certified environment - friendly products and services, the ratio of its sales, and CO2 emissions, increased (2014: 5%, 2015: 5%, and 2016: 11%). This could be because companies are recognizing that they can achieve financial and social value growth through the resolution of social risks (by creating shared value) and they are promoting such efforts.
The timely understanding of these social conditions and reflection of that in the strategy and disclosure are key points in the integrated report.
Top three disclosed capitals
Manufactured capital
Natural capital
2014 2016
Financial capital
Human capital
44%
5%
5%
39%
11%
5%
6%
2%
2%
40%
16%
14%
201595%
85%
84%
66%
17%
❶
❸ ❷ Number of companies
❶ R&D expenses
❷ Radio of R&D expenses
❸ Number of patents
❶ Social contributions
❷ Customer satisfaction
❸ Number of volunteers
❶ Emissions of CO2
❷ Energy consumption
❸ Water consumption
❶ Sales
❷ Operating income
❸ Net income
❶ Number of employees
❸ ❷
12%
❶ 40%
❷ Number of production bases/sales offices
Amount of capital investment
Amount of capital investment
Amount of capital investment
Number of production bases/sales offices
Number of production bases/sales offices5%
❸ Number of companies 4%
❶ R&D expenses 37%
❷ Radio of R&D expenses 11%
❸ Number of patents 4%
❶ Social contributions 4%
❷ Social contribution events 4%
❸ Customer satisfaction 2%
❸ Number of volunteers
Up / Down 5% or more from the previous year
2%
❶ Emissions of CO2 33%
❷ Waste 14%
❸ Energy consumption 13%
❶ Sales 96%
❷ Operating income 84%
❸ Net income 80%
❶ Number of employees 58%
❷ 12%
❸ 10%
Social and relationship capital
44%
4%
4%
3%
40%
5%
14%
39%
16%
92%
83%
87%
59%
11%
25%
2%
❶ ❷ ❸ Number of companies
❶ R&D expenses
❷ Radio of R&D expenses
❸ Number of patents
❶ Social contributions
❷ Social contribution events
❸ Customer satisfaction
❶ Emissions of CO2
❷ Waste
❸ Energy consumption
❶ Sales
❸ Operating income
❷ Net income
❶ Number of employees
❸ Number of female employees
Number of female employees
❷
3%
Intellectual capital
Number of female employeesNumber of overseas employees
Number of female managers
Number of female managers
column
Changes over three-year period
25 Performance
© 2017 KPMG AZSA LLC, a limited liability audit corporation incorporated under the Japanese Certified Public Accountants Law and a member firm of the KPMG network of independent member firms affiliated with KPMG International Cooperative (“KPMG International”), a Swiss entity. All rights reserved.

Examples of leading indicatorscolumn
The following types of information (leading indicators) help to give a clear indication of the direction of business growth and long-term prospects and offer suggestions for stakeholders’ decision-making.
Disclosure after sufficient review of not only quantitative, but qualitative data, is desirable.
Indicators not based on accounting principles (Non-GAAP measures)column
In recent years, disclosure of non-GAAP measures* which are financial indicators not based on accounting principles, such as IFRS and US GAAP, is expanding in Europe and the United States.
While non-GAAP measures can provide more meaningful suggestions and supplementary information on the company’s financial situation, there are concerns that they may invite reader misunderstanding if opportunistically disclosed by the company.
From 2015 to 2016, policies and guidelines on non-GAAP measures were successively announced by securities monitoring authorities such as the SEC in the U.S. and the ESMA in the U.K. In those countries, companies are asked to consider transparency, consistency, and comparability. These policies and guidelines also said, specifically, it is important for companies to encourage correct reader understanding by disclosing information including the company’s purpose for disclosing those indicators, the basis for calculating the indicators, and comparisons with the past. In addition, the Center for Audit Quality (CAQ) in the U.S. provides some guidance on non-GAAP measures.
Companies that try to explain their ability to create value over the medium and long term not only disclose the above-mentioned non-GAAP measures, but also a wide range of indicators including non-financial information. In order to make sure that such information facilitates a correct understanding of the reader, it is worth looking at the basic approach shown by these non-GAAP measure guidelines and examining what information is making impacts to the reader’s decision-making.
Customers
• Customer satisfaction
• Customer retention rate (customer turnover rate, acquisition rate, number of visits, revisit rate, and customer loyalty membership system)
• Sales conversion rate (average sales per customer, upgrade rate, etc.)
Brand and market share
• Brand/market share
• Brand recognition (brand ranking and brand awareness)
Intellectual capital
• New product performance (revenue from products developed during last X years)
• Expertise (profile of key personnel and retention rate of specialized personnel)
• Development pipeline (fact analysis of each new product per development stage)
• Exposure to expiration of intellectual property patents (revenue from products for which patents expire within X years)
Operational efficiency
• Occupancy rate (personnel and asset utilization and production capacity limitations)
• Variance analysis (production yield, distribution variance and cost variance)
• Efficiency improvement efforts
Staff
• Retention of key staff
• Productivity and labor management relations (habitual absenteeism, average productivity, details about labor union or labor agreement, labor dispute rate)
• Specialized expertise (qualification level and experience)
Products
• New products (products released during previous year and new product performance)
• Product quality/safety (product defects, recall rate and quality management indicators)
• Product price/sales volume
Examples of leading indicators
Room for improvement—The KPMG Survey of Business Reporting, second edition (Published in August 2016)https://home.kpmg.com/xx/en/home/insights/2016/04/kpmg-survey-business-reporting-second-edition.html
SEC : Compliance and Disclosure Interpretations on Non-GAAP Financial Measures (Updated in May 2016)
https://www.sec.gov/divisions/corpfin/guidance/nongaapinterp.htm
ESMA: ESMA Guidelines on Alternative Performance Measures (Published in June 2015) https://www.esma.europa.eu/sites/default/files/library/2015/11/2015-esma-1057_ final_report_on_guidelines_on_alternative_performance_measures.pdf
CAQ : Questions on Non-GAAP Measures: A Tool for Audit Committees (Published in June 2016) http://www.thecaq.org/questions-non-gaap-measures-tool-audit-committees
・・・・・・・・・・・・・・・・・・・・・・・・・・・・・・・・・・・・・・・・・・・・・・・・・・・・・・・・・・・・・・・・・・・・・・・・・・・・・・・・・・・・・・・・・・・・・・・・・・・・・・・
3
2
1
6
5
4
*Examples of non-GAAP measures: EBITDA, adjusted earnings, etc.
26Performance
© 2017 KPMG AZSA LLC, a limited liability audit corporation incorporated under the Japanese Certified Public Accountants Law and a member firm of the KPMG network of independent member firms affiliated with KPMG International Cooperative (“KPMG International”), a Swiss entity. All rights reserved.
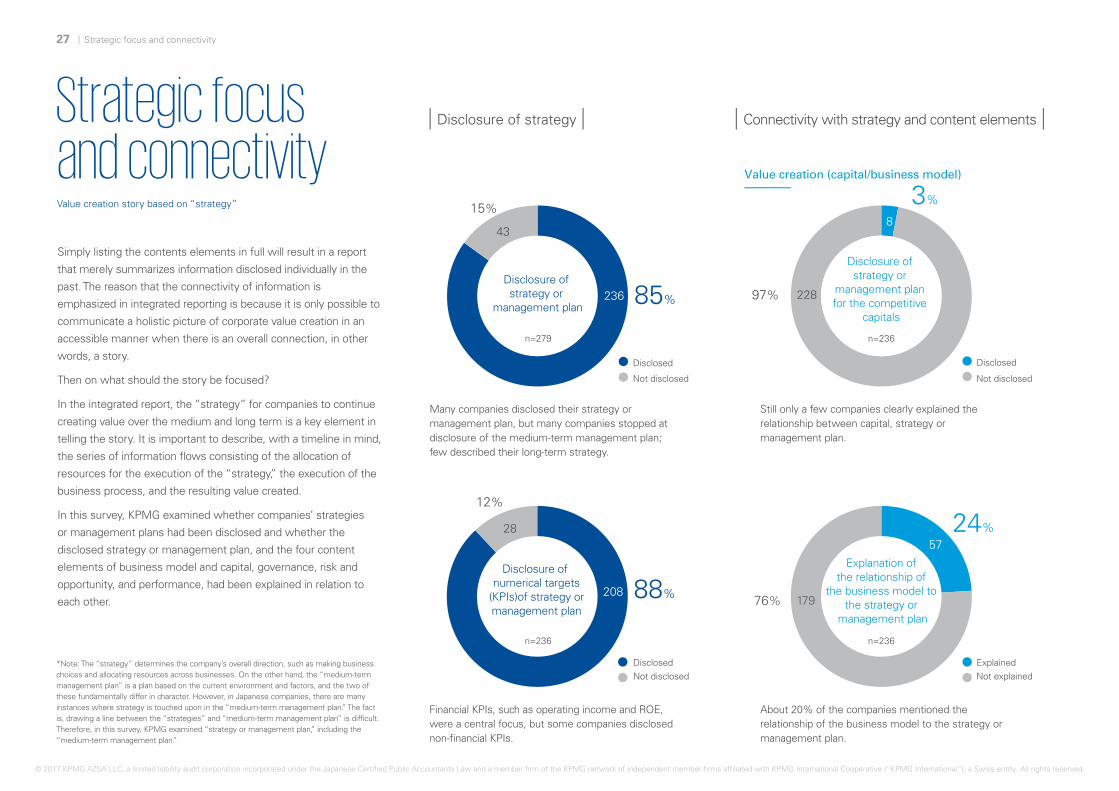
Disclosure of strategy or
management plan
Many companies disclosed their strategy or management plan, but many companies stopped at disclosure of the medium-term management plan; few described their long-term strategy.
85%
15%
Financial KPIs, such as operating income and ROE, were a central focus, but some companies disclosed non-financial KPIs.
88%
12%
Simply listing the contents elements in full will result in a report
that merely summarizes information disclosed individually in the
past. The reason that the connectivity of information is
emphasized in integrated reporting is because it is only possible to
communicate a holistic picture of corporate value creation in an
accessible manner when there is an overall connection, in other
words, a story.
Then on what should the story be focused?
In the integrated report, the “strategy” for companies to continue
creating value over the medium and long term is a key element in
telling the story. It is important to describe, with a timeline in mind,
the series of information flows consisting of the allocation of
resources for the execution of the “strategy,” the execution of the
business process, and the resulting value created.
In this survey, KPMG examined whether companies’ strategies
or management plans had been disclosed and whether the
disclosed strategy or management plan, and the four content
elements of business model and capital, governance, risk and
opportunity, and performance, had been explained in relation to
each other.
Strategic focus and connectivityValue creation story based on “strategy”
*Note: The “strategy” determines the company’s overall direction, such as making business choices and allocating resources across businesses. On the other hand, the “medium-term management plan” is a plan based on the current environment and factors, and the two of these fundamentally differ in character. However, in Japanese companies, there are many instances where strategy is touched upon in the “medium-term management plan.” The fact is, drawing a line between the “strategies” and “medium-term management plan” is difficult. Therefore, in this survey, KPMG examined “strategy or management plan,” including the “medium-term management plan.”
Disclosure of strategy Connectivity with strategy and content elements
Disclosed
Not disclosed Not disclosed
DisclosedNot disclosed
Disclosure of numerical targets
(KPIs)of strategy or management plan
Still only a few companies clearly explained the relationship between capital, strategy or management plan.
Value creation (capital/business model)
Disclosure of strategy or
management plan for the competitive
capitals
3%
97%
24%
76%
About 20% of the companies mentioned the relationship of the business model to the strategy or management plan.
Explanation of the relationship of
the business model to the strategy or
management plan
ExplainedNot explained
Disclosed
236
57
8
208
43
228
179
28
n=279 n=236
n=236n=236
27 Strategic focus and connectivity
© 2017 KPMG AZSA LLC, a limited liability audit corporation incorporated under the Japanese Certified Public Accountants Law and a member firm of the KPMG network of independent member firms affiliated with KPMG International Cooperative (“KPMG International”), a Swiss entity. All rights reserved.
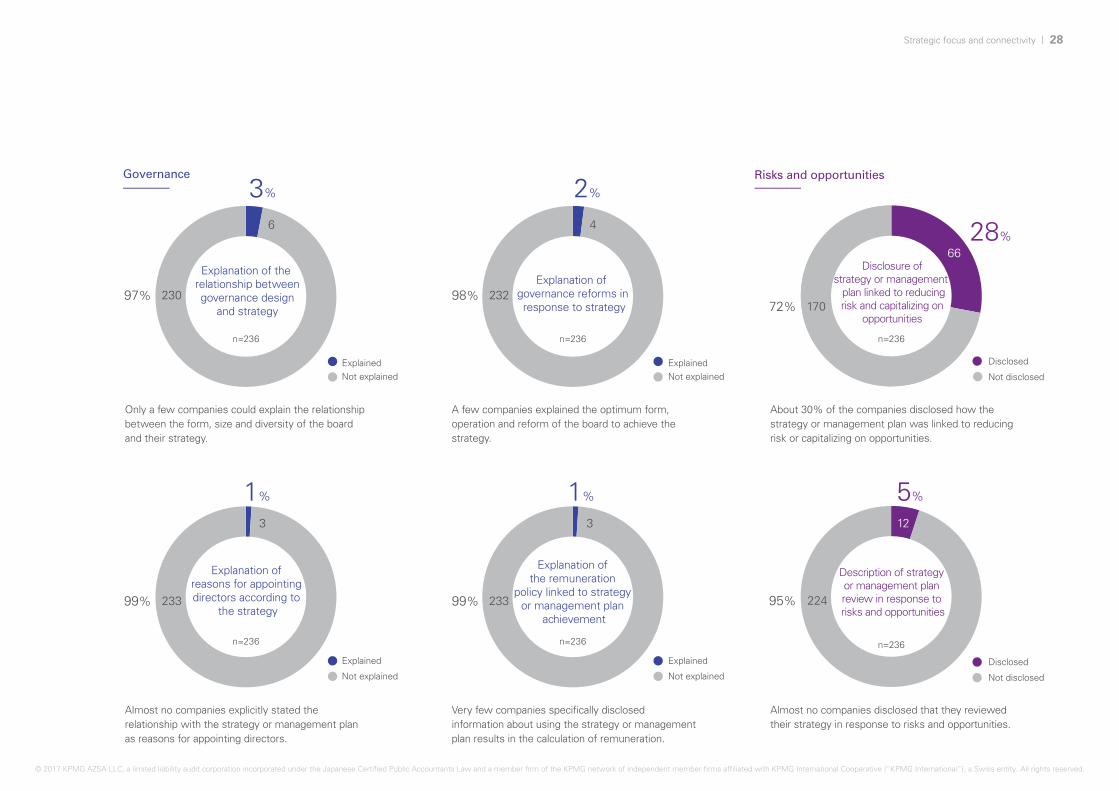
Governance
3% 2%
ExplainedNot explained
Explained
Not explained
ExplainedNot explained
Explained
Not explained
Only a few companies could explain the relationship between the form, size and diversity of the board and their strategy.
97%
Almost no companies explicitly stated the relationship with the strategy or management plan as reasons for appointing directors.
1%
99%
1%
99%
A few companies explained the optimum form, operation and reform of the board to achieve the strategy.
98%
Very few companies specifically disclosed information about using the strategy or management plan results in the calculation of remuneration.
Explanation of the relationship between governance design
and strategy
Explanation of governance reforms in response to strategy
Explanation of reasons for appointing directors according to
the strategy
Explanation of the remuneration
policy linked to strategy or management plan
achievement
Risks and opportunities
About 30% of the companies disclosed how the strategy or management plan was linked to reducing risk or capitalizing on opportunities.
Disclosure of strategy or management
plan linked to reducing risk and capitalizing on
opportunities
28%
72%
5%
95%
Almost no companies disclosed that they reviewed their strategy in response to risks and opportunities.
Description of strategy or management plan review in response to risks and opportunities
Disclosed
Not disclosed
Disclosed
Not disclosed
230 232
233
33
46
233
66
12
170
224
n=236
n=236
n=236
n=236
n=236
n=236
08価値創造 28Strategic focus and connectivity
© 2017 KPMG AZSA LLC, a limited liability audit corporation incorporated under the Japanese Certified Public Accountants Law and a member firm of the KPMG network of independent member firms affiliated with KPMG International Cooperative (“KPMG International”), a Swiss entity. All rights reserved.

24%
50%
18%
8%
49
Disclosure of target values (KPIs) of strategy
or management plan on highlight information
page
The survey revealed that there are still few integrated reports with high connectivity that clearly show the relevance and consistency of the strategy and other content elements. Regarding the description of the strategy which is the core focus of the integrated report, there were many cases where only an explanation of the medium-term management plan was provided. Readers want to understand the company from a medium- and long-term perspective, but without an explanation of the relationship to management’s policy, long-term vision, perceptions and views, they cannot grasp it, due to the insufficient contents confined to short-term tactics.
There are three key points when it comes to creating an integrated report with a value creation story that contributes to the reader’s decision-making.
First, it is important that a strategy for value improvement be explained from a medium- to long-term perspective. In the explanation, companies should consider the management resources required to achieve the targets and discuss this in view of the company’s materiality assessment, after analyzing the business environment in terms of a timeline that accords with the company’s business characteristics and business cycle, and then formulate their strategy as the result.
All KPIs disclosed
50% or more
Less than 50%
Not disclosed
Performance
Only 25% of the companies disclosed all the results for numerical targets under their strategy or management plan on the highlight information page.
By disclosing the strategy formulation process like this, the reliability of the information can be further enhanced.
Second, when considering each content element, companies should emphasize its relationship to the strategy. For example, they can offer risk descriptions derived from the point of view of impact on strategy execution and achievement, as well as explanations of the reasons for choosing the governance system and why it is seen as useful in strategy execution. Steps like these help make the value creation story easy to understand and make the argument more convincing.
Third, if companies try to accurately communicate the “state of the company” through information disclosure, it is crucial that they have established connectivity among the various organizations within the company. It is also essential to develop a cross-organizational process for formulating strategy, risk management for strategy execution, and a governance system for quick and accurate decision-making. This is not done just to improve the contents of the report, but is in itself a business reform that will lead to greater competitiveness as integrated thinking is increasingly adopted at the company.
KPMG believes that one of the outcomes of this kind of business reform will be demonstrated in their integrated reports and communicated to the outside world.
104
37
18
n=208
“”
KPMG’s Recommendation
Add depth to the integrated report by employing connectivity to tell the value creation story.
29 Strategic focus and connectivity
© 2017 KPMG AZSA LLC, a limited liability audit corporation incorporated under the Japanese Certified Public Accountants Law and a member firm of the KPMG network of independent member firms affiliated with KPMG International Cooperative (“KPMG International”), a Swiss entity. All rights reserved.
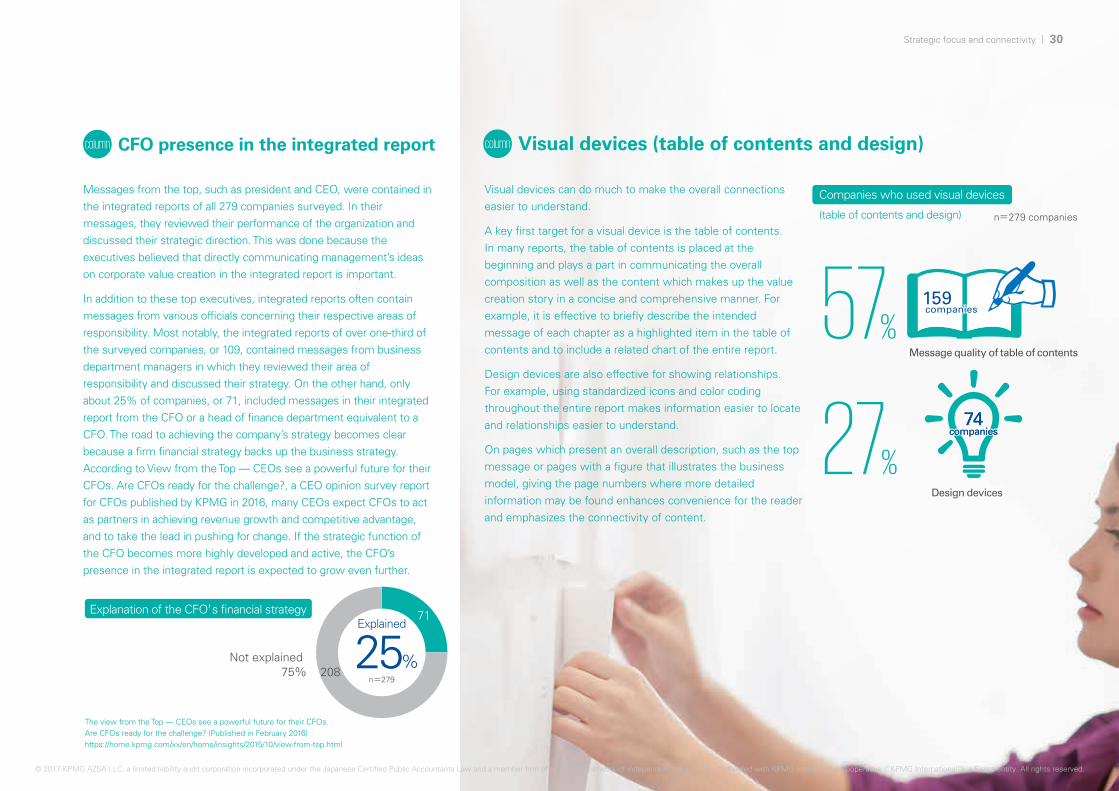
Explained
25%n=279
Not explained208
71
75%
Companies who used visual devices
(table of contents and design)
Visual devices can do much to make the overall connections easier to understand.
A key first target for a visual device is the table of contents. In many reports, the table of contents is placed at the beginning and plays a part in communicating the overall composition as well as the content which makes up the value creation story in a concise and comprehensive manner. For example, it is effective to briefly describe the intended message of each chapter as a highlighted item in the table of contents and to include a related chart of the entire report.
Design devices are also effective for showing relationships. For example, using standardized icons and color coding throughout the entire report makes information easier to locate and relationships easier to understand.
On pages which present an overall description, such as the top message or pages with a figure that illustrates the business model, giving the page numbers where more detailed information may be found enhances convenience for the reader and emphasizes the connectivity of content.
Visual devices (table of contents and design)column
Message quality of table of contents
159 companies159 companies
Design devices
57%
27%
Messages from the top, such as president and CEO, were contained in the integrated reports of all 279 companies surveyed. In their messages, they reviewed their performance of the organization and discussed their strategic direction. This was done because the executives believed that directly communicating management’s ideas on corporate value creation in the integrated report is important.
In addition to these top executives, integrated reports often contain messages from various officials concerning their respective areas of responsibility. Most notably, the integrated reports of over one-third of the surveyed companies, or 109, contained messages from business department managers in which they reviewed their area of responsibility and discussed their strategy. On the other hand, only about 25% of companies, or 71, included messages in their integrated report from the CFO or a head of finance department equivalent to a CFO. The road to achieving the company’s strategy becomes clear because a firm financial strategy backs up the business strategy. According to View from the Top — CEOs see a powerful future for their CFOs. Are CFOs ready for the challenge?, a CEO opinion survey report for CFOs published by KPMG in 2016, many CEOs expect CFOs to act as partners in achieving revenue growth and competitive advantage, and to take the lead in pushing for change. If the strategic function of the CFO becomes more highly developed and active, the CFO’s presence in the integrated report is expected to grow even further.
The view from the Top — CEOs see a powerful future for their CFOs. Are CFOs ready for the challenge? (Published in February 2016)https://home.kpmg.com/xx/en/home/insights/2015/10/view-from-top.html
n=279 companies
CFO presence in the integrated reportcolumn
Explanation of the CFO’s financial strategy
74companies
74companies
08価値創造 30Strategic focus and connectivity
© 2017 KPMG AZSA LLC, a limited liability audit corporation incorporated under the Japanese Certified Public Accountants Law and a member firm of the KPMG network of independent member firms affiliated with KPMG International Cooperative (“KPMG International”), a Swiss entity. All rights reserved.

Number of Japanese companies issuing Self-Declared Integrated Reports
The number of companies issuing integrated reports grew steadily to 279 in 2016, an increase of 59 over last year. KPMG analysis indicates that management understood the significance of constructive dialog between investors and the company, which led to the issuance of integrated reports as a tool for dialog.
Among all 33 industries, companies in 31 of them have taken up integrated reporting, unchanged from the previous year.
In issuing companies by industry, the electric equipment industry had the most for the third consecutive year, with 30 companies.
The electric equipment, chemicals, machinery, information and communications, and food industries saw the largest increase in the number of issuing companies over the past three years.
Looking at the percentage of companies by industry that issued integrated reports and are listed on the First Section of the Tokyo Stock Exchange (TSE) (Source: Japan Company Handbook Autumn 2016), reporting activity remained brisk in air transport (67%), marine transport (63%), insurance (56%), and pharmaceuticals (43%).
The number of companies that issued an integrated report
26 3462
96
141
220
2010 2011 2012 2013 2014 2015 2016
The number of companies that issued an integrated report in 2016:
279companies
31
n=262 companies (listed on the First Section of the Tokyo Stock Exchange)
Industries of issuing companies
67%
56%
63%
43%
30companies
21
Percentage of issuing companies (2016)2014Increase in 2015Increase in 2016
+
5
+
5
+
6
+
6
Basic information
+59
Electr
ic eq
uipm
ent
Chem
icals
Mac
hinery
Constr
uctio
n
Pharm
aceu
ticals
Who
lesale
Trans
porta
tion e
quipm
ent
Inform
ation
and c
omm
unica
tionReta
il
Food
s
Real e
state
Servi
ces
Other f
inanc
ial se
rvice
s
Other p
roduc
ts
Bankin
g
Mari
ne tr
ansp
ort
Nonfer
rous m
etals
Electr
ic po
wer an
d gas
Prec
ision
mec
hanic
al eq
uipm
ent
Insura
nce
Secur
ities a
nd co
mm
odity
futu
res t
rading
Glass a
nd st
one/c
lay pr
oduc
ts
Petro
leum
and c
oal p
roduc
ts
Meta
l prod
ucts
Stee
l
Pulp
and p
aper
Air tran
sport
Texti
le pro
ducts
Mini
ng
Land
tran
sport
Rubbe
r prod
ucts
Fishe
ries/A
gricu
lture
and f
orestr
y
Ware
hous
ing/Tr
ansp
ort
Basic information
© 2017 KPMG AZSA LLC, a limited liability audit corporation incorporated under the Japanese Certified Public Accountants Law and a member firm of the KPMG network of independent member firms affiliated with KPMG International Cooperative (“KPMG International”), a Swiss entity. All rights reserved.

Attributes of issuing companies
Listing market of issuer companies
Companies listed on the First Section of the TSE are driving growth in the number of issuing companies.
Among issuing companies, 262 (94%) were listed on the First Section of the TSE, an increase of 71 companies over the previous year.
This year, two companies listed on the Second Section of the TSE issued integrated reports for the first time. Meanwhile, in emerging markets such as JASDAQ and Mothers, there was a decrease of one company from the previous year.
Index attributes of issuing companies
The percentage of issuing companies of the Nikkei 225 component and JPX Nikkei 400 component has increased year by year.
At companies that are actively trading on the stock market, a requirement for the Nikkei 225 component, or companies that are highly rated financially and non-financially, a requirement for the JPX Nikkei 400 component, integrated reporting initiatives are thriving.
Revenue of issuing companies
The percentage of companies with revenue of \100 billion or more has consistently been at 85% of the total for three years.
The percentage of issuing companies of the 151 listed companies with revenue of \1 trillion or more (Source: Japan Company Handbook Autumn 2016) was 62%, up substantially from 43% last year.
32
262companies
JPX Nikkei 400 component percentage
Nikkei 225 component percentage
JASDAQ/Mothers: 4companies
Second Section of the TSE: 2companies
Unlisted: 11companies
First Section of the TSE
(+71)
2014 2015 2016
n=225companies
n=400companies
130
057
059
191
33%
16%
36%
8%
5% 2%5
2014 2015 2016
Over JPY 1 trillion
JPY 500 billion to under JPY 1 trillion
JPY 100 billion to under JPY 500 billion
JPY 50 billion to under JPY 100 billion
Under JPY 50 billion
Unlisted
2014
2014
28%
62
20%
78
2015
2015
38%
85
29%
114
2016
2016
50%
113
37%146
50 63 94
44
100
2214
32
79
1210
18
53
59
97
Basic information
n=142 companies
n=205 companies
n=279 companies
n=142 companies
n=205 companies
n=279 companies
© 2017 KPMG AZSA LLC, a limited liability audit corporation incorporated under the Japanese Certified Public Accountants Law and a member firm of the KPMG network of independent member firms affiliated with KPMG International Cooperative (“KPMG International”), a Swiss entity. All rights reserved.
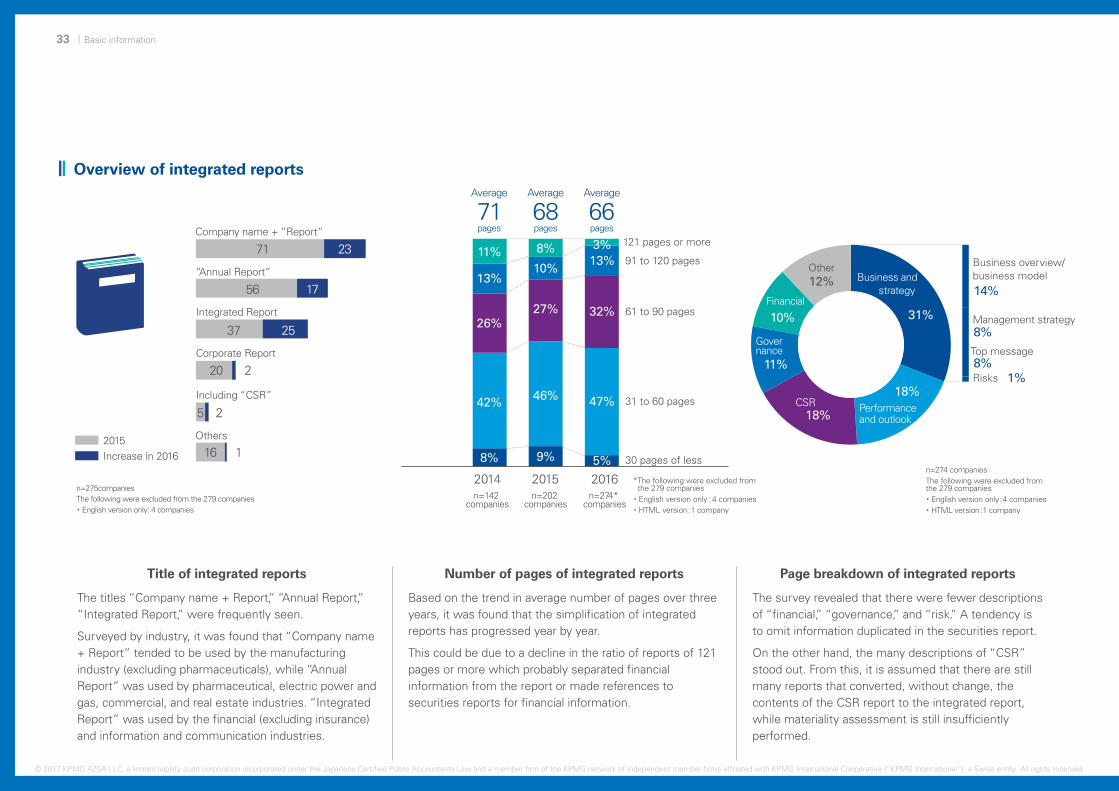
Business overview/business model14%
Management strategy8%Top message8%Risks 1%
Title of integrated reports
The titles “Company name + Report,” “Annual Report,” “Integrated Report,” were frequently seen.
Surveyed by industry, it was found that “Company name + Report” tended to be used by the manufacturing industry (excluding pharmaceuticals), while “Annual Report” was used by pharmaceutical, electric power and gas, commercial, and real estate industries. “Integrated Report” was used by the financial (excluding insurance) and information and communication industries.
Page breakdown of integrated reports
The survey revealed that there were fewer descriptions of “financial,” “governance,” and “risk.” A tendency is to omit information duplicated in the securities report.
On the other hand, the many descriptions of “CSR” stood out. From this, it is assumed that there are still many reports that converted, without change, the contents of the CSR report to the integrated report, while materiality assessment is still insufficiently performed.
Number of pages of integrated reports
Based on the trend in average number of pages over three years, it was found that the simplification of integrated reports has progressed year by year.
This could be due to a decline in the ratio of reports of 121 pages or more which probably separated financial information from the report or made references to securities reports for financial information.
121 pages or more
30 pages of less
91 to 120 pages
61 to 90 pages
31 to 60 pages
*The following were excluded from the 279 companies・English version only : 4 companies・HTML version:1 company
n=274 companiesThe following were excluded from the 279 companies・English version only:4 companies・HTML version:1 company
n=275companiesThe following were excluded from the 279 companies ・ English version only: 4 companies
8% 9% 5%
42% 46% 47%
26%27% 32%
13%10%
13%11% 8% 3%
2014 2015 2016
Average
71pages
Average
68pages
Average
66pages
Financial
10%
11%
CSR18%
18%
Governance
31%
Other12% Business and
strategy
Increase in 20162015
Overview of integrated reports
Performance and outlook
Company name + “Report”
71 23
“Annual Report”
56 17
Including “CSR”
Corporate Report
220
25
Others
116
Integrated Report
37 25
n=142 companies
n=202 companies
n=274* companies
33 Basic information
© 2017 KPMG AZSA LLC, a limited liability audit corporation incorporated under the Japanese Certified Public Accountants Law and a member firm of the KPMG network of independent member firms affiliated with KPMG International Cooperative (“KPMG International”), a Swiss entity. All rights reserved.

(53%)
(30%)
English version of integrated report
Nearly 90% of the companies issued both Japanese and English versions.
The dissolution of cross-shareholding due to the Corporate Governance Code is expected to elevate the importance of information dissemination to investors outside Japan as new buyers, and the issuance of English reports is expected to continue to increase.
Timing of issuance of integrated reports (Japanese version)
Last year’s survey revealed that Japanese reports came out in increasing numbers from three to five months after the fiscal-year end. However, in this survey, issuance sharply peaked after four months, followed by a gradual decline in ensuring months.
Timing of issuance of integrated reports (English version)
Companies issuing a Japanese version simultaneously with an English version was most common, with 122 companies (53%) doing so.
This could be an indication of companies’ efforts to eliminate the information gap between Japan and overseas.
11%Japanese only
English only1%
88%
Japanese and English
245
304
* n=261 companiesThe following were excluded from the 279 companies・English version only: 4 companies・Uncertain: 14 companies
201420152016*
04
27
37 36
17
4 400
8
36
45
53
25
8 602
8
33
79companies
59
38
24
117
55
29
14
4 2 0
69
40
29
81 1
122companies
5237
136
1
*n=231 companiesThe following were excluded from the 279 companies・Japanese version only: 30 companies・English version only: 4 companies・Uncertain: 14 companies
201420152016*
8months
9months
7months
6months
5months
4months
3months
2months
1month
Afteryear-end
5months
4months
3months
2months
1month
SimultaneousAfter issuance of Japanese version
n=279
34Basic information
© 2017 KPMG AZSA LLC, a limited liability audit corporation incorporated under the Japanese Certified Public Accountants Law and a member firm of the KPMG network of independent member firms affiliated with KPMG International Cooperative (“KPMG International”), a Swiss entity. All rights reserved.

65
13
23%
5%19772%
Departments in charge of issuing integrated reports
The integrated reports of 146 companies, or more than 50% of the total, were issued by departments in charge of information dissemination to stakeholders, such as the public relations, IR, and corporate communications departments. This is a substantial increase from the nearly 30% (63 companies) in 2015.
There may be indications that the approach to corporate communications within companies is becoming better organized, and this may lead to a review of the related structure. On the other hand, whether or not the role of these organizations is limited to the production of integrated reports will be closely monitored, going forward.
Issuance of CSR reports
The percentage of companies issuing CSR reports (including data books) in conjunction with integrated reports has increased year by year, from 25% in 2014 to 28%.
As the information needs of readers of an integrated report and a CSR report differ, it is not surprising that both reports are issued. However, it is noteworthy that the number of companies issuing CSR reports is increasing among Japanese companies, in light of the strong tendency to combine the annual report and CSR report as the starting point for the integrated report.
This indicates that information disseminated by companies is being systematically structured and organized and disclosure is being reviewed and improved.
Not issued Issuance of CSR data book
Issuance of CSR report separately
28%
Issued
n=275*
Project
Others
IR + CSR
Public relations/CSR
Corporate planning
Administration
Corporate communication
Public relations/IR
CSR
IR
Public relations 44
41
45
38
55%
+29
9
8
6
4
4
15
19+11
+14
+20
+23
+9
+3
+1
+6
Public relations + CSR +4
+2
+28
n=265companiesThe following were excluded from the 279 companies・Uncertain: 14 companies
32
*The following are excluded from the 279 companies・English version only: 4 companies
Increase in 20162015
146companies
35 Basic information
© 2017 KPMG AZSA LLC, a limited liability audit corporation incorporated under the Japanese Certified Public Accountants Law and a member firm of the KPMG network of independent member firms affiliated with KPMG International Cooperative (“KPMG International”), a Swiss entity. All rights reserved.
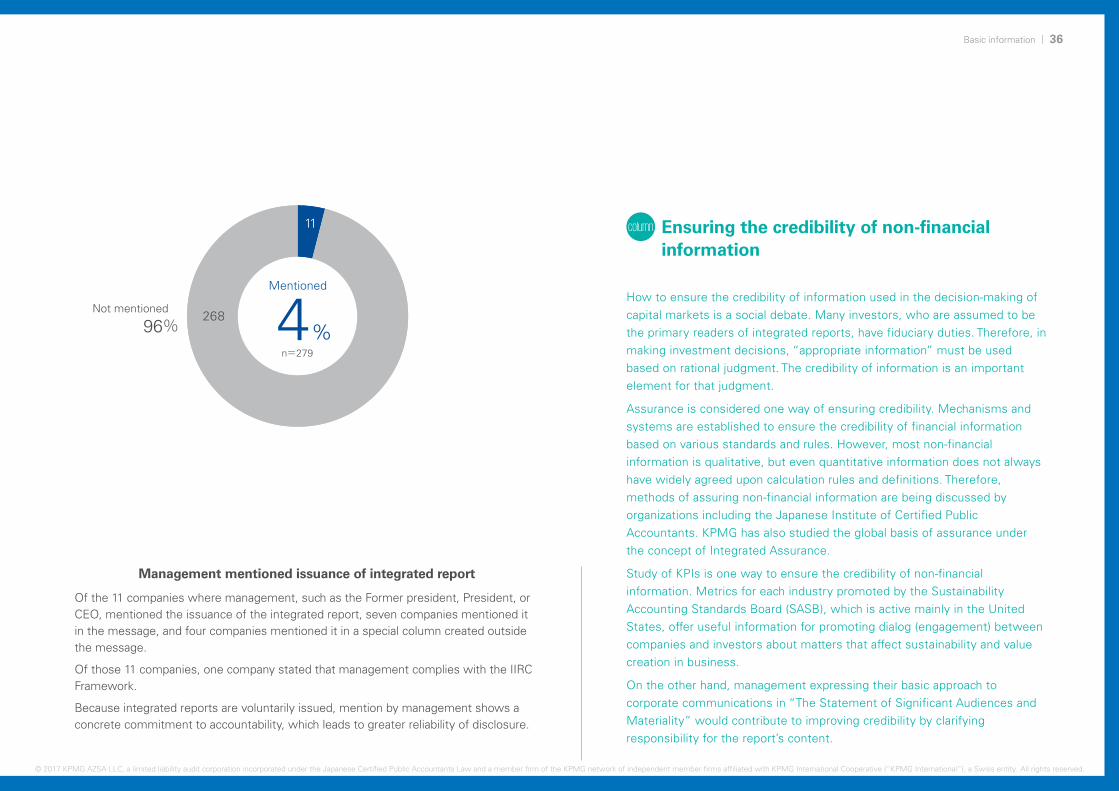
Mentioned
Not mentioned
n=279
Management mentioned issuance of integrated report
Of the 11 companies where management, such as the Former president, President, or CEO, mentioned the issuance of the integrated report, seven companies mentioned it in the message, and four companies mentioned it in a special column created outside the message.
Of those 11 companies, one company stated that management complies with the IIRC Framework.
Because integrated reports are voluntarily issued, mention by management shows a concrete commitment to accountability, which leads to greater reliability of disclosure.
4%268
96%
11 Ensuring the credibility of non-financial informationcolumn
How to ensure the credibility of information used in the decision-making of capital markets is a social debate. Many investors, who are assumed to be the primary readers of integrated reports, have fiduciary duties. Therefore, in making investment decisions, “appropriate information” must be used based on rational judgment. The credibility of information is an important element for that judgment.
Assurance is considered one way of ensuring credibility. Mechanisms and systems are established to ensure the credibility of financial information based on various standards and rules. However, most non-financial information is qualitative, but even quantitative information does not always have widely agreed upon calculation rules and definitions. Therefore, methods of assuring non-financial information are being discussed by organizations including the Japanese Institute of Certified Public Accountants. KPMG has also studied the global basis of assurance under the concept of Integrated Assurance.
Study of KPIs is one way to ensure the credibility of non-financial information. Metrics for each industry promoted by the Sustainability Accounting Standards Board (SASB), which is active mainly in the United States, offer useful information for promoting dialog (engagement) between companies and investors about matters that affect sustainability and value creation in business.
On the other hand, management expressing their basic approach to corporate communications in “The Statement of Significant Audiences and Materiality” would contribute to improving credibility by clarifying responsibility for the report’s content.
36Basic information
© 2017 KPMG AZSA LLC, a limited liability audit corporation incorporated under the Japanese Certified Public Accountants Law and a member firm of the KPMG network of independent member firms affiliated with KPMG International Cooperative (“KPMG International”), a Swiss entity. All rights reserved.
List of Japanese Companies Issuing Integrated Reports in 2016
37 List of Japanese Companies Issuing Integrated Reports in 2016
Aeon Financial Service Co., Ltd.
Ahresty Corp.
AIRDO Co., Ltd.
Aisin Seiki Co., Ltd.
Ajinomoto Co., Inc.
Akebono Brake Industry Co., Ltd.
Alpine Electronics, Inc.
Alps Electric Co., Ltd.
Amita Holdings Co., Ltd.
ANA HOLDINGS INC.
Anritsu Corp.
Asahi Glass Co., Ltd.
Asahi Group Holdings, Ltd.
Asahi Industries Co., Ltd.
Asahi Kasei Corp.
ASKA Pharmaceutical. Co., Ltd.
Astellas Pharma Inc.
Azbil Corporation
Brother Industries, Ltd.
Capcom Co., Ltd.
Chiome Bioscience Inc.
Chubu Electric Power Co., Inc.
Chugai Pharmaceutical Co., Ltd.
Cosmo Energy Holdings Co., Ltd.
Dai Nippon Printing Co., Ltd.
Dai-Dan Co., Ltd.
Daiichi Sankyo Co., Ltd.
Daiken Corp.
Daikyo Inc.
Dainippon Sumitomo Pharma Co., Ltd.
Daito Trust Construction Co., Ltd.
Denka Co., Ltd.
Denso Corp.
Dentsu Inc.
Development Bank of Japan Inc.
DKS Co., Ltd.
Don Quijote Holdings Co., Ltd.
Duskin Co., Ltd.
Ebara Corp.
ECHO ELECTRIC CO., LTD
Eisai Co., Ltd.
Familymart Co., Ltd.
Fancl Corp.
Freund Corporation
FUJI ELECTRIC CO., LTD.
Fuji Heavy Industries Ltd.
Fujicco Co., Ltd.
Fujikura Ltd.
Fujita Kanko Inc.
Fujitsu Limited
Furukawa Electric Co., Ltd.
Hitachi Capital Corp.
Hitachi Chemical Co.,Ltd.
Hitachi Construction Machinery Co., Ltd.
Hitachi High-Technologies Corp.
Hitachi Maxell, Ltd.
Hitachi Metals, Ltd.
Hitachi Transport System, Ltd.
Hitachi, Ltd.
Hokuetsu Kishu Paper Co., Ltd.
Horiba, Ltd.
Hulic Co., Ltd.
Idemitsu Kosan Co.,Ltd.
IHI Corp.
Iino Kaiun Kaisha, Ltd.
Inpex Corp.
Ito En, Ltd.
ITOCHU Corporation
Itochu Enex Co., Ltd.
Itochu Techno-Solutions Corp.
J.Front Retailing Co., Ltd.
Japan Airlines Co., Ltd.
Japan Asia Group Ltd.
Japan Assurance Aarata
Japan Exchange Group, Inc.
Japan Petroleum Exploration Co., Ltd.
JCR Pharmaceuticals Co., Ltd.
JFE Holdings, Inc.
J-OIL MILLS, Inc.
JTEKT Corp.
JUKI Corp.
JVC Kenwood Corp.
JX Holdings, Inc.
Kajima Corp.
Kansai Paint Co.,Ltd.
Kawasaki Heavy Industries, Ltd.
Kawasaki Kisen Kaisha, Ltd.
KDDI CORPORATION
Kirin Holdings Co., Ltd.
Kito Corp.
KITZ CORPORATION
Komatsu Ltd.
Konica Minolta, Inc.
KPMG Japan
KUBOTA Corporation
Kurimoto, Ltd.
Kyorin Holdings, Inc.
KYOWA EXEO CORPORATION
Kyowa Hakko Kirin Co., Ltd.
Kyushu Electric Power Co., Inc.
Lawson, Inc.
Leopalace21 Corp.
Lintec Corp.
LIXIL Group Corporation
Marubeni Corporation
Marui Group Co., Ltd.
Matsuda Sangyo Co., Ltd.
Medipal Holdings Corp.
MEIDENSHA CORPORATION
Meiji Holdings Co., Ltd.
Meiji Yasuda Life Insurance Company
Metawater Co., Ltd.
Mitsubishi Chemical Holdings Corporation
Mitsubishi Corporation
Mitsubishi Estate Co., Ltd.
Mitsubishi Heavy Industries, Ltd.
Mitsubishi Paper Mills Ltd.
Mitsubishi Research Institute, Inc.
Mitsubishi Tanabe Pharma Corporation
Mitsubishi UFJ Financial Group, Inc.
Mitsubishi UFJ Lease & Finance Co., Ltd.
MITSUI & CO., LTD.
Mitsui Chemicals, Inc.
Mitsui Engineering & Shipbuilding Co., Ltd.
Mitsui Fudosan Co., Ltd.
Mitsui O.S.K. Lines, Ltd.
Mitsuuroko Group Holdings Co., Ltd.
Mizuho Financial Group, Inc.
Monex Group, Inc.
Morinaga Milk Industry Co., Ltd.
MS&AD Insurance Group Holdings, Inc.
Nabtesco Corp.
NAGASE & CO., LTD
NEC Capital Solutions Ltd.
NEC Corporation
NEC Networks & System Integration Corp.
NGK Insulators, Ltd.
NHK SPRING CO., LTD.
NICHICON CORPORATION
Nichirei Corp.
Nihon Chouzai Co., Ltd.
Nihon Unisys, Ltd.
Nikon Corp.
Nippon Chemiphar Co., Ltd.
Nippon Kayaku Co., Ltd.
Nippon Koei Co., Ltd.
Nippon Life Insurance Company
Nippon Paint Holdings Co., Ltd.
Nippon Shinyaku Co., Ltd.
Nippon Signal Co., Ltd.
Nippon Telegraph And Telephone Corp.
Nippon Yusen Kabushiki Kaisha
Nishimatsu Construction Co., Ltd.
Nissha Printing Co., Ltd.
Nisshinbo Holdings Inc.
Nissin Foods Holdings Co., Ltd.
Nitto Denko Corporation
Nomura Co., Ltd.
Nomura Holdings,inc.
Nomura Real Estate Holdings, Inc.
Nomura Research Institute, Ltd.
Noritz Corp.
NS United Kaiun Kaisha, Ltd.
NSK Ltd.
NTN Corporation
NTT Data Corp.
NTT Docomo, Inc.
NTT Urban Development Corp.
Obayashi Corporation
Ohara Inc.
Oji Holdings Corporation
Okasan Securities Group Inc.
Oki Electric Industry Co., Ltd.
Olympus Corp.
OMRON Corporation
Ono Pharmaceutical Co., Ltd.
Orix Corp.
Osaka Soda Co., Ltd.
Pacific Industrial Co., Ltd.
Panasonic Corp.
Parco Co., Ltd.
Penta-Ocean Construction Co., Ltd.
Pigeon Corp.
Pola Orbis Holdings Inc.
Recruit Holdings Co., Ltd.
Resona Holdings, Inc.
Ricoh Company, Ltd.
Rohm Co., Ltd.
S.T. Corporation
Sangetsu Co., Ltd.
SANKI ENGINEERING CO.,LTD.
Sanwa Holdings Corp.
Sato Holdings Corp.
Sawai Pharmaceutical Co., Ltd.
SCREEN Holdings Co., Ltd
SCSK Corp.
SEGA SAMMY HOLDINGS INC.
Sekisui Chemical Co., Ltd.
Sekisui House, Ltd.
Senshukai Co., Ltd.
Seven & i Holdings Co., Ltd.
Seven Bank, Ltd.
SHIKOKU ELECTRIC POWER CO.,INC.
Shimadzu Corp.
Shimizu Corp.
Shin Nippon Air Technologies Co., Ltd.
Shin-Etsu Chemical Co., Ltd.
Shionogi & Co., Ltd.
Shiseido Company, Limited
SHOWA DENKI CO LTD.
SHOWA SHELL SEKIYU K. K.
Skylark Co., Ltd.
Sodick Co., Ltd.
Sohgo Security Services Co., Ltd.
Sojitz Corporation
Solaseed Air Inc.
Sompo Holdings, Inc.
Sumitomo Chemical Co., Ltd.
SUMITOMO CORPORATION
SUMITOMO LIFE INSURANCE COMPANY
Sumitomo Metal Mining Co., Ltd.
Sumitomo Mitsui Construction Co., Ltd.
Sumitomo Mitsui Financial Group, Inc.
Sumitomo Riko Co., Ltd.
Sun Messe Co.,Ltd.
Suzuken Co., Ltd.
Sysmex Corp.
T&D Holdings, Inc.
Taiho Kogyo Co., Ltd.
Taisei Corporation
Taisho Pharmaceutical Holdings Co., Ltd.
Takeda Pharmaceutical Company Limited
Takenaka Corporation
TDK Corp.
Teijin Ltd.
Terumo Corp.
T-Gaia Corp.
The Dai-ichi Life Insurance Co., Ltd.
THE Kansai Electric Power Co.,Inc.
The Nisshin Oillio Group, Ltd.
The Shiga Bank, Ltd.
ThreePro Group Inc.
TIS Inc.
TODA CORPORATION
Toho Co., Ltd.
Tokio Marine Holdings, Inc.
Tokyo Century Corp.
Tokyo Dome Corp.
Tokyu Fudosan Holdings Corp.
Topcon Corp
Toppan Forms Co., Ltd.
Toppan Printing Co., Ltd.
Topy Industries Ltd.
Torishima Pump Mfg. Co., Ltd.
Toshiba Corp.
TOTO LTD.
Toyo Construction Co., Ltd.
TOYO DENKI SEIZO K.K.
Toyo Engineering Corp.
TOYODA GOSEI CO.,LTD.
TOYOTA BOSHOKU CORPORATION
Toyota Industries Corporation
Toyota Motor Corp.
Toyota Tsusho Corp.
TS TECH CO.,LTD.
Tsubakimoto Chain Co.
UACJ Corporation
Ube Industries, Ltd.
ULVAC, Inc.
Unicharm Corp.
UNITED ARROWS LTD.
WACOL HOLDINGS CORP.
Yamaha Motor Co., Ltd.
Yamato Holdings Co., Ltd.
YASKAWA Electric Corporation
Yokogawa Electric Corp.
ZEON CORPORATION
© 2017 KPMG AZSA LLC, a limited liability audit corporation incorporated under the Japanese Certified Public Accountants Law and a member firm of the KPMG network of independent member firms affiliated with KPMG International Cooperative (“KPMG International”), a Swiss entity. All rights reserved.

Resource: Website of Corporate Value Reporting Labhttp://cvrl-net.com/archive/index.html
38List of Japanese Companies Issuing Integrated Reports in 2016
Aeon Financial Service Co., Ltd.
Ahresty Corp.
AIRDO Co., Ltd.
Aisin Seiki Co., Ltd.
Ajinomoto Co., Inc.
Akebono Brake Industry Co., Ltd.
Alpine Electronics, Inc.
Alps Electric Co., Ltd.
Amita Holdings Co., Ltd.
ANA HOLDINGS INC.
Anritsu Corp.
Asahi Glass Co., Ltd.
Asahi Group Holdings, Ltd.
Asahi Industries Co., Ltd.
Asahi Kasei Corp.
ASKA Pharmaceutical. Co., Ltd.
Astellas Pharma Inc.
Azbil Corporation
Brother Industries, Ltd.
Capcom Co., Ltd.
Chiome Bioscience Inc.
Chubu Electric Power Co., Inc.
Chugai Pharmaceutical Co., Ltd.
Cosmo Energy Holdings Co., Ltd.
Dai Nippon Printing Co., Ltd.
Dai-Dan Co., Ltd.
Daiichi Sankyo Co., Ltd.
Daiken Corp.
Daikyo Inc.
Dainippon Sumitomo Pharma Co., Ltd.
Daito Trust Construction Co., Ltd.
Denka Co., Ltd.
Denso Corp.
Dentsu Inc.
Development Bank of Japan Inc.
DKS Co., Ltd.
Don Quijote Holdings Co., Ltd.
Duskin Co., Ltd.
Ebara Corp.
ECHO ELECTRIC CO., LTD
Eisai Co., Ltd.
Familymart Co., Ltd.
Fancl Corp.
Freund Corporation
FUJI ELECTRIC CO., LTD.
Fuji Heavy Industries Ltd.
Fujicco Co., Ltd.
Fujikura Ltd.
Fujita Kanko Inc.
Fujitsu Limited
Furukawa Electric Co., Ltd.
Hitachi Capital Corp.
Hitachi Chemical Co.,Ltd.
Hitachi Construction Machinery Co., Ltd.
Hitachi High-Technologies Corp.
Hitachi Maxell, Ltd.
Hitachi Metals, Ltd.
Hitachi Transport System, Ltd.
Hitachi, Ltd.
Hokuetsu Kishu Paper Co., Ltd.
Horiba, Ltd.
Hulic Co., Ltd.
Idemitsu Kosan Co.,Ltd.
IHI Corp.
Iino Kaiun Kaisha, Ltd.
Inpex Corp.
Ito En, Ltd.
ITOCHU Corporation
Itochu Enex Co., Ltd.
Itochu Techno-Solutions Corp.
J.Front Retailing Co., Ltd.
Japan Airlines Co., Ltd.
Japan Asia Group Ltd.
Japan Assurance Aarata
Japan Exchange Group, Inc.
Japan Petroleum Exploration Co., Ltd.
JCR Pharmaceuticals Co., Ltd.
JFE Holdings, Inc.
J-OIL MILLS, Inc.
JTEKT Corp.
JUKI Corp.
JVC Kenwood Corp.
JX Holdings, Inc.
Kajima Corp.
Kansai Paint Co.,Ltd.
Kawasaki Heavy Industries, Ltd.
Kawasaki Kisen Kaisha, Ltd.
KDDI CORPORATION
Kirin Holdings Co., Ltd.
Kito Corp.
KITZ CORPORATION
Komatsu Ltd.
Konica Minolta, Inc.
KPMG Japan
KUBOTA Corporation
Kurimoto, Ltd.
Kyorin Holdings, Inc.
KYOWA EXEO CORPORATION
Kyowa Hakko Kirin Co., Ltd.
Kyushu Electric Power Co., Inc.
Lawson, Inc.
Leopalace21 Corp.
Lintec Corp.
LIXIL Group Corporation
Marubeni Corporation
Marui Group Co., Ltd.
Matsuda Sangyo Co., Ltd.
Medipal Holdings Corp.
MEIDENSHA CORPORATION
Meiji Holdings Co., Ltd.
Meiji Yasuda Life Insurance Company
Metawater Co., Ltd.
Mitsubishi Chemical Holdings Corporation
Mitsubishi Corporation
Mitsubishi Estate Co., Ltd.
Mitsubishi Heavy Industries, Ltd.
Mitsubishi Paper Mills Ltd.
Mitsubishi Research Institute, Inc.
Mitsubishi Tanabe Pharma Corporation
Mitsubishi UFJ Financial Group, Inc.
Mitsubishi UFJ Lease & Finance Co., Ltd.
MITSUI & CO., LTD.
Mitsui Chemicals, Inc.
Mitsui Engineering & Shipbuilding Co., Ltd.
Mitsui Fudosan Co., Ltd.
Mitsui O.S.K. Lines, Ltd.
Mitsuuroko Group Holdings Co., Ltd.
Mizuho Financial Group, Inc.
Monex Group, Inc.
Morinaga Milk Industry Co., Ltd.
MS&AD Insurance Group Holdings, Inc.
Nabtesco Corp.
NAGASE & CO., LTD
NEC Capital Solutions Ltd.
NEC Corporation
NEC Networks & System Integration Corp.
NGK Insulators, Ltd.
NHK SPRING CO., LTD.
NICHICON CORPORATION
Nichirei Corp.
Nihon Chouzai Co., Ltd.
Nihon Unisys, Ltd.
Nikon Corp.
Nippon Chemiphar Co., Ltd.
Nippon Kayaku Co., Ltd.
Nippon Koei Co., Ltd.
Nippon Life Insurance Company
Nippon Paint Holdings Co., Ltd.
Nippon Shinyaku Co., Ltd.
Nippon Signal Co., Ltd.
Nippon Telegraph And Telephone Corp.
Nippon Yusen Kabushiki Kaisha
Nishimatsu Construction Co., Ltd.
Nissha Printing Co., Ltd.
Nisshinbo Holdings Inc.
Nissin Foods Holdings Co., Ltd.
Nitto Denko Corporation
Nomura Co., Ltd.
Nomura Holdings,inc.
Nomura Real Estate Holdings, Inc.
Nomura Research Institute, Ltd.
Noritz Corp.
NS United Kaiun Kaisha, Ltd.
NSK Ltd.
NTN Corporation
NTT Data Corp.
NTT Docomo, Inc.
NTT Urban Development Corp.
Obayashi Corporation
Ohara Inc.
Oji Holdings Corporation
Okasan Securities Group Inc.
Oki Electric Industry Co., Ltd.
Olympus Corp.
OMRON Corporation
Ono Pharmaceutical Co., Ltd.
Orix Corp.
Osaka Soda Co., Ltd.
Pacific Industrial Co., Ltd.
Panasonic Corp.
Parco Co., Ltd.
Penta-Ocean Construction Co., Ltd.
Pigeon Corp.
Pola Orbis Holdings Inc.
Recruit Holdings Co., Ltd.
Resona Holdings, Inc.
Ricoh Company, Ltd.
Rohm Co., Ltd.
S.T. Corporation
Sangetsu Co., Ltd.
SANKI ENGINEERING CO.,LTD.
Sanwa Holdings Corp.
Sato Holdings Corp.
Sawai Pharmaceutical Co., Ltd.
SCREEN Holdings Co., Ltd
SCSK Corp.
SEGA SAMMY HOLDINGS INC.
Sekisui Chemical Co., Ltd.
Sekisui House, Ltd.
Senshukai Co., Ltd.
Seven & i Holdings Co., Ltd.
Seven Bank, Ltd.
SHIKOKU ELECTRIC POWER CO.,INC.
Shimadzu Corp.
Shimizu Corp.
Shin Nippon Air Technologies Co., Ltd.
Shin-Etsu Chemical Co., Ltd.
Shionogi & Co., Ltd.
Shiseido Company, Limited
SHOWA DENKI CO LTD.
SHOWA SHELL SEKIYU K. K.
Skylark Co., Ltd.
Sodick Co., Ltd.
Sohgo Security Services Co., Ltd.
Sojitz Corporation
Solaseed Air Inc.
Sompo Holdings, Inc.
Sumitomo Chemical Co., Ltd.
SUMITOMO CORPORATION
SUMITOMO LIFE INSURANCE COMPANY
Sumitomo Metal Mining Co., Ltd.
Sumitomo Mitsui Construction Co., Ltd.
Sumitomo Mitsui Financial Group, Inc.
Sumitomo Riko Co., Ltd.
Sun Messe Co.,Ltd.
Suzuken Co., Ltd.
Sysmex Corp.
T&D Holdings, Inc.
Taiho Kogyo Co., Ltd.
Taisei Corporation
Taisho Pharmaceutical Holdings Co., Ltd.
Takeda Pharmaceutical Company Limited
Takenaka Corporation
TDK Corp.
Teijin Ltd.
Terumo Corp.
T-Gaia Corp.
The Dai-ichi Life Insurance Co., Ltd.
THE Kansai Electric Power Co.,Inc.
The Nisshin Oillio Group, Ltd.
The Shiga Bank, Ltd.
ThreePro Group Inc.
TIS Inc.
TODA CORPORATION
Toho Co., Ltd.
Tokio Marine Holdings, Inc.
Tokyo Century Corp.
Tokyo Dome Corp.
Tokyu Fudosan Holdings Corp.
Topcon Corp
Toppan Forms Co., Ltd.
Toppan Printing Co., Ltd.
Topy Industries Ltd.
Torishima Pump Mfg. Co., Ltd.
Toshiba Corp.
TOTO LTD.
Toyo Construction Co., Ltd.
TOYO DENKI SEIZO K.K.
Toyo Engineering Corp.
TOYODA GOSEI CO.,LTD.
TOYOTA BOSHOKU CORPORATION
Toyota Industries Corporation
Toyota Motor Corp.
Toyota Tsusho Corp.
TS TECH CO.,LTD.
Tsubakimoto Chain Co.
UACJ Corporation
Ube Industries, Ltd.
ULVAC, Inc.
Unicharm Corp.
UNITED ARROWS LTD.
WACOL HOLDINGS CORP.
Yamaha Motor Co., Ltd.
Yamato Holdings Co., Ltd.
YASKAWA Electric Corporation
Yokogawa Electric Corp.
ZEON CORPORATION
© 2017 KPMG AZSA LLC, a limited liability audit corporation incorporated under the Japanese Certified Public Accountants Law and a member firm of the KPMG network of independent member firms affiliated with KPMG International Cooperative (“KPMG International”), a Swiss entity. All rights reserved.

The rapid increase in the number of companies issuing integrated reports in Japan draws looks of surprise from abroad. Several factors are thought to lie behind this: a long-term management perspective, which is one of the characteristic features of Japanese companies; an emphasis on human resources; and corporate cultures which call for contribution to customers, business partners, and society as part of their company motto. Furthermore, it appears that many companies that decided to publish integrated reports may have been inspired by the efforts of industry peers; this is probably another factor behind the rapid increase in the number of companies issuing these reports.
However, a lack of a consistent message was observed throughout the reports surveyed. Reports fell short of fully communicating the company’s strengths and distinctive features. Merely producing an integrated report has become the goal, and so the reports are not being fully utilized as a method for disseminating “something that you want to communicate to someone you want to communicate to.”
Practicing integrated reporting is an activity that helps to achieve sustainable value improvement. Our thoughts and general suggestions have been summarized in this report as KPMG’s recommendations. Taking an inclusive view, KPMG is convinced that the demonstration of management leadership will help integrated thinking
Conclusion
39 Conclusion
penetrate and spread into organizations and in turn lead to growth in value creation. Considering things not only from the internal perspective of the company, but also from those of the various outside parties that form the value creation process, has become increasingly important.
The “silo problem” is an issue frequently pointed out in the integrated report preparation process. However, many companies study the organization taking into account decision-making speed and efficiency at the worksite, and make the most of their human resources by putting the right people in the right place. The important thing is to carry out activities to increase the value created by the company while connecting the silos and sharing goals, and to instill a mechanism that can identify tangible and intangible results at each position. As organizations become increasingly complex, managers are the ones who can both lead this movement, and take advantage of it.
Japanese companies are now facing unprecedented changes. Under these circumstances, and with the aim of fostering better integrated reports, KPMG believes that discussion, study, and discovery from the past to the present while considering the future will directly lead to sustainable value growth for companies and eventually to the realization of a sustainable society.
KPMG Japan recognizes its responsibility in fostering social trust and hopes to continue to participate proactively in the move to integrated reporting.
© 2017 KPMG AZSA LLC, a limited liability audit corporation incorporated under the Japanese Certified Public Accountants Law and a member firm of the KPMG network of independent member firms affiliated with KPMG International Cooperative (“KPMG International”), a Swiss entity. All rights reserved.
The KPMG Japan Integrated Report Advisory Group comprises professionals with specialized knowledge and experience in integrated reporting. The Group seeks to meet the wide-ranging needs of global companies, for instance by providing useful information about integrated reports. For information about the services provided by this group, please refer to the website below or inquire by email. Please also take advantage of the Group’s email magazine which presents integrated reporting trends and commentary (in Japanese only).
KPMG Japan Integrated Reporting Advisory Group
The following people also provided support in the survey process.
Special thanks to Michael Bray, KPMG Australia
Koichiro SaioKiyoo KamiyamaYuka Otsubo
Hiroshi IshikawaReina OkabeNami Yasui
Sakurako OhtsukiYoshimitsu NagasakaShotaro Kanatani
Xu Jingyi Chika KannoMegumi Yoshihara
Yoshiko ShibasakaSumika Hashimoto Maiko Terada
Maki Nakamoto
Norie Takahashi Katsunao HikibaAkiko Hanada
Fumi Nunomura
Hiromasa Niinaya
Hikaru Watanabe
Asami Morimoto
40
Survey Team
KPMG Japan Integrated Reporting Advisory Group
Our website
<KPMG Japan Integrated Reporting website>
kpmg.com/jp/integrated-reporting
<Email magazine subscription page>
kpmg.com/jp/mail-magazine
The KPMG Japan integrated reporting website contains recent trends, commentary, and information about seminars.
Email MagazineThe KPMG Japan Integrated Reporting Email Magazine reports in a timely manner on recent trends, commentary, and seminars information related to integrated reporting (in Japanese only).
If you would like to receive the email magazine, please register at the page shown below.
Survey Team
© 2017 KPMG AZSA LLC, a limited liability audit corporation incorporated under the Japanese Certified Public Accountants Law and a member firm of the KPMG network of independent member firms affiliated with KPMG International Cooperative (“KPMG International”), a Swiss entity. All rights reserved.

The information contained herein is of a general nature and is not intended to address the circumstances of any particular individual or entity. Although we endeavor to provide accurate and timely information, there can be no guarantee that such information is accurate as of the date it is received or that it will continue to be accurate in the future. No one should act on such information without appropriate professional advice after a thorough examination of the particular situation.
© 2017 KPMG AZSA LLC, a limited liability audit corporation incorporated under the Japanese Certified Public Accountants Law and a member firm of the KPMG network of independent member firms affiliated with KPMG International Cooperative (“KPMG International”), a Swiss entity. All rights reserved. Printed in Japan. 17-1520
The KPMG name and logo are registered trademarks or trademarks of KPMG International.
www.kpmg.com/jp/ integrated-reporting
Integrated Reporting Advisory Group KPMG in Japan
kpmg.com/jp/socialmedia