survey implementation, sampling, and weighting...
TRANSCRIPT

8survey implementation, sampling,
and weighting data �
Chapter 7 discussed procedures for writing and designing questionnaires. Once a first draft of a questionnaire has been constructed, steps that follow in the survey research process include asking experts to review the questionnaire, pretesting the instrument, finalizing sampling procedures, administering the final questionnaire, and conducting a nonresponse bias check if necessary. This chapter discusses these steps and examines various approaches for selecting samples of potential respondents and administering questionnaires to these individuals. The chapter concludes with a discussion about weighting survey data.
Expert Advice, Pretesting, and Final Checks
Before administering a questionnaire, it is important to learn whether the instrument works satis-factorily or has any major problems. Pretesting a questionnaire adds more time to the survey research process, but it is an essential task (Krosnick, 1999; Salant & Dillman, 1994). Pretesting involves at least three phases: (a) seeking advice from experts such as academicians or repre-sentatives of organizations supporting the project, (b) administering the questionnaire to a small group of people who are typical of likely respondents (i.e., pilot testing), and (c) performing a final check of the instrument to ensure that no major errors are present.
Expert Advice
When writing and designing a questionnaire, it is important to allow input at various stages from policymakers, agency administrators, or other representatives of organizations supporting the project. These individuals have a vested interest in the project and substantial practical knowledge of topics being investigated and populations being surveyed. Having these individuals review drafts of the questionnaire can help identify technical problems that the researcher might miss, especially questions and statements that may not be technically accurate (see guideline 21, chapter 7). Expert advice is also important to identify if all necessary questions have been asked in the questionnaire, any questions that can be eliminated, and whether questions and response categories will allow comparisons to other existing data.
� This chapter was co-authored with Dr. Mark D. Needham, Oregon State University

174 surveyresearchandanalysis:applicationsinparks,recreation,andhumandimensions
Pilot TestsAfter receiving expert advice and making any revisions to the questionnaire based on this input, the next step is to administer the instrument to a relatively small number of individuals who are similar to those who will likely be sampled in the larger data collection effort (Babbie, 2003; Krosnick, 1999). To pilot test a survey examining anglers’ attitudes toward catch-and-release policies, for example, the questionnaire should be given to a group of anglers who represent the diversity of anglers in the population (e.g., young, old; fly anglers, bait anglers; male, female).
Researchers should not be overly concerned about obtaining large sample sizes for pilot tests. Dillman (2000) suggests that a sample of 100 to 200 respondents should be drawn for a pilot test, but this will vary considerably depending on project resources (e.g., time, budget) and population characteristics. For a study of hikers in a relatively low-use backcountry setting, for example, a realistic and feasible pilot test sample may consist of only 30 to 50 hikers.
When conducting a pilot test, it is desirable to watch or listen to individuals complete the ques-tionnaire to check for signs indicating problems such as respondents being confused, misreading or misunderstanding instructions, being unable to answer questions, or straining to maintain focus due to questionnaire length and completion time (Salant & Dillman, 1994). It is also informative to debrief people after completing the questionnaire and ask questions such as:
• Were there any questions or statements that you did not understand or were confusing?• Were any questions too difficult to answer?• Were any questions double-barreled (i.e., two questions, but only one answer choice)?• Were there any questions that you thought were overly sensitive or objectionable?• Were there any questions or statements that may have biased your answers?• Were any questions or statements factually inaccurate?• Were there any questions that you think should have been asked but were not?• Was the formatting of response categories easy to follow?• Were all possible response categories included for each close-ended question?• Were skip patterns (if any) easy to follow?• Was the questionnaire too long?• Did the flow or organization of the questionnaire make sense, or did it seem disorganized?• Was the questionnaire cluttered, or was the appearance distracting?• Did the questionnaire create a positive impression that motivated you to respond?• Did you notice any spelling or grammatical errors?
Pilot testing questionnaires with small groups helps to identify problems that were not obvious to the researcher such as issues causing low response rates, entire pages or sections being skipped, questions not being answered, and items not correlating in a way that allows scales to be built.
Final Checks
A last step before administering a questionnaire to a larger sample is to perform a final check of the instrument to ensure that no errors are present. A few people who have not been involved

surveyimplementation,sampling,andweightingdata 175
in any stages of project development or questionnaire construction should be asked to read and answer the questionnaire as both respondents and proofreaders. Researchers who are closely involved with questionnaire design and revisions often read questions and response options so many times that they lose their ability to detect obvious problems (Dillman, 2000).
A final check can reveal subtle but important errors. In one of the authors’ studies, for example, a final check showed that one scale response option was written as “slightly impotent” instead of “slightly important.” Word processing software that automatically checks spelling would not have detected this embarrassing error. In the same questionnaire, a five-point scale was written as: “very unacceptable,” “unacceptable,” “neither,” “acceptable,” and “very unacceptable.” Obviously, “very unacceptable” should not have been listed twice. These errors went unnoticed even after the questionnaire had already gone through 23 revisions based on expert advice at various stages, multiple reviews by three investigators, and a pilot test of over 200 respondents!
Taken together, objectives of pilot tests, expert advice, and final checks are to obtain feedback about questionnaire wording and design, and test validity and reliability of questions and scales measuring complex or multidimensional concepts (see chapter 18). Questionnaires should be revised based on input and results from these preliminary but important steps before selecting a larger sample from a population and proceeding with the main data collection effort.
Minimizing Error in Survey Research
Survey research involves administrating questionnaires to a sample of respondents selected from a larger population. Samples are used for making inferences about the population of interest. Unlike a census where everybody is surveyed, responses from a sample of people almost never perfectly match the population. Survey sampling is the art and science of “coming close” and producing “good estimates” of what people think or do (Salant & Dillman, 1994).
When conducting a survey, the researcher must start by identifying the element or unit about which information will be collected. Examples of elements include people, households, families, social clubs, corporations, and organizations. In random samples (discussed later), elements are the units of analysis and provide the basis for analysis of results. The theoretically specified aggregation of these elements forms a population. The survey population consists of the aggre-gation of elements from which the sample is actually selected and to which results will be generalized. The element or set of elements considered for selection in a sampling stage is the sampling unit. Single-stage samples consist of primary sampling units, which are the same as elements (e.g., random sample of hunters; every 5th person at trailhead). Multistage samples may employ different levels of sampling units such as primary (e.g., census blocks in a city) and secondary (e.g., individuals at select households in these blocks) sampling units. The sampling frame is the list from which a sample or some stage of the sample will be drawn to represent the survey population, whereas a sample consists of all observation units that are selected for inclusion in the survey. Finally, a completed sample consists of units that partici-pated in the survey by completing a questionnaire (Dillman, 2000, 2007).
Before administering questionnaires, researchers need to address questions such as:

176 surveyresearchandanalysis:applicationsinparks,recreation,andhumandimensions
• How many completed questionnaires (i.e., completed sample) are needed, and how many people need to be selected in a sample to attain this many completed questionnaires?
• Should everyone in the sampling frame and sample have an equal chance to complete the questionnaire, or should it be targeted only to select groups of individuals?
• What is the most appropriate way to select the sample from the sampling frame given project constraints (e.g., cost, time, personnel) and desired accuracy and precision?
• How high should the response rate be?• How accurate will the results be?
Each of these questions should be addressed to minimize errors. Common sources of prob-lems in survey research include errors in coverage, measurement, nonresponse, and sampling.
Coverage Error
A completed sample can only be used to provide information about the sample, sampling frame, and survey population (Babbie, 2003; Salant & Dillman, 1994). Coverage error occurs with a discrepancy between the target population and subset of individuals who are included in the sampling frame. This error occurs, for example, when the list of individuals from which the sample is selected is not inclusive of all elements of the population of interest (Dillman, 2000). If there is error in coverage, all elements of the target population do not have an equal or known chance of being included in the sample. If the sample is not representative of the population, it is difficult to use survey results to generalize to the broader target population.
Coverage error can occur in all types of surveys. For example, if a mail survey was commis-sioned to examine Colorado residents’ attitudes toward wolf reintroduction and questionnaires were only sent to residents of Colorado’s urban east slope (e.g., Denver, Colorado Springs, Fort Collins), findings would likely show support for wolf reintroduction. Research shows that posi-tive attitudes toward wolves are more prevalent among urban than rural residents and among people who live far from wolf reintroduction sites than those who live close to sites (e.g., Bright & Manfredo, 1996). This methodology, however, represents an error in coverage and as a result, this finding would not be representative of or generalizable to all Colorado residents. To ensure adequate coverage of the population, questionnaires should also be mailed to individ-uals living in Colorado’s rural west slope region (e.g., Kremmling, Craig, Meeker).
One way to overcome coverage error is to get an accurate up-to-date list of everybody in the target population. This may be a simple task if the population is relatively small and easily identifiable (e.g., students in a class, clients at a hunting camp). General population lists or infor-mation about other large or diffuse groups, however, pose a greater challenge. Tax records, telephone directories, lists of utility hookups, voter registration lists, and lists from private firms such as Survey Sampling International (SSI) can be useful for obtaining contact information for the general public. There are several texts discussing strengths and weaknesses of various sources of sample lists (Babbie, 2003; Dillman, 2000, 2007; Fowler, 1993; Salant & Dillman, 1994). Researchers should evaluate a list and assess whether it is updated and maintained regularly, contains everyone in the population, does not include people who are not in the study population, and does not contain entries listed more than once (Dillman, 2007). Lists must be considered individually; a list used for one survey may not be suitable for another survey.

surveyimplementation,sampling,andweightingdata 177
In parks, recreation, and human dimensions research, lists for more specific populations can also be obtained from sources such as hunting and fishing license sales or reservation / regis-tration data (e.g., trail or campground permits). These lists, however, do not always guarantee perfect coverage because not everybody complies with requirements such as completing a trailhead registration card or purchasing a fishing license. For many studies, population lists such as these may also be unavailable. Many backcountry recreation areas, for example, con-tain multiple entry points (e.g., trailheads) and people show up at a particular location without being required to complete a registration card or other method for recording contact informa-tion. One strategy, therefore, would be to ask people to complete the questionnaire on-site, or ask people for their contact information and then follow up with a mail, telephone, or elec-tronic survey.
Coverage error does not always occur because of incorrect or incomplete sampling lists. As illustrated earlier in the Colorado wolf reintroduction example, coverage error can occur when spatial differences are present in the population (e.g., east vs. west slope residents). Coverage error can also occur when researchers have not ensured adequate coverage across time and among subgroups of the population. In many recreation studies, for example, surveys should be administered in different seasons (e.g., high, shoulder, low seasons), at various times of the week (e.g., weekday, weekend), and with multiple activity groups (e.g., anglers, hikers) to account for differences in recreationists’ characteristics and visitation patterns (Mitra & Lankford, 1999).
Measurement Error
Unlike coverage error, which is related to lists of samples or populations, measurement error occurs when data are collected and a respondent’s answers are imprecise, inaccurate, or cannot be compared to answers provided by other respondents (Beimer, 1991; Dillman, 2000; Krosnick, 1999). Measurement error is the difference between a respondent’s answer and the “correct” answer and can occur because of poor questionnaire wording and construction, type of survey, influence of the interviewer, or behavior of the respondent (Salant & Dillman, 1994).
Chapter 7 provided the following example of a question with vague quantifiers:
About how often did you go hiking during the past year? (Please check one)
c Never c Rarely c Occasionally c Regularly
These response options can generate measurement error because they may not be understood in the same way by all respondents. One person, for example, may interpret “rarely” to mean three to five times and “occasionally” to imply 6 to 10 times. Another person may think that “rarely” means once a month (i.e., 12 times in the past year) and “occasionally” refers to twice a month (i.e., 24 times per year). In addition to question wording, design of the questionnaire can also influence measurement error. If the questionnaire is cluttered and it is difficult to read and reply to questions (see Figure 7.1), people may answer incorrectly or skip questions altogether.

178 surveyresearchandanalysis:applicationsinparks,recreation,andhumandimensions
As discussed in chapter 7, different types of surveys place different demands on respondents. In telephone surveys, for example, interviewers have control over the speed in which questions are asked and answered, and respondents rely on information conveyed by interviewers. Conversely, mail surveys give respondents more control over the order and speed in which questions are read and answered. For some questions, different types of surveys may provide different results than other types, thus inflating measurement error (see Tables 7.3, 7.4).
Interviewers can also be a source of measurement error (Groves & McGonagle, 2001). In tele-phone surveys and interviewer-completed on-site surveys, for example, interviewers can bias respondents’ answers through actions such as shortening questions that unintentionally change their meaning or adding phrases such as “This is an easy question for which everybody says yes” or “You oppose this strategy, right?” Even subtle interviewer behavior such as wearing a hat embroidered with “Save the Whales” when conducting an in-person survey about environmental issues can bias responses. Interviewers should remain as neutral and objective as possible.
Measurement error also occurs when respondents inadvertently or deliberately provide incorrect answers (Beimer, 1991). Parks, recreation, and human dimensions studies, for example, often ask people to report their willingness to pay for nonmarket goods such as access to a hiking trail or overnight stays at a wilderness campsite. People may strategically report low numbers so that they do not have to pay a high fee or they may report high numbers so that they will be the only person who could afford the fee and will have the area to themselves. Clearly, neither answer is “correct.” To avoid these various sources of measurement error, it is important to carefully select the most appropriate survey method, write clear and unambiguous questions and response options, and train personnel to the fullest extent possible (Salant & Dillman, 1994). Consulting the literature, seeking expert advice, and pilot testing of questionnaires also help minimize measurement error.
Nonresponse Error
People without training in survey research often believe that if a large sample size is obtained, data will always be representative of and generalizable to the population of interest (Dillman, 2007). This is not true. Nonresponse error occurs when “a significant number of people in the survey sample do not respond to the questionnaire and are different from those who do in a way that is important to the study” (Salant & Dillman, 1994, p. 20). For example, if a questionnaire about residents’ attitudes toward increasing fees in national parks was mailed to 100,000 people across the country and 5,000 questionnaires were completed and returned, this relatively large sample size might look impressive to the untrained observer. The low response rate (5%), however, should be a warning sign for problems associated with nonresponse error. Results from the 5,000 respondents may show support for a fee increase, but careful examination of these people may show that they have never visited a national park so may be unaffected by a fee increase. People who visit parks may be underrepresented in this sample, so despite the large sample size, results would not be representative of the 95% of people who did not respond. It is not always the sample size that counts most; the response rate may be more important.
One way to help minimize nonresponse error is to aim for a high repose rate (Bailar, 1987; Krosnick, 1999; Pearl & Fairley, 1985). If a high response rate is not achieved, a nonresponse bias check should be conducted to compare those who responded to the questionnaire to those

surveyimplementation,sampling,andweightingdata 179
who did not respond. If results differ between respondents and nonrespondents, data may need to be weighted. Methods for encouraging high response rates, conducting nonresponse bias checks, and weighting data are discussed later in this chapter.
Sampling Error and Selecting Sample Sizes
When conducting a survey and having a sample from a larger population complete a question-naire, there is always some degree of sampling error because sample statistics are rarely equal to population parameters (Bailar, 1987; Krosnick, 1999). Sampling error is the extent to which a sample is limited in its ability to perfectly describe a population because only some, and not all, elements in the population are sampled (Dillman, 2000). One way to avoid sampling error is to conduct a census (i.e., survey the entire population). Given costs in time, personnel, and financial resources, a census is often not realistic or feasible for most studies. Sampling error, however, can be minimized by increasing sample size.
Survey research allows investigators to estimate with precision the extent to which a popula-tion has a particular attribute simply by obtaining data from only a small sample of the total population. To minimize sampling error, it is usually advantageous to select a relatively large sample size. If a large enough sample size is obtained and potential problems related to cover-age, nonresponse, and measurement errors have been minimized, the sample data may be representative of and generalizable to the target sample population. The sample data, however, may not estimate the entire population. If a mail survey about hunting regulations was com-pleted by a large random sample of deer hunters in Utah, for example, results may allow fairly precise estimates for the population of Utah deer hunters. It would be a bold and incorrect claim, however, to say that these data are representative of all Utah hunters because deer hunters may feel differently about regulations than people hunting waterfowl, elk, bear, or other species.
Deciding on how large a sample should be depends on answering several questions:
• How much sampling error can be tolerated?• How small or large is the size of the target population?• How varied is this population with respect to characteristics of interest to the project?• What is the smallest subgroup within the sample for which estimates are needed?
Sampling error is often calculated and communicated in terms of a level of confidence (i.e., confidence interval; see chapter 6) that results are within plus or minus some margin of error. In most parks, recreation, and human dimensions studies, it is desirable to obtain enough com-pleted questionnaires to allow the researcher to be 95% confident that estimates from the data are within ±5% (or points) of the sample population. This means that 95 out of 100 times (95% of the time) that there is a random sample from a population the estimate ±5% will contain the population value assuming no nonresponse, measurement, or coverage errors. In other words, chances are 19 out of 20 that the population value is within 5% of the estimate in either direction. For example, if a random sample of 400 hikers in Sky Lakes Wilderness in Oregon showed that 63% of hikers supported requiring dogs be kept on leash, researchers can be 95% confident that between 58% and 68% of all hikers in this wilderness area would support this action if all hikers in the area had been surveyed.

180 surveyresearchandanalysis:applicationsinparks,recreation,andhumandimensions
Table 8.1 Completed Sample Sizes Needed for Population Sizes and Characteristics at Three Levels of Precision
Sample size for the 95% confidence level
± 3% sampling error ± 5% sampling error ± 10% sampling error
50/50 split 80/20 split 50/50 split 80/20 split 50/50 split 80/20 split
100 92 87 80 71 49 38200 169 155 132 111 65 47400 291 253 196 153 78 53600 384 320 234 175 83 56800 458 369 260 188 86 571,000 517 406 278 198 88 582,000 696 509 322 219 92 604,000 843 584 351 232 94 616,000 906 613 361 236 95 618,000 942 629 367 239 95 6110,000 965 640 370 240 95 6120,000 1,013 661 377 243 96 6140,000 1,040 672 381 244 96 61100,000 1,056 679 383 245 96 611,000,000 1,066 683 384 246 96 611,000,000,000 1,067 683 384 246 96 61
Sources: Dillman (2000, 2007), Salant and Dillman (1994)
Table 8.1 is from Dillman (2007) and Salant and Dillman (1994), and lists sample sizes needed to estimate population percentages for various population sizes and levels of sampling error. In this table, a 50/50 split means that the population is completely divided in their responses. The researcher would expect 50% of the population to answer one way (e.g., support, agree) and 50% to answer the other way (e.g., oppose, disagree). A 50/50 split is the most conservative value possible. An 80/20 split means that answers are less variable; many people respond one way or have a certain characteristic, whereas a few do not. If researchers have little or no knowledge about the diversity of characteristics and opinions among the population, the conservative 50/50 split approach is recommended (Salant & Dillman, 1994). For most parks, recreation, and human dimensions studies, therefore, a sample size of approximately 400 is often considered to be suit-able for generalizing to a population at a 95% confidence level with a ±5% margin of error.
Dillman (2007) provides the following formula for estimating desired sample sizes:
Ns =( Np )( p)(1− p)
( Np −1)(B / C)2 + ( p)(1− p) Equation 8.1
where: Ns = completed sample size needed (notation often used is n) Np = size of population (notation often used is N) p = proportion expected to answer a certain way (50% or 0.5 is most conservative) B = acceptable level of sampling error (0.05 = ±5%; 0.03 = ±3%) C = Z statistic associate with confidence interval (1.645 = 90% confidence level;
1.960 = 95% confidence level; 2.576 = 99% confidence level)

surveyimplementation,sampling,andweightingdata 181
To illustrate, for a question with a 50/50 split in a population that consisted of 4,200 people, a sample size of 352 is needed to be 95% confident that the sample estimate is within ±5% of the true population value. The formula for this example is:
Ns = (4,200)(0.5)(1− 0.5)
(4,200 −1)(0.05/1.96)2 + (0.5)(1− 0.5)= 352
If the sample size and population size are known, a margin of error is calculated from:
B = C p (1− p)
Ns
− p(1− p)
Np Equation 8.2
To illustrate, if the completed sample size (Ns) is 1,126 and the population size (Np) is 1,812,374, the margin of error (i.e., sampling error) at the 95% confidence level with a 50/50 split would be 0.029 or ±2.9% of the true population value. The formula for this example is:
B = 1.960.5(1− 0.5)
1,126− 0.5(1− 0.5)
1,812,374= 0.029
There are some useful websites that will quickly perform calculations to estimate sample size and margin of error (e.g., http://www.custominsight.com/articles/random-sample-calculator.asp).
With large population sizes (e.g., over 100,000), there is little difference in sample sizes needed to achieve a small amount of sampling error. As a result, most statewide or national polls are based on 1,100 to 1,200 completed questionnaires to allow estimates of the population within a ±3% margin of error at the 95% confidence level (Salant & Dillman, 1994). Just because so few responses are needed for estimating such a large population, however, does not mean that only a small fraction of that number is needed for generalizing to a much smaller group (e.g., small town, recreation site). With smaller population sizes, a much greater proportion of the population needs to be sampled and complete a questionnaire to achieve a given margin of error. This does not imply that a census (i.e., survey everyone) must be conducted if the population is small. For example, doing a poor job surveying all 1,000 members of a population so that 350 people reply (i.e., 35% response rate; discussed later) is less cost-effective and increases chances of nonre-sponse error compared to doing a good job sampling only 500 people and encouraging a high response rate that produces the same number of responses (e.g., 350 people, 70% response rate). Strategies for improving response rates are discussed later in this chapter.
When approximating sample sizes and sampling error, it is also important to consider the smallest subgroup within the sample for which estimates are needed. If 1,000 resident deer hunters in Colorado, for example, completed a questionnaire asking about their participation in this activ-ity, the sampling error would be approximately ±3% with a confidence level of 95% (population of Colorado resident deer hunters is approximately 60,000 per year). If these hunters were seg-mented into three relatively equal sized subgroups based on a characteristic (e.g., low, medium, and high skill level; young, middle age, older), however, the margin of error would increase to approximately ±5% for each subgroup when examining each third of the sample at a time. Segmenting samples into subgroups for analysis increases sampling error, so if it is important to understand characteristics and opinions of different subgroups, sample sizes should be increased.

182 surveyresearchandanalysis:applicationsinparks,recreation,andhumandimensions
Obtaining large sample sizes may not always be possible because of circumstances such as project budget, timeline, availability of personnel, and complexity of sampling methodology. Tradeoffs in the desired margin of error and precision with which estimates about the population can be made must be weighed against these factors as well as any additional expenditures that may be necessary for minimizing other sources of error (i.e., coverage, measurement, nonresponse).
Types of Sampling Approaches
In any survey, the first step to collecting data is to define in precise terms the population or community of individuals whose opinions are sought (Babbie, 2003; Mitra & Lankford, 1999). In parks, recreation, and human dimensions of natural resources, populations may be as broad as the general population in a state or country, or as specific as hikers on a particular section of trail. Once the population has been defined, it is necessary to obtain a list of the entire group so that a sample can be selected. As discussed earlier, there are various outlets for obtaining survey lists (e.g., tax records, telephone directories, lists of utility hookups, voter registration lists), but when lists are unavailable, on-site survey methods may be the only alternative. Lists should be checked for accuracy including whether there are any duplicates, omissions, and ineligible members.
Once the population has been defined and a list of members has been obtained, it is necessary to choose a method for selecting a sample that represents the population from which it was drawn. Sampling is the process of selecting observations, which gives social scientists the capability of describing a larger population based on only a selected portion of that population. Representativeness involves a process where all constituencies in the population have a known chance of being selected in the sample and the sampling procedure ensures that the sample contains the same characteristics as the population (Mitra & Lankford, 1999). A sample is representative of the population from which it was selected if characteristics of the sample closely approximate the same characteristics in the population for issues that are of interest in the study. Unless the sample is at least moderately representative of the population, it is difficult to make predictions about the population from which the sample was selected. Making statements such as “we are 95% confident that this estimate is within ± 5% of the true population” requires a degree of randomness to be built into the sampling design. This means that every unit or person in the population has a known nonzero chance of being selected for inclusion in the sample.
Sampling designs that strive for representativeness and are based on randomness are called probability samples. Probability sampling involves random samples, requires relatively few observations, and allows results to generalize to the larger target population. A probability sample will be representative of the population from which it was selected if all members of the popu-lation have a known nonzero chance of being selected (Morgan & Harmon, 1999). There are two main advantages of probability sampling. First, probability theory allows researchers to estimate accuracy or representativeness of a sample (e.g., sampling error). Second, probability samples are more representative than other types of samples because biases are avoided. Bias in connection with sampling occurs when units or individuals in the sample are not representative of the population. Bias would occur, for example, if the researcher avoided including certain types of people in the sample (e.g., only selected male hikers for an on-site trailhead survey).

surveyimplementation,sampling,andweightingdata 183
If a sample is selected where the researcher makes a subjective judgment to include or exclude certain individuals, the integrity of the selection process may be compromised and it may be difficult to generalize results to a larger population. This is called nonprobability or purposive sampling. Convenience samples and focus groups are examples of nonprobability samples because some members of the population have a high chance be included in the sample, whereas others may have little or no chance of being selected. Nonprobability samples are useful for elicitation or exploratory studies that may generate new ideas to be systematically tested later using probability sampling techniques. After collecting data from nonprobability or convenience samples, researchers may examine demographic characteristics of their sample and conclude that respondents are similar to those in the larger population. Although this indicates an attempt to check for representativeness, similarities do not prove that the sample is representative of the population (Morgan & Harmon, 1999). Nonprobability samples should not be used to make inferences about the population because they may introduce bias and researchers are limited in their ability to determine the accuracy of nonprobability estimates (Salant & Dillman, 1994).
Given that this book focuses on asking a sample of people to complete a questionnaire and using results to generalize to the sample population, it examines probability as opposed to nonprob-ability samples. There are several methods of probability sampling (see Fowler, 1993; Lohr, 1999; Scheaffer, Mendenhall, & Ott, 1996, for reviews). Single stage sampling approaches (i.e., single set of primary sampling units) include simple random, systematic, stratified, and cluster samples. Multistage sampling approaches may use both primary (e.g., census blocks in a city) and secondary (e.g., individuals at select households in these blocks) sampling units and a combination of different sampling techniques (e.g., cluster sample combined with a stratified sample). Decisions about what type of approach to choose depend on the purpose of the study, type of population being surveyed, and availability of resources (e.g., personnel, time, budget).
Simple Random Sampling
Perhaps the most common and basic sampling method is simple random sampling (SRS), which consists of selecting a group of sampling units (e.g., people) in such a way that each member of the target population or each sample of a specific size has an equal chance of being selected (Scheaffer et al., 1996). For example, if a target population consisted of 100,000 hikers, a simple random sample of 1,000 hikers means that every member of this population has a 1 in 10 chance of being selected. Simple random samples are reasonably unbiased, but they require that all members of the target population be included in the list; if some members are missing, they do not all have the same chance of being selected (Morgan & Harmon, 1999).
To select a simple random sample, researchers might choose haphazard sampling by using their own judgment to “randomly” select a sample. A second method called representative sampling involves selecting a sample that the researcher considers to be “representative” or “typical” of the population (Scheaffer et al., 1996). Both haphazard and representative methods are subjec-tive and prone to researcher bias so they are not “random” by definition and are not appropri-ate for probability samples. There are several more rigorous methods for selecting simple random samples such as using lotteries, random number tables, or statistical software.
Lottery techniques simply involve using approaches such as picking numbers out of a hat that contain sampling units (i.e., individual names, contact information) written on thoroughly mixed
184 surveyresearchandanalysis:applicationsinparks,recreation,andhumandimensions
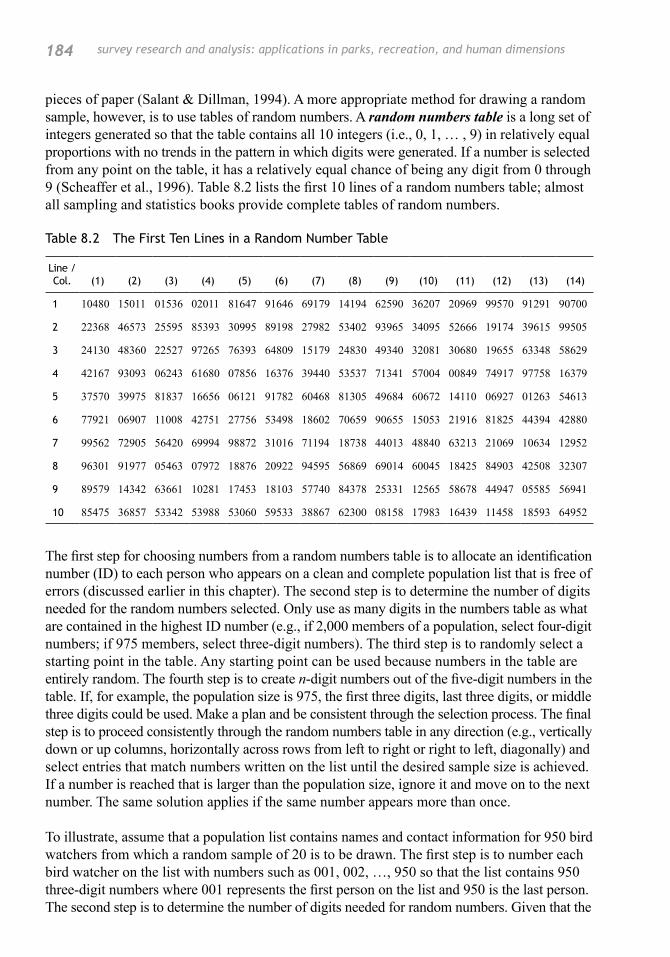
pieces of paper (Salant & Dillman, 1994). A more appropriate method for drawing a random sample, however, is to use tables of random numbers. A random numbers table is a long set of integers generated so that the table contains all 10 integers (i.e., 0, 1, … , 9) in relatively equal proportions with no trends in the pattern in which digits were generated. If a number is selected from any point on the table, it has a relatively equal chance of being any digit from 0 through 9 (Scheaffer et al., 1996). Table 8.2 lists the first 10 lines of a random numbers table; almost all sampling and statistics books provide complete tables of random numbers.
Table 8.2 The First Ten Lines in a Random Number Table
Line /Col. (1) (2) (3) (4) (5) (6) (7) (8) (9) (10) (11) (12) (13) (14)
1 10480 15011 01536 02011 81647 91646 69179 14194 62590 36207 20969 99570 91291 90700
2 22368 46573 25595 85393 30995 89198 27982 53402 93965 34095 52666 19174 39615 99505
3 24130 48360 22527 97265 76393 64809 15179 24830 49340 32081 30680 19655 63348 58629
4 42167 93093 06243 61680 07856 16376 39440 53537 71341 57004 00849 74917 97758 16379
5 37570 39975 81837 16656 06121 91782 60468 81305 49684 60672 14110 06927 01263 54613
6 77921 06907 11008 42751 27756 53498 18602 70659 90655 15053 21916 81825 44394 42880
7 99562 72905 56420 69994 98872 31016 71194 18738 44013 48840 63213 21069 10634 12952
8 96301 91977 05463 07972 18876 20922 94595 56869 69014 60045 18425 84903 42508 32307
9 89579 14342 63661 10281 17453 18103 57740 84378 25331 12565 58678 44947 05585 56941
10 85475 36857 53342 53988 53060 59533 38867 62300 08158 17983 16439 11458 18593 64952
The first step for choosing numbers from a random numbers table is to allocate an identification number (ID) to each person who appears on a clean and complete population list that is free of errors (discussed earlier in this chapter). The second step is to determine the number of digits needed for the random numbers selected. Only use as many digits in the numbers table as what are contained in the highest ID number (e.g., if 2,000 members of a population, select four-digit numbers; if 975 members, select three-digit numbers). The third step is to randomly select a starting point in the table. Any starting point can be used because numbers in the table are entirely random. The fourth step is to create n-digit numbers out of the five-digit numbers in the table. If, for example, the population size is 975, the first three digits, last three digits, or middle three digits could be used. Make a plan and be consistent through the selection process. The final step is to proceed consistently through the random numbers table in any direction (e.g., vertically down or up columns, horizontally across rows from left to right or right to left, diagonally) and select entries that match numbers written on the list until the desired sample size is achieved. If a number is reached that is larger than the population size, ignore it and move on to the next number. The same solution applies if the same number appears more than once.
To illustrate, assume that a population list contains names and contact information for 950 bird watchers from which a random sample of 20 is to be drawn. The first step is to number each bird watcher on the list with numbers such as 001, 002, …, 950 so that the list contains 950 three-digit numbers where 001 represents the first person on the list and 950 is the last person. The second step is to determine the number of digits needed for random numbers. Given that the

surveyimplementation,sampling,andweightingdata 185
largest number is 950, only three-digit numbers are needed. The third step is to randomly select a starting point, which for this example will be column 10, line 1 in Table 8.2 (36207). The fourth step would be to drop, for example, the last two digits of each number in the table so that only the first three digits will be used to correspond to the 950 bird watchers. The final step is to proceed through the table and select numbers. Proceeding horizontally across the table, the first three-digit number is 362, the second is 209, the third is 995, the fourth is 912, and so on. Because 995 exceeds the number of cases in the population (950), it does not match and is, therefore, skipped. A simple random sample of 20 individuals would create the sample of numbers shown in Table 8.3.
Statistical software packages such as SPSS (see chapters 9 and 10) and even Microsoft Excel can also be used to rapidly generate a sim-ple random sample. Population lists containing names or contact information can often be imported from other programs into these software packages. In SPSS, a random sample can be generated using drop-down menus (Data > Select cases… > Random Sample of Cases…) or simply typing and running syntax (e.g., Sample 20 from 950. Execute). Chapters 9 and 12 provide more information about SPSS commands.
Systematic Sampling
Simple random sampling techniques can be cumbersome, especially when combined with long lists or applied to on-site survey research (Salant & Dillman, 1994). An alternative method is systematic sampling, which involves randomly selecting the first unit (i.e., person) in a sample population, choosing an appropriate fixed interval, and systematically selecting subsequent units (Fowler, 1993; Morgan & Harmon, 1999). For example, if a sample population list contained 10,000 anglers and a sample of 1,000 anglers is desired, it is possible to choose every 10th person on the list. To guard against any bias, it is critically important to select the first unit (i.e., person) at random. For an on-site study such as a trailhead survey, a person can be selected at random to be the first to complete the questionnaire followed by every nth (e.g., 15th) person. Compared to simple random samples, this systematic approach to on-site surveys is easier to perform in the field and is less subject to selection errors by field researchers, especially if a good sampling frame is unavailable (Babbie, 2003; Scheaffer et al., 1996; Thompson, 1992).
In addition to being easier to perform and less susceptible to researcher error, systematic sampling can provide more information per unit cost than simple random sampling because the sample tends to be more uniformly spread over the entire population (Scheaffer et al., 1996). To illus-trate, assume that a population list contained 1,000 boat-based whale watchers and a 1-in-5 systematic sample was desired so that the sample size would be n = 200. The first whale watcher is randomly selected from among the first few on the list (e.g., fourth person on the list) and every fifth person thereafter is selected for inclusion in the sample. Suppose, however, that the list is arranged so that most of the first 500 people on the list had gone whale watching with one particular company and the remaining 500 had participated with another company. If simple
Table 8.3 Bird Watchers to be Included in the Sample of 20
362 465 279 191
209 255 534 396
912 853 939 241
907 309 340 483
223 891 526 225

186 surveyresearchandanalysis:applicationsinparks,recreation,andhumandimensions
random sampling had been used, there is a possibility that most, if not all, of the 200 whale watchers chosen for the sample could have been selected just from the first 500 people or just the second 500 people. Results, therefore, would only be representative of whale watchers who had participated with a single company; findings would not be representative of all whale watchers across both companies included in the sample. A systematic procedure would have selected equal numbers of whale watchers from the two companies and may have increased the likelihood of achieving a more representative and generalizable sample (Scheaffer et al., 1996).
Two terms are frequently used in connection with systematic sampling. First, sampling interval is the standard distance between units (e.g., people) selected in the sample (e.g., five in the preceding whale watching example). The sampling interval is calculated as follows:
size sample
size population interval sampling =
Equation 8.3
Second, sampling ratio is the proportion of units in the population that are selected (e.g., 1⁄5 in the whale watching example). Sampling ratio is expressed with Equation 8.4.
size population
size sample ratio sampling =
Equation 8.4
To select a systematic sample, the researcher must choose the sampling ratio needed to obtain a specific sample size. The ratio could, for example, be 1 in 3, 1 in 5, 1 in 10, 1 in 100, or in general 1 in k. For a systematic sample of n (or Ns) units (e.g., people) from a population of size N (or Np), k must be less than or equal to N / n. For example, if the population of interest was N = 30,000 and the required sample size to achieve a ± 5% margin of error at the 95% confidence level was n = 400, k would be 75; the researcher would select every 75th person after randomly selecting the first individual. If k < 75, the sample size would be greater than 400 people.
It is challenging to determine a value for k when the size of the sampling population is unknown. In outdoor recreation settings, for example, agencies may not have accurate data on total use levels for particular activities. In this case, researchers must determine a desired sample size and margin of error (see Table 8.1), and then estimate the value of k needed to reach this sample size. It may be prudent to select a conservative value for k because if it is too large, the required sam-ple size may not be obtained through a systematic sample (Scheaffer et al., 1996).
Arrangements in a population list can make systematic sampling dangerous and unwise. Such an arrangement is often called periodicity. If the list of elements is arranged in a cyclical pattern that coincides with the sampling interval, a biased sample may be drawn. Assume that in a study of World War II soldiers, for example, researchers selected every 10th soldier on the roster. The rosters, however, were arranged by squad according to rank with privates listed first, followed by corporals, and then sergeants. Each squad had 10 members. As a result, every 10th person on the roster was a sergeant and the systematic sample contained only sergeants. Before drawing a systematic sample from a list, therefore, researchers should examine the nature of that list. If elements are arranged in any particular order, the researcher must determine whether that order will bias the sample and then take steps necessary to counteract any possible bias.

surveyimplementation,sampling,andweightingdata 187
Stratified Random Sampling
Stratified random sampling involves: (a) dividing the sample population into different non-overlapping groups (i.e., strata) that are of interest or deserve special attention because of project objectives or hypotheses, and then (b) selecting a simple random sample from each stratum (Fowler, 1993; Morgan & Harmon, 1999; Scheaffer et al., 1996; Thompson, 1992). The resulting stratification helps to determine any differences among subgroups.
Stratified samples are useful for two primary reasons. First, many populations contain subgroups that are of particular interest to parks, recreation, and human dimensions researchers. For example, if a park manager was interested in the extent to which visitors would support and be willing to pay a user fee to enter the park, it would be useful to examine people in distinct income brackets (e.g., high, low). Opinions of visitors in a high income bracket may differ from those in a lower bracket.
Second, homogenous populations produce samples with less sampling error than heterogeneous populations. If 99% of the population agrees with a certain issue, for example, it is extremely unlikely that a probability sample will greatly misrepresent the extent of agreement. If the pop-ulation is split (e.g., 50% agree, 50% disagree), however, sampling error will be much greater. Rather than selecting a sample from the total population at large, it would be more informative to select appropriate samples from more homogeneous subgroups of the population.
To obtain accurate information about populations of interest, it is important to ensure an adequate sample size of people in each subgroup. An assumption of stratified samples is that sample sizes of subgroups are reasonably comparable (i.e., relatively equal) and allow for tests of statistical differences among groups (Mitra & Lankford, 1999). Chapters 14 (means and t-tests) and 15 (analysis of variance) introduce statistical tests for examining differences among groups.
The ultimate objective of stratification is to organize the population into more homogeneous and meaningful subgroups (with heterogeneity between subgroups), and to select the appropriate number of people from each group. If there are two levels to the stratification variable (e.g., men, women), for example, recall from the sample size determination (see equation 8.1) and Table 8.1 (p. 180), that a final sample size of at least 768 (e.g., 384 men, 384 women) would be required to discuss findings in terms of the 95% confidence level with a ± 5% margin of error.
Table 8.4 (p. 188) shows a stratified sampling design used in a study of public values toward forests (Vaske & Donnelly, 1999). This study was interested in the extent to which newcomers to Colorado differed from long-time residents in terms of their views on how national forests should be managed and their value orientations toward forests. Notice that the simple random sample method yields a dramatically different solution than the stratified sample. In this study, the stratification dimension was length of time a person had lived in the state (i.e., short vs. long). Researchers should select stratification variables that they want to represent accurately.
One limitation of stratified sampling is that the ability of obtaining aggregate results for the total sample population irrespective of subgroups may be compromised (Mitra & Lankford, 1999; Scheaffer et al., 1996). Suppose, for example, that an objective of a hypothetical study about wolf reintroduction in Colorado is to examine differences in attitudes between rural farm / ranch owners and the rest of the state’s population. A stratified design is implemented and 1,000 rural

188 surveyresearchandanalysis:applicationsinparks,recreation,andhumandimensions
Table 8.4 Comparison Between Simple Random Sampling and Stratified Random Designs
County Post office nameSurvey group
(Strata) ZipPopulation
size % of popSRS � (n)
% of strata
Stratified sample (n)
Montezuma Lewis Oldtimers 81327 1,074 1.53% 14 2.22% 7Montezuma Yellow Jacket Oldtimers 81335 349 0.50% 4 0.72% 2Montezuma Towaoc Oldtimers 81334 1,146 1.64% 15 2.37% 7Montezuma Pleasant View Oldtimers 81331 349 0.50% 4 0.72% 2Rio Grande Del Norte Oldtimers 81132 2,792 3.99% 36 5.77% 17Rio Grande Monte Vista Oldtimers 81144 6,159 8.79% 79 12.74% 38Alamosa Alamosa Oldtimers 81101 13,617 19.44% 175 28.17% 84Conejos Sanford Oldtimers 81151 4,080 5.83% 52 8.44% 25Conejos La Jara Oldtimers 81140 1,149 1.64% 15 2.38% 7Conejos Antonito Oldtimers 81120 2,294 3.28% 29 4.74% 14Costilla San Pablo Oldtimers 81153 624 0.89% 8 1.29% 4Costilla San Luis Oldtimers 81152 345 0.49% 4 0.71% 2Montrose Nucla Oldtimers 81424 1,536 2.19% 20 3.18% 10Montrose Redvale Oldtimers 81431 1,064 1.52% 14 2.20% 7Montrose Olathe Oldtimers 81425 4,421 6.31% 57 9.14% 27La Platta Ignacio Oldtimers 81137 5,129 7.32% 66 10.61% 32Montrose Crawford Oldtimers 81415 1,200 1.71% 15 2.48% 8Saguache Saguache Oldtimers 81149 1,019 1.45% 13 2.11% 7
Dolores Cahone Newcomers 81320 200 0.29% 3 1.55% 5Hinsdale Lake City Newcomers 81235 467 0.67% 6 3.62% 11San Miguel Telluride PO Boxes Newcomers 81435 2,421 3.46% 31 18.75% 56Ouray Ridgeway Newcomers 81432 1,295 1.85% 17 10.03% 30Gunnison Carbondale Newcomers 81623 8,527 12.18% 110 66.05% 198
Costilla San Acacio Mixed New&Old 81150 996 1.42% 13 11.35% 34San Juan Silverton Mixed New&Old 81433 745 1.06% 10 8.49% 25Montrose Montrose Mixed New&Old 81401 1,730 2.47% 22 19.71% 59Archuleta Pagosa Springs Mixed New&Old 81147 227 0.32% 3 2.59% 8Saguache Center Mixed New&Old 81125 5,081 7.25% 65 57.88% 174
Totals StrataDesired sample
sizePopulation
size Simple random sampleStratified sample
Population 900 70,036 100% 900 900Oldtimers 1 300 48,347 620 300Newcomers 2 300 12,910 167 300Mixed Old & New 3 300 8,779 113 300
� SRS = Simple random sample
Example calculations: % of population = 1,074 / 70,036 = 1.53% SRS (n) = .0153 * 900 = 14 % of strata = 1,074 / 48,347 = 2.22% Stratified Sample (n) = .0222 * 300 = 7
farm / ranch owners and 1,000 other residents are sampled. Statistical comparisons between the two groups show that farm / ranch owners strongly oppose wolf reintroduction, whereas other residents are more supportive of this strategy. If data were to be aggregated across both groups (i.e., all 2,000 people sampled), results would be split (e.g., 50% oppose, 50% support), but this is not representative of the entire population in Colorado because it does not account for differences in population proportions of each group. There are many rural farm / ranch owners in

surveyimplementation,sampling,andweightingdata 189
Colorado, but they are a small minority compared to the rest of the state’s population. If the two samples were aggregated, there would be an overrepresentation of the minority group (i.e., rural farm / ranch owners) and an underrepresentation of the majority group (i.e., all other residents). Estimates for the total based on this sample would be incorrect unless data were weighted accordingly (Mitra & Lankford, 1999). Weighting is discussed later in this chapter.
It is possible to avoid some of these problems when aggregating data with stratified samples by estimating population proportions of each group in advance and using these estimates to deter-mine the proportion of the sample needed for each stratum. If a researcher knew from other data sources (e.g., census data), for example, that 60% of the target population was male and 40% was female, proportionate sample sizes could be selected where 600 males are randomly selected in one stratum and 400 females are chosen in the second stratum. This would minimize the need for weighting data, but requires advance knowledge of population subgroups. In addition, researchers must select large enough samples for each group and address sources of error discussed earlier (e.g., coverage, nonresponse) to allow generalizations about populations.
When deciding to use stratified sampling, it is important to consider project goals, objectives, and hypotheses. Selection of a stratified sample also requires prior knowledge of the population. It is important to have a method for identifying different subgroups and categorizing them into their own lists before selecting random samples from each list. If this information is not avail-able in advance, complicated screening questions would be needed before sampling.
Cluster Sampling
There are some studies where random, systematic, and stratified sampling approaches are not economical in terms of time or budget. In urban areas, for example, it may be more effective to sample specific families, buildings, districts, or city blocks rather than selecting a random sample of people. Cluster sampling involves conducting a simple random sample of groups or clusters and then sampling units (e.g., people) within the selected groups or clusters (Fowler, 1993; Scheaffer et al., 1996). This approach differs from stratified sampling where a random sample is drawn within each group; cluster sampling involves a random sample of groups.
Cluster sampling can be effective when: (a) a good sample list of population units is unavailable or expensive to obtain, but a listing of potential clusters is easily obtainable; and (b) the cost of obtaining completed questionnaires increases as distance separating population and sampling units increases (Rocco, 2003; Scheaffer et al., 1996). A goal of cluster sampling is to identify specific groups of similar types of people. It is assumed that there are geographic areas or other clusters where a greater probability exists for sampling desired units or individuals. If these areas or clusters can be identified in advance, cost and time to complete data collection can be less than other approaches (e.g., simple random). For example, if a study examines recreation participation among Hispanics in an urban area where only 5% of the population is Hispanic, and the researcher wants a sample size of 2,000 Hispanics, 40,000 questionnaires would need to be completed just to obtain a sample of 2,000 Hispanics. Given that most urban areas contain neighborhoods that are largely populated by specific minority groups (Mitra & Lankford, 1999), it may be more efficient to use cluster sampling by identifying areas that are predominantly Hispanic, conducting a random sample of these areas, and then sampling within selected areas.

190 surveyresearchandanalysis:applicationsinparks,recreation,andhumandimensions
The first step in cluster sampling is to identify appropriate clusters. Units (e.g., people) within a cluster are often physically close together and may share similar characteristics. Once clusters have been specified, the second step is to develop a sampling frame listing these clusters and then conduct a simple random sample of clusters. The final step in a cluster sample is to select a sample from within each cluster (Rocco, 2003). To illustrate, the example earlier focuses on recreation participation among Hispanics in urban areas. To conduct a cluster sample, assume that the researcher identifies six communities that are predominantly Hispanic. For simplicity, these communities will be named A, B, C, D, E, and F. Assume that communities A, C, and F were selected through a simple random sample of the six communities. To identify respondents for inclusion in this study, the researcher may then proceed to randomly select streets within each of the three clusters, then randomly select a certain number of households along these streets.
Multistage Sampling
Sampling can be complex, especially when several single-stage approaches are combined into a multistage design. A stratified-cluster sampling approach (i.e., cluster combined with stratifi-cation), for example, can be useful for on-site studies when a list of potential elements in the population is unavailable and researchers do not know in advance who is in the population.
To illustrate, assume that a goal of an on-site survey is to examine summer recreationists’ reasons for visiting a large backcountry area with three access points: (a) Big Lake Trail, (b) Middle Park Trail, and (c) Little Basin Trail. Researchers know from previous data (e.g., trail counters) that use distribution differs among these access points with 50% of visitors accessing this backcountry on Big Lake Trail, 30% using Middle Park Trail, and 20% accessing via Little Basin Trail. At all three sites, 60% of weekly visitation occurs on weekdays and 40% occurs on weekends. Given that the study focuses solely on summer visitors, there are only 91 days (i.e., 13 weeks) available in the summer for contacting visitors. In addition, the researchers have only budgeted for two full-time (i.e., 40 hours per week) people to administer questionnaires. Given that few people enter or exit the area before 8:00 a.m. or after 8:00 p.m., a decision is made to sample visitors during three different time blocks (i.e., clusters): (a) 8:00 a.m. to noon, (b) noon to 4:00 p.m., and (c) 4:00 p.m. to 8:00 p.m. The goal is to conduct a representative survey of all people at each site during these times, accounting for differences in use distribu-tion among sites.
The first step is to determine the proportion of effort to allocate to each stratum because the goal is to sample proportional to use distribution. In this example, there are two criteria for stratification: (a) three trailheads, and (b) two times during the week (i.e., weekdays, weekends). This stratification design generates six separate strata (e.g., Big Lake Trail on weekdays, Big Lake Trail on weekends, Little Basin Trail on weekdays, Little Basin Trail on weekends). The percent of person power to allocate to each stratum is calculated from two equations:
�. WeekendSamplingforTrailheadX:Percent of total effort spent sampling on weekends at Trailhead X
= Percent of total use that occurs at Trailhead X * The proportion of use
that occurs on weekends

surveyimplementation,sampling,andweightingdata 191
2. WeekdaySamplingforTrailheadX:
Percent of total effort spent sampling on weekdays at Trailhead X
= Percent of total use that occurs at Trailhead X * The proportion of use
that occurs on weekdays
These equations produce the proportion of effort to allocate to each stratum shown in Table 8.5 (e.g., Big Lake Trail total use: 0.50 * Big Lake Trail weekday visitation: 0.60 = 0.30 or 30%).
Table 8.5 Percent of Person Power to Allocate to Each Stratum
Strata % of total use occurring at
trailhead
Proportion of use at time of week
(weekday, weekend)% of total effort
to allocateTrailhead Time of week
Big Lake Weekday 50% 60% 30%Big Lake Weekend 50% 40% 20%Middle Park Weekday 30% 60% 18%Middle Park Weekend 30% 40% 12%Little Basin Weekday 20% 60% 12%Little Basin Weekend 20% 40% 8%
The second step is to determine the number of time blocks (i.e., clusters) to be sampled for each stratum given the proportion of effort allocated to each stratum. Given that only two people are available to administer questionnaires and they are only allowed to work a maximum of eight hours per day and 40 hours per week, the most likely scenario is that each person would work an eight hour day (i.e., two of the three time blocks) for five days a week for the 13-week summer period. This means that each person can work for 65 of the 91 days (i.e., 91 days in summer – 13 weeks * 2 days off a week = 65 days of work per person). The total number of time blocks that can be sampled is determined from the following equation:
2 people *8 hrs per day
4 hrs per time block* 65 days per person = 260 total time blocks to be sampled
Results of this equation, when multiplied by the proportion of effort for each stratum (Table 8.5), produce the number of time blocks (i.e., clusters) to be sampled for each stratum, as shown in Table 8.6 (e.g., Big Lake Trail weekday proportion: 0.30 * 260 total blocks = 78 time blocks).
Table 8.6 Number of Time Blocks (Clusters) to be Sampled from Each Stratum
StrataProportion of
effort Total sample blocksSample blocks per
stratum �Trailhead Time of week
Big Lake Weekday .30 260 78Big Lake Weekend .20 260 52Middle Park Weekday .18 260 47Middle Park Weekend .12 260 31Little Basin Weekday .12 260 31Little Basin Weekend .08 260 21� Sample Blocks per Strata = Proportion of Effort * Total Sample Blocks.

192 surveyresearchandanalysis:applicationsinparks,recreation,andhumandimensions
Now that strata (i.e., three access points; two times per week) and clusters (i.e., three time blocks per day) are defined, the third step requires randomly selecting time blocks (i.e., clusters) to be sampled. To do this, all elements in each stratum should be arrayed, which involves listing every time block that can be sampled in the summer for each trail / time of week stratum. Each element for each stratum should be consecutively numbered with an identification number (ID) and then a trail sampling schedule should be randomly selected using a random numbers table or statistical software package. For Middle Park Trail on weekdays, for example, Table 8.7 shows how time blocks for the first 15 days were allocated ID numbers. A total of 47 time blocks will need to be selected randomly for this stratum (Table 8.6). Using a random numbers table, numbers are randomly selected and matched to those in Table 8.7. Days and time periods for the first 15 days that were selected for sampling are shown with “X” in Table 8.8. During each of these times, all people will be contacted and asked to complete a questionnaire. This process must be repeated for each of the six strata (e.g., Big Lake Trail on weekdays, Big Lake Trail on weekends, Little Basin Trail on weekdays, Little Basin Trail on weekends).
Table 8.7 Array of All Time Block Clusters for MiddleParkTrail on Weekdays
Month Day 8 a.m. – noon noon – 4 p.m. 4 p.m. – 8 p.m.
June 1 1 2 3 2 4 5 6 3 7 8 9 4 10 11 12 5 13 14 15 6 Weekend Weekend Weekend 7 Weekend Weekend Weekend 8 16 17 18 9 19 20 2110 22 23 2411 25 26 2712 28 29 3013 Weekend Weekend Weekend14 Weekend Weekend Weekend15 31 32 33etc. etc. etc. etc.
Table 8.8 Sampling Schedule for MiddleParkTrailon Weekdays1
Month Day 8 a.m. – noon noon – 4 p.m. 4 p.m. – 8 p.m.
June 1 X 2 X 3 X X 4 X 5 X 6 Weekend Weekend Weekend 7 Weekend Weekend Weekend 8 9 X101112 X13 Weekend Weekend Weekend14 Weekend Weekend Weekend15 Xetc. etc. etc. etc.
�X = selected time for administering questionnaires.

surveyimplementation,sampling,andweightingdata 193
There are many ways to set up complex sampling designs. In the earlier example, a systematic method where every nth (e.g., 10th) person is sampled could be substituted for the final step instead of asking all people to complete questionnaires. This would have made this a stratified-cluster-systematic sample. Readers should consult texts and articles focusing solely on sampling for more information about these and other approaches (e.g., Cochran, 1977; Kelly & Cumberland, 1990; Kish, 1965; Rocco, 2003; Scheaffer et al., 1996; Thompson, 1992).
Survey Implementation
Once a sampling approach has been selected and the questionnaire has been written, designed, reviewed by experts and pretested, it is time to carry out the survey. Surveys should be imple-mented to encourage high response rates and sample sizes, and minimize nonresponse error. Strategies such as multiple contacts, design and content of a questionnaire, appearance of accom-panying materials (e.g., envelopes), sponsorship, personalization, and other aspects of the communication process have the capability of generating interest in a study (Dillman, 2007). According to Salant and Dillman (1994), “people are more likely to respond when they think the benefits outweigh the costs, when they think they — or a group with which they identify — will get more in return than they are asked to give in the first place” (p. 137). This section sum-marizes issues to consider when implementing various types of surveys (e.g., mail, telephone, on-site). These considerations are based on various sources (e.g., Dillman, 2000, 2007; Mitra & Lankford, 1999; Salant & Dillman, 1994) and the authors’ own research in parks, recreation, and human dimensions of natural resources.
Implementing Mail Surveys
Mail surveys require respondents to answer questions, then mail the questionnaire back to the researcher or agency. Given that there is no direct interaction between the researcher and respon-dent like there is in telephone and on-site surveys, there may be little incentive for people to cooperate. To obtain a good response rate, therefore, it is imperative to produce a well-written and attractive questionnaire, use personalized correspondence, and conduct repeat mailings (Kwak & Radler, 2002; Mitra & Lankford, 1999; Salant & Dillman, 1994).
Before administering a mail survey, it is important to have the sampling list in electronic format so that names and addresses can be quickly transferred to appropriate software to print mailing labels. Respondent names and addresses will be printed several times because multiple mailings are almost always necessary for achieving a high response rate (Dillman, 2000). The list must also be sorted between mailings to delete information about people who have responded and do not need to be contacted again. Having electronic information streamlines the process of preparing questionnaires for mailing, thereby saving time and reducing administrative costs.
In addition to storing sampling lists in computer software, it is important to prepare survey materials as far in advance as possible. For example, all materials for multiple mailings (e.g., letters, questionnaires, postcards, envelopes) should be printed and envelopes for the first mailing should be addressed before the first round of packets is mailed. Advance preparation can allow personnel to devote more time to other project tasks, such as responding to inquiries from

194 surveyresearchandanalysis:applicationsinparks,recreation,andhumandimensions
respondents, checking names off mailing lists as questionnaires come in, and entering responses into statistical software packages (Salant & Dillman, 1994).
It may also be useful to publicize the survey in advance because this can help to demonstrate its legitimacy and improve overall response rates (Salant & Dillman, 1994). Brief alerts in outlets such as magazines, newspapers, or association newsletters would be appropriate for publicizing a survey. It is important, however, to be cautious when providing advanced notice because any negative coverage can be detrimental to response rates.
Mail surveys should almost always use multiple mailings (e.g., Dillman, 2000, 2007; Krosnick, 1999; Kwak & Radler, 2002; Salant & Dillman, 1994). According to Dillman (2000, 2007), multiple contacts are more effective than any other technique for increasing mail survey response rates. In Dillman’s (2000, 2007) “Tailored Design Method,” multiple contacts include:
• prenotification letter,• first questionnaire packet,• thank you / reminder postcard, and• replacement questionnaire packet.
A brief prenotification letter of less than one page should be sent to the entire sample a few days before the questionnaire is mailed, notifying people: (a) about the purpose of the study, (b) that the questionnaire will arrive shortly, and (c) that their participation would be appreciated. Letters should contain letterhead or logos of organizations conducting / sponsoring the survey, signatures and contact information of lead investigators, personalized addresses, and a date. Prenotification letters should be brief, personally addressed, positively worded, emphasize importance of the study, and build anticipation; this is not the place for precise details about conditions for participation (e.g., anonymity, confidentiality, voluntary; Dillman, 2007).
Letters should be mailed using first-class postage with the label and letter specifying the respon-dent’s name, not “resident of…” Compared to bulk-rate postage, first class allows items to be: (a) processed by the postal service faster, (b) returned or forwarded for invalid addresses, and (c) perceived as more important by potential respondents (Salant & Dillman, 1994).
When a government agency contracts a private company or another organization (e.g., university) to design and / or administer the survey, it is useful to print letters on appropriate government stationary (e.g., letterhead) and explain that the survey is being conducted for the agency by another organization and then name that organization (Heberlein & Baumgartner, 1978). This can improve response rates and show legitimacy and transparency (Dillman, 2007). Figure 8.1 provides an example of a prenotification letter for a recent survey of hunters.
The first questionnaire packet contains the: (a) envelope in which documents are contained, (b) personalized and signed cover letter, (c) questionnaire, and (d) addressed and postage-paid return envelope. This mailing should occur a few days to one week after the prenotification letter. The mailing envelope will vary in size depending on the size of paper used for the question-naire booklet (see chapter 7), but should still contain logos and addresses of organizations or agencies conducting the study, be labeled with the respondent’s name and address, and be mailed using stamped or metered first-class postage. Envelopes should not include statements

surveyimplementation,sampling,andweightingdata 195
Figure 8.1 Example of a Prenotification Letter
Human Dimensions of Natural Resources Fort Collins, CO 80523-1480
970-491-2360 Fax: 970-491-2255
January 14, 2004
Jason M. Smith 1482 SE Centerpoint Street Pineville, CO 80521
Dear Jason,
In the next few days, you will receive in the mail a request to complete a brief questionnaire for an important project that is being conducted by researchers at Colorado State University.
We are mailing this questionnaire to hunters in an effort to learn how you feel about chronic wasting disease (CWD) in Colorado.
It is very important that everyone who receives this questionnaire completes and returns it as soon as possible. Accuracy of any conclusions that we make depends on all opinions being represented. Even if you do little deer hunting or know little about CWD, your participation is needed because responses are important for management of deer and hunting in Colorado.
We would appreciate you taking a few minutes to complete and return the questionnaire. It is only with generous help of people like you that this important project will be a success. Thank you for your time and consideration.
Sincerely,
Jerry J. Vaske, Ph.D. Professor
such as “your response required,” “open now,” or “important documents inside” and should not be brightly colored (e.g., yellow, blue, red) because they convey a marketing image and are likely to be treated as junk mail by many recipients (Dillman, 2007). Before sending a survey

196 surveyresearchandanalysis:applicationsinparks,recreation,andhumandimensions
mailing, the researcher should always contact the postal service for information about current postage rates and procedures that avoid complications with automated scanning and sorting equipment (e.g., use capital letters, avoid punctuation, label placement).
The cover letter is important for persuading respondents to take the questionnaire and project seriously. Like prenotification letters, cover letters should contain letterhead or logos of agencies conducting and sponsoring the survey, signatures and contacts of lead investigators, personalized addresses, and a date. Salutations such as “Dear Bill” or “Dear Mr. Jones” should be used to personalize letters because statements such as “Dear Resident” or “Dear Colorado Hunter” convey that a form letter is being sent and packets are likely to be tossed into the trash can or recycling bin. If it is difficult to determine gender from names, avoid offending recipients by not using salutations starting with “Mr., “Mrs.,” “Ms.,” or Miss.” Sometimes it may be necessary to avoid names on a cover letter. If a household survey is being conducted, for example, it may be useful to ask in the cover letter for the adult who most recently celebrated a birthday, as most telephone directories can introduce bias because listings are still dominated by males (e.g., husbands; Binson, Canchola, & Catania, 2000; Dillman, 2007). Salutations such as “To resi-dents at this address” or “To residents at 583 5th Avenue” are slightly more personable than “Dear Resident.”
Cover letters should be no longer than a single page and should start by briefly stating what the letter is about, what is being requested, why they were among a small group of people selected, and why the request is important (e.g., Dillman, 2000; Porter & Whitcomb, 2003). Statements about the survey being voluntary, anonymous, and confidential may then be included because they are often required by human subject / regulatory compliance protocols (e.g., Office of Management and Budget [OMB], University Institutional Review Board [IRB]). Surveys are voluntary because people must be allowed to not partake in a study. Researchers can try to convince people of a project’s importance and the value of their contribution, but must not be excessively coercive or offensive. Confidentiality means that responses will remain private through methods such as not discussing particular respondents with people uninvolved with the project, removing identification numbers and destroying mailing lists when they are no longer needed, and ensuring that people remain anonymous so that personal and contact information cannot be associated with specific questionnaires or answers (Salant & Dillman, 1994; Sobal, 1984; Wildman, 1977). The final section of a cover letter should provide directions for returning the questionnaire, contact information for inquiries, and a statement of appreciation. Letters should be personable, but professional and businesslike. They should also be free of complex language and technical jargon. Figure 8.2 is an example of a mail survey cover letter.
The main component of the packet is the questionnaire booklet. Chapter 7 provides several suggestions for writing and designing questionnaires. For mail surveys, it is important to provide an identification number in a corner of the questionnaire and on mailing labels that correspond to the mailing list. This allows researchers to track who has returned questionnaires and who should be included in follow-up mailings. This procedure reduces mailing and administrative costs by avoiding inserting and assembling duplicate packets, and sending reminders to people who have already responded. Identification numbers have little, if any, negative effect on response rates (Salant & Dillman, 1994), but they should be placed in a corner of the questionnaire so that if respondents tear them out, they do not tear through questions and answers. Trying to hide identification numbers on questionnaires (e.g., invisible ink, incorporate into an approval or

surveyimplementation,sampling,andweightingdata 197
Figure 8.2 Example Cover Letter for Mail Surveys
Human Dimensions of Natural Resources Fort Collins, CO 80523-1480
970-491-2360 Fax: 970-491-2255
January 17, 2004
Jason M. Smith 1482 SE Centerpoint Street Pineville, CO 80521
Dear Jason,
We are contacting you to ask for your help in a study of hunters that is very important for management of deer and hunting in Colorado. This study is part of an effort to learn how hunters feel about chronic wasting disease (CWD) in Colorado.
You are one of a small number of deer hunters chosen at random and invited to participate in this study by completing the enclosed questionnaire. Accuracy of any conclusions that we make depends on all opinions being represented. Even if you do little deer hunting or know little about CWD, your participation is needed.
The purpose of this study is to learn how CWD has affected, if at all, your hunting experiences and how you think your future hunts may be affected by CWD. By understanding hunters’ opinions and attitudes about CWD, state wildlife agencies can work to prevent and control CWD.
Please complete the enclosed questionnaire, which will take less than 20 minutes to complete. This survey is voluntary and there are no risks associated with your participation. When you return your completed questionnaire, your name will be deleted from the mailing list and will never be connected to your answers, thus you will remain anonymous and your responses will be confidential. Responses will take the form of statistical data. If you have questions about your rights as a participant, please contact the Colorado State University Human Research Committee at (970) 491-1563.
Once you have completed the questionnaire, please place it in the enclosed addressed and postage-paid envelope and mail it back to us as soon as possible. If you have any questions regarding this questionnaire or study, please feel free to contact us at (970) 491-2360 or [email protected].
Thank you very much for completing and returning the enclosed questionnaire. Your input is very important.
Sincerely,
Jerry J. Vaske, Ph.D. Professor
processing number such as “Approved Form 426”) is unethical and should be discouraged because it may convey a message that the researcher is trying to hide something or trick respondents (Dickson et al., 1977; Dillman, 2000). In the authors’ research, it has been useful

198 surveyresearchandanalysis:applicationsinparks,recreation,andhumandimensions
to add identification numbers to both the questionnaire and return envelope because respondents seldom notice these numbers in multiple locations.
An envelope should be provided in the packet so that respondents can return their completed questionnaires to the researcher or agency. This envelope should be printed with the researcher or agency address and should provide first-class postage. Expecting respondents to pay postage increases respondent burden and is likely to reduce overall response rates (Salant & Dillman, 1994). According to Dillman (2000, 2007), return envelopes should be personally stamped and use first-class postage because: (a) response rates can be improved, (b) responses tend to come back more quickly, (c) it conveys a message that a monetary value has been given to the respondent so it is likely to be seen as a positive gesture that will help the sender be viewed more positively, (d) it encourages trust in the respondent and questionnaire, and (e) it is culturally difficult for many people to discard something with monetary value. Adding stamps to return envelopes, however, increases postage costs and personnel time when inserting and assembling survey packets. For large projects or studies constrained by budget, business reply envelopes may be more practical because postage is only paid for envelopes that are returned. Research shows, however, that response rates from studies using business reply envelopes can be up to 10% lower than response rates from first-class postage (e.g., Armstrong & Lusk, 1987).
When selecting a date for mailing questionnaires, researchers may want to avoid certain holiday periods such as Thanksgiving and Christmas because people are more likely to be busier or away from home, and extra volume at the postal service during these times may increase the likelihood of delivery mistakes (Dillman, 2007; Weeks, Jones, Folsom, & Benrud, 1980). It is useful to tailor mailing times to characteristics of the population. If a study was interested in hunter participation rates in the most recent deer hunting season, for example, questionnaires should be mailed shortly after the hunting season so that memories of the hunt can be recalled easily by respondents. Dillman (2000, 2007) suggests that January to March appears to be the most conducive period for obtaining completed mail questionnaires, but there is little evidence to suggest that time of week or month of year has any substantial effect on response rates.
Without follow-up contacts, response rates will usually be between 20% and 40% lower irrespec-tive of how well-designed, interesting, or attractive the questionnaire and mail packet (Dillman, 2000). The first follow-up contact should be a thank you / reminder postcard, which expresses gratitude to those who responded and mailed back the completed questionnaire, and reminds those who have not responded that it would be appreciated if they could complete and return the questionnaire soon. The purpose of this mailing is to thank those who have responded and encourage those who have not. Most people who answer questionnaires will respond within a few days after receiving the questionnaire packet, but as each day passes without looking at the questionnaire, it becomes a lower priority until is it forgotten, lost, or discarded. Postcards are a relatively inexpensive and unique way to remind nonrespondents because they offer a different stimulus than opening an envelope or letter, and can be quickly turned over and read instead of remaining unopened with other mail items (Dillman, 2007; Heberlein & Baumgartner, 1981).
Postcards should briefly state when the questionnaire was sent, why it is important, thank those who responded and ask those who have not responded to do so today, and give respondents the option of calling for a replacement questionnaire. Final items should include a statement of appreciation, signature, and contact information of investigators. All of this text is printed on

surveyimplementation,sampling,andweightingdata 199
the back of the postcard. Name and address of the respondent should appear in a mailing label on the front of the postcard, but not on the back because it takes up too much space.
Postcards should be mailed using first-class postage approximately two weeks after the prenotification letter and ten days following the first questionnaire packet. However, postcards should be printed and labeled before the first mailing to allow personnel ample time to answer inquiries and process returned questionnaires. Figure 8.3 provides an example of a postcard.
Figure 8.3 Example Postcard for Mail Surveys
Last week, we sent you a questionnaire seeking your opinions about chronic wasting disease (CWD) and how CWD may affect, if at all, your current and future hunting experiences in Colorado. You are one of a small number of deer hunters chosen at random and invited to participate in this important study.
If you have already completed the questionnaire and mailed it back to us, please accept our sincere thanks. If not, please do so today. Your response is important because future strategies for preventing or controlling CWD may be based on the opinions and attitudes of hunters like yourself.
If you did not receive the questionnaire or it was misplaced, please ask for another copy by contacting us at (970) 491-2360 or [email protected].
Thank you for your cooperation!
Sincerely,
Jerry J. Vaske, Ph.D. Professor Human Dimensions of Natural Resources Colorado State University Fort Collins, CO, USA 80523-1480
Approximately four weeks after the prenotification letter and two weeks after the postcard, a second complete mailing should be sent to nonrespondents indicating that their completed questionnaire has not been received. This replacement questionnaire packet should contain a: (a) reminder cover letter, (b) questionnaire, and (c) addressed and postage-paid return envelope. Like the first questionnaire packet, this replacement packet should be sent using first-class postage. Timing for sending this packet is somewhat delayed compared to the shorter timeframe among the prenotification letter, first questionnaire, and postcard because it allows the potential for more questionnaires to be received, especially those that have been delayed by the postal service. This timing also reduces costs associated with another complete mailing.
This questionnaire packet is identical to the first packet sent to respondents with one major exception — a different cover letter informing nonrespondents that their questionnaire has not been received and urging respondents to complete and return the instrument. This cover letter should be more insistent, but still maintain a professional and businesslike tone. The most important sentence in this cover letter is “As of today, we have not received your completed

200 surveyresearchandanalysis:applicationsinparks,recreation,andhumandimensions
questionnaire” (Salant & Dillman, 1994, p. 146). This phrase attempts to convince people that their individual responses are critical for success of the study and that other people have already responded. An example of this type of cover letter is shown in Figure 8.4. It is important to include with this cover letter a replacement questionnaire and stamped return envelope because many respondents will have misplaced or discarded the first questionnaire packet.
If the response rate or number of completed questionnaires is still low after all of these mailings, a final contact may be necessary where special procedures such as priority or certified mail, special delivery, or telephone (if the sample list contains telephone numbers) are used to contact nonrespondents. An objective of this final contact is not to send the same envelope and cover letter again, but rather to emphasize the importance and legitimacy of the request by providing a different stimulus in terms of packaging, mode and speed of delivery, and appearance. Alternative methods such as final contacts can be cost prohibitive, but have been found to increase response rates (see Dillman, 2007; Gitelson & Drogin, 1992 for reviews).
Given constraints of most mail survey projects, tradeoffs between response rate, project cost, number of mailings, timing, and other implementation issues must almost always be made. There are other details that should also be considered when implementing mail surveys such as type and size of stationary for questionnaires and envelopes, incentives to encourage higher response rates, and how to properly insert and assemble materials in mail packets. Due to space constraints in this book, readers should consult other texts and articles that discuss these issues in more detail (e.g., Dillman, 2000, 2007; Mitra & Lankford, 1999; Salant & Dillman, 1994).
Implementing Telephone Surveys
As discussed in chapter 7, telephone surveys are advantageous because they can rapidly generate data, allow researchers a high degree of control over sequence in which questions are asked, and ensure that all questions are answered. There are, however, weaknesses of telephone surveys such as low response rates, incomplete samples, and difficulty of asking complex questions. Although telephone surveys are less sensitive to design layout because respondents seldom see the instrument, researchers must plan in advance and everything must come together efficiently because issues always arise as soon as dialing begins (Salant & Dillman, 1994).
The first step to conducting a telephone survey is to select the sample. Telephone numbers for specific populations may be available in population and sample lists. In many states, for example, hunters and anglers record their telephone number on applications for hunting or fishing licenses. Many other sources of telephone numbers, however, are problematic because of coverage errors (see Keeter, 1995 for a review). Telephone directories, for example, are often outdated because they are published once or twice per year and do not account for numbers that are issued, changed, or cancelled during the year (Salant & Dillman, 1994). Given that telephone directories often do not list cellular telephone numbers or unlisted numbers, and some people may not own a telephone or have telephone service, it is difficult to generate a random sample where all members of the population have an equal or known chance of being selected. In addition, tele-phone directories may introduce systematic bias in that certain segments of the population may be less likely to list their telephone numbers (e.g., single females, wealthy).

surveyimplementation,sampling,andweightingdata 201
Figure 8.4 Example of Second Cover Letter for Mail Surveys
Human Dimensions of Natural Resources Fort Collins, CO 80523-1480
970-491-2360 Fax: 970-491-2255
February 7, 2004
Jason M. Smith 1482 SE Centerpoint Street Pineville, CO 80521
Dear Jason,
About three weeks ago, we sent you a questionnaire seeking your opinions about management of chronic wasting disease (CWD) and how CWD may affect your current and future hunting experiences. As of today, we have not received your completed questionnaire. If you have completed the questionnaire in the last few days and mailed it back to us, please accept our sincere thanks.
We are writing to you again because every questionnaire is important. You are one of a small number of Colorado deer hunters chosen through a random sampling process in which every Colorado deer hunter had an equal chance of being selected to participate in this study. For results to represent opinions of Colorado deer hunters, it is important that every questionnaire be completed and mailed back to us. Without your help, conclusions that we draw from questionnaires that we have already received from other hunters may be wrong.
Even if you do little deer hunting or know little about CWD, your opinions are still important and must be considered. Results will be used to inform strategies for preventing or controlling CWD and the enclosed questionnaire is your chance to have a say in what happens with respect to this issue.
We want to assure you that this survey is voluntary and there are no risks associated with your participation. You will remain anonymous and your responses will be confidential. An identification number is printed on the questionnaire so that we can check your name off the mailing list when it is returned. This list is then destroyed so that individual names can never be connected to results in any way. Protecting confidentiality of your answers is important to us and the university.
We have enclosed another copy of the questionnaire in case you did not receive the first copy or it was misplaced. Please place your completed questionnaire in the enclosed addressed and postage-paid envelope, and mail it back to us as promptly as possible. If you have questions, please contact us at (970) 491-2360 or [email protected].
Thank you for completing and returning the enclosed questionnaire. Your input is very important.
Sincerely,
Jerry J. Vaske, Ph.D. Professor
Simple random digit dialing (RDD) may seem like an alternative for overcoming these prob-lems. In RDD, the telephone directory is first used to determine area codes and prefixes that are in use. In Colorado, for example, area codes include 970, 303, and 719. In the Fort Collins area

202 surveyresearchandanalysis:applicationsinparks,recreation,andhumandimensions
of Colorado, prefixes include 377, 491, 498, and 495. The next four digits are then selected randomly using a random number table or statistical software package. RDD may seem like an acceptable process, but it is rarely used because any randomly generated number could be a: (a) working household number, (b) working nonresidential number, or (c) nonworking number. RDD methods (e.g., four-digit, two-digit) are inefficient because telephone companies generally assign numbers to residences and businesses in blocks, and often large blocks of numbers are left unassigned or do not contain residences (e.g., Brick, Waksberg, Kulp, & Starer, 1995; Kvitz, 1978). Given that few assigned numbers are residential, chances of selecting a nonresidential number are large (Mitra & Lankford, 1999). Two sampling designs that attempt to overcome these problems are the Waksberg (1978) method and plus-one sampling directory design.
The Waksberg (1978) method of random digit dialing involves a two-stage cluster design aimed at reducing the number of unproductive calls. In the first stage, the researcher obtains a recent listing of all telephone area codes and existing prefix numbers in the area of interest. For each area code and prefix combination, the researcher adds all possible choices for the next two numbers (e.g., 970-491-00 through 970-491-99) and thereby constructs a list of all possible eight-digit numbers of the 10 digits in telephone numbers. These combinations of eight digits represent primary sampling units (PSU; e.g., 970-491-23). Software or a random number table is then used to assign two additional digits to a randomly selected PSU (e.g., 970-491-2343). This process so far is analogous to a two-digit RDD. After the number is dialed, however, the PSU is retained for additional calls if it is a residential number. If the number is not a working residential number, the PSU is eliminated from further sampling consideration.
In the second stage of Waksberg’s methodology, additional last two digits are selected randomly within each valid PSU until a set number of residential telephones is reached and this process is repeated until the desired sample size is reached. One disadvantage of this method involves the amount of clerical time needed to identify elements in the sampling unit.
The Waksberg method is a nondirectory sampling design that attempts to eliminate bias asso-ciated with selection straight from telephone directories. The plus-one method, however, is a directory-based sampling design with an identical objective. This sampling design involves adding a number between zero and nine to the last digit of a selected telephone number. The number selected may be a constant for all telephone numbers or may be assigned randomly for each selected number. If the chosen number, for example, was 862-4069 and the constant was one, the actual number called would be 862-4070 (i.e., add-a-digit dialing).
The plus-one method involves using a random start for selecting pages within a given telephone directory. Once a page has been identified, one column on that page is randomly selected. The position on the page from which a number is drawn is randomly selected to the inch on the identified column of telephone numbers and the first residential number within the selected inch of text is chosen. After the aggregate sample is identified, a constant is added to each number to capture unlisted numbers or numbers that were added after directory publication.
The plus-one technique is advantageous because it is a relatively straightforward method of including unlisted numbers or numbers that were added since the directory was published. In theory, numbers can be added to the last two or three digits, not just the last digit. Substituting more numbers increases the probability of including unlisted or new telephone numbers. Using

surveyimplementation,sampling,andweightingdata 203
this method also eliminates the need for preliminary screening required by the Waksberg method because numbers that are initially selected from the telephone directory are within a residential block. Another advantage is that if the population distributions relative to telephone directories can be identified, a sample proportional to the population distribution of an area can be selected.
There are, however, disadvantages of the plus-one method. If the working residential numbers are not assigned in definable groups, plus-one will not appreciably improve efficiency over what can be expected in other RDD designs. In addition, if an area has an unusually high proportion of unlisted numbers, plus-one may underrepresent this group because it is based on initial assign-ment of working numbers. Finally, equal probability of selection may be reduced because for a number to be included in the sample, its predecessor must be listed in the directory.
When selecting a sample size for a telephone survey, it is important to estimate the time needed to complete this many questionnaires and financial resources available to pay for costs associated with achieving this sample size. It would take an experienced interviewer an average of at least 30 to 40 minutes, for example, to complete a 15-minute interview because of time taken up by no-answers, invalid telephone numbers, respondents not at home, and double-checking answered questionnaires for completeness and accuracy (Salant & Dillman, 1994). If 400 completed questionnaires are required, approximately 267 hours of interviewing time are necessary (i.e., 400 interviews * 40 minutes / 60 minutes per hour). If five telephones are in use four hours per evening, it will take 13 to 14 days to achieve this sample size. Given the demands of telephone interviewing, Salant and Dillman (1994) recommend that interviewers be given occasional days off so approximately one and a half times as many people as there are telephones should be hired (e.g., seven or eight interviewers on staff if there are five telephones).
Once a telephone sample has been selected, the researcher must make arrangements for facilities and equipment. Telephone surveys can be more successful when administered from a single centralized location because it gives interviewers and supervisors the opportunity to work together, and allows supervisors to support and monitor interviewers when they are conducting interviews. Using a central location also allows interviewers to work together instead of on their own and increases efficiency because supervisors can redistribute uncompleted questionnaires to interviewers who finished their calls ahead of schedule (Salant & Dillman, 1994).
Centralized locations for telephone surveys can be as extravagant as a custom designed call center or simple room that is typically used for another purpose and is temporarily equipped with additional telephone lines and telephones borrowed from other offices. Rooms may also be equipped with computers and headsets if computer-assisted telephone interviewing (CATI) systems are to be used and the project budget permits. Instead of the interviewer recording answers on a hardcopy questionnaire, most CATI systems generate a telephone number from the sample (and may dial the number), guide the interviewer through the questionnaire, alert the interviewer if a mistake or inconsistent response is made, and record and store responses for data analysis. The CATI process decreases time required for conducting telephone interviews and entering data into software packages for statistical analysis (see Frankel & Frankel, 1987; Groves & Magilavy, 1986; Groves & Mathiowetz, 1984; Lynn, 1998 for reviews).
Before placing any telephone calls, it is useful to send notification letters to potential respondents if their addresses are available in the sample list. This letter minimizes any element of surprise

204 surveyresearchandanalysis:applicationsinparks,recreation,andhumandimensions
that may occur with such an unexpected telephone call and improves legitimacy by introducing the survey and distinguishing it as a genuine research effort (Salant & Dillman, 1994). This letter should summarize in less than one page what the study is about, how people were selected, when they should expect to receive a call and how to arrange a more convenient time if neces-sary, how long the interview will last, and then thank respondents in advance for participating in the survey. Like cover letters for mail surveys, these advance notification letters should be written on letterhead and include researcher signatures and contact information.
Researchers must also hire and train interviewers before any calls are placed. Success of tele-phone interviews is dependent on interviewers being able to read fluently, communicate in a clear and pleasant manner without hesitating or stumbling with word pronunciation, and respond to inquiries without losing composure or focus (e.g., Groves & McGonagle, 2001; Oksenberg, Coleman, & Cannell, 1986; Singer, Frankel, & Glassman, 1983; Tucker, 1983). Interviewers should have a voice that is distinct and well-articulated, but will not interfere with other inter-viewers who work in close proximity. Interviewers should also have the ability to generate comradeship with respondents so that they stay on the telephone and complete all questions (Groves & McGonagle, 2001; Mitra & Lankford, 1999).
Many people have been “oversurveyed” to the point where they screen calls with call display technologies or belong to national “do not call” lists. To obtain high response rates with telephone surveys, interviewers must quickly convey professionalism and legitimacy (e.g., Mangoine, Fowler, & Louis, 1992). These skills must be taught; training interviewers is not optional. Some issues that should be covered when training interviewers include:
• background information about the project• procedures for dialing telephone numbers (e.g., local, international)• keeping an interviewer record log of all calls (e.g., busy, disconnected, call back)• dealing with abusive or aggressive respondents (e.g., be nice, keep cool, be professional)• tone and pace when reading questions (e.g., clear, neutral, enthusiastic, loud enough to
hear, slow pace, consistency, sensitive to respondents)• probing for more complete answers (e.g., “which would be closer to the way you feel”)• reading every question in order and reading the entire question before accepting response• reading response scales (e.g., five, seven, or nine point; see chapter 7)• repeating the entire question unless only one part was misunderstood• providing feedback (e.g., “I see,” “Thank you,” “That is useful,” “Let me get that down,”
“I want to make sure that I have it right”)• recording answers on questionnaire forms• answering inquiries (e.g., who is study sponsor, what is study purpose, how many people
sampled, who are you, who is conducting survey, how did you get my name)• completing interviews (e.g., recording time, coding, checking responses)
It may be useful to prepare a help sheet addressing these issues and then post this sheet at interviewer workstations and / or provide this sheet directly to interviewers.

surveyimplementation,sampling,andweightingdata 205
Once interviewers have been trained and a sample has been selected, questionnaires can start being administered. Chapter 7 offers guidelines on writing and constructing telephone surveys. One document that needs to be added, however, is an interviewer record form (IRF) or cover sheet for each questionnaire that identifies individuals using their name or an identification number, and records information about each contact. Given that it may take several calls each day for multiple days to reach intended people and ensure a high response rate, it is important to maintain a call record on this form so that different interviewers know what occurred during previous calls and when would be the best time to reach each individual. Researchers suggest that up to 15 call attempts per telephone number is the best approach, but cost efficiency of cutoffs with as few as five or six attempts is nearly as good (e.g., Kalsbeek, Botman, Massey, & Liu, 1994). Disposition of each call is also important for calculating response rates (discussed later). Figure 8.5 (p. 206) provides an example of an interviewer record form for a telephone survey.
For work-related surveys, telephone calls should occur during business hours (e.g., 9 a.m.–5 p.m.). For most parks, recreation, and human dimensions surveys, however, weekday or weekend evenings between 5:00 p.m. and 9:00 p.m., and occasional afternoons on weekends are most productive (Dillman, 2000; Salant & Dillman, 1994; Weeks, Kulka, & Pierson, 1987). Daytime hours on weekdays are less productive because many households will not have anybody at home (Weeks et al., 1987). If a RDD sample is being used, however, some daytime calls will be needed to eliminate working nonresidential numbers from the sample (Mitra & Lankford, 1999).
Interviewers encounter challenges with telephone surveys. It is important, therefore, to ensure that a supervisor is present when calls are made to overcome problems. One challenge is how to handle refusals where a person hangs up as soon as the interviewer introduces himself or herself without hearing what the study is about or answering any questions. To improve response rates, it may be useful to call back a few days later and attempt a refusal conversion by using a polite tone and beginning the interview differently such as “one of our interviewers attempted to call your household the other night, but we may have called at a bad time so I wanted to check back with you. We would like to ask a few quick questions about [topic] and would appreciate hearing your opinion” (e.g., Salant & Dillman, 1994; Snijkers, Hox, & de Leeuw, 1999).
Implementing On-Site Surveys
Common examples of on-site surveys in parks, recreation, and human dimensions of natural resources include trailhead surveys of hikers, questionnaires administered to wildlife viewers in parking areas or on viewing platforms, on-site surveys of skiers in warming huts or on-mountain restaurants, and questionnaires given to boaters at take-out or put-in points (see Manning, 1999 for a review). Door-to-door on-site household surveys tend to be less popular. On-site surveys are often the only solution when a population list is unavailable or people will not or are unable to respond accurately to another type of survey (Salant & Dillman, 1994).
As discussed earlier in this chapter, systematic, cluster, and multistage sampling designs can be effective when conducting on-site surveys because population lists are often unavailable. Although on-site questionnaires are typically shorter in length (e.g., one legal-size piece of paper printed on both sides; chapter 7), interviewers should estimate that they will only obtain approxi-mately three or four completed questionnaires per hour. For example, if a goal is to achieve a

206 surveyresearchandanalysis:applicationsinparks,recreation,andhumandimensions
Figure 8.5 Sample Interviewer Record Form for Telephone Surveys
Respondent ID Number: ___________________
PSU Number: ____ ____ ____ ____
Phone Number: Area Code Prefix Suffix
____ ____ ____ ____ ____ ____ ____ ____ ____ ____
Disposition:
Date TimeDisposition
Code TimeDisposition
Code TimeDisposition
CodeInterviewer
ID Comments
_______ _______ ____ _______ ____ _______ ____ ____ ______________
_______ _______ ____ _______ ____ _______ ____ ____ ______________
_______ _______ ____ _______ ____ _______ ____ ____ ______________
_______ _______ ____ _______ ____ _______ ____ ____ ______________
_______ _______ ____ _______ ____ _______ ____ ____ ______________
Appointments:Today’s
DateCurrent Time Spoke With Ask For
Call Back Date
Call Back Time
Interviewer ID Comments
_______ _______ ___________ ___________ _______ _______ ____ ______________
_______ _______ ___________ ___________ _______ _______ ____ ______________
_______ _______ ___________ ___________ _______ _______ ____ ______________
Refusals:Today’s Date Current Time Spoke With Interviewer ID Comments
__________ __________ __________________________ ____ __________________________
Final Disposition: ________
Disposition Codes:
01 = Completed interview 07 = No eligible respondent could be reached during time period 02 = Refused interview 08 = Language barrier prevented completion of interview 03 = Nonworking number 09 = Interview terminated within questionnaire 04 = No answer (multiple tries) 10 = Line busy (multiple tries) 05 = Business phone 11 = Selected respondent unable to respond 06 = No eligible respondent at this number
sample size of 400 completed questionnaires and an interviewer obtains four questionnaires per hour, it will take 100 hours or 12 to 13 days of full-time interviewing time. It is important to recognize, however, that use levels in natural resource settings vary considerably so some surveys may average less than 1 or more than 10 questionnaires per hour. Given that many natural settings are relatively remote, it is also advisable to have more than one interviewer working on the project so that they can work together as a safety precaution.

surveyimplementation,sampling,andweightingdata 207
On-site and telephone surveys are similar in that both require advance planning in terms of sampling, survey materials, and hiring and training personnel. One difference between these survey types, however, is that interviewers are sent out on their own to administer questionnaires on-site. As a result, it is important to ensure that interviewers are trained. Interviewers should be friendly, direct, honest, and professional. They should also wear modest clothing and be nicely groomed so that they make a good impression (e.g., Singer et al., 1983). Interviewers must be willing and able to work independently, and should be outgoing and personable when con-tacting and communicating with strangers. Several of the issues discussed for training telephone interviewers apply to on-site surveys (Groves & McGonagle, 2001). When an individual refuses to complete a questionnaire, for example, the interviewer must maintain his or her composure, be professional, and respond with a statement such as “I am sorry to bother you; have a nice day.” Interviewers must also be prepared to address any inquiries about the project or questionnaire.
Before starting data collection, it is important to inform public officials and resource managers when and where questionnaires are being administered, and also provide officials with names and contact information of interviewers and supervisors. Interviewers may also want to carry a formal letter written on letterhead from resource managers and / or public agencies to demon-strate the study’s legitimacy to potential respondents (Salant & Dillman, 1994).
When administering on-site questionnaires, interviewers should wear a nametag that identifies their name and organization, and shows a photograph of the individual. Interviewers should also carry: (a) clipboards; (b) pens or pencils; (c) signed letters from the researcher explaining the purpose of the study and issues related to confidentiality and anonymity (similar to cover letters for first questionnaire packet in a mail survey; Figure 8.2, p. 197); (d) questionnaires; (e) inter-viewer forms to record number of contacts, refusals, and completed questionnaires; and (f) a waterproof bag to carry materials and completed questionnaires. Salant and Dillman (1994) also recommend that interviewers carry a full manual or set of instructions about the survey and who should be sampled, but this may be too heavy and cumbersome to carry long distances in natural resource settings, and may be unnecessary if effective training is provided in advance.
Supervisors should be available on-site to address questions or problems that arise during data collection. Supervisors should also frequently consult with each interviewer to ensure that every-thing is proceeding smoothly and check a sample of completed questionnaires for legibility, consistency, and completeness. Meetings allow supervisors to identify any errors that may be recurring during sampling or questionnaire completion. Researchers should also consider having interviewers ask each respondent for their telephone number so that a sample of respondents can be contacted at a later time to confirm that they were actually interviewed. This technique minimizes the possibility of interviewers cheating and completing questionnaires on their own without ever contacting an individual (Mitra & Lankford, 1999; Salant & Dillman, 1994).
Implementing Electronic Surveys
Chapter 7 provided guidelines for constructing email and Internet surveys. Like other surveys (e.g., mail, telephone), multiple contacts are essential to the success of electronic surveys (Porter & Whitcomb, 2003). According to Dillman (2007), a prenotification email is of utmost impor-tance for electronic surveys because questionnaires are easy to discard simply by deleting them. If the email is boring or too long, it will often go unread by many individuals. The prenotifica-

208 surveyresearchandanalysis:applicationsinparks,recreation,andhumandimensions
tion letter should be short (e.g., two or three short paragraphs) and enthusiastically discuss what the study is about, when the survey will be sent, who to contact with questions, and a statement of appreciation. Email letters should fit on the screen so readers are not required to scroll through the message. Finally, email letters should be personalized so that it does not appear that they were part of a mass mailing (e.g., listserv, multiple recipient addresses).
Time intervals between repeated contacts should be shorter for electronic surveys than they are for mail surveys (Dillman, 2007; Kwak & Radler, 2002). Prenotification emails, for example, should be sent just one to three days before the questionnaire is first emailed to recipients. Each time a message is sent to respondents, a replacement questionnaire or website link should be provided in the body of the email. This approach is somewhat different than mail surveys where postcard reminders are sent without a replacement questionnaire.
The most effective implementation strategy for electronic surveys will depend on available alternatives (Gaede & Vaske, 1999). If telephone numbers or mailing addresses are available in the sample list, for example, mixed mode surveys (e.g., email with telephone follow-up) may be useful for improving response rates. If alternative contact information is unavailable, researchers should consider a multiple contact strategy similar to that used in mail surveys.
It is important to be cautious when using advanced tools for designing and implementing electronic surveys because some of these techniques make it difficult or impossible for some people to respond because of: (a) hardware and software performance or incompatibility, and (b) different levels of computer literacy among respondents (Dillman, 2007; Gaede & Vaske, 1999). Researchers should restrain from using advanced methods for implementing electronic surveys and opt for simpler and more generic questionnaires that can be accessed by most respondents.
Response Rates
The main reason for following these implementation strategies is to achieve the highest possible response rate. A response rate is commonly defined as the proportion of completed interviews to the total number of eligible respondents, and it indicates how successful the researcher was in gaining cooperation of potential respondents in a sample. As discussed earlier, a poor response rate may increase the likelihood of introducing nonresponse error. When a response rate for a random sample of a population is low, the researcher may not know whether those who com-pleted a questionnaire are similar to those who did not complete a questionnaire. Low response rates, therefore, may weaken the ability to generalize to the target population.
There is disagreement on what constitutes an acceptable response rate. Babbie (2003), for exam-ple, considers a 50% response rate adequate, a response of at least 60% as good, and a return of 70% as very good. Salant and Dillman (1994) state that a response rate less than 60% for a general population survey and less than 70% for specific groups should be a red flag. Some recreation researchers (e.g., Dolson & Machlis, 1991) recommend response rates of at least 65%, whereas tourism researchers (e.g., Woodside & Ronkainen, 1984) suggest that response rates less than 80% can result in bias. Conversely, Mitra and Lankford (1999) suggest that response

surveyimplementation,sampling,andweightingdata 209
rates of 25% to 35% are within acceptable industry standards for leisure and recreation mail surveys.
Research shows that survey response rates tend to be declining over time for many social science studies and parks, recreation, and human dimensions of natural resources studies (e.g., Connelly, Brown, & Decker, 2003; Cook, Heath, & Thompson, 2000; Krosnick, 1999; Steeh, 1981; Steeh, Kirgis, Cannon, & DeWitt, 2001). Issues such as saliency of the topic to respondents, number and personalization of contacts, time of survey administration, question complexity, and ques-tionnaire design all influence response rates. In addition, some people have been surveyed so much that they have started using tactics such as call screening, national “do not call lists,” and junk mail filters to avoid being contacted by telemarketers and other survey firms. Although response rates tend to be declining, they vary considerably depending on sampling technique, type of survey, type of target population, and other data collection methods used (Figure 8.6).
Source: Connelly et al. (2003)
Figure 8.6 Response Rates to Mail Surveys for 105 Studies Between 1971 and 2000
Perc
ent
Year 1970 1975 1980 1985 1990 1995 2000
100.0
90.0
80.0
70.0
60.0
50.0
40.0
30.0
20.0
Calculating Response Rates
Response rates are typically calculated with the following equation:
Response Rate = C
E
Equation 8.5where: C = number of completed questionnaires E = total number of eligible respondents
When multiplied by 100, this rate can be expressed as a percentage. For a questionnaire to be considered “completed” (i.e., C in equation 8.5), at least some portion of it must be completed or a set of predetermined and strategically chosen questions must be answered (Mitra & Lankford, 1999). The total number of “eligible” respondents (i.e., E in equation 8.5) depends on the num-ber of categories of dispositions, which differ among survey types (e.g., mail, telephone).
In mail surveys, the number of eligible respondents is equal to the original sample size minus the number of questionnaires returned because they could not be delivered. For example, assume that questionnaires were mailed to 2,000 anglers in North Dakota. In total, 173 questionnaires

210 surveyresearchandanalysis:applicationsinparks,recreation,andhumandimensions
were undeliverable (e.g., incorrect address information, moved) and after multiple mailings, 1,274 completed questionnaires were returned. The formula would be:
Response Rate = 1,274
2,000 –173= 69.7%
Simply dividing the number of completed questionnaires (1,274) by the total sample (2,000) would yield a lower response (63.7%), which would be an incorrect calculation of response rate.
Researchers may also want to consider those people who recently moved out of the geographical region of the study (e.g., moved from North Dakota to Minnesota in the example) as undeliv-erables, but this may be difficult to track if first-class postage forwards the envelopes to new addresses and respondents complete and mail back the questionnaire.
It is important for researchers to estimate possible response rates before printing mail surveys. Table 8.9, for example, shows a hypothetical estimate of how many questionnaire packets (1,363) and postcards (409) may need to be printed and mailed to achieve a 59% overall response rate and total sample size of n = 400 for a survey with four mailings. Response rates and expected returns in Table 8.9, however, are estimates and may not be applicable to a specific population or project. Consulting recent research, therefore, is useful for anticipating response rates for different mailings and estimating how many documents may need to be printed.
Multiple contacts are important for achieving adequate response rates. The hypothetical estimate in Table 8.9, for example, shows that the expected response rate for the first mailing is 40%; three additional mailings are needed to achieve a 59% overall response rate. The variable response rates for each mailing (i.e., 40%, 10%, 15%, 10%) are estimates and may not be realistic for specific populations being studied in a particular project. It should also be noted that these response rates for each mailing do not sum to 59%; a final response rate is calculated by dividing the total number of questionnaires returned across all mailings by the number sent in the first questionnaire packet (i.e., 400 / 682 = 59%).
Table 8.9 Hypothetical Response Rates and Number of Questionnaires for a Mail Survey
Number mailed
Expected response rate
Expected number returned
First mailing (first questionnaire packet) 682 40% 273Second mailing (postcard) 409 10% 41Third mailing (replacement questionnaire packet) 368 15% 55Fourth mailing (certified or registered mail) 313 10% 31
Total 1,772 1 59% 2 400
� Total of 1,363 questionnaire packets and 409 postcards.2 Assumes no undeliverables (e.g., incomplete address, moved)
Multiple contacts are also important for minimizing nonresponse error. Consider the following hypothetical example. Many states conduct tourism conversion surveys where a goal is to examine the effectiveness of promotional brochures for attracting visitors to the state. Table 8.10

surveyimplementation,sampling,andweightingdata 211
shows that with just one mailing and a response rate of 35%, 87% of respondents had visited the state and 13% had not visited. If no additional mailings were conducted, it can be assumed that the brochures were effective at attracting visitors. This conclusion is premature because of potential for nonresponse bias. By the fourth mailing, an 80% overall response rate is achieved and results show that only 11% of respondents had visited the state, suggesting that perhaps the brochures were actually not highly effective at attracting visitors to the state.
Table 8.10 Hypothetical Response Rates and Results by Mailing for State Tourism Conversion Survey
Results by mailing: Visited state?
Total response rate after mailing Yes No
First mailing (first questionnaire packet) 35% 87% 13%Second mailing (postcard) 45% 67% 33%Third mailing (replacement questionnaire packet) 65% 53% 47%Fourth mailing (certified or registered mail) 80% 11% 89%
In some other types of surveys such as telephone surveys, the general response rate calculation (i.e., C / E) fails to account for the variety of possible outcomes or dispositions of a telephone call. How does a researcher, for example, treat numbers that are not answered or remain busy even after repeated callbacks? Should these numbers be considered eligible or ineligible? Frankel (1982), in a special report for the Council of American Survey Research Organizations (CASRO), proposed a solution to the problem known as the CASRO estimator.
UE I
E E
C rate Response
++
=
Equation 8.6where: C = the number of completed interviews E = the total number of eligible respondents I = the number of ineligible U = the number of unknown final dispositions (i.e., no answer, line busy)
The CASRO estimator apportions dispositions with unknown eligibility status (e.g., no answer, busy) to dispositions representing eligible respondents in the same proportion as exists among calls of known status (Table 8.11, p. 212). The resulting estimate reflects telephone sampling efficiency and degree of cooperation among eligible respondents contacted. Based on disposition codes provided in Table 8.11, the CASRO formula would be:
Response Rate = 01
(01+ 02 + 07 + 09) + (01+ 02 + 07 + 09)
(03+ 05+ 06 + 08 +11) + (01+ 02 + 07 + 09)
* (04 + 10)

212 surveyresearchandanalysis:applicationsinparks,recreation,andhumandimensions
Table 8.11 CASRO Disposition Codes for Calls in a Telephone Interview
Final disposition of call Status Code
Completed interview Eligible 01Refused interview Eligible 02Nonworking number Ineligible 03Ring, no answer Unknown 04Business phone Ineligible 05No eligible respondent at this number Ineligible 06No eligible respondent could be reached in time period Eligible 07Language barrier Ineligible 08Interview terminated Eligible 09Line busy Unknown 10Respondent unable to respond due to impairment Ineligible 11
The CASRO estimator is just one approach for calculating response rates for telephone surveys. There are many other methods for estimating more liberal or conservative response rates for telephone surveys and other types of surveys (see Frey, 1989; Gripp, Luloff, & Yonkers, 1994; Lavrakas, 1987; McCarty, 2003 for reviews). The American Association for Public Opinion Research (AAPOR), for example, provides a spreadsheet that can be downloaded (http://www.aapor.org/uploads/Response_Rate_Calculator.xls) to calculate telephone survey response rates based on their formula.
There have been studies presenting predictive models for calculating anticipated survey response rates based on factors such as who is conducting the study (e.g., agency, university), type of population (e.g., general, specific group), saliency of topic, number of pages or length of survey, and number of mailings or contacts (e.g., Baruch, 1999; Connelly et al., 2003; Cook et al., 2000; Heberlein & Baumgartner, 1978; Krosnick, 1999). These approaches, which are often based on regression models (see chapter 16), are useful when anticipating or predicting future events such as final response rates when conditions such as questionnaire length, personalization and number of contacts, complexity of questions, and type of population are known in advance.
Nonresponse Bias Checks
One concern in survey research is that individuals who completed the questionnaire may be different from those who did not complete the questionnaire. In other words, respondents may not be representative of the population or sample of which they are a member. One way to address this issue is to conduct a nonresponse bias check. A nonresponse check can involve contacting a sample of original nonrespondents and asking questions from the questionnaire. Number of questions asked will depend on length of the original questionnaire. If a questionnaire was 12 pages in length, for example, it would be advisable to only ask a subset of important questions from each major section to minimize respondent burden. If a questionnaire was only one or two pages, it might be feasible to ask all questions in a nonresponse check.
According to Babbie (2003), a demonstrated lack of response bias is more important than a high response rate. Nonresponse bias may exist even with a relatively high response rate such as 70%; a low response rate such as 30% may be acceptable if there are no differences between

surveyimplementation,sampling,andweightingdata 213
those who responded to a survey and those who did not respond (Crompton & Tian-Cole, 2001; Krosnick, 1999). Given that some studies of relatively homogeneous groups have found few differences among multiple contacts (e.g., first contact, postcard, final contact), some researchers have argued that going to the expense of obtaining high response rates and extensive contacts may not be necessary to avoid nonresponse error (e.g., Becker & Iliff, 1983; Dolsen & Machlis, 1991; Hammitt & McDonald, 1982). Other studies of heterogeneous samples (e.g., general public), however, have found substantial differences between respondents and nonrespondents of multiple contacts (e.g., Brown & Wilkens, 1978; Manfredo, Teel, & Bright, 2003; Woodside & Ronkainen, 1984). Regardless, a nonresponse check is an important step in survey research and it may be even more important than high response rates for allowing researchers to be confident in the representativeness of their results (Crompton & Tian-Cole, 2001).
It can be useful to use a different type of survey method for nonresponse bias checks (Dillman, 2000). A nonresponse bias check should emphasize the importance and legitimacy of the request, and one way to do this is to provide a different survey mode and appearance. After conducting multiple mailings for a mail survey, for example, it can be effective to conduct a nonresponse bias check using telephone contacts and asking a sample of original nonrespondents a subset of questions from the mail questionnaire (e.g., Manfredo, Teel et al., 2003; Needham, Vaske, & Manfredo, 2005; Needham, Vaske, Donnelly, & Manfredo, 2007). Using another form of contact may not always be possible because full contact information may not be available for all members of the sample (Mitra & Lankford, 1999). A telephone nonresponse check for an original mail survey, for example, assumes that valid telephone numbers are available for all sample members. Alternating types of surveys also requires researchers and personnel to have sufficient training in each survey methodology.
WeightingWeighting by Nonresponse Checks
If results of a nonresponse bias check show differences between people in the sample who completed a questionnaire and those who did not complete it, data may need to be weighted for sample results to be representative of the target population. Assume, for example, that the response rate for a random mail survey was only 10% and results showed that 30% of these respondents were males and 70% were females. A nonresponse check with a random sample of the 90% of people who did not respond showed that 60% were male and 40% were female. Although the original sample was selected at random, this suggests that responses to the mail survey may not be truly representative of the population because far more women responded to the mail survey than men, so there was an underrepresentation of males. Given the low response rate and this substantial disparity in results between the mail survey and nonresponse check, it may be prudent to weight the data from the mail survey, as follows:
Weight = Population %
Sample % Equation 8.7
0.20.30
0.60(males)
Weight ==
57.00.70
0.40(females)
Weight ==

214 surveyresearchandanalysis:applicationsinparks,recreation,andhumandimensions
Weighting by Population Proportions: Single Variable
Weighting may also be necessary if population proportions are known in advance and survey results reveal that specific groups or segments are overrepresented or underrepresented. In a recent mail survey of resident and nonresident deer hunters in eight states and elk hunters in three states, for example, more questionnaires were received from nonresident hunters in each state (e.g., Needham et al., 2007). For the year in which the study was conducted, however, hunting license sales showed that many more residents than nonresidents purchased a license to hunt deer or elk in each state. Given that more questionnaires were received from nonresi-dent hunters, data were weighted to reflect the population proportions of hunters as follows:
Weight = Population %
Sample %
where:
strata across hunters ofNumber
stratumin hunters ofNumber %Population =
strata across srespondent ofNumber
stratumin srespondent ofNumber % Sample =
Among Arizona deer hunters, for example, there were 32,502 resident and 1,079 nonresident hunters in the population. Completed questionnaires were received from 396 resident and 443 nonresident hunters. To combine residents and nonresidents, and generalize to the total popu-lation of Arizona deer hunters, the following weight would need to be applied for residents:
968.033,581
32,502
(residents) % Population ==
472.0
839
396(residents) % Sample ==
therefore: 051.20.472
0.968(residents)
Weight ==
In addition, the following weight would need to be applied for nonresidents:
Population % (nonresidents)
= 1,079
33,581= 0.032
528.0839
443(nonresidents) % Sample ==
therefore: 061.00.528
0.032(nonresidents)
Weight ==
This gives a higher weight to the underrepresented group (i.e., residents) and a lower weight to the overrepresented group (i.e., nonresidents) of Arizona hunters. With nonresidents coded as “0” and residents coded as “1” in SPSS statistical software, the SPSS syntax (see chapter 12) for applying these weights to the Arizona dataset was a series of “if” statements:
if residency = 0 weight = 0.061.

surveyimplementation,sampling,andweightingdata 215
if residency = 1 weight = 2.051. execute.WEIGHT BY weight.
Generalizing results to a more macro or higher level requires a different set of weights. To generalize to the population of all hunters across all eight states irrespective of state, residency (i.e., resident, nonresident), or species hunted (i.e., deer, elk), 22 different weights would be needed (i.e., resident and nonresident deer hunters across eight states = 16 weights, plus resident and nonresident elk hunters across three states = 6 weights, so [2 * 8] + [2 * 3] = 22). The total population from all licenses was 1,329,464 hunters and the total sample size was 9,567. The weight for Arizona resident deer hunters, for example, was calculated as follows:
024.01,329,464
32,502
(AZ res. deer) % Population ==
041.09,567
396(AZ res, deer) % Sample ==
therefore: 59.00.041
0.024(AZ res. deer)
Weight ==
These calculations were repeated for the 22 strata. State (Arizona = 1, Colorado = 2, North Dakota = 3, Nebraska = 4, South Dakota = 5, Utah = 6, Wisconsin = 7, Wyoming = 8), residency (nonresident = 0, resident = 1), and species (deer = 0, elk = 1) were coded in SPSS, and syntax for applying weights was:
if state = 1 and residency = 1 weight = 0.59.if state = 1 and residency = 0 weight = 0.02.if state = 2 and residency = 1 and deerelk = 0 weight = 1.00.if state = 2 and residency = 0 and deerelk = 0 weight = 0.31.if state = 2 and residency = 1 and deerelk = 1 weight = 2.02.if state = 2 and residency = 0 and deerelk = 1 weight = 0.88.if state = 3 and residency = 1 weight = 1.56.if state = 3 and residency = 0 weight = 0.05.if state = 4 and residency = 1 weight = 1.10.if state = 4 and residency = 0 weight = 0.05.if state = 5 and residency = 1 weight = 0.92.if state = 5 and residency = 0 weight = 0.05.if state = 6 and residency = 1 and deerelk = 0 weight = 1.15.if state = 6 and residency = 0 and deerelk = 0 weight = 0.08.if state = 6 and residency = 1 and deerelk = 1 weight = 0.74.if state = 6 and residency = 0 and deerelk = 1 weight = 0.05.if state = 7 and residency = 1 weight = 10.30.if state = 7 and residency = 0 weight = 0.51.if state = 8 and residency = 1 and deerelk = 0 weight = 1.17.if state = 8 and residency = 0 and deerelk = 0 weight = 0.48.if state = 8 and residency = 1 and deerelk = 1 weight = 0.84.if state = 8 and residency = 0 and deerelk = 1 weight = 0.15. execute.WEIGHT BY weight.

216 surveyresearchandanalysis:applicationsinparks,recreation,andhumandimensions
Weighting by Population Proportions: Multiple Variables
Although proportions are sometimes known for populations of interest in parks, recreation, and human dimensions of natural resources through sources such as hunter or angler license sales, there are instances such as general population surveys where it is difficult to know “correct” population ratios and multiple variables must be used to weight data. In these situations, Census data is one helpful source of information about populations that can be used for weighting survey data.
A study of public attitudes toward the desert tortoise, for example, surveyed a sample of the general public in five California counties (Vaske & Donnelly, 2007). To reflect the actual popu-lation of individuals living in each county, the sample was weighted by U.S. Census 2000 data. Four weighting variables were used: (a) county (Imperial, Kern, Los Angeles, Riverside, San Bernardino), (b) ethnicity (Hispanic, Non-Hispanic), (c) sex (male, female), and (d) age (18–29, 30–39, 40–49, 50–59, 60–69, 70+ years). The combination of these four variables and their associated levels resulted in 120 cells (i.e., 5 counties * 2 levels of ethnicity * 2 levels of sex * 6 age groups = 120) in a set of crosstabs (see chapter 13). Population size and percent for these 120 cells were based on Census data. Percent of the sample in these cells was based on survey data. Weights were calculated using the formula presented earlier (weight = population % / sample %). Table 8.12 provides an example of calculations and weights for one of the five counties.
Normalizing Weights
For analyses, the weighted overall number of cases (i.e., weighted sample size) should equal the unweighted overall number of cases (i.e., unweighted sample size) and the mean of the weights should be 1 (Glynn, 2004). If the weighted number of cases differs dramatically from the unweighted number of cases, tests of statistical significance may be invalid. To address this issue, weights should be adjusted by dividing the weight by the mean of the weights:
Weights theofMean
Weight WeightAdjusted =
Equation 8.8
Using this strategy, relative values of weights are unchanged, but they are normalized to have a mean of 1 and the sum of weights equals the number of cases. In general, if the weighted number of overall cases differs dramatically from the unweighted number of cases, normalized weighting is the recommended approach because it retains the original sample size. Appendix 1 in chapter 17 provides more weighting examples, including an example of normalizing weights.
Other Considerations for Weighting Data
The weighting strategies discussed involve adjusting sample data after it is collected so that it is more reflective of the larger target population. There are, however, strategies for weighting samples to adjust for unequal chances of selection when drawing a sample prior to data collec-tion (e.g., Salant & Dillman, 1994, p. 70). There are also more complex approaches for weighting data, including weighting based on multiple sources of population information such as com-bining data from nonresponse checks with Census information (see Beaman & Redekop, 1990; Kalton & Flores-Cervantes, 2003; Manfredo, Teel et al., 2003; Valliant, 2004 for reviews on various weighting approaches).

surveyimplementation,sampling,andweightingdata 217
Table 8.12 Sampling Weights for One of Five Counties Based on Multiple Variables from Census Data 1
County Population CategoryHispanic
Population% Hispanic Population
% Hispanic Sample
Hispanic Weight
Total Population 1,709,434% 18 and over 0.677Total Population 18+ 1,157,287
Male 18–29 71,871 0.062 0.023 2.700Male 30–39 55,711 0.048 0.027 1.783Male 40–49 38,600 0.033 0.045 0.741Male 50–59 18,964 0.016 0.042 0.390Male 60–69 9,450 0.008 0.025 0.327Male 70+ 7,094 0.006
Female 18–29 65,623 0.057 0.02 2.835Female 30–39 53,291 0.046 0.048 0.959Female 40–49 38,129 0.033 0.045 0.732Female 50–59 19,706 0.017 0.038 0.448Female 60–69 11,436 0.010 0.025 0.395Female 70+ 10,050 0.009 0.015 0.579
Non-Hispanic Population
% Non-Hispanic Population
% Non-Hispanic Sample
Non-Hispanic Weight
Male 18–29 80,993 0.070 0.037 1.891Male 30–39 75,968 0.066 0.055 1.194Male 40–49 83,455 0.072 0.08 0.901Male 50–59 58,634 0.051 0.116 0.437Male 60–69 34,983 0.030 0.103 0.293Male 70+ 34,769 0.030 0.01 3.004
Female 18–29 75,071 0.065 0.037 1.753Female 30–39 79,301 0.069 0.037 1.852Female 40–49 86,123 0.074 0.07 1.063Female 50–59 59,006 0.051 0.045 1.133Female 60-69 37,863 0.033 0.06 0.545Female 70+ 51,296 0.044
� Some cells are empty because no individual in the demographic category completed and returned a questionnaire.
There are two major issues that should be considered before weighting data. First, the researcher must be comfortable with how data used for weighting the sample were collected. For example, if data used for weighting were collected with nonprobability methods or were collected many years before the sample data, it may be unwise to use it as a basis for establishing weights because it may not be representative of the current population. Second, the sample size of data used for weighting should not be too small or substantially lower than the main sample. Assume, for example, that the number of completed questionnaires for a random survey was 14,510 with a 65% response rate, but a nonresponse check of 125 nonrespondents showed that respondents’ and nonrespondents’ answers differed for a few questions. Should the researcher assume that

218 surveyresearchandanalysis:applicationsinparks,recreation,andhumandimensions
answers from 125 nonrespondents are more representative of the population than answers from 14,510 respondents? This is a researcher decision, but given the high sample size and response rate, it can be argued that the larger sample is likely to be more representative.

surveyimplementation,sampling,andweightingdata 219
Chapter Summary
This chapter discussed various approaches for checking and pretesting a questionnaire, selecting samples of potential respondents, and administering questionnaires to individuals. Response rates, nonresponse checks, and approaches for weighting data were also examined.
This chapter discussed steps that should be taken before administering a questionnaire to deter-mine whether the instrument works satisfactorily or has any major problems. These steps include: (a) seeking expert advice from academicians or representatives of organizations supporting the project, (b) administering a pilot test of the questionnaire to a small group of people who are typical of likely respondents, and (c) performing a final check of the instrument to ensure that no errors are present. Questionnaires should be revised based on input and results from these steps before selecting a larger sample and proceeding with data collection.
Questionnaires should be administered to reduce errors in coverage, measurement, nonresponse, and sampling. Coverage error occurs with a discrepancy between the population and subset of individuals who are included in the sampling frame (e.g., incomplete population list). If there is error in coverage, all elements of the population do not have an equal or known chance of being included in the sample, which makes it difficult to use survey results to generalize to the larger population. Measurement error occurs when answers are imprecise, inaccurate, or cannot be compared to those of other respondents. This error occurs because of poor questionnaire wording and construction, type of survey used, influence of the interviewer, or behavior of the respondent. Nonresponse error occurs when some people in the sample do not respond to the questionnaire and are different from those who do in a way that is important to the study. One way to minimize this error is to use techniques for improving response rates. Sampling error is the extent to which a sample is limited in its ability to perfectly describe a population because only some elements in a population are sampled. When conducting a survey, there is always sampling error because sample data are rarely equal to population parameters. One way to avoid sampling error is to conduct a census (i.e., survey entire population), but this is often not realistic or feasible. Most human dimensions studies should at least obtain enough questionnaires to minimize sampling error to just ± 5% of the population at the 95% confidence level. Formulas for calculating sampling error and necessary sample sizes were provided in this chapter.
Once the population has been defined and a list of members has been obtained, it is necessary to choose a method for selecting a sample that represents the population from which it was drawn. This chapter discussed five sampling approaches. First, simple random sampling involves selecting a group of sampling units (e.g., people) where each member of the population has an equal nonzero chance of selection. Lottery techniques, tables of random numbers, and statistical software facilitate selection of random samples. Second, systematic samples require randomly selecting the first unit (i.e., person) in a sample population, choosing an appropriate fixed interval (i.e., every nth person), and systematically selecting units. Third, stratified random sampling involves dividing the sample population into different nonoverlapping groups (i.e., strata) that are of interest or deserve particular attention because of project objectives or hypoth-eses, and then selecting a random sample from each stratum. Fourth, cluster sampling involves conducting a simple random sample of groups or clusters, then sampling units (e.g., people) within selected groups or clusters. This approach differs from stratified sampling where a random sample is drawn within each group; cluster sampling involves a random sample of
220 surveyresearchandanalysis:applicationsinparks,recreation,andhumandimensions
groups. Fifth, multistage sample designs are more complex because they combine several single stage approaches into a multistage design (e.g., stratified-cluster approach).
This chapter discussed survey implementation strategies for encouraging high response rates and minimizing nonresponse error. Strategies such as multiple contacts, appearance of accompanying materials (e.g., envelopes), sponsorship, personalization, and other aspects of the communication process were discussed. Mail surveys, for example, should use multiple contacts (e.g., preno-tification, first questionnaire packet, thank you / reminder postcard, replacement questionnaire packet). Samples for telephone surveys should be selected using approaches such as the Waksberg methodology or plus-one method. Before conducting telephone surveys, it is important to estimate time needed to complete questionnaires and financial resources available to pay for associated costs, make arrangements for facilities and equipment, and hire and train interviewers. When conducting on-site surveys, it is important to estimate time necessary to achieve a specific sample size, ensure that interviewers are properly trained, inform public officials and agencies when questionnaires are being administered, and supply interviewers with appropriate materials (e.g., clipboards, pens, questionnaires, interviewer forms). Like mail surveys, electronic surveys should use prenotification letters and multiple contacts, but timing between contacts should be shorter. This chapter reviewed these and other techniques for implementing mail, telephone, on-site, and electronic surveys.
One reason for following implementation strategies outlined in this chapter is to achieve a high response rate. Response rate is the proportion of completed interviews to the total number of eligible respondents, and it indicates how successful the researcher was in gaining cooperation of respondents. This chapter reviewed several possible approaches for calculating response rates including the CASRO estimator for telephone surveys. One concern with low response rates is that individuals who completed a questionnaire may differ from those who did not complete a questionnaire. Nonresponse bias checks should be conducted with a sample of nonrespondents to ensure that they are not different from respondents. If nonrespondents are different, data may need to be weighted for sample results to represent the target population. This chapter provided several approaches, formulas, and syntax for weighting data based on nonresponse checks, population proportions, and Census data.

surveyimplementation,sampling,andweightingdata 221
Review Questions
1. Discuss three approaches for determining in advance if a questionnaire works satisfactorily or has any major problems.
2. Define each of the following terms: element, population, survey population, sampling unit, sampling frame, sample, observation unit, and completed sample.
3. Define and give an example of coverage error. What is one way to overcome this error?
4. Questionnaires are mailed to 50,000 hunters and 2,500 are completed and returned. Despite this large sample size, what is an obvious potential problem or error with this sample?
5. Define sampling error and suggest one way to avoid this type of error.
6. What does it mean when we say that the margin of error was ±5% and confidence was 95%?
7. In most parks, recreation, and human dimensions studies, what sample size is considered to be suitable? Why?
8. When segmenting samples into subgroups, what happens to sampling error? What is one way to avoid this happening?
9. Define and differentiate probability sampling from nonprobability sampling. List advantages and disadvantages of both types of sampling.
10. Describe simple random sampling (SRS); list three rigorous methods for selecting a SRS.
11. Define and differentiate haphazard and representative sampling.
12. Summarize the steps involved in using a table of random numbers to select a random sample.
13. Describe systematic sampling, using the concepts of sampling interval, sampling ratio, and periodicity in your description.
14. Describe how to conduct a stratified random sample and discuss two primary reasons why stratified samples are useful.
15. Define cluster sampling, summarize the steps involved in selecting a cluster sample, and explain how cluster sampling differs from stratified sampling.
16. Identify advantages of a multistage stratified-cluster sampling approach and describe how this strategy could be executed in a backcountry recreation area.
17. Explain in detail characteristics of four types of contacts when conducting a mail survey.
18. When conducting a mail survey, list three reasons why first-class postage is preferred.
19. What is a difference between voluntary and confidential?
20. Briefly describe how the Waksberg two-stage sampling design is implemented.
21. Describe the plus-one sampling methodology and list one advantage and one disadvantage of this methodology.
22. List five things that all interviewers should carry when administering on-site questionnaires.

222 surveyresearchandanalysis:applicationsinparks,recreation,andhumandimensions
23. Define response rate and explain why the response rate is important for survey research.
24. Using examples explain how you would calculate response rates for both mail and telephone surveys. Include formulas in your response.
25. What is a nonresponse bias check? Using an example and the appropriate formula, show how data can be weighted based on results of a nonresponse check.