suriname: 2009 article iv consultation - staff report ... · srd 2.745 per us$1 since 2006, is used...
TRANSCRIPT

© 2010 International Monetary Fund February 2010 IMF Country Report No. 10/44 January 8, 2009 January 28, 2009 xxxJanuary 29, 2001 xxxJanuary 29, 2001 January 28, 2009 Suriname: 2009 Article IV Consultation--Staff Report; Statement by the Staff Representative; Public Information Notice on the Executive Board Discussion; and Statement by the Executive Director The following documents have been released and are included in this package: • The staff report, prepared by a staff team of the IMF, following discussions that ended on
February 3, 2010, with the officials of Suriname on economic developments and policies. Based on information available at the time of these discussions, the staff report was completed on December 29, 2009. The views expressed in the staff report are those of the staff team and do not necessarily reflect the views of the Executive Board of the IMF.
• A staff statement.
• A Public Information Notice (PIN).
• A statement by the Executive Director for Suriname.
The policy of publication of staff reports and other documents allows for the deletion of market-sensitive information.
Copies of this report are available to the public from
International Monetary Fund • Publication Services 700 19th Street, N.W. • Washington, D.C. 20431
Telephone: (202) 623-7430 • Telefax: (202) 623-7201 E-mail: [email protected] Internet: http://www.imf.org
International Monetary Fund
Washington, D.C.

INTERNATIONAL MONETARY FUND
SURINAME
Staff Report for the 2009 Article IV Consultation
Prepared by the Staff Representatives for the 2009 Consultation with Suriname
Approved by Gilbert Terrier and Dhaneshwar Ghura
December 22, 2009
• Background. Economic growth is estimated to have decelerated to 2½ percent in 2009, from 5.3 percent during 2002-08. Inflation fell to below 1 percent, from almost 15 percent in 2008, on the back of lower international food and fuel prices. The external current account balance is estimated to have shifted from a surplus of 4 percent of GDP in 2008 to a deficit of 2 percent in 2009. International reserves are likely to strengthen to 5¼ months of imports at year’s end. Public debt has fallen from almost 37 percent of GDP at end-2005 to a projected 19 percent at end-2009.
• Focus of consultation. Discussions focused on the effects of the global economic environment on Suriname and the appropriate policy response. Staff noted that prudent policies have provided Suriname with some space to implement countercyclical policies, in an effort to cushion the impact of the global crisis. However, in the context of rapid expenditure growth, staff advised the authorities to delay the implementation of the second phase of the civil service wage reform. The authorities reaffirmed their commitment to the reform, but saw room for a phased implementation. The mission also encouraged them to unify the exchange rates. The authorities did not favor any change in this area prior to upcoming elections.
• Exchange system. Suriname has a dual exchange rate system, comprising the official and commercial markets. The official market, in which the Suriname dollar has been set at SRD 2.745 per US$1 since 2006, is used for government external financing and debt service operations. In the commercial market, which covers all other current account transactions, the currency is allowed to trade within the range of SRD 2.78-2.80 per US$1.
• Mission. The team that visited Paramaribo during October 19-31, 2009 comprised Gamal El-Masry (head), Yi Wu, and Nazim Belhocine (all WHD). Anne Joseph (OED, Senior Advisor) participated in the policy discussions. The team met with Minister of Finance Humphrey Hildenberg; Central Bank Governor André Telting; the Ministers of Agriculture, Home Affairs, Natural Resources, and Planning; other senior government officials; and representatives of the private sector, labor, the diplomatic community, and the opposition.

2
Contents Page I. Background and Economic Outlook......................................................................................3 II. Medium-term Outlook and Risks .......................................................................................10 III. Policy Discussions ............................................................................................................12
A. Fiscal Policies ........................................................................................................12 B. Monetary and Exchange Rate Policies ...................................................................14 C. Public Investment in the Mining Sector and Structural Issues ...............................18
IV. Staff Appraisal ..................................................................................................................19 Boxes 1. Recent Developments and Outlook in the Energy and Mining Sectors ................................5 2. Civil Service Wage Reforms ................................................................................................9 3. Assessments of the Equilibrium Real Exchange Rate and Current Account......................16 Figures 1. Macroeconomic Developments, 2003–09 ............................................................................4 2. External Indicators ................................................................................................................7 3. Fiscal Indicators ....................................................................................................................8 Tables 1. Selected Economic Indicators .............................................................................................21 2. Central Government Operations .........................................................................................22 3. Balance of Payments ...........................................................................................................23 4. Summary of Accounts of the Banking System ...................................................................24 5. Financial System Structure and Banking System Soundness Indicators ............................25 Appendices 1. Illustrative Medium-Term Projections and Debt Sustainabilty Analyses (DSAs) .............26 2. Summary of Informational Annexes ...................................................................................33 3. Draft Public Information Notice .........................................................................................34 Appendices Tables 1. Medium-Term Outlook .......................................................................................................28 2. Public Sector Debt Sustainability Framework, 2004–2014 ................................................29 3. External Debt Sustainability Framework, 2002–2014 ........................................................31 Appendices Figures 1. Public Debt Sustainability: Bound Tests ............................................................................30 2. External Debt Sustainability: Bound Tests .........................................................................32

3
Inflation, 12-month average in percent
-2
2
6
10
14
18
22
Jan-08 Apr-08 Jul-08 Oct-08 Jan-09 Apr-09 Jul-09 Oct-09
CPINon-core
Core
Proj.
Selected Caribbean Countries: Economic, Social, and Political Indicators
Guyana SurinameTrinidad &
Tobago
Economic IndicatorsGDP per capita (US$, 2008) 1,509 5,928 19,870Moody's sovereig (forex bank deposits LT) … B2 Baa1Unemployment rate (percent, 2007) 11.0 11.0 5.6
Social IndicatorsHuman development index (UNDP, rank) 1/ 114 97 64Health and primary education index (WEF, rank) 1/ 67 54 62Mortality rate, infant (per 1,000 live births, 2007) 45.0 27.4 31.1
Business ClimateGlobal competitiveness index (WEF, rank) 1/ 104 102 86Regulatory quality (WB, percentile rank) 2/ 31.8 25.6 70.5
Political IndicatorsPolitical stability (WB, percentile rank) 2/ 26.3 51.1 47.8Rule of law (WB, percentile rank) 2/ 27.7 44.4 48.8
Sources: World Bank; UNDP; Transparency International.1/ The lower, the better. 2/ The higher, the better.
I. BACKGROUND AND ECONOMIC OUTLOOK
1. Over the past decade, social peace and a broadly benign external environment have helped promote social and economic development in Suriname. The country ranks 97th out of 182 countries in the UNDP’s 2009 Human Development Index. Suriname’s economy has been dominated by the mineral and energy sectors (gold, alumina, and oil, primarily), which account for about 30 percent of GDP. Over the years, the production of rice, shrimp and fish, bananas, and lumber has lost importance in economic terms, but remains an important employer.
2. Reflecting the global economic slowdown, economic activity in Suriname has weakened and price pressures have abated (Figure 1). Faced with a sharp output decline in the alumina sector and lower alumina and oil prices, economic growth is estimated to have slowed to 2½ percent in 2009, from 6 percent in 2008 (Box 1). Potential output growth is estimated at about 5 percent of GDP. Twelve-month inflation is estimated to have fallen from 14½ percent in 2008 to less than 1 percent in 2009, reflecting lower international prices for food and fuel, and softer domestic demand. Food, energy, and transportation weigh heavily in the CPI (55 percent), and their domestic prices have fallen rapidly over the past twelve months. More recently, an uptick has been registered in the price of these goods, but core inflation has continued to level off.
3. The external current account balance is estimated to have shifted from a surplus of 4 percent of GDP in 2008 to a deficit of 2 percent in 2009 (Figure 2). The trade surplus narrowed significantly, despite an increase in gold and oil exports. Lower alumina exports allowed for some crude oil used in the refining process to be redirected for exports and, as a result, crude oil exports rose by around 35 percent in volume terms. In the capital account, a drawdown from the Netherlands Treaty Fund was used in August 2009 to clear longstanding arrears with Brazil, totaling US$118 million. Taking into account the recent SDR allocations of about US$125 million, international reserves were estimated at the equivalent of 5¼ months of imports at end-2009, up from 4¼ months in 2008.

4
Figure 1. Suriname: Macroeconomic Developments, 2003-09
Sources: National authorities; and IMF staf f estimates and projections.
0
1
2
3
4
5
6
7
8
9
-20
-10
0
10
20
30
40
2003 2004 2005 2006 2007 2008 Proj. 2009
MiningManufacturingReal GDP (right)
Growth(percent)
-20
-15
-10
-5
0
5
10
15
20
25
30
Oct-06 May-07 Dec-07 Jul-08 Feb-09 Sep-09
Inflation(12-m percent change)
Transportation & communIcation
Food, beverages, & tobacco Headline
Real GDP growth will weaken in 2009 driven by a fall in the mining and refining of bauxite...
Mainly driven by lower oil and food prices, inflation has fallen significantly ...
… but Suriname's economic performance remains above its regional peers.
… comparable to Suriname's regional peers.
-5
-3
-1
1
3
5
7
9
11
13
15
2004 2005 2006 2007 2008 Proj. 2009
Real GDP Growth(percent)
SUR
GUY
JAM
TTO
ECCU
BRB
-5
0
5
10
15
20
2004 2005 2006 2007 2008 Proj. 2009
Inflation, end-of-period(12-m percent change)
SUR
GUY
JAM
TTO
ECCU
BRB

5
Proj. Proj.2007 2008 2009 2010
Gold revenues (mn US$) 16.1 53.5 71.7 77.0Bauxite revenues (mn US$) 83.0 47.5 15.2 12.2Oil revenues (mn US$) 97.1 178.3 187.4 151.2Total Contribution
In millions of US$ 196.3 279.3 274.3 240.4In percent of GDP 8.1 9.1 9.3 7.4In percent of total revenue 28.3 36.3 33.2 29.7
Government Revenue From Oil, Bauxite and Gold Production
Box 1. Recent Developments and Outlook in the Energy and Mining Sectors Suriname’s economy remains dominated by the mining and oil sectors. In 2008, alumina, gold, and oil exports amounted to 55 percent of GDP and accounted for some 95 percent of total exports of goods. Bauxite mining is the oldest sector, and the production of alumina dates back to the early 20th century. Oil production began in 1980 by Staatsolie, a state-owned company, while gold production by the formal sector started in 2004. The production of alumina sharply contracted in 2009. The expected exhaustion of bauxite reserves in the mines around Paranam by 2010 prompted SURALCO (a subsidiary of ALCOA) to lower production levels by 40 percent, pending the development of a new mine in eastern Suriname by 2013. In July, SURALCO bought out BHP Billiton’s 45 percent share in their joint venture, and the government is considering to partner with SURALCO by taking a minority stake. The new company would develop a bauxite mine in the eastern Nassau region, with estimated reserves of 10 years. Negotiations are also ongoing between the government and various companies over the exploitation of large bauxite deposits in the Bakhuys mountains in western Suriname. Gold production has become the main source of export earnings. Gold production from the formal sector at the Rosebel Gold Mines (a subsidiary of Canada’s IAMGOLD) started in 2004. It is now reporting a production capacity of 365,000 ounces/year, with reserves to last at least 20 years. Negotiations for the establishment of a joint venture (SURGOLD) between SURALCO, the Newmont Mining Corporation, and the government of Suriname are well advanced. Initial exploration points to possible reserves of up to 3 million ounces in the eastern Nassau region. The much larger informal gold sector accounts for 60 percent of total gold production. It is weakly regulated and largely untaxed. Gold extracted by miners is sold to seven licensed, private brokers who further process it for exports. Oil production has so far been dominated by onshore extraction activities. By law, the exploitation of oil resources is granted exclusively to Staatsolie. Other companies can only access the market through production-sharing agreements with Staatsolie. Suriname’s oil output in 2008 reached a record high of 5.9 million barrels, making it broadly self sufficient. Suriname exported 45 percent of its crude oil production, while importing processed petroleum products of about equal value. Staatsolie has an ambitious investment program for the next four years, to expand its refining capacity and intensify exploration. Geological surveys estimate the potential oil reserves in the Guyana Basin at 15 billion barrels. The mineral sector is a major contributor to fiscal revenue. Total tax and nontax revenues from the three major mining companies accounted for 36 percent of total fiscal revenues in 2008. Tax revenue from SURALCO is expected to decline substantially during 2009–10, due to both lower alumina production and prices. Government revenues from Staatsolie, boosted in 2009 by delayed large dividend payments covering 2008, are projected to decline in 2010. In contrast, revenues from IAMGOLD are expected to continue to grow as a result of both higher gold volume and prices.

6
0
10
20
30
40
50
60
70
Jan-07 Sep-07 May-08 Jan-09 Sep-09-10
-5
0
5
10
15
20
25Monetary Indicators(12-m percent change)
Inflation (right)
Broad money
Credit to the private
-3
-2
-1
0
1
2
3
4
5
6
7
8
2005 2007 2009 2011 2013
Fiscal Impulse
Cyclically-adjusted fiscal impulse(in percent of GDP)
Real GDP growth(in percent)
4. Monetary and credit expansion moderated in 2009 (Figure 2). Broad money growth (y/y), which peaked at 33 percent in 2008Q1, decelerated to 8 percent in 2009Q1. However, it has since then risen again to 22 percent in September 2009, reflecting in part higher government spending financed by the central bank. Bank credit to the private sector declined from 42 percent in July 2008 to 17 percent in September 2009. Since 2007, the Central Bank of Suriname (CBvS) has kept the reserve requirements on deposits unchanged, at 25 percent on domestic currency deposits and 33 percent on foreign currency deposits.1
5. The fiscal balance is estimated to have deteriorated by 4 percent of GDP in 2009
(Figure 3). The underlying balance, which excludes one-off transactions related to the Brazilian debt, such as the receipt of the dedicated Netherlands grant and the payment of accumulated interest, is projected to deteriorate by close to 5 percent of GDP.
• Revenues: During 2006–08, the accounts of the public sector registered large surpluses (about 2 percent of GDP on average) thanks to rising revenues from robust economic growth, including from the buoyant mineral sectors. The drop in oil and mineral prices since 2008Q3 and a substantial reduction in alumina output depressed tax revenues in 2009. Indeed, the revenue situation would have been even worse, if not for exceptionally high dividend receipts from the state-owned oil company Staatsolie and from the central bank.
• Expenditures: The cyclical deterioration in public finances in 2009 was amplified by a surge in noninterest current spending arising from: (i) civil service wage increases starting in March 2009 (3.1 percent of GDP, see Box 2); (ii) higher spending on goods and services (2.5 percent of GDP); and (iii) elevated pension and other transfer payments, including for a mortgage subsidy scheme covering 2009–10 (1.2 percent of GDP).
1 Banks are allowed to hold up to 10 percent of the reserve requirement on domestic deposits in mortgages for low-income housing.

7
Figure 2. Suriname: External Indicators
Sources: Suriname authorities; and IMF staf f estimates and projections.
70
120
170
220
270
320
370
420
470
2003 2004 2005 2006 2007 2008 2009
Oil
Gold
Aluminum
Commodity Prices(index: 2003=100)
-20
-15
-10
-5
0
5
10
2003 2004 2005 2006 2007 2008 Proj. 2009
Current Account Balance
0
1
2
3
4
5
6
0
100
200
300
400
500
600
700
800
900
2003 2004 2005 2006 2007 2008 Proj. 2009
Gross International Reserves
US$ millions
In months of imports of goods and services
(right)
-100
400
900
1400
1900
2400
0
200
400
600
800
1000
1200
2003 2004 2005 2006 2007 2008 Proj. 2009
AluminaGoldOilTotal commodity exports (right)
Commodity Exports(US$ million)
Suriname has benefited from a commodity boom, which has since weakened somewhat.
International reserves increased steadily and remain strong, boosted by the recent SDR allocations.
The rise in gold export receipts has only partly offset the decline in oil and alumina exports...
… causing a weakening of the current account balance.

8
Figure 3. Suriname: Fiscal Indicators
Sources: Suriname authorities; and IMF staf f estimates and projections.
6
7
8
9
10
23
24
25
26
27
28
29
2003 2004 2005 2006 2007 2008 Proj. 2009
Revenue
Commodity revenue (right)
Revenue(percent of GDP)
15
17
19
21
23
25
27
29
31
33
35
2003 2004 2005 2006 2007 2008 Proj. 2009
Capital expenditureNon-interest current expenditure
Expenditure(percent of GDP)
-14
-12
-10
-8
-6
-4
-2
0
2
4
6
8
10
2003 2004 2005 2006 2007 2008 Proj. 2009
Non-mineral balance
Overall balance
Overall and Non-mineral Balances(percent of GDP)
0
5
10
15
20
25
30
35
40
45
50
2003 2004 2005 2006 2007 2008 Proj. 2009
ExternalDomestic
Public Debt(percent of GDP)
Revenue growth has been strong... ... while primary spending has been declining before surging in 2009.
As a consequence, fiscal balances remained buoyant but are turning negative in 2009...
... and public debt has declined sharply in recent years.

9
Box 2. Civil Service Wage Reforms
In 2009, Suriname embarked on a wage reform effort, as part of a wider civil service reform agenda. The wage reform was the culmination of many years of discussions between the government, consultants, and civil service unions, while the wider civil service reform program was developed with the assistance of foreign donors to streamline the civil service and increase its efficiency. The objective of these efforts was to improve the competitiveness of civil servants’ pay, while at the same time making the civil service leaner and more efficient over time, including through natural attrition. The first stage of the wage reform (FISO-1) was launched in March 2009, with retroactive effect to January 1, 2008. It involved the grading of some 40,000 civil servant positions based on five criteria (skills and training; inconvenience; contact with others; management duties; and responsibilities), with the view to placing them into eleven pay grades, with three sub-grades each. Since the authorities had provided the assurance that no position under FISO-1 would be graded below its previous pay-grade, the exercise resulted in a considerable upward adjustment for nearly all positions. Thus, starting in March 2009, positions in various branches of the civil service were successively upgraded, with one month’s additional wage adjustment paid every month for 14 months to cover the back period from January 2008 through February 2009. As a result, the wage bill is expected to increase from SRD 760 million in 2008 to about SRD 980 million in 2009. The second phase of the wage reform (FISO-2) is scheduled to be implemented in early 2010, with retroactive effect to January 1, 2009. The objective of FISO-2 is to decompress the wage bill. Consequently, the ratio between pay-grades would rise by providing wage increases to the higher civil service grades of up to 45 percent. While the overall additional cost of FISO-2 is still unclear, it is estimated that the wage bill would go up by at least another 20 percent. If back-pay provisions similar to FISO-1 are assumed, the impact on the wage bill in 2010 could be substantial. Accordingly, full implementation of FISO-1 and FISO-2 would result in a cumulative expansion of the wage bill by more than 50 percent, equivalent to 5.4 percent of 2009 GDP over two years.

10
Suriname: Main Economic Indicators, 2006-10
(In percent of GDP, unless otherwise indicated)
Proj.
2006 2007 2008 2009 2010
Real GDP (annual percentage change) 3.8 5.2 6.0 2.5 4.0CPI inflation (average, percent) 11.3 6.4 14.6 0.7 5.5Broad money (annual percentage change) 21.1 30.5 10.9 19.1 12.9External current account balance 7.5 7.5 3.9 -2.0 -5.3Central government balance 0.9 3.0 2.0 -1.8 -3.8Total public debt 30.2 21.1 17.9 19.2 20.8
Of which: external debt 18.3 12.2 10.3 8.6 9.5Gross international reserves (US$ millions) 264.3 433.4 665.6 777.8 810.0
(in months of imports of G&S) 2.6 3.6 4.2 5.2 4.6
Sources: Suriname authorities; and IMF staff estimates and projections.
6. Public debt has declined significantly in recent years. Healthy fiscal surpluses, together with robust economic growth and the clearance of longstanding arrears with bilateral creditors, have helped reduce the public debt-to-GDP ratio from 37 percent of GDP in 2005 to around 19 percent in 2009. This ratio is currently one of the lowest in the region. As a result of the clearance of Brazilian debt arrears—US$118 million, including a write-off of US$44 million—Suriname only has remaining bilateral arrears with the United States (estimated at US$31 million, or 1 percent of GDP, half of which in the form of accumulated penalties).
0
20
40
60
80
100
120
140
05 08 05 08 05 08 05 08 05 08 05 08 05 08
Foreign debtDomestic debt
Public Debt, 2005-08(percent of GDP)
Argentina Bolivia Venezuela Ecuador Trinidad & Tob. Paraguay Suriname
II. MEDIUM-TERM OUTLOOK AND RISKS
7. The medium-term economic outlook for Suriname is favorable. The mission prepared with the authorities a medium-term macroeconomic framework predicated on fiscal prudence, with the view of attaining fiscal balance by the end of the projection period. This scenario includes gradually phasing in the second stage of the wage reform program, starting

11
in 2011 (see below). After a further small deterioration in 2010, mainly reflecting carry-over effects from the countercyclical policies initiated in 2009, the fiscal accounts would progressively improve and revert back to a small surplus beginning in 2014, as economic output and commodity prices recover. Over the medium-to-long term, revenues would be expected to benefit from a permanent boost from a higher level of government participation in the alumina and gold sectors (Appendix I). The external current account balance would deteriorate in the near term before rebounding beginning in 2013, when large bauxite and gold mines come on stream. The expansion of Staatsolie’s oil refining capacity would also help reduce the need for imported refined petroleum products beginning in 2013. Under this scenario, both the public and the external debt levels remain low and manageable over the medium term, at below 23 percent of GDP and 11 percent of GDP, respectively. By returning back to debt levels at the end of the projection period, similar to those going into the current downturn, this framework would provide the authorities with stable finances and welcome space to react to future shocks. Thus, even under standard and combined shocks, the public debt would not rise above 33 percent of GDP.
8. Economic risks to the outlook are broadly balanced for the near term, and tilted to the upside for the medium term. In the recent period, local gold production has surged in response to high prices, while the economic recovery in Asia has helped support alumina prices. In the short run, downside risks to the economic outlook are associated with the possibility of a slower global recovery than anticipated. There is also a risk that, in the run-up to the May 2010 elections, government spending on wages and goods and services increases excessively. Additional budgetary costs could also arise in connection with the need to recapitalize two state-owned banks and resolve the problems facing CLICO-Suriname (see below). Over the medium term, large capital projects by the government and Staatsolie are expected to sustain growth through 2013, when a major increase in alumina and gold production is expected (Box 1).
9. There are some political risks and uncertainties associated with the 2010 general elections. The newly elected legislature, the National Assembly, will be charged with choosing the President of the Republic by a two-thirds majority. If it fails to do so after two attempts, the election of the President will be referred to the larger People’s Assembly. The latter, which is empowered to elect the President by a simple majority, comprises Members of the National Assembly, as well as local and districts councilors. Given Suriname’s indirect and complex process for electing the President, there is a risk that the new office holder may not be determined for an extended period following the parliamentary elections. There is also a risk of political stalemate if the President is elected by the People’s Assembly and does not muster the support of the National Assembly.

12
III. POLICY DISCUSSIONS
10. Policy discussions focused on the effects of the global economic slowdown on Suriname and the appropriate policy response. There was broad agreement that the authorities’ prudent management of the economy in recent years, during the commodity boom, was providing them with some fiscal space to respond to the global crisis. Discussions thus focused on how best to use this space without placing undue pressure on resources. Staff also discussed with the authorities their investment plans in the oil and mining sectors.
A. Fiscal Policies
11. With low public debt levels, Suriname has space to implement countercyclical fiscal policies. Staff took the view that, in order to be effective, fiscal policies needed to be timely, targeted, and temporary. There was agreement with the authorities that the relaxation of the fiscal stance in 2009 had provided a welcome boost to domestic demand, at a time when the economy was growing below potential. At the same time, there was a recognition that fiscal policy needed to take into account the country’s capacity constraints and that the fiscal impulse would need to be withdrawn once the recovery was well entrenched. In that context, staff’s main messages to the authorities were to:
(i) delay the second phase of the wage reform program, planned for early 2010, until the fiscal accounts had stabilized;
(ii) resist pressures to further boost spending ahead of the May 2010 elections, and rein in current spending in 2010 and over the medium term;
(iii) strengthen tax collections, including by making use of CARTAC technical assistance in this area; and
(iv) prudently expand foreign borrowing to finance the government’s expected investments in infrastructure and the mining sectors.
Revenue
12. In 2010, public sector revenue is projected to return to more normal levels than in 2009, when weaker direct tax revenue was more than offset by exceptionally high nontax revenue. Tax collections are expected to benefit marginally from the pickup in economic activity and domestic demand, while nontax revenue would revert back to historic levels. In an effort to enhance business activity, the authorities were considering reducing the corporate tax rate from its current level of 36 percent. The staff advised the authorities to resist such a reduction. It noted that, with over 75 percent of all corporate tax revenue collected from just three large companies in the mineral sector, such a tax rate reduction would essentially amount to a transfer payment to them. The staff took the view that such a cut was not advisable at a time of significantly weaker public finances.
13
Current spending
13. Staff projections show that, under prudent policies, noninterest current spending would rise from less than 20 percent of GDP in 2008 to around 24 percent in 2010. Although an important part of the increase is related to the wage reform, other recurrent outlays are also registering strong increases:
The mission estimated that the implementation of the first phase of the wage reform (FISO-1) led to an increase in the wage bill of 29 percent in 2009 (Box 2), boosting the wage bill to 12 percent of GDP in 2009.
The second phase of the civil service reform (FISO-2) is scheduled to be implemented in early 2010, with retroactive effect from January 1, 2009. Staff computations showed that full implementation of FISO-2 would have the effect of raising the wage bill to 13-14 percent of GDP. Thus, the staff recommended postponing the reform and implementing it gradually over several years.
Expenditure on goods and services is estimated to have risen from 5 percent of GDP in 2008 to 7½ percent in 2009. The staff suggested a more moderate path in 2010.
14. The mission recommended postponing the FISO-2 reform by at least one year and implementing it gradually. The staff underscored its support for improving the competitiveness of civil service pay. This would help enhance the recruitment and retention of qualified staff and increase efficiency in the civil service. However, the staff argued that implementing the full second stage of the reform in early 2010, as scheduled, would lead to an excessive widening in the fiscal deficit. It would also drive up private sector wages and likely lead to higher inflation, thereby undermining competitiveness. The staff therefore recommended implementing FISO-2 over a period of 3-4 years, beginning in January 2011.
15. The mission also advised the authorities to curb the rate of growth of nonwage current spending. The staff noted that the purchase of goods and services as well as other components of current spending, including civil service pensions, had grown very rapidly in 2009. Some of these increases would put a permanent strain on the country’s fiscal accounts. The staff recommended phasing in programmed increases in civil service pensions over several years, to avoid jeopardizing macroeconomic stability. With respect to the increase registered in 2009 in subsidies and transfers, the staff noted that it was largely attributable to a mortgage subsidy scheme introduced in early 2009. The staff considered that this increase was justifiable, given that the scheme, designed to promote low-income private home construction through the provision of subsidized mortgage interest rates, was temporary (through end-2010) and well targeted.
16. The authorities expressed their concern with the deterioration in the fiscal accounts. In particular, they acknowledged the risks that this posed of igniting a new wave of inflation. They explained that the wage agreements had been reached after lengthy

14
deliberative consultations with civil society. While reiterating their intention to implement the wage reforms, they noted that these agreements also contained a clause allowing them to delay their implementation, if justified by fiscal considerations. The authorities explained that they would aim to curb expenditures to prevent a large budget deficit, including by delaying the implementation of FISO-2, even though pressures will be mounting for higher government spending in the run-up to the May 2010 elections.
Capital projects
17. Capital spending, which has been broadly stable at around 5 percent of GDP in recent years, is projected to rise in the coming years. Large investments are either underway, or expected to begin in the near future, for infrastructure and in the mining sector. The staff and the authorities agreed that public investment programs should be implemented in a sustainable way and consistent with the country’s absorptive capacity. Implementation of these projects will also raise the country’s growth potential. The staff welcomed the government’s program of enhancing vital infrastructure, such as roads and port facilities. It advised the authorities to seek to finance them through concessionary loans or grants. The authorities concurred, noting that most large public investment projects were being financed through concessionary foreign loans.
Public debt
18. Suriname’s public debt is projected to remain relatively low, at 21 percent of GDP by end-2010. Given that a significant proportion of the debt is at concessionary terms, the interest bill of the government is low, at around 1 percent of GDP. Staff encouraged the authorities to clear the remaining outstanding bilateral arrears with the United States. It noted that clearing these arrears would help improve Suriname’s credit ratings and reduce the costs of external commercial borrowing. The authorities explained that they had offered to pay the principal and interest, and asked the United States to waive the penalties, similar to the arrangements that they had reached with other donors.
B. Monetary and Exchange Rate Policies
19. The staff noted that, if the deterioration in public finances were to be larger than anticipated, there would likely be a need to tighten monetary policy. Notwithstanding the sharp decline in inflation, the mission advised the authorities not to ease the monetary policy stance at this stage, given that domestic demand is being boosted by government expenditure. At the same time, private sector credit growth remains relatively strong, at 17 percent. The staff cautioned that, should the fiscal situation deteriorate further, the authorities might need to consider tightening monetary policy through an increase in reserve requirements. The staff also recommended developing a secondary market for government securities, to gradually move toward relying on open market operations as the main monetary policy tool. It encouraged the CBvS to seek technical assistance to strengthen its capacity in this area.

15
20. Estimates of the equilibrium real effective exchange rate indicate that the rate in the official market may be slightly overvalued (Box 3). Suriname has a dual exchange rate regime, comprising the official and the commercial markets.2 In addition, there is an unofficial parallel market, in which the currency has been slightly more depreciated than in the official market by 5-7 percent in recent months. The spread in the parallel market rate has widened in recent months, which analysts generally explain by the growing uncertainty surrounding the May 2010 national elections. The observed depreciation in the parallel market appears to be also consistent with the results of the estimation of the equilibrium real effective exchange rate. These estimates suggest that, at end-2008, the official rate was slightly overvalued. Suriname also has extensive capital controls aimed at shielding the country from volatile capital movements.3
21. The mission encouraged the authorities to work toward gradually unifying the official and commercial foreign exchange markets. It also advised them to use the flexibility provided to them under the de jure managed-float regime to allow the unified exchange rate to find its equilibrium level. The CBvS could intervene, as needed, to smooth out fluctuations in the rate. The staff noted that Suriname’s current comfortable reserve position provided a good opportunity for such a move. The authorities agreed that unifying the official and commercial exchange rates would help reduce distortions. However, they did not support allowing the rate to float at this stage. They cautioned that such a shift would need to be gradual, as the upcoming election cycle was expected to bring additional uncertainty to the markets.
Financial Sector
22. The Surinamese banking sector has weathered the global financial crisis reasonably well. It remains insulated from global finance, mainly because of its very limited external exposure to risky financial instruments and investments. In the recent past, commercial bank profitability has declined somewhat, in line with the weakening in domestic demand. The nonperforming loan (NPL) ratio for the banking sector as a whole rose moderately, from 7.9 percent at end-2008 to 8.5 percent in September 2009. While banks generally appear well capitalized, conditions in individual banks vary considerably. In particular, two small state-owned banks are significantly undercapitalized. The mission encouraged the authorities to recapitalize them promptly, given that the cost to the budget would be small, at about 0.4 percent of GDP. The authorities explained that they were 2 The spread between the official and commercial rates is generally less than 2 percent. 3 All capital transactions require the approval of the Foreign Exchange Commission (FEC). Such controls apply to the contracting of foreign capital and money market instruments, derivatives, and credit. In particular, all inward or outward real estate transactions are subject to approval by the FEC. These capital controls may also explain in part the spread between the commercial and unofficial parallel market rates.
16
85
95
105
115
125
135
145
155
2003 2004 2005 2006 2007 2008 200990
92
94
96
98
100
102
104
106
108Exchange Rates(index: 2003=100)
Real effectiveexchange rate
Nominal effective exchange rate
US$/SRD (right)
Actual current account balance (2008) 3.9
adjusted for mineral exports prices 2.1for cyclical FDI on imports 0.5for cyclical export boom on income payments -2.5for temporary grants -0.7for business cycle 0.3
Underlying current account 3.7
Box 3. Assessments of the Equilibrium Real Exchange Rate and Current Account
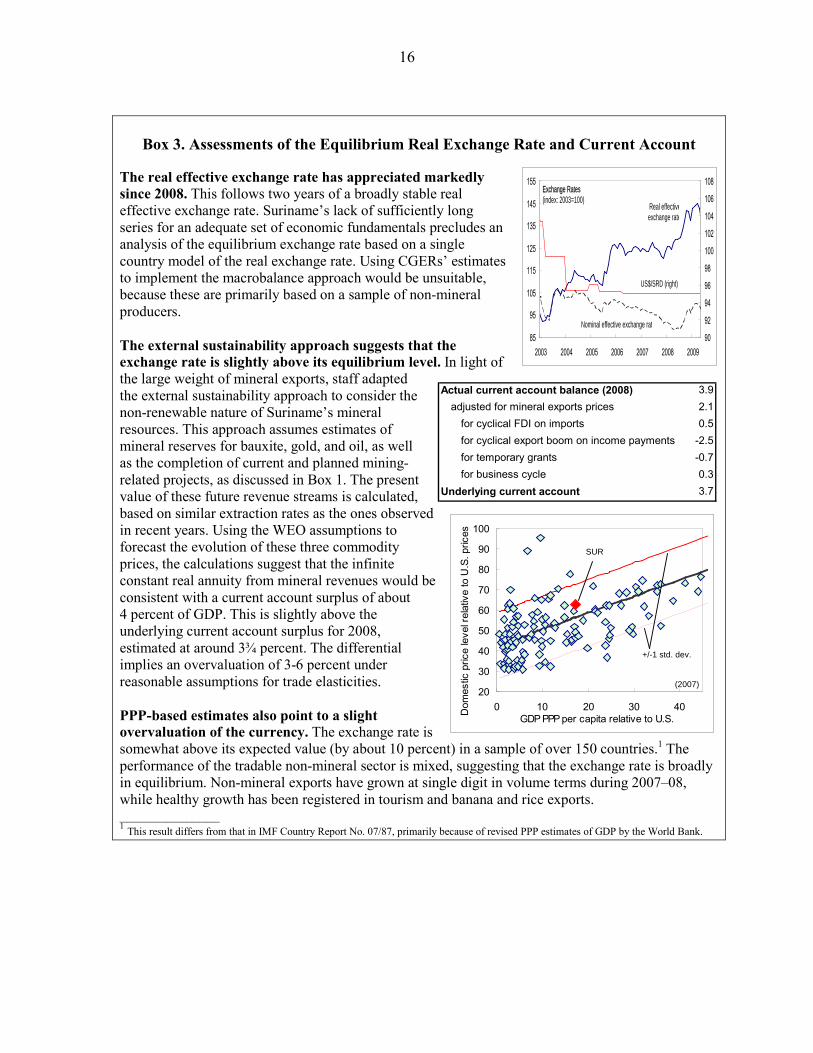
The real effective exchange rate has appreciated markedly since 2008. This follows two years of a broadly stable real effective exchange rate. Suriname’s lack of sufficiently long series for an adequate set of economic fundamentals precludes an analysis of the equilibrium exchange rate based on a single country model of the real exchange rate. Using CGERs’ estimates to implement the macrobalance approach would be unsuitable, because these are primarily based on a sample of non-mineral producers.
The external sustainability approach suggests that the exchange rate is slightly above its equilibrium level. In light of the large weight of mineral exports, staff adapted the external sustainability approach to consider the non-renewable nature of Suriname’s mineral resources. This approach assumes estimates of mineral reserves for bauxite, gold, and oil, as well as the completion of current and planned mining-related projects, as discussed in Box 1. The present value of these future revenue streams is calculated, based on similar extraction rates as the ones observed in recent years. Using the WEO assumptions to forecast the evolution of these three commodity prices, the calculations suggest that the infinite constant real annuity from mineral revenues would be consistent with a current account surplus of about 4 percent of GDP. This is slightly above the underlying current account surplus for 2008, estimated at around 3¾ percent. The differential implies an overvaluation of 3-6 percent under reasonable assumptions for trade elasticities. PPP-based estimates also point to a slight overvaluation of the currency. The exchange rate is somewhat above its expected value (by about 10 percent) in a sample of over 150 countries.1 The performance of the tradable non-mineral sector is mixed, suggesting that the exchange rate is broadly in equilibrium. Non-mineral exports have grown at single digit in volume terms during 2007–08, while healthy growth has been registered in tourism and banana and rice exports. _______________ 1 This result differs from that in IMF Country Report No. 07/87, primarily because of revised PPP estimates of GDP by the World Bank.
20
30
40
50
60
70
80
90
100
0 10 20 30 40GDP PPP per capita relative to U.S.
SUR
+/-1 std. dev.
Dom
estic
pric
e le
vel r
elat
ive
to U
.S. p
rices
(2007)

17
40
44
48
52
56
60
64
68
Jan-05 Mar-06 May-07 Jul-08 Sep-0980
100
120
140
160Dollarization Ratios(in percent)
Forex deposit to total deposit
Forex credit to total credit
Forex reserves coverage (right)
planning to do so in the near future. They also agreed with the staff on the need to strengthen the supervision of the financial sector as a whole.
23. Although dollarization exposes the financial system to risks arising from potential currency mismatches, banks appear to be relatively well protected. After several years of decline, bank deposit dollarization has edged up in recent months. The share of foreign currency-denominated deposits rose from 51 percent of total deposits in April 2009 to 54 percent in September 2009. At the same time, the trend decline in the share of foreign currency loans in total loans has continued, to 43 percent in September.4
banks’ lending operations in foreign currency, In order to contain
the CBvS has maintained a high reserve requirement of 33.3 percent on their foreign currency deposits (compared with 25 percent for local currency deposits), which banks are allowed to hold in interest-bearing accounts abroad. As a result, banks’ net foreign exchange position is broadly in equilibrium. In an effort to reduce dollarization in the economy, the Ministry of Trade and Industry has also recently announced that it will vigorously enforce regulations requiring that all goods be priced in Surinamese dollars.
24. As a whole, the foreign reserves coverage of the banking system has improved substantially. Official international reserves have increased significantly in recent years, to about US$800 million at end-September 2009, equivalent to 5.3 months of imports. This development has contributed to a sharp increase in the foreign reserves coverage of the banking system, from 87 percent of banks’ foreign currency deposits at end-2005 to 153 percent at end-September 2009.
25. In the rest of the financial system, early action will be needed to resolve the problems of CLICO-Suriname. Following a run by depositors and policyholders in July, a court approved a moratorium on payments by CLICO-Suriname, a subsidiary of the troubled Trinidadian conglomerate Colonial Life Financial (CLF). This decision provided the authorities with some time to facilitate the possible take-over of CLICO-Suriname by another local insurance company. The mission encouraged the authorities to resolve the situation expeditiously, to help stem the deterioration in its balance sheet and avoid possible contagion to other financial institutions. Such a resolution should aim at minimizing the cost to the
4 Despite the sharp decline in U.S. interest rates since 2007, foreign currency deposit rates in Suriname have remained broadly unchanged over the past three years, at 3-3½ percent. Lending rates on operations in U.S. dollars have also remained broadly unchanged, at 9½-10 percent.

18
budget, while at the same time addressing the risk of moral hazard by enforcing market discipline on policyholders and investors, who sought large gains at high risks.
26. The mission recommended that Suriname participate in the Financial Sector Assessment Program (FSAP). Such an exercise would assess the health of the financial sector and make practical recommendations on how to strengthen bank and nonbank supervision. It would also make recommendations toward the introduction of indirect monetary policy instruments. The authorities agreed on the merits of an FSAP exercise, and formally requested that an FSAP mission visit Suriname as soon as possible.
C. Public Investment in the Mining Sector and Structural Issues
27. The mission supported the authorities’ plan to increase Suriname’s share in the exploitation of its natural resources. Under these plans, which enjoy wide public backing, the government will undertake sizeable investments in the mining and energy sectors, primarily as a minority shareholder in private ventures. This would give Suriname an opportunity to boost its share in the development of the country’s natural resources, and ensure a greater flow of revenue to the government for the benefit of the broad population. The staff encouraged the authorities to also consider alternative fiscal measures to boost the government’s take in the mining sector. It noted that any direct equity investment entailed some risks to the government, and should be undertaken within the context of a long-term comprehensive growth strategy of diversification, and economic and environmental sustainability.
28. The staff encouraged the authorities to diversify the country’s economic base in the medium term. Such a diversification would help steer the economy away from over-reliance on the mining sector, and toward new opportunities for growth and employment. To this end, the mission welcomed the ongoing increase in the number of hotels and eco-tourism activities, demonstrating considerable growth potential in the tourism industry. Likewise, the rice and banana sectors continue to hold promise for growth and employment.
29. To further enhance long-term growth, staff recommended the adoption of structural reforms, which the authorities broadly endorsed. These reforms would aim at strengthening public finances and improving the efficiency of the Suriname economy over the medium term:
Strengthening revenue administration. Following up on the mission’s recommendations, the authorities have requested technical assistance from CARTAC to do preparatory work in early 2010 on options to improve the efficacy and administration of indirect taxes. This work would enable the successor government to take informed decisions on the way forward soon after taking office.

19
Restructuring of public companies. Sustained efforts have been undertaken in this area. The restructuring of the state-owned rice company is almost complete, and the full privatization of the banana company is scheduled to take place in 2010.
Improving the business environment. Suriname lags behind its neighbors with regard to a business-supportive environment. In its 2010 Doing Business Report, the World Bank placed Suriname 155th among 183 countries, the lowest ranking in the Caribbean region. The mission called on the authorities to intensify their efforts to reduce red tape and excessive bureaucratic steps associated with the establishment and running of private businesses. It emphasized that simplifying business licensing requirements and procedures would encourage greater domestic and foreign private investment.
IV. STAFF APPRAISAL
30. Suriname has weathered the global economic crisis relatively well. While output growth fell below potential in 2009, it is estimated to have remained positive. Weaker activity in the alumina sector was partly offset by stronger performance in the gold and construction sectors. Inflation pressures have diminished markedly, and private credit expansion has eased. While the external current account balance has shifted to a deficit, this deficit was relatively small in 2009, and international reserves are at comfortable levels.
31. The prudent policies that were implemented in recent years provide Suriname with some space to undertake countercyclical fiscal policies. The authorities have reduced the public debt-to-GDP ratio to one of the lowest levels in the region, providing them with some room to relax the fiscal stance in order to cushion the impact of the global slowdown. In order to be effective and sustainable, such a relaxation will need to be consistent with macroeconomic stability and fiscal sustainability.
32. In that context, there is a need to avoid undue increases in fiscal spending. During 2009, fiscal outlays grew rapidly, reflecting the implementation of the first phase of the civil service wage reform, higher pension payments, and sharp increases in subsidies and in purchases of goods and services. The staff is concerned that the full implementation of the civil service reform in the months ahead could lead to excessive pressure on resources and set off an inflationary process. Delaying the implementation of the second stage of the civil service reform by at least one year, and implementing it gradually thereafter over a period of several years is advisable. The staff also recommends bringing the growth of other current outlays under control. It advises against weakening tax collections through undue reductions in the corporate tax rate and supports the authorities’ efforts to strengthen tax administration, including with technical assistance from CARTAC.
33. Monetary policy appears appropriate. However, if fiscal spending is not restrained in the months ahead, or if the rate of spending growth increases, there may be a need for an early tightening in monetary conditions. The staff encourages the authorities to develop a

20
secondary market for government securities and gradually move over the medium term toward relying on open-market operations as the main monetary policy tool. Staff estimates suggest that the Suriname dollar may be slightly overvalued, although the computations suggest that this is within the margin of error. The staff encourages the authorities to work toward gradually unifying the official and commercial market exchange rates, and to introduce more flexibility in the exchange rate regime. The staff does not recommend approval of the multiple currency practices, as there is no timetable for their removal.
34. The Surinamese banking sector has weathered the global financial crisis reasonably well. While banks generally appear well capitalized, NPL ratios have increased slightly and conditions in individual banks vary considerably. The staff encourages the authorities to promptly recapitalize the two undercapitalized small state-owned banks and to resolve the situation in CLICO-Suriname expeditiously and at a minimum cost to the budget. It welcomes the authorities’ plans to strengthen the supervision of the financial sector and supports their request for an FSAP in the near future.
35. The medium-term prospects are favorable, with large investment projects in infrastructure, and in the mining and oil sectors. Over the medium term, the external current account balance is expected to shift to a robust surplus, benefiting from a sustainable boost in exports from large mining projects in the alumina and gold sectors. The staff encourages the authorities to continue financing public sector investments through foreign concessionary financing. It also endorses the authorities’ plan to increase Suriname’s share in the exploitation of its natural resources. Such investments can be justified by the country’s low public debt ratio and comfortable reserve position, and would ensure a greater flow of revenue to the government for the benefit of the broad population. The authorities are encouraged to intensify their efforts to simplify business licensing requirements, which will help promote investment.
36. The staff recommends that the next Article IV consultation with Suriname be held on the standard 12-month cycle.

21
Table 1. Suriname: Selected Economic IndicatorsEst.
2005 2006 2007 2008 2009 2010
(Annual percentage change, unless otherwise indicated)
Real sectorGDP at current prices (US$ millions) 1/ 1,788 2,129 2,424 3,058 ... ...GDP at current prices (SRD millions) 1/ 4,900 5,845 6,653 8,394 8,130 9,134Real GDP 1/ 4.4 3.8 5.2 6.0 2.5 4.0Nominal GDP 1/ 20.8 19.3 13.8 26.2 -3.1 12.3GDP deflator 15.6 14.9 8.2 19.0 -5.5 8.0Consumer prices (end of period) 15.8 4.7 8.4 9.3 5.7 5.5Consumer prices (period average) 9.9 11.3 6.4 14.6 0.7 5.5Exchange rate (end of period) 2.74 2.75 2.75 2.75 ... ...
Money and creditBanking system net foreign assets 3.7 37.5 49.1 26.1 6.2 9.1Broad money 11.7 21.1 30.5 10.9 19.1 12.9Private sector credit 25.1 27.6 31.2 36.3 12.9 13.7
Deposit dollarization ratio (percent) 2/ 57.2 56.3 55.4 53.8 53.7 ...Credit dollarization ratio (percent) 2/ 50.1 52.9 51.0 46.3 42.6 ...
Public sector credit (percent of GDP) -0.1 -6.8 -10.9 -18.9 10.7 ...
(In percent of GDP, unless otherwise indicated)
Savings and investment Private sector balance (savings-investment) -12.3 6.6 4.6 2.0 -0.2 -2.2Public sector balance -0.7 0.9 3.0 2.0 -1.8 -3.5
Savings 3.7 4.2 7.9 7.0 3.3 2.2Investment 4.5 3.4 5.0 5.0 5.1 5.7
Foreign savings 13.0 -7.5 -7.5 -3.9 2.0 5.7
Central governmentRevenue and grants 27.6 27.4 30.5 27.5 31.2 27.8Total expenditure 30.1 28.7 28.3 25.6 33.1 31.3
Of which : noninterest current expenditure 23.2 23.3 21.9 19.9 26.6 24.0Statistical discrepancy 1.7 2.2 0.7 0.0 0.0 0.0Overall balance -0.7 0.9 3.0 2.0 -1.8 -3.5Net domestic financing 0.1 -0.4 -2.8 -2.3 2.0 1.6Net external financing 0.6 -0.4 -0.2 0.3 -0.2 1.9
Total public debt 36.6 30.2 21.1 17.9 19.2 21.0Domestic 15.3 11.9 8.8 7.6 10.6 11.1External 21.4 18.3 12.2 10.3 8.6 10.0
Of which : arrears 7.9 7.1 5.5 4.9 1.3 1.3
External sector Terms of trade (percent change) -0.8 -2.8 -0.6 1.0 1.6 -0.2Current account balance -13.0 7.5 7.5 3.9 -2.0 -5.7Change in reserves (- increase) -1.6 -4.9 -7.0 -7.6 -3.8 -1.1Gross international reserves (US$ millions) 3/ 161 264 433 666 778 813
In months of imports 1.6 2.7 3.6 4.2 5.2 4.8Foreign reserves coverage 2/ 4/ 87.1 99.3 119.7 143.4 153.2 ...
Sources: Suriname authorities; and IMF staff estimates and projections.1/ GDP numbers include estimates of the informal sector.2/ 2009 data up to September.3/ For 2009, includes the share of Suriname in the IMF Special and General SDR allocation which
amounted to SDR 80.4 million (US$ 125.3 million). 4/ (Official gross international reserves + commercial bank holdings of liquid foreign currency
assets) / (foreign currency deposits at banks).
Proj.

22
Table 2. Suriname: Central Government Operations(In percent of GDP)
Est. Proj.2005 2006 2007 2008 2009 2010
Revenue and grants 27.6 27.4 30.5 27.5 31.2 27.8Revenue 25.9 26.0 28.6 25.2 27.9 25.0 Direct taxes 11.0 10.4 11.7 10.5 9.3 9.5 Indirect taxes 10.3 11.5 12.1 10.6 10.8 10.9 Nontax revenue 4.6 4.0 4.8 4.1 7.8 4.6Grants 1.7 1.4 1.9 2.4 3.3 2.8
Expenditure and net lending 30.1 28.7 28.3 25.6 33.1 31.3Current expenditure 25.5 25.1 23.3 20.6 27.9 25.0 Wages and salaries 1/ 11.0 10.4 10.4 9.0 12.1 11.2 Goods and services 6.2 6.3 5.2 5.0 7.5 6.6 Subsidies and transfers 6.0 6.6 6.3 5.8 7.0 6.2 Interest 2.4 1.8 1.4 0.7 1.3 1.0 Domestic 1.6 1.2 0.9 0.5 0.5 0.7 External 0.8 0.6 0.6 0.2 0.8 0.3Net lending 0.1 0.2 0.0 0.0 0.0 0.6Capital expenditure 4.5 3.4 5.0 5.0 5.1 5.7
Statistical discrepancy 1.7 2.2 0.7 0.0 0.0 0.0
Primary balance 1.6 2.7 4.4 2.7 -0.5 -2.6 Overall balance -0.7 0.9 3.0 2.0 -1.8 -3.5 Excluding exceptional interest and grants 2/ -0.7 0.9 3.0 2.0 -2.8 -3.5
Financing 0.7 -0.9 -3.0 -2.0 1.8 3.5
Net domestic financing 0.1 -0.4 -2.8 -2.3 2.0 1.6Commercial banks -0.2 0.4 -0.9 -0.9 -0.5 0.2Central bank 0.1 -1.1 -2.0 -1.5 2.0 1.0Other domestic private sector 0.2 0.2 0.2 0.2 0.4 0.4Net external financing 0.6 -0.4 -0.2 0.3 -0.2 1.9Amortization 3/ -1.8 -1.9 -5.5 -0.6 -4.0 -0.6Disbursements 2.4 1.4 1.2 0.9 2.3 2.5 Bilateral agencies 1.0 0.3 0.1 0.6 2.0 2.2 Multilateral agencies 1.4 0.7 1.1 0.3 0.3 0.3 Foreign commercial banks -1.0 0.0 0.0 0.0 0.0 0.0 Foreign nonbanks, including trade credit 0.7 0.0 0.1 0.0 0.0 0.0Exceptional external financing 4/ ... ... 4.2 ... 1.5 ...
Memorandum items:Primary expenditure 27.7 26.9 26.9 24.9 31.7 30.4Non-mineral balance -8.1 -6.8 -5.1 -7.2 -11.1 -10.9Non-mineral primary balance -5.7 -5.0 -3.7 -6.5 -9.7 -10.0Mineral revenue 7.4 7.7 8.1 9.1 9.3 7.4
Public debt 36.6 30.2 21.1 17.9 19.2 21.0
Sources: Suriname authorities; and IMF staff estimates and projections.
1/ Assumes that FISO-2 is not implemented in 2010. 2/ Excludes payment of accumulated interest and receipt of Dutch grants in connection with the clearance of the Brazilian debt. 3/ In 2009, includes repayment of debt, arrears and penalties on the Brazilian debt. 4/ Debt cancellation.

23
Table 3. Suriname: Balance of Payments(In millions of U.S. dollars)
Est. Proj.2005 2006 2007 2008 2009 2010 2011 2012 2013 2014
Current account -233 160 183 121 -59 -184 -157 -127 206 287
Trade balance -20 299 256 201 39 -34 26 84 483 607 Exports, f.o.b. 854 1,205 1,381 1,739 1,491 1,618 1,769 1,893 2,257 2,498 Of which : alumina, gold, and petroleum 790 1,135 1,305 1,647 1,402 1,526 1,675 1,796 2,157 2,395 Imports, f.o.b. -874 -906 -1,125 -1,538 -1,452 -1,652 -1,743 -1,809 -1,774 -1,891
Services, net -151 -35 -62 -80 -79 -98 -117 -134 -162 -184 Exports 204 234 253 285 267 278 287 297 309 320 Imports -355 -269 -315 -365 -346 -376 -404 -432 -470 -505
Income, net -85 -140 -89 -88 -101 -137 -154 -168 -210 -234 Private sector -78 -131 -75 -81 -77 -127 -141 -152 -193 -216 Public sector -7 -9 -14 -7 -24 -10 -13 -16 -17 -18 Of which : NFPS interest -7 -9 -14 -7 -24 -10 -13 -16 -17 -18
Current transfers, net 22 36 77 87 82 85 88 91 95 98
Capital and financial account 165 25 -97 159 171 219 211 190 34 -35
Capital account (public sector grants) 31 33 170 73 145 91 46 33 27 11 Of which: debt relief ... ... 101 ... 46 ... ... ... ... ...
Financial account 133 -8 -267 86 26 128 165 157 7 -46Public sector 11 -9 -105 9 76 61 50 50 24 16 Disbursements 43 31 29 27 68 80 70 70 50 50 Amortization -32 -40 -134 -17 -117 -19 -20 -20 -26 -34 SDR allocations 0 0 0 0 125 0 0 0 0 0
Private sector 122 2 -161 77 -50 68 115 107 -16 -62 Foreign direct investment 117 138 141 169 142 209 268 272 231 200 Other 5 -136 -303 -93 -192 -142 -153 -165 -247 -262
Errors and omissions 97 -81 83 -47 0 0 0 0 0 0
Overall balance 29 104 169 232 112 35 54 63 240 252
Change in reserves (- = increase) -29 -104 -169 -232 -112 -35 -54 -63 -240 -252
Memorandum items:Stock of gross international reserves 1/ 160 264 433 666 778 813 867 930 1,171 1,422 In months of imports of goods and services 1.6 2.7 3.6 4.2 5.2 4.8 4.8 5.0 6.3 7.1Current account balance (in percent of GDP) -13.0 7.5 7.5 3.9 -2.0 -5.7 -4.4 -3.3 4.7 5.9GDP in current US dollars 1,794 2,130 2,424 3,058 2,962 3,236 3,530 3,911 4,392 4,865
Sources: Suriname authorities; and IMF staff estimates and projections.
1/ For 2009, includes the share of Suriname in the IMF SDR allocation w hich amounted to SDR 80.4 million.
24
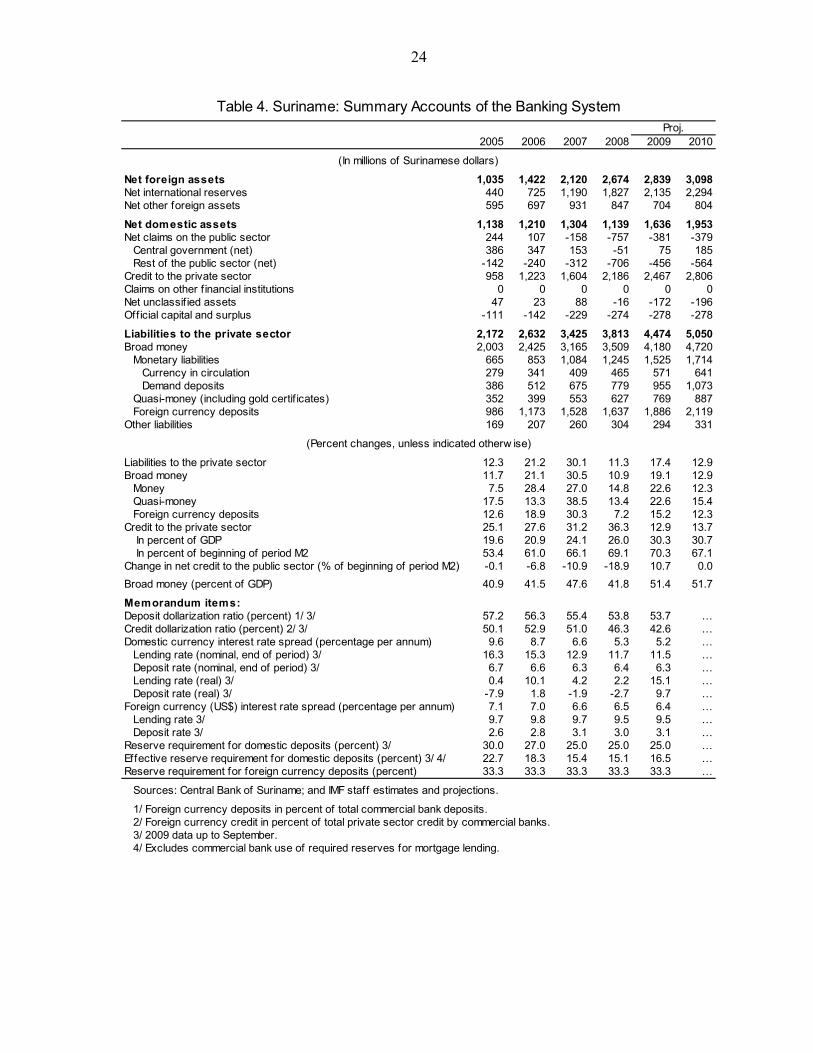
Table 4. Suriname: Summary Accounts of the Banking SystemProj.
2005 2006 2007 2008 2009 2010
(In millions of Surinamese dollars)
Net foreign assets 1,035 1,422 2,120 2,674 2,839 3,098Net international reserves 440 725 1,190 1,827 2,135 2,294Net other foreign assets 595 697 931 847 704 804
Net domestic assets 1,138 1,210 1,304 1,139 1,636 1,953Net claims on the public sector 244 107 -158 -757 -381 -379
Central government (net) 386 347 153 -51 75 185Rest of the public sector (net) -142 -240 -312 -706 -456 -564
Credit to the private sector 958 1,223 1,604 2,186 2,467 2,806Claims on other f inancial institutions 0 0 0 0 0 0Net unclassif ied assets 47 23 88 -16 -172 -196Official capital and surplus -111 -142 -229 -274 -278 -278
Liabilities to the private sector 2,172 2,632 3,425 3,813 4,474 5,050Broad money 2,003 2,425 3,165 3,509 4,180 4,720
Monetary liabilities 665 853 1,084 1,245 1,525 1,714Currency in circulation 279 341 409 465 571 641Demand deposits 386 512 675 779 955 1,073
Quasi-money (including gold certif icates) 352 399 553 627 769 887Foreign currency deposits 986 1,173 1,528 1,637 1,886 2,119
Other liabilities 169 207 260 304 294 331
(Percent changes, unless indicated otherw ise)
Liabilities to the private sector 12.3 21.2 30.1 11.3 17.4 12.9Broad money 11.7 21.1 30.5 10.9 19.1 12.9
Money 7.5 28.4 27.0 14.8 22.6 12.3Quasi-money 17.5 13.3 38.5 13.4 22.6 15.4Foreign currency deposits 12.6 18.9 30.3 7.2 15.2 12.3
Credit to the private sector 25.1 27.6 31.2 36.3 12.9 13.7 In percent of GDP 19.6 20.9 24.1 26.0 30.3 30.7 In percent of beginning of period M2 53.4 61.0 66.1 69.1 70.3 67.1Change in net credit to the public sector (% of beginning of period M2) -0.1 -6.8 -10.9 -18.9 10.7 0.0Broad money (percent of GDP) 40.9 41.5 47.6 41.8 51.4 51.7
Memorandum items:Deposit dollarization ratio (percent) 1/ 3/ 57.2 56.3 55.4 53.8 53.7 …Credit dollarization ratio (percent) 2/ 3/ 50.1 52.9 51.0 46.3 42.6 …Domestic currency interest rate spread (percentage per annum) 9.6 8.7 6.6 5.3 5.2 …
Lending rate (nominal, end of period) 3/ 16.3 15.3 12.9 11.7 11.5 …Deposit rate (nominal, end of period) 3/ 6.7 6.6 6.3 6.4 6.3 …Lending rate (real) 3/ 0.4 10.1 4.2 2.2 15.1 …Deposit rate (real) 3/ -7.9 1.8 -1.9 -2.7 9.7 …
Foreign currency (US$) interest rate spread (percentage per annum) 7.1 7.0 6.6 6.5 6.4 …Lending rate 3/ 9.7 9.8 9.7 9.5 9.5 …Deposit rate 3/ 2.6 2.8 3.1 3.0 3.1 …
Reserve requirement for domestic deposits (percent) 3/ 30.0 27.0 25.0 25.0 25.0 …Effective reserve requirement for domestic deposits (percent) 3/ 4/ 22.7 18.3 15.4 15.1 16.5 …Reserve requirement for foreign currency deposits (percent) 33.3 33.3 33.3 33.3 33.3 …
Sources: Central Bank of Suriname; and IMF staff estimates and projections.
1/ Foreign currency deposits in percent of total commercial bank deposits. 2/ Foreign currency credit in percent of total private sector credit by commercial banks. 3/ 2009 data up to September. 4/ Excludes commercial bank use of required reserves for mortgage lending.

25
2005 2006 2007 2008 Sep-09
Number 2/Banks 8 8 8 8 8 Large banks 3 3 3 3 3 Small banks 5 5 5 5 5Reporting non-bank financial institutions Pension funds 24 18 18 18 18 Insurance companies 8 12 10 10 10 Credit unions and cooperatives 6 10 5 6 6
(In percent of total)
Assets 100.0 100.0 100.0 100.0 … Banks 68.1 71.1 72.7 73.5 … Large banks 57.1 59.5 60.7 60.7 … Small banks 11.0 11.6 12.0 12.8 … Pension funds 21.6 18.1 16.6 14.4 … Insurance companies 8.3 8.7 8.5 9.7 … Credit unions and cooperatives 2.0 2.1 2.2 2.4 …
Deposits Banks 100.0 100.0 100.0 100.0 100.0 Large banks 78.4 78.2 77.3 76.5 76.7 Small banks 21.6 21.8 22.7 23.5 23.3
(In percent)
Capital Adequacy Regulatory capital to risk-weighted assets (*) 10.1 11.7 10.5 10.1 10.4 Regulatory Tier I capital to risk-weighted assets (*) 8.1 9.7 8.9 8.7 9.2 Capital (net worth) to assets 5.0 5.5 5.3 5.6 5.4
Asset composition Sectoral distribution of loans to total loans (*) Agriculture 5.1 4.8 3.7 4.2 4.3 Manufacturing 9.6 9.1 8.6 7.9 6.3 Commerce 32.9 30.9 29.1 26.9 25.9 Housing construction 14.4 15.0 16.5 17.5 18.0 Other 38.0 40.2 42.1 43.5 45.6
Asset quality Foreign currency loans to total loans 49.6 52.5 49.6 45.8 42.6 NPLs to gross loans (*) 13.5 11.9 8.7 7.9 8.5 NPLs net of provisions to capital (*) 80.2 65.1 47.2 49.8 57.0 Large exposures to capital (*) 55.7 80.7 110.0 104.5 107.2
Earnings and Profitability ROA (*) 3.0 3.1 3.1 2.8 1.9 ROE (*) 40.8 44.2 56.1 52.7 35.0 Interest margin to gross income (*) 73.0 73.5 70.2 72.9 67.0 Noninterest expenses to gross income (*) 63.0 61.6 55.7 56.2 56.2 Personnel expenses to noninterest expenses 59.6 59.2 61.2 59.8 60.9 Trading and fee income to total income 31.0 32.2 30.8 28.1 34.5 Spread between reference loan and deposit rates 10.5 10.8 8.4 8.1 8.1
Liquidity Liquid assets to total assets (*) 31.1 32.1 33.9 32.6 30.5 Liquid assets to total short-term liabilities (*) 52.8 54.9 58.0 58.4 55.0 FX liabilities to total liabilities 48.6 50.7 51.4 49.6 48.5
Source: Central Bank of Suriname.
(*) Included in the "core set" of financial soundness indicators identified by the IMF's Executive Board.1/ Indicators refer to banks, which comprise over 70 percent of financial system assets at end-2008.2/ The three largest banks hold more than 57 percent of total financial system assets.
Table 5. Suriname: Financial System Structure and Banking System Soundness Indicators 1/

26
APPENDIX I. ILLUSTRATIVE MEDIUM-TERM PROJECTIONS AND DEBT SUSTAINABILITY ANALYSES (DSAS)
The staff conducted debt sustainability analyses, based on a plausible medium-term outlook that was discussed with the authorities.
A. Government Finances
Key assumptions
Revenue is projected to decline over the next three years, and rebound starting in 2013, when the new bauxite and gold mining projects come on stream. Revenue collections will be further boosted by the government’s expected participation in the gold and alumina sectors, and higher revenue from the state oil company after the completion of its new refinery. In the outer years, indirect revenue collections are also assumed to increase marginally.
Meanwhile, the fiscal position will gradually improve through fiscal consolidation. FISO-2 is assumed to be implemented gradually over a number of years, capping the annual nominal wage growth at about ten percent. Spending on goods and services and on subsidies and transfers will also be brought under control. The improvement in revenue collections, starting in 2013, will help offset the expected drying up of financial assistance under the Netherlands Treaty Fund. The latter will lead to a reduction in grants-financed capital expenditure. In contrast, more spending associated with the government’s participation in the mining sector is expected, which is reflected in higher net lending during 2010-13. The overall fiscal deficit is projected to gradually decline to 2.7 percent of GDP in 2012. Once higher mineral revenues kick in, starting in 2013, the fiscal balance is expected to improve rapidly and turn positive in 2014.
The DSA assumes continuation of prudent public debt management. In particular, external debt is assumed to be contracted in line with the country’s implementation capacity and at favorable terms.
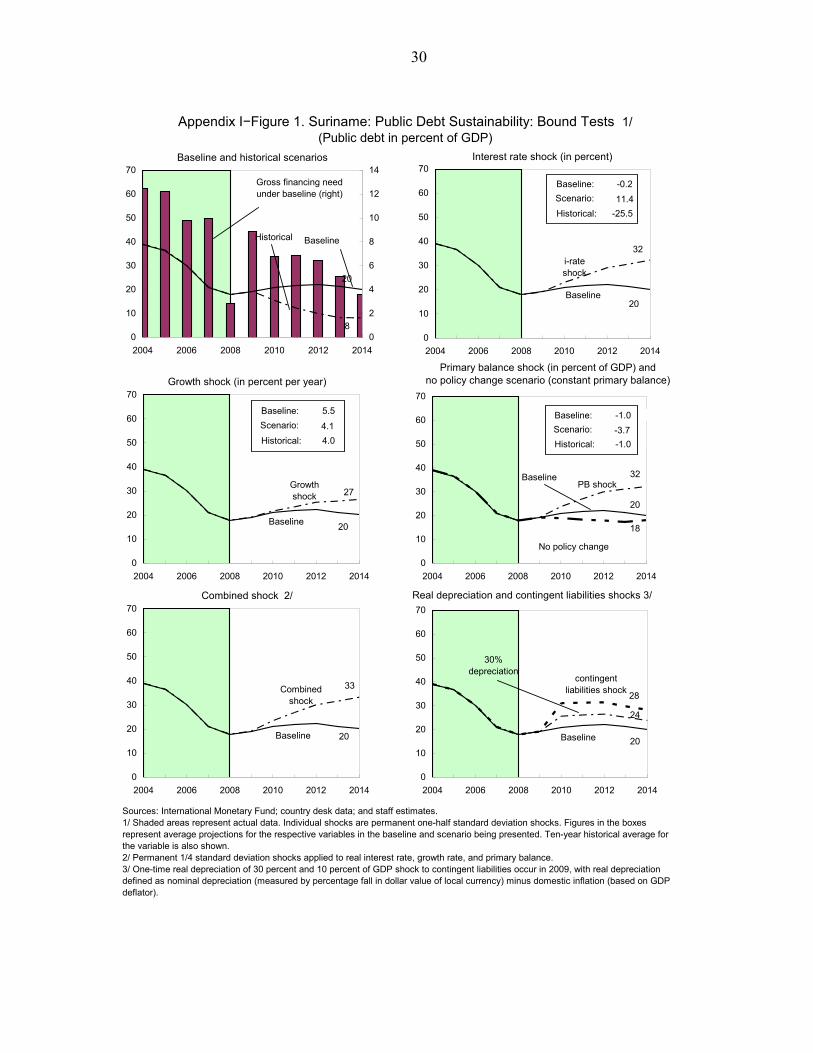
Assessment of the fiscal DSA Public debt remains manageable, although the debt burden could increase considerably under standard shocks. The public debt-to-GDP ratio is projected to increase moderately over the next few years, before declining in 2013, when higher mineral revenues are expected. During the whole projection period the debt-to-GDP ratio is expected to remain below 23 percent. On the other hand, the debt burden is sensitive to standard shocks. For example, a permanent ½-standard-deviation shock applied to the real interest rate or primary fiscal balance could push up the debt-to-GDP ratio to 32 percent.

27
B. Balance of Payments
Key assumptions
The medium-term outlook is based on the assumption of a broad continuation of present policies, amid a sizeable increase in output beginning in 2013, as three major new projects in the non-renewable resources sector come on line. The main assumptions are the following:
• Potential output is estimated at 5 percent. The economy will be growing below potential up to 2012, while alumina production remains below production capacity and the global recovery slowly gains momentum. In 2013, SURALCO is expected to increase its production of alumina back to the 2008 level. In addition, Staatsolie’s new enhanced refining capacity will come on stream in the same year. Finally, the new gold mine SURGOLD is assumed to start production in the Nassau region in 2013. These projects will boost GDP above potential by 2½ percent.
• Inflation is expected to remain steady, at 5½ percent a year.
• The increase in imports of capital and intermediate inputs related to the three projects outlined above will keep the current account in deficit through 2012. The reserve coverage will nevertheless remain stable, at about 5 months of imports, as capital inflows from FDI remain robust. In 2013, the current account balance will turn positive and reach 4¾ percent of GDP. The reserve coverage will rise to 7 months of imports by 2014.
• The steady decline in grant inflows reflects the drying up of financial assistance from the Netherlands Treaty Fund.
Assessment of the external DSA
The path of the external debt remains flat at around 10 percent of GDP throughout the projection period. This debt represents less than half of the total public debt. The debt ratio is particularly sensitive to a non-interest current account shock, as the three major projects in the non-renewable resource sector are undertaken through 2012, increasing the current account deficit and the financing needs. Should the external current account balance be weaker than assumed, the external debt would reach 33 percent at the end of the projection period. On the other hand, a real depreciation shock of 30 percent would only raise the external debt to 18 percent of GDP by 2014.

28
Appendix I−Table 1. Suriname: Medium-Term Outlook
Est.2007 2008 2009 2010 2011 2012 2013 2014
(Annual percentage change, unless otherwise indicated)
Real economyReal GDP 1/ 5.2 6.0 2.5 4.0 4.7 5.5 7.5 6.0Nominal GDP 1/ 13.8 26.2 -3.1 12.3 12.1 10.8 12.3 10.8Consumer prices (period average) 6.4 14.6 0.7 5.5 5.5 5.5 5.5 5.5
(In percent of GDP)
Savings and investment balancesPrivate sector balance (savings-investment) 5.3 2.0 -0.2 -2.2 -1.5 -0.6 6.0 5.7Public sector balance 2.2 1.9 -1.8 -3.5 -2.9 -2.7 -1.3 0.2
Savings 7.2 7.0 3.3 2.2 1.2 1.0 2.1 3.2Investment 5.0 5.0 5.1 5.7 4.1 3.7 3.4 3.0
Foreign savings -7.5 -3.9 2.0 5.7 4.4 3.3 -4.7 -5.9
Central governmentRevenue and grants 30.5 27.5 31.2 27.8 26.0 25.1 25.4 25.4Total expenditure 2/ 27.6 25.6 33.1 31.3 29.0 27.8 26.7 25.3
Of which : noninterest current expenditure 21.9 19.9 26.6 24.0 22.1 21.5 21.2 21.2Overall balance 3.0 2.0 -1.8 -3.5 -2.9 -2.7 -1.3 0.2Net domestic financing -2.8 -2.3 2.0 1.6 1.5 1.4 0.8 -0.5Net external financing -0.2 0.3 -0.2 1.9 1.4 1.3 0.5 0.3Total public debt 21.1 17.9 19.2 21.0 21.7 22.3 21.2 20.1
(In percent of GDP, unless otherwise indicated)
External sector Current account 7.5 3.9 -2.0 -5.7 -4.4 -3.3 4.7 5.9 Merchandise exports, f.o.b. 57.0 56.9 50.3 50.0 50.1 48.4 51.4 51.4 Merchandise imports, f.o.b. -46.4 -50.3 -49.0 -51.0 -49.4 -46.3 -40.4 -38.9Capital and financial account -7.7 1.8 -4.5 -2.9 -3.0 -3.0 -0.3 -7.4 Of which : foreign direct investment 5.8 5.5 4.8 6.5 7.6 7.0 5.3 4.1Gross international reserves (US$ millions) 433 666 778 813 867 930 1,171 1,422
in months of imports 3.6 4.2 5.2 4.8 4.8 5.0 6.3 7.1
Source: Suriname authorities; and IMF staff estimates and projections.
1/ GDP numbers include estimates of the informal sector.2/ Including statistical discrepancy.
Proj.

29
Projections2004 2005 2006 2007 2008 2009 2010 2011 2012 2013 2014 Debt-stabilizing
primarybalance 9/
1 Baseline: Public sector debt 1/ 39.1 36.6 30.2 21.1 17.9 19.2 21.0 21.7 22.3 21.2 20.1 -0.9o/w foreign-currency denominated 25.6 21.4 18.3 12.2 10.3 8.6 10.0 10.3 10.6 10.0 9.3
2 Change in public sector debt -1.9 -2.4 -6.5 -9.1 -3.1 1.3 1.8 0.7 0.6 -1.1 -1.13 Identified debt-creating flows (4+7+12) -4.4 -4.1 -4.6 -5.9 -6.3 2.4 1.4 0.7 0.6 -1.1 -2.24 Primary deficit 0.6 0.1 -0.5 -3.6 -2.6 0.5 2.6 1.9 1.6 0.2 -1.25 Revenue and grants 26.4 27.6 27.4 30.5 27.5 31.2 27.8 26.0 25.1 25.4 25.46 Primary (noninterest) expenditure 27.0 27.7 26.9 26.9 24.9 31.7 30.4 27.9 26.7 25.6 24.27 Automatic debt dynamics 2/ -5.0 -4.1 -4.1 -2.2 -3.7 1.9 -1.2 -1.2 -1.0 -1.3 -1.08 Contribution from interest rate/growth differential 3/ -5.8 -4.3 -4.1 -2.2 -3.7 1.9 -1.2 -1.2 -1.0 -1.3 -1.09 Of which contribution from real interest rate -3.0 -2.9 -2.9 -0.9 -2.7 2.4 -0.5 -0.3 0.1 0.2 0.2
10 Of which contribution from real GDP growth -2.8 -1.4 -1.2 -1.4 -1.0 -0.5 -0.7 -0.9 -1.1 -1.5 -1.111 Contribution from exchange rate depreciation 4/ 0.9 0.2 0.0 0.0 0.0 ... ... ... ... ... ...12 Other identified debt-creating flows 0.0 0.0 0.0 0.0 0.0 0.0 0.0 0.0 0.0 0.0 0.013 Privatization receipts (negative) 0.0 0.0 0.0 0.0 0.0 0.0 0.0 0.0 0.0 0.0 0.014 Recognition of implicit or contingent liabilities 0.0 0.0 0.0 0.0 0.0 0.0 0.0 0.0 0.0 0.0 0.015 Other (specify, e.g. bank recapitalization) 0.0 0.0 0.0 0.0 0.0 0.0 0.0 0.0 0.0 0.0 0.016 Residual, including asset changes (2-3) 5/ 2.5 1.6 -1.9 -3.2 3.2 -1.1 0.4 0.0 0.0 0.0 1.1
Public sector debt-to-revenue ratio 1/ 147.9 132.7 110.1 69.0 65.1 61.5 75.7 83.4 89.0 83.6 78.8
Gross financing need 6/ 12.4 12.2 9.8 10.0 2.9 8.9 6.8 6.8 6.5 5.1 3.6in billions of U.S. dollars 184.7 219.0 208.1 242.0 87.3 262.8 219.5 241.6 253.0 222.7 175.0
Scenario with key variables at their historical averages 7/ 19.2 15.5 12.3 10.0 8.2 8.2 -2.2Scenario with no policy change (constant primary balance) in 2009-2014 19.2 19.0 18.3 18.0 17.4 18.1 -0.8
Key Macroeconomic and Fiscal Assumptions Underlying Baseline
Real GDP growth (in percent) 8.5 4.4 3.8 5.2 6.0 2.5 4.0 4.7 5.5 7.5 6.0Average nominal interest rate on public debt (in percent) 8/ 5.0 7.4 5.9 5.4 4.2 7.3 5.6 5.7 5.7 5.6 5.6Average real interest rate (nominal rate minus change in GDP deflator, in percent) -7.9 -8.3 -9.0 -2.8 -14.8 12.8 -2.4 -1.3 0.7 1.1 1.1Nominal appreciation (increase in US dollar value of local currency, in percent) -3.3 -0.9 -0.2 0.0 0.0 ... ... ... ... ... ...Inflation rate (GDP deflator, in percent) 12.9 15.6 14.9 8.2 19.0 -5.5 8.0 7.0 5.0 4.5 4.5Growth of real primary spending (deflated by GDP deflator, in percent) 13.3 6.9 0.9 5.1 -1.8 30.5 -0.3 -3.7 0.8 3.1 0.3Primary deficit 0.6 0.1 -0.5 -3.6 -2.6 0.5 2.6 1.9 1.6 0.2 -1.2
1/ Indicate coverage of public sector, e.g., general government or nonfinancial public sector. Also whether net or gross debt is used.2/ Derived as [(r - π(1+g) - g + αε(1+r)]/(1+g+π+gπ)) times previous period debt ratio, with r = interest rate; π = growth rate of GDP deflator; g = real GDP growth rate; α = share of foreign-currency denominated debt; and ε = nominal exchange rate depreciation (measured by increase in local currency value of U.S. dollar).3/ The real interest rate contribution is derived from the denominator in footnote 2/ as r - π (1+g) and the real growth contribution as -g.4/ The exchange rate contribution is derived from the numerator in footnote 2/ as αε(1+r). 5/ For projections, this line includes exchange rate changes.6/ Defined as public sector deficit, plus amortization of medium and long-term public sector debt, plus short-term debt at end of previous period. 7/ The key variables include real GDP growth; real interest rate; and primary balance in percent of GDP.8/ Derived as nominal interest expenditure divided by previous period debt stock.9/ Assumes that key variables (real GDP growth, real interest rate, and other identified debt-creating flows) remain at the level of the last projection year.
Actual
Appendix I−Table 2. Suriname: Public Sector Debt Sustainability Framework, 2004-2014(In percent of GDP, unless otherwise indicated)
30
Growth shock (in percent per year)
27Growth shock
20Baseline
0
10
20
30
40
50
60
70
2004 2006 2008 2010 2012 2014
Baseline: 5.5Scenario: 4.1Historical: 4.0
PB shock 32Baseline
20
18
0
10
20
30
40
50
60
70
2004 2006 2008 2010 2012 2014
Baseline: -1.0Scenario: -3.7Historical: -1.0
No policy change
Interest rate shock (in percent)
32i-rate shock
20Baseline
0
10
20
30
40
50
60
70
2004 2006 2008 2010 2012 2014
Baseline: -0.2Scenario: 11.4Historical: -25.5
Appendix I−Figure 1. Suriname: Public Debt Sustainability: Bound Tests 1/ (Public debt in percent of GDP)
Sources: International Monetary Fund; country desk data; and staff estimates.1/ Shaded areas represent actual data. Individual shocks are permanent one-half standard deviation shocks. Figures in the boxes represent average projections for the respective variables in the baseline and scenario being presented. Ten-year historical average for the variable is also shown.2/ Permanent 1/4 standard deviation shocks applied to real interest rate, growth rate, and primary balance.3/ One-time real depreciation of 30 percent and 10 percent of GDP shock to contingent liabilities occur in 2009, with real depreciation defined as nominal depreciation (measured by percentage fall in dollar value of local currency) minus domestic inflation (based on GDP deflator).
Baseline and historical scenarios
Historical
8
20
Baseline
0
10
20
30
40
50
60
70
2004 2006 2008 2010 2012 20140
2
4
6
8
10
12
14Gross financing need under baseline (right)
Combined shock 2/
Combined shock
33
Baseline 20
0
10
20
30
40
50
60
70
2004 2006 2008 2010 2012 2014
24
Baseline 20
28
0
10
20
30
40
50
60
70
2004 2006 2008 2010 2012 2014
30% depreciation
contingent liabilities shock
Real depreciation and contingent liabilities shocks 3/
Primary balance shock (in percent of GDP) andno policy change scenario (constant primary balance)

31
Projections2004 2005 2006 2007 2008 2009 2010 2011 2012 2013 2014 Debt-stabilizing
non-interest current account 6/
Baseline: External debt 25.6 21.4 18.3 12.2 10.3 8.6 10.0 10.3 10.6 10.0 9.3 -4.0
Change in external debt -4.6 -4.2 -3.1 -6.0 -1.9 -1.7 1.4 0.3 0.3 -0.6 -0.7Identified external debt-creating flows (4+8+9) -0.6 2.3 -17.4 -15.6 -12.0 -3.1 -1.1 -3.6 -4.2 -10.7 -10.6
Current account deficit, excluding interest payments 7.9 10.6 -9.9 -9.5 -4.7 0.5 4.9 3.5 2.3 -5.7 -7.0Deficit in balance of goods and services 3.4 9.5 -12.4 -8.0 -4.0 1.3 4.2 2.6 1.3 -7.3 -8.7
Exports 61.8 59.2 67.6 67.4 66.2 59.4 60.2 58.2 56.0 58.4 57.9Imports 65.2 68.7 55.2 59.4 62.2 60.7 64.4 60.8 57.3 51.1 49.2
Net non-debt creating capital inflows (negative) -6.1 -6.6 -6.5 -5.8 -5.5 -4.8 -6.7 -7.6 -7.0 -5.3 -4.1Automatic debt dynamics 1/ -2.4 -1.7 -1.0 -0.3 -1.7 1.2 0.6 0.5 0.4 0.3 0.5
Contribution from nominal interest rate 2.3 2.5 2.4 1.9 0.8 1.4 0.9 0.9 0.9 1.0 1.1Contribution from real GDP growth -2.2 -0.9 -0.7 -0.8 -0.6 -0.3 -0.3 -0.4 -0.5 -0.7 -0.5Contribution from price and exchange rate changes 2/ -2.5 -3.3 -2.7 -1.4 -2.0 ... ... ... ... ... ...
Residual, incl. change in gross foreign assets (2-3) 3/ -4.0 -6.5 14.3 9.6 10.1 1.3 2.5 3.9 4.5 10.0 9.9
External debt-to-exports ratio (in percent) 41.4 36.1 27.0 18.1 15.6 14.4 16.6 17.7 18.9 17.1 16.1
Gross external financing need (in billions of US dollars) 4/ 0.2 0.3 -0.1 0.0 -0.1 0.2 0.2 0.2 0.1 0.1 0.1in percent of GDP 11.8 14.8 -5.6 -2.0 -3.4 5.9 6.5 5.0 3.8 1.6 1.8
Scenario with key variables at their historical averages 5/ 8.6 9.9 11.1 12.3 13.5 14.7 -4.7
Key Macroeconomic Assumptions Underlying Baseline
Real GDP growth (in percent) 8.5 4.4 3.8 5.2 6.0 2.5 4.0 4.7 5.5 7.5 6.0GDP deflator in US dollars (change in percent) 9.1 14.6 14.7 8.2 19.0 -5.5 2.2 7.0 5.0 4.5 4.5Nominal external interest rate (in percent) 8.9 11.6 13.2 11.9 8.2 13.5 11.5 10.6 9.8 10.6 12.0Growth of exports (US dollar terms, in percent) 52.5 14.6 36.0 13.6 23.8 -13.1 7.8 8.4 6.6 17.1 9.9Growth of imports (US dollar terms, in percent) 13.2 26.1 -4.4 22.6 32.0 -5.5 12.8 5.8 4.4 0.1 6.8Current account balance, excluding interest payments -7.9 -10.6 9.9 9.5 4.7 -0.5 -4.9 -3.5 -2.3 5.7 7.0Net non-debt creating capital inflows 6.1 6.6 6.5 5.8 5.5 4.8 6.7 7.6 7.0 5.3 4.1
1/ Derived as [r - g - ρ(1+g) + εα(1+r)]/(1+g+ρ+gρ) times previous period debt stock, with r = nominal effective interest rate on external debt; ρ = change in domestic GDP deflator in US dollar terms, g = real GDP growth rate, ε = nominal appreciation (increase in dollar value of domestic currency), and α = share of domestic-currency denominated debt in total external debt.2/ The contribution from price and exchange rate changes is defined as [-ρ(1+g) + εα(1+r)]/(1+g+ρ+gρ) times previous period debt stock. ρ increases with an appreciating domestic currency (ε > 0) and rising inflation (based on GDP deflator). 3/ For projection, line includes the impact of price and exchange rate changes.4/ Defined as current account deficit, plus amortization on medium- and long-term debt, plus short-term debt at end of previous period. 5/ The key variables include real GDP growth; nominal interest rate; dollar deflator growth; and both non-interest current account and non-debt inflows in percent of GDP.6/ Long-run, constant balance that stabilizes the debt ratio assuming that key variables (real GDP growth, nominal interest rate, dollar deflator growth, and non-debt inflows in percent of GDP) remain at their levels of the last projection year.
Actual
Appendix I−Table 3. Suriname: External Debt Sustainability Framework, 2004-2014(In percent of GDP, unless otherwise indicated)

32
Interest rate shock (in percent)
10i-rate shock
9Baseline
0
10
20
30
40
2004 2006 2008 2010 2012 2014
Baseline:
Scenario:
Historical:
10.912.1
10.9
Appendix I−Figure 2. Suriname: External Debt Sustainability: Bound Tests 1/(External debt in percent of GDP)
Sources: International Monetary Fund; country desk data; and staff estimates.1/ Shaded areas represent actual data. Individual shocks are permanent one-half standard deviation shocks. Figures in the boxes represent average projections for the respective variables in the baseline and scenario being presented. Ten-year historical average for the variable is also shown. 2/ Permanent 1/4 standard deviation shocks applied to real interest rate, growth rate, and current account balance.3/ One-time real depreciation of 30 percent occurs in 2009.
Baseline and historical scenarios
15
Historical
9
Baseline
0
10
20
30
40
2004 2006 2008 2010 2012 20140
2
4
6
8
10
12
14
16
Gross financing need under baseline (right)
CA shock 33
Baseline
9
0
10
20
30
40
2004 2006 2008 2010 2012 2014
Baseline:
Scenario:
Historical:
0.4-4.3
-5.6
Combined shock 2/
22Combined shock
9
Baseline
0
10
20
30
40
2004 2006 2008 2010 2012 2014
Real depreciation shock 3/
15
Baseline 9
0
10
20
30
40
2004 2006 2008 2010 2012 2014
30% d i i
Non-interest current account shock (in percent of GDP)Growth shock (in percent per year)
11Growth shock
9Baseline
0
10
20
30
40
2004 2006 2008 2010 2012 2014
Baseline:
Scenario:
Historical:
5.54.1
4.0

33
APPENDIX II. SUMMARY OF INFORMATIONAL ANNEXES Discussions
The 2009 Article IV consultation discussions were held in Paramaribo during October 20–30. The mission met with the Minister of Finance, Mr. Humphrey Hildenberg; the Governor of the Central Bank of Suriname, Mr. André E. Telting; the Minister of Natural Resources, Mr. Gregory Rusland; the Minister of Planning and Development Cooperation, Mr. Ricardo van Ravenswaay; the Minister of Internal Affairs, Mr. Mauritz Hassankhan; the Minister of Agriculture, Mr. Kermechend Raghoebarsing; senior staff of several government ministries and agencies; and representatives of the private sector, labor, the diplomatic community, and the opposition. The staff team comprised Gamal El-Masry (Head), Yi Wu, and Nazim Belhocine (all WHD). Ms. Anne Joseph (OED) joined most of the policy meetings.
Fund Relations and Exchange Arrangements
The last Article IV consultation with Suriname was concluded on June 2, 2008 (IMF Country Report No. 08/131). The country has accepted the obligations of Article VIII, Sections 2, 3, and 4. Suriname has a dual exchange rate regime, comprising an official and a commercial foreign exchange rate. The official rate (SRD 2.745 per US$1) is used for official transactions such as debt service. The commercial rate is used by commercial banks and cambios. The commercial SRD/US$ rate has been very close to the official rate in recent years at the suasion of the CBvS. Suriname maintains two multiple currency practices—one arising from the potential for the spread between the official and the commercial rates to exceed two percent, and the other from the existence of a special rate for imports of baby milk.
Relations with the Inter-American Development Bank (IADB) and World Bank Group
The IADB is the largest multilateral lender operating in Suriname at this time. As of November 2009, Suriname's outstanding debt to the IADB stood at US$69 million. The most recent IADB Country Strategy with Suriname was approved in 2007 and covers the period 2006-10. The main thrust of the IADB strategy has been to support policy and institutional reforms as the basis for promoting private-sector-led growth. In addition, this approach has been supported by an active technical cooperation program.
World Bank involvement in Suriname has been limited. The last activity consisted of setting up an investment promotion agency in October 2004.
Statistical Issues
Data provision has some shortcomings, but is broadly adequate for surveillance. Although the quality and timeliness of economic statistics has been improving in recent years, national accounts estimates are published with very long lags, and there is still no breakdown of the national accounts from the expenditure side. In addition, data on external services and private capital inflows are subject to significant deficiencies. Due to capacity limitations, data on the country’s international investment position are not available

INTERNATIONAL MONETARY FUND
SURINAME
Staff Report for the 2009 Article IV Consultation—Informational Annex
Prepared by the Western Hemisphere Department
December 22, 2009 Contents Page Annexes I. Fund Relations ........................................................................................................................2 II. Relations with the Inter-American Development Bank ........................................................4 III. Statistical Issues ...................................................................................................................6 Tables Common Indicators Required for Surveillance .........................................................................9

2
ANNEX I. SURINAME: FUND RELATIONS
(As of November 30, 2009)
I. Membership Status: Joined: April 27, 1978;
Article VIII II. General Resources Account: SDR Million %Quota Quota 92.10 100.00 Fund holdings of currency 85.98 93.35 Reserve Position 6.12 6.65 Holdings Exchange Rate
III. SDR Department: SDR Million %Allocation Net cumulative allocation 88.09 100.00 Holdings 80.67 91.57
IV. Outstanding Purchases and Loans: None
V. Latest Financial Arrangements: None
VI. Projected Payments to Fund 1/ (SDR Million; based on existing use of resources and present holdings of SDRs):
Forthcoming 2009 2010 2011 2012 2013
Principal Charges/Interest 0.02 0.02 0.02 0.02 Total 0.02 0.02 0.02 0.02 1/ When a member has overdue financial obligations outstanding for more than three months, the amount of such arrears will be shown in this section.
B. Nonfinancial Relations with the Authorities
Exchange rate arrangements The national currency is the Suriname dollar (SRD), which replaced the Suriname guilder in January 2004 at a conversion rate of 1,000 guilders per SRD. Suriname has an official and a commercial exchange rate. The official rate of SRD 2.745 per U.S. dollar is used for official transactions such as debt service. The commercial rate is used by commercial banks and cambios. The commercial SRD/US$ rate has remained very close to the official rate in recent years at the suasion of the CBvS. Suriname maintains two multiple currency practices—one

3
arising from the potential for the spread between the official and the commercial rates to exceed two percent, and the other from the existence of a special rate for imports of baby milk. Last Article IV consultation The last Article IV consultation was concluded by the Executive Board on June 2, 2008 (IMF Country Report No. 08/131). Suriname is on the standard 12-month consultation cycle. Participation in the GDDS In July 2004, the IMF officially announced Suriname’s formal participation in the General Data Dissemination System (GDDS). Technical assistance since 2005 CARTAC • Mission in January 2008 on revenue forecasting issues. • Mission in October 2009 to discuss tax reform and other TA needs. FAD • A joint IADB-IMF needs assessment mission in May 2007 provided assistance in
public financial management. LEG • Missions in November 2006 and January and June 2007 provided advice on tax
legislation. STA: • A follow-up mission from the Money and Banking Division of the Statistical
Department visited Suriname in February 2005 to address issues on reporting of commercial banks’ data.
• In August 2009, a STA mission visited Suriname to improve external sector data.
Consents and acceptances: Recent two quota increases approved.
Resident Representative: None.

4
ANNEX II: SURINAME: RELATIONS WITH THE INTER-AMERICAN DEVELOPMENT BANK (As of November 30, 2009)
In 1980, Suriname joined the Inter-American Development Bank (IADB), which at present is its largest multilateral lender. As of November 2009, Suriname’s outstanding debt to the IADB stood at US$69 million, mostly on Intermediate Fund Financing (IFF) terms. The most recent IADB Country Strategy with Suriname (2006-10) was approved in 2007 and highlighted three equally important pillars: development of the public sector; development of the private sector; and integration of the interior. The first two pillars consolidate the thrust of the former Country Strategy (2000-05) by continuing to target weaknesses in the policy and institutional framework that constrain Suriname’s development and thereby promote private-sector-led growth. The third pillar focuses on integrating communities living in the interior of Suriname more fully into national development and raising their living standards. Structural reform projects Public sector. Given the large size and importance of the public sector, in June 2004, the IADB approved a US$5 million loan to Suriname to support the strengthening of public sector management, which is considered a critical element of institutional reform in the country. Technical Cooperation (TC) resources complement the loan by elaborating a road map to help guide implementation of the public sector reform project. Decentralization and strengthening local government. A second loan in this area was approved in 2008 to assist certain districts with improving their self-management, including financial and tax systems and management of capital investment. With the approval of a district tax law, the program will support implementation of a simplified tax administration system in certified districts. Committees will be created to engage citizens in the decision-making process as participants—a key factor for achieving greater transparency and accountability in the districts. The program will also support the implementation of community-based basic infrastructure investment projects and services. Financial relations The active loan portfolio consists of 10 operations, totaling US$132 million, a year-on-year increase of 136 percent as two new operations were approved for a total amount of US$76 million. The average age of the loans in the entire portfolio is 5.1 years. However, when four operations (Decentralization of Local Government I, Low Income Shelters I, Census and Community Development Fund) exit the portfolio at the end of 2009, the average age will fall to 3.0 years, which is relatively young. The undisbursed portion of the loan portfolio in execution, US$85 million, is entirely from the Ordinary Capital lending window (non-concessional) with IFF subsidy. The TC portfolio for Suriname (including the Multilateral Investment Fund) comprises 38 operations (US$13.5 million), of which 53 percent has been disbursed. The TC portfolio grew by 9 percent since September 30, 2008, with approvals totaling US$1.2 million.

5
Pipeline and Portfolio Summary
Project category Number Total (US$ millions)
Disbursed (in percent)
Loans in execution 10 132 36 TCs in execution 38 13.5 53 Loans in pipeline (2010) 4 47.0 Not applicable TCs in pipeline (2010) 2 6.1 Not applicable
Net cash flow The total financing inflow has been positive during 2006-08.
Proj. Proj.2006 2007 2008 2009 2010
a. Loan disbursements 7.7 16.8 7.7 10.3 25b. Repayments (Principal) 3 3.5 4.1 5.1 4.8c. Net loan flow (a - b) 4.7 13.3 3.6 5.2 20.2d. Interest and charges 1.9 2.5 2.7 3 2.7e. Net cash flow (c - d) 2.8 10.8 0.9 2.1 17.5
Net Flow of IADB Convertibale Currencies(In millions of US$)

6
ANNEX III. SURINAME: STATISTICAL ISSUES
I. Assessment of Data Adequacy for Surveillance General: Data provided to the Fund has some shortcomings but is broadly adequate for surveillance purposes. National Accounts: Difficulties in data collection and long delays in the provision of source data affect production approach GDP estimates. The lack of timely, reliable source data on price indices for tourism services, transportation and communication also adversely affects production-based GDP estimates. GDP estimates by expenditure approach were compiled with the assistance of the CARTAC. However, the expenditure breakdown of national accounts is still limited, and there is also no reconciliation between the national accounts and the balance of payments, which combine to preclude an accurate evaluation of the savings and investment balance. Government finance statistics: The only public finance statistics available are those for the central government. Estimates for revenue and expenditure components differ significantly among the Ministry of Finance, the Treasury Department, the Central Bank, and the Central Paymaster data, increasing the uncertainty about the fiscal position. Therefore, a substantial amount of additional information on government finance statistics is needed to derive an accurate and timely picture of the fiscal position from above the line. The institutional coverage of fiscal statistics needs to be broadened to the nonfinancial public sector so as to get a better indicator of fiscal risks associated with all public sector debt. The actual number of public enterprises remains difficult to determine, and most of these enterprises do not produce accounts on a timely basis. Available public debt statistics cover only debt contracted or guaranteed by the central government. Monetary and financial statistics: Monetary and Financial statistics are broadly adequate for surveillance, and more recently, timeliness has been improved to two weeks for the central bank accounts and two months for the accounts of other depository corporations. External sector: External sector statistics are broadly adequate for surveillance. Although the data compilation of balance of payments statistics is good in general, there still remains some shortcomings such as weak data collection, under coverage, misclassification, and deviations from the balance of payments manuals. While trade data are relatively reliable, data on services and private capital inflows suffer from poor compilation systems. Estimates of the components of the financial account (especially private external debt) also need to be improved.
7
II. Data Standards and Quality
Suriname participates in the GDDS. No data ROSC is available.
III. Reporting to STA Suriname does not report fiscal statistics for inclusion in either International Financial Statistics, or Government Financial Statistics Yearbook.

8
Suriname: Table of Common Indicators Required for Surveillance December 21, 2009
Date of
latest observation
Date received
Frequency of
Data7
Frequency of
Reporting7
Frequency of
publication7
Exchange Rates 9/09 11/09 M M M
International Reserve Assets and Reserve Liabilities of the Monetary Authorities1 9/09 11/09 M M Q
Reserve/Base Money 10/09 11/09 M Monthly
Less than 1 month lag
Q
Broad Money 9/09 11/09 M Monthly 2 month lag Q
Central Bank Balance Sheet 9/09 11/09 M Monthly
Less than 1 month lag
Q
Consolidated Balance Sheet of the Banking System 9/09 11/09 M M Q
Interest Rates2 9/09 11/09 M Monthly 2 month lag Q
Consumer Price Index 10/09 11/09 M Monthly
Less than 1 month lag
M
Revenue, Expenditure, Balance and Composition of Financing3 – General Government4 9/09 11/09 M M A
Revenue, Expenditure, Balance and Composition of Financing3– Central Government 9/09 11/09 M M A
Stocks of Central Government and Central Government-Guaranteed Debt5 9/09 11/09 M M A
External Current Account Balance Q2/09 10/09 Q Q A
Exports and Imports of Goods and Services Q2/09 10/09 Q Q A
GDP/GNP 2007 10/09 A A A
Gross External Debt 9/09 11/09 M M A
International Investment Position6 … … NA NA NA
1 Any reserve assets that are pledged of otherwise encumbered should be specified separately. Also, data should comprise short-term liabilities linked to a foreign currency but settled by other means as well as the notional values of financial derivatives to pay and to receive foreign currency, including those linked to a foreign currency but settled by other means. 2 Both market-based and officially-determined, including discount rates, money market rates, rates on treasury bills, notes and bonds. 3 Foreign, domestic bank, and domestic nonbank financing. 4 The general government consists of the central government (budgetary funds, extra budgetary funds, and social security funds) and state and local governments. 5 Including currency and maturity composition. 6 Includes external gross financial asset and liability positions vis-à-vis nonresidents. The unavailability of international investment position data stems from the authorities’ lack of capacity to provide the information. 7 Daily (D); Weekly (W); Monthly (M); Quarterly (Q); Annually (A); Irregular (I); Not Available (NA).

January 28, 2010
Statement by the Staff Representative on Suriname Executive Board Meeting
February 3, 2010
The following information was made available to staff after the staff report (SM/09/308) was circulated to the Executive Board in late-December 2009. This information does not change the thrust of the staff appraisal. • CPI data. Inflation ended the year 2009 lower than staff had projected, with the 12-month increase at 1.3 percent, and average inflation for the year at -0.1 percent. These compare with projections in the staff report of 5.7 percent and 0.7 percent, respectively, as staff had expected higher food and fuel prices in the last quarter. • Foreign reserves. Net international reserves stood at US$763 million at end-2009, broadly in line with staff projections (US$778 million).
• Monetary data. Data through November 2009 indicate that private sector credit growth has continued to moderate to 16.1 percent, from 17 percent in September (y/y). However, broad money growth picked up from 22 percent in September 2009 to 29 percent in November (y/y).
• CLICO Suriname. The Surinamese insurance company Self Reliance has acquired the shares of CLICO Suriname’s general and life insurance companies. The Minister of Finance has provided a general commitment that the government would provide financial support to Self Reliance, if the need arises. The specifics of this commitment have not been made available.
• FISO-2. As of this week, the new wage structure has not yet been implemented. A final decision on whether, or in what way, further wage reforms should be implemented now rests with the President of the Republic.
• Credit ratings. Standard and Poor’s has just issued a new ratings report, reaffirming its foreign currency rating of B+ and local currency rating of BB-, both with positive outlooks. S&P’s praised Suriname for its achievements in strengthening the country’s institutions and improving macroeconomic fundamentals. It confirmed that Suriname fares significantly better than peer countries with similar ratings on a number of indicators, including GDP growth, public finances, and public debt. S&P’s noted that Suriname’s foreign currency rating could be raised in the future, if the country’s economic policies remain stable after the elections.

February 1, 2010
Statement by Mr. Nogueira Batista and Ms. Des Vignes on Suriname Executive Board Meeting
February 3, 2010 On behalf of our Surinamese authorities, we thank staff for the quality of the dialogue with the authorities and for the candid report. Suriname’s economy has performed relatively well despite spill over effects from the global financial and economic crisis. Following several years of robust economic activity, the economy slowed in 2009 on account of falling commodity prices - oil and alumina - and lower alumina output. GDP growth is estimated at 2.5 percent (1.4 percent in per capita terms). At the same time, inflationary pressures eased considerably, with the average CPI rate falling from 14.6 percent in 2008 to -0.1 percent in 2009. This sharp deceleration was mainly due to the reversal in the trend of rapidly rising international food and fuel prices, and to a lesser extent to declining domestic demand as credit to the private sector moderated. Short-term variations of the inflation rate are dominated by changes in food and fuel prices given the large weight of these items in the CPI, as is usually the case in developing countries. Inflation ended the year well below staff’s expectations. The staff report, dated December 29, projected the end-of-year CPI inflation to reach 5.7 percent. One month later, we learn that the end result was only 1.3 percent due to lower than expected food and fuel prices. On the other hand, the external current account weakened considerably reflecting lower volumes of alumina export and falling international commodity prices. Despite the deterioration in the current account, international reserves strengthened thanks to the SDR allocation. The fiscal balance also registered a deficit partly because the authorities adopted an expansionary fiscal policy. Total public debt remained, however, under 20 percent of GDP, and is mostly domestic. Prudent macroeconomic management and surpluses in the external and fiscal accounts in previous years enabled Suriname to weather the international crisis. Economic results up to 2008 were remarkable, as can be seen from the data provided in the staff report. Suriname’s current account surpluses, for instance, reached 7.5 percent of GDP in 2006-2007 and 3.9 percent of GDP in 2008. International reserves have increased continuously since 2005, in absolute terms and as a

- 2 -
proportion of imports. The international reserve coverage of the banking system (the ratio of gross reserves plus bank holdings of liquid external assets to foreign currency deposits at banks) rose sharply, from 87 percent in 2005 to 153 percent in 2009. Moreover, Suriname maintains extensive capital controls to protect the economy from the volatility of capital flows. The fiscal accounts were also strong. The central government had overall surpluses averaging almost 2 percent of GDP in 2006-2008. Public debt fell from more than 40 percent of GDP in 2003 to less than 18 percent in 2008. Suriname’s debt ratio is one of the lowest in the region, as mentioned by staff. Furthermore, since a significant share of the debt is in concessional terms, the government’s interest bill is modest, around 1 percent of GDP. These circumstances provided space for countercyclical fiscal policy in 2009. Staff expects the fiscal gap to widen further in 2010 due to the erosion in revenue from the bauxite industry and increased spending on goods and services. However, the deficit should narrow over the medium term as fiscal consolidation measures are adopted. Given the present challenging circumstances, the authorities have to decide how to proceed with the second stage of the civil service wage reform. The President of the Republic is now leading discussions on this issue. Further, the authorities have put on hold plans to reduce the corporate tax. Suriname continued to demonstrate commitment to debt sustainability with a debt reduction policy aimed at creating opportunities for future development financing on favourable terms. To safeguard against the growth in debt levels, the authorities have ensured that most of the foreign loans contracted for large public investment projects will continue to be on concessional terms with low interest payments obligations going forward. Arrears on public debt have declined substantially, from as much as 7.9 percent of GDP in 2005 to 1.3 percent of GDP in 2009. Following the settlement of arrears to Brazil of US$118 million (including a write-off of US$ 44 million) in August 2009, the United States is now the only outstanding bilateral creditor to be settled. The arrears with the United States will be eliminated once a decision can be reached with respect to the treatment of the penalties. The Surinamese government would like the United States to show the same flexibility that other creditors have shown. It is willing to pay principal and interest in full, but has asked penalties to be waived, in line with arrangements it has already reached with other creditors.

- 3 -
Over the medium term, Suriname will focus on growth and macroeconomic stability while maintaining fiscal prudence. In spite of the risks, the growth outlook is favourable given government initiatives to boost output in the mining and non-mining sectors in the medium to long-term. To enhance the longevity of the bauxite industry, the government has established its own mining company, Alumsur, and is considering acquiring shares in the Paranam refinery. Further, the government plans to set up an integrated bauxite industry in the western region of Suriname where significant bauxite reserves have been found. In the oil industry, the state-owned oil company, Staatsolie, has allocated approximately US$970 million towards increasing exploration activity, expanding the refinery and augmenting the capacity of the power plant over the period 2008 to 2012. Meanwhile, given the favourable international price of gold, exploration activity has stepped up both in the formal and informal sectors. Preliminary explorations by the gold mining company, Newmont, in the eastern part of the country have yielded promising results. Initiatives are also ongoing in agriculture, construction and tourism to boost output in these areas. Tourism has been a source of some diversification of the economy. A number of new hotels and facilities have been built in recent times, while a number of other facilities are being completed. The eco-tourism facilities of Fuungu-Island have been upgraded to international standards. In addition, the government continues to invest in upgrading and expanding the physical infrastructure of the country in support of its growth objectives. The stance of monetary policy remained appropriate in 2009 and looking ahead the authorities are prepared to tighten monetary policy as circumstances warrant. The current exchange rate regime has served the country of Suriname well. The authorities note the merit in Staff’s suggestion that the official and commercial foreign exchange markets be unified but do not believe that now is the appropriate time for this, particularly with elections due in May 2010, and prefer a more gradual approach. It should be noted that the difference between the two rates has been small in recent years. The other minor multiple currency practice arises from the existence of a special rate for imports of baby milk. Although there has been some weakening in asset quality and profitability, the financial system remained adequately capitalized in 2009. Nonetheless, the under-capitalization of the two small state-owned banks remains a concern and the authorities have indicated that steps will be taken to recapitalize them soon. Dollarization is a source of weakness, but the share of foreign currency deposits and loans is gradually declining. In recent years, in order to discourage lending in foreign

- 4 -
currency, reserve requirements on foreign currency deposits have been more than twice as high as effective reserve requirements on national currency deposits. Measures are also being taken to strengthen the supervision of the financial sector. Currently, a draft Financial Institutions Act and Foreign Exchange Act are under review, while an Act on Insurance Companies is being prepared. In addition, an agreement has been reached between a local insurance company, The Self Reliance Insurance Company, and CL International (Trinidad), allowing Self Reliance to acquire the shares of CLICO Suriname. The government has expressed its willingness to lend financial support to the Self Reliance Company if this becomes necessary. The authorities have requested that a Financial Sector Assessment Program (FSAP) be undertaken to assess the health of the financial sector in Suriname. A number of structural reforms are in train. The government has earmarked a number of public companies for restructuring and presently work is ongoing towards privatization of the banana company and restructuring of the rice company. Technical assistance from CARTAC has also been requested towards improving the efficacy and administration of indirect taxes.

Public Information Notice (PIN) No. 10/25 FOR IMMEDIATE RELEASE February 18, 2010
IMF Executive Board Concludes 2009 Article IV Consultation with Suriname
On February 3, 2010, the Executive Board of the International Monetary Fund (IMF) concluded the Article IV consultation with Suriname.1
Background After growing at an annual rate of 5−6 percent over the past two years, economic activity weakened in 2009 in the context of lower alumina and oil prices and a sharp output decline in the alumina sector. However, economic growth is estimated to have remained positive at 2.5 percent, supported by buoyant activity in the gold and construction sectors. Inflation has fallen sharply, thanks to lower international food and fuel prices and softer domestic demand, and is estimated to have averaged less than 1 percent during 2009. The external current account balance deteriorated from a surplus of 4 percent of GDP in 2008 to a deficit of 2 percent of GDP in 2009. International reserves rose to over 5 months of imports at end-2009, in part reflecting the SDR allocations of about US$125 million. The fiscal balance is estimated to have shifted from a surplus of 2 percent of GDP in 2008 to a deficit of 1.75 percent of GDP in 2009. Revenue has been holding rather well, with a decline in tax revenue more than offset by exceptionally high profit transfers from the state-owned oil company and the central bank. However, in 2009 expenditures rose substantially, particularly 1Under Article IV of the IMF's Articles of Agreement, the IMF holds bilateral discussions with members usually every year. A staff team visits the country, collects economic and financial information, and discusses with officials the country's economic developments and policies. On return to headquarters, the staff prepares a report, which forms the basis for discussion by the Executive Board. At the conclusion of the discussion, the Managing Director, as Chairman of the Board, summarizes the views of Executive Directors, and this summary is transmitted to the country's authorities. An explanation of any qualifiers used in summings up can be found here: http://www.imf.org/external/np/sec/misc/qualifiers.htm.
International Monetary Fund 700 19th Street, NW Washington, D. C. 20431 USA
2
noninterest current spending. Public debt has declined considerably in recent years and is estimated at 19 percent of GDP at end-2009. Reflecting in part higher government spending financed by the central bank, growth in reserve and broad money supply has picked up in recent months. Given its limited exposure to the international financial market, Suriname’s banking sector has weathered the global financial crisis reasonably well. While the nonperforming loan ratio for the banking sector as a whole rose moderately in 2009, most banks appear well capitalized. The dollarization of the banking sector has been declining over the past few years, but remains high, with deposit and credit dollarization ratios at end-September 2009 at 43 percent and 54 percent, respectively. Executive Board Assessment Executive Directors noted that Suriname has weathered the global economic crisis relatively well, with strong performance in the gold and construction sectors and international reserves remaining at a comfortable level. Directors praised the authorities’ prudent macroeconomic policies, which have helped reduce the level of public debt to among the lowest in the region, while providing room to implement countercyclical policies during the global slowdown. Looking ahead, Directors agreed that Suriname’s medium-term prospects are favorable, with large alumina and gold projects expected to come on stream. The key challenge will be to sustain the economic recovery and enhance the long-term growth potential, while ensuring continued macroeconomic stability and fiscal sustainability. Directors considered that the fiscal expansion in 2009 was appropriate to boost domestic demand, but encouraged the authorities to avoid unsustainable increases in spending. Directors recommended a more gradual implementation of the second phase of civil service reform, given its potentially inflationary impact. They supported the authorities’ efforts to strengthen tax administration, including through technical assistance from the Caribbean Regional Technical Assistance Center (CARTAC). Directors welcomed the authorities’ decision to postpone the reduction in the corporate tax rate, as this would adversely affect tax collections. They encouraged the authorities to continue working toward normalizing relations with all creditors. Directors viewed the monetary policy stance as broadly appropriate. They cautioned that monetary conditions might need to be tightened if fiscal spending were to threaten macroeconomic stability. Over the medium term, Directors encouraged the authorities to develop a secondary market for government securities and gradually move toward market-based monetary policy tools. Directors noted the staff’s assessment that the Suriname dollar may be slightly overvalued. They encouraged the authorities to work toward gradually unifying the official and commercial market exchange rates, and moving over time to a more flexible exchange rate regime. Directors noted that Suriname’s banking sector remained generally well capitalized and appeared to be resilient to the global financial crisis, with non-performing loan ratios rising only moderately. They advised the authorities to strengthen the capital base of two small state-

3
owned banks. Directors welcomed the acquisition of CLICO-Suriname’s operations by a local insurance company, and encouraged the authorities to facilitate their smooth integration into the new parent company at a minimum cost to the budget. Directors supported Suriname’s request to participate in an FSAP review. Most Directors supported the authorities’ plans for more public participation in the mining sector, noting that it would increase the share of revenue generated from the country’s natural resources. At the same time, Directors encouraged the authorities to intensify their efforts to improve the business environment and diversify the economy so as to promote greater private-sector led growth. They advised the authorities to continue financing public sector investment through concessional external borrowing.
Public Information Notices (PINs) form part of the IMF's efforts to promote transparency of the IMF's views and analysis of economic developments and policies. With the consent of the country (or countries) concerned, PINs are issued after Executive Board discussions of Article IV consultations with member countries, of its surveillance of developments at the regional level, of post-program monitoring, and of ex post assessments of member countries with longer-term program engagements. PINs are also issued after Executive Board discussions of general policy matters, unless otherwise decided by the Executive Board in a particular case.

4
Suriname: Selected Economic Indicators
Est. Proj. 2005 2006 2007 2008 2009 2010
(Annual percentage change, unless otherwise indicated)
Real sector GDP at 1990 prices 1/ 4.4 3.8 5.2 6.0 2.5 4.0
GDP current market prices 1/ 20.8 19.3 13.8 26.2 -3.1 12.3 Consumer prices (end of period) 15.8 4.7 8.4 9.3 5.7 5.5 Consumer prices (period average) 9.9 11.3 6.4 14.6 0.7 5.5 Exchange rate (end of period) 2.74 2.75 2.75 2.75 ... ...
Money and credit Banking system net foreign assets 3.7 37.5 49.1 26.1 6.2 9.1
Broad money 11.7 21.1 30.5 10.9 19.1 12.9 Private sector credit 25.1 27.6 31.2 36.3 12.9 13.7
Public sector credit (percent of GDP) -0.1 -6.8 -10.9 -18.9 10.7 ...
(In percent of GDP, unless otherwise indicated)
Savings and investment Private sector balance (savings-investment) -12.3 6.6 4.6 2.0 -0.2 -2.2
Public sector balance -0.7 0.9 3.0 2.0 -1.8 -3.5 Foreign savings 13.0 -7.5 -7.5 -3.9 2.0 5.7
Central government Revenue and grants 27.6 27.4 30.5 27.5 31.2 27.8
Total expenditure 30.1 28.7 28.3 25.6 33.1 31.3 Of which: noninterest current expenditure 23.2 23.3 21.9 19.9 26.6 24.0
Statistical discrepancy 1.7 2.2 0.7 0.0 0.0 0.0 Overall balance -0.7 0.9 3.0 2.0 -1.8 -3.5 Net domestic financing 0.1 -0.4 -2.8 -2.3 2.0 1.6 Net external financing 0.6 -0.4 -0.2 0.3 -0.2 1.9
Total public debt 36.6 30.2 21.1 17.9 19.2 21.0 Domestic 15.3 11.9 8.8 7.6 10.6 11.1 External 21.4 18.3 12.2 10.3 8.6 10.0
External sector Terms of trade (percent change) -0.8 -2.8 -0.6 1.0 1.6 -0.2
Current account -13.0 7.5 7.5 3.9 -2.0 -5.7 Change in reserves (-increase) -1.6 -4.9 -7.0 -7.6 -3.8 -1.1 Gross international reserves (US$ millions) 161 264 433 666 778 813
In months of imports 1.6 2.6 3.6 4.2 5.2 4.8
Sources: Surinamese authorities; and IMF staff estimates and projections. 1/ GDP data include estimates of the informal sector.