surfactant adsorption to soil components and soils
TRANSCRIPT

Instructions for use
Title Surfactant adsorption to soil components and soils
Author(s) Ishiguro, Munehide; Koopal, Luuk K.
Citation Advances in colloid and interface science, 231, 59-102https://doi.org/10.1016/j.cis.2016.01.006
Issue Date 2016-05
Doc URL http://hdl.handle.net/2115/70018
Rights ©2016, Elsevier. Licensed under the Creative Commons Attribution-NonCommercial-NoDerivatives 4.0 Internationalhttp://creativecommons.org/licenses/by-nc-nd/4.0/
Rights(URL) http://creativecommons.org/licenses/by-nc-nd/4.0/
Type article (author version)
File Information Adv Colloid Interface Sci231_59-102.pdf
Hokkaido University Collection of Scholarly and Academic Papers : HUSCAP
1
Surfactant adsorption to soil components and soils
Munehide Ishiguro1* and Luuk K. Koopal2# 1Research Faculty of Agriculture, Hokkaido University, Sapporo, Japan. 2Physical Chemistry and Soft Matter, Wageningen University and Research,
Wageningen, The Netherlands.
Corresponding author. Tel.: +81 11 706 2565; fax.: +81 11 706 2494.
E-mail address: [email protected]
# Visiting professor, Research Faculty of Agriculture, Hokkaido University, Sapporo, Japan,
May-July 2015.
2
ABSTRACT
Soils are complex and widely varying mixtures of organic matter and inorganic materials;
adsorption of surfactants to soils is therefore related to the soil composition. We first discuss
the properties of surfactants, including the critical micelle concentration (CMC) and
surfactant adsorption on water/air interfaces, the latter gives an impression of surfactant
adsorption to a hydrophobic surface and illustrates the importance of the CMC for the
adsorption process. Then attention is paid to the most important types of soil particles: humic
and fulvic acids, silica, metal oxides and layered aluminosilicates. Information is provided on
their structure, surface properties and primary (proton) charge characteristics, which are all
important for surfactant binding. Subsequently, the adsorption of different types of surfactants
on these individual soil components is discussed in detail, based on mainly experimental
results and considering the specific (chemical) and electrostatic interactions, with
hydrophobic attraction as an important component of the specific interactions. Adsorption
models that can describe the features semi-quantitatively are briefly discussed. In the last part
of the paper some trends of surfactant adsorption on soils are briefly discussed together with
some complications that may occur and finally the consequences of surfactant adsorption for
soil colloidal stability and permeability are considered. When we seek to understand the fate
of surfactants in soil and aqueous environments, the hydrophobicity and charge density of the
soil or soil particles, must be considered together with the structure, hydrophobicity and
charge of the surfactants, because these factors affect the adsorption. The pH and ionic
strength are important parameters with respect to the charge density of the particles. As
surfactant adsorption influences soil structure and permeability, insight in surfactant
adsorption to soil particles is useful for good soil management.

3
Keywords: humic substances, silica, metal (hydr)oxides, kaolinite, montmorillonite, soil
components
Contents
1. Introduction
2. Surfactants and their characteristics
2.1. Surfactant types
2.2. Surfactant adsorption at water/air surfaces
2.3. Micelles and their shape
3. Soil components
3.1. Humic substances
3.2. Silica and metal (hydr)oxides
3.3. Silicate clays (alumino-silicates)
3.4. Concluding remarks
4. Surfactant binding to humic substances
4.1. Early experimental studies and isotherms measured with surfactant
electrodes
4.2. Surfactant binding measured by solid-phase micro-extraction
4.3. Modeling surfactant - humic substance interaction
4.4. Sorption of organic cations and risk assessment
5. Surfactant adsorption to metal (hydr)oxides and silicas
5.1. General aspects and reviews
5.2. Surfactant adsorption and charge regulation
5.3. Ionic surfactant adsorption on rutile.
5.4. Ionic surfactant adsorption on silica
5.5. Nonionic surfactant adsorption on silica
6. Surfactant adsorption to silicate clays (alumino-silicates)

4
6.1. General aspects and outline
6.2. Cationic Surfactant adsorption on kaolinite
6.3. Anionic surfactant adsorption on kaolinite
6.4. Nonionic surfactant adsorption on kaolinite
6.5. Anionic surfactant adsorption on montmorillonite
6.6. Cationic surfactant adsorption on montmorillonite
6.7. Nonionic surfactant adsorption on montmorillonite
7. Surfactant adsorption modeling
7.1 General remarks
7.2 Mean-field models of monocomponent solute adsorption
7.3 Aggregation models for monocomponent solute adsorption
7.4 SCFA model for surfactant adsorption
7.5 NICA-Donnan model applied to surfactant sorption on humic and fulvic
acids
8. Surfactant adsorption on soils
8.1. General considerations and trends
8.2. Fate of surfactants in soils; degradation, hysteresis and precipitation
8.3. Influence of surfactant adsorption on soil structure and permeability
Acknowledgements
References
5
1. Introduction 1
2
Surfactants have an amphiphilic character, which means that they are composed of a 3
polar (hydrophilic) and an apolar (hydrophobic) part. A fundamental property of surfactants 4
in solution is their ability to form micelles (colloidal-sized surfactant aggregates) at a 5
characteristic surfactant concentration, the critical micelle concentration or CMC. At the 6
CMC the surfactant monomers aggregate into micelles with the hydrophobic tail groups 7
located in the core of the micelle and the hydrophilic head groups in the aqueous 8
interface. In this way the unfavourable contacts of water with the apolar tails are minimized. 9
Micellization gives surfactants their excellent detergency and solubilization properties; due 10
to solubilization (partially) hydrophobic organic compounds dissolve in a micellar solution 11
much better than in water alone. Another characteristic feature of surfactants is their 12
tendency to adsorb at interfaces, mostly in an oriented fashion. The name surfactant is 13
derived from this property; it is a contraction of surface-active agent. By surfactant 14
adsorption the particle surface characteristics change; for instance, by adsorbing with their 15
hydrophobic part to a hydrophobic surface the hydrophilic part protrudes in solution and 16
makes the particle surface hydrophilic, which facilitates wetting and dispersion of the 17
particles in aqueous solutions [1]. Due to their specific character surfactants are widely used 18
chemicals. In household applications they are used in detergents, soaps and shampoos. In 19
industrial applications surfactants are used for emulsification, dispersion, flocculation, 20
wettability, flotation, foaming and so on [2]. In agricultural applications, surfactants are 21
used for the formulation of hydrophobic agricultural chemicals to make these chemicals 22
easily dispersible in water and as anticaking agents for chemical fertilizers [3]. In some 23
cases surfactants are used in soil and groundwater remediation [4, 5]. The disadvantage of 24
the application of large amounts of surfactants worldwide (>15 Mton/year) [6], is that their 25

6
discharge is a cause of water pollution [7] and from the aqueous environment surfactants 26
can easily bind to soil components. Dissolved surfactants are considered contaminants in 27
aqueous environments and, in principle, they should be removed from wastewater before 28
entering receiving waters. The ‘Handbook of Detergents, Part B, Environmental impact’ [8] 29
considers the environmental aspects of most surfactant types. Recent information on the 30
aquatic toxicity, biodegradability, and bioaccumulation, which are relevant for the 31
assessment of surfactant ecotoxicity, can be found in [9-13]. Rebello et al. [10] conclude in 32
their review: “…regarding surfactants as non-pollutants is a mistake. Visible manifestations 33
of surfactant toxicity are available in the case of microbes, plants and animals”. 34
Soils are complex materials; they contain both inorganic particles and organic matter, see 35
e.g.[14]. Roughly speaking, inorganic particles can be divided into primary minerals 36
(physically weathered minerals from rocks), silicas, metal (hydr)oxides and layered 37
aluminosilicates (clays) and within these three groups the particle sizes can vary largely. In 38
general the primary minerals and silica particles make-up the sand and silt fraction, metal 39
(hydr)oxides and aluminosilicates contain the smaller particle size fractions with large 40
specific surface areas. All these soil particles contain in the normal pH range a surface 41
charge, depending on the nature of the particles, which is largely or partly variable by 42
changing the pH. This primary charge is due to the adsorption of protons and/or hydroxyl 43
ions to functional groups (sites) present at the surface of the particles. Soil organic matter, 44
which potentially acts as sorbent, originates from living organisms. It consists of 45
structurally randomized macromolecular residues due to partial degradation, rearrangement 46
and recombination of the original organic structures [15]. Mostly a distinction is made 47
between non-humic and humic substances. Non-humic substances are chemically 48
recognizable in biochemistry and are transitory in soil. Humic substances are not easily 49
degradable and carry specific functional groups that can dissociate depending on the 50
7
structure of the group. As most groups are acidic the humic substances also carry a charge 51
that is variable with pH. 52
The nature of the surface sites of the inorganic particles and the functional groups of the 53
organic particles, determine the particle charge and chemistry and charge govern to a large 54
extent the sorption of other components, including surfactants, to the particles. Important 55
for surfactant binding are the precise sites present at the surface as they determine the 56
chemical nature of the surface and the primary particle charge. The chemical nature 57
determines the “specific” or “chemical” interactions with the polar and apolar parts of the 58
surfactant molecules and the charges determine the electrostatic interaction, which can be 59
either attractive or repulsive, depending on the charge signs of surfactant and particles. 60
Together these interactions determine the mode of the surfactant adsorption to the particles 61
(with their hydrophilic or their hydrophobic part directed to the surface). As far as we are 62
aware, there is no comprehensive review on surfactant sorption to soils, most likely this is 63
due to the complicated and diverse nature of the soils and the many different types of 64
surfactants. 65
In the present paper first the properties of surfactants are considered in some detail, 66
including surfactant adsorption on the air/water interface, which can illustrate the 67
importance of the CMC for the adsorption process and gives an impression of surfactant 68
adsorption to a hydrophobic surface. Surfactant‒soil interactions are determined by the soil 69
components; therefore attention is given to the different types of soil particles: humic 70
substances, silica and metal oxides and aluminosilicates. Information is provided on their 71
structure, surface properties and primary charge characteristics, which are all important for 72
surfactant binding. Subsequently, the adsorption of different types of surfactants on these 73
individual soil components is discussed in detail, based on mainly experimental results and 74
considering the various specific (chemical) and electrostatic interactions. Adsorption models 75
that can describe the features semi-quantitatively are explained and discussed. In the last 76

8
part of the paper some trends of surfactant adsorption on soils are discussed together with 77
some complications that may occur and finally the consequences of surfactant adsorption 78
for soil colloidal stability and permeability are considered. 79
80
2. Surfactants and their characteristics 81
82
2.1. Surfactant types 83
The chemistry of the polar and apolar part of surfactants can be quite different for different 84
surfactants and based on the nature of the polar head group surfactants are classified into 85
anionics, cationics, nonionics, and zwitterionics. The principal surfactant demand is 86
composed of four types of surfactants: linear alkylbenzene sulfonates (LAS), fatty alcohol 87
ethoxylates (AE), fatty alcohol ether sulfates (FES) and fatty alcohol sulfates (FAS). Both 88
Western Europe and the US rely on the alcohol derivatives for 60-70% of the major 89
surfactants but in the rest of the world it is 15-30%, globally LAS is the most used surfactant 90
[16]. Next to synthetic surfactants also natural surfactants and biosurfactants exist. Some 91
examples of synthetic and natural surfactants are depicted in Fig. 1. 92
Biosurfactants are surfactants that are produced extracellularly or as part of the cell 93
membrane by bacteria, yeasts and fungi. Mulligan [17] and Bustamante et al. [18] give 94
examples of biosurfactants and their structures and review the environmental applications for 95
soil remediation and water treatment. Biosurfactant applications in the environmental 96
industries are promising due to their biodegradability, low toxicity and effectiveness in 97
enhancing biodegradation and solubilization of low solubility compounds. 98
99
2.2. Surfactant adsorption at water/air surfaces 100
The attraction of surfactants for aqueous solution/air surfaces is due to hydrophobic 101
attraction. Hydrophobic attraction is the thermodynamically favorable tendency of the 102

9
surfactant hydrocarbon moiety to escape from the aqueous environment to an apolar 103
environment (air). With adsorption the hydrophobic attraction is the difference between the 104
Gibbs energy (energetic and entropic contributions) of the surfactant tails in aqueous 105
solution and that in the adsorbed state. The adsorption of surfactants at liquid interfaces is 106
generally studied by measuring the surface tension, γ, and using the Gibbs equation to 107
obtain the adsorption [19, 20]. 108
(1)(1)
2d d da i i
is Tγ Γ µ
== − − ∑ 109
where (1)as is the relative surface entropy per unit area, T the absolute temperature, (1)
iΓ is the 110
relative adsorption of component i and µi is the chemical potential of i . The quantities (1)as 111
and (1)iΓ are conveniently determined by assuming that the solvent (component 1) 112
adsorption is zero ( 1 0Γ = ). In the case of surfactant adsorption from ideally dilute aqueous 113
solutions the Gibbs equation can be approximated as [21-23]: 114
(1) 115
where p = 1 for nonionic surfactants (they are only affected by the presence of electrolytes 116
when the electrolyte changes the solvent quality), but for ionic surfactants 117
1 surfactant
surfactant salt
cp
c c= +
+ 118
This notation of the Gibbs equation has used the equality d d lni iRT cµ = for all components 119
present and the implicit assumptions are made that the ion concentrations from the 120
background electrolyte are constant, that T is constant, that the adsorption, Γsurfactant, is a 121
simplified notation for (1)iΓ and that for ionic surfactants the surfactant co-ion adsorption 122
can be neglected. The latter assumption holds best for highly charged surfaces, i.e. at 123
sufficient surfactant ion adsorption. Schematically the effect of surfactants on the surface 124
tension of aqueous solutions is shown in Fig. 2. 125
10
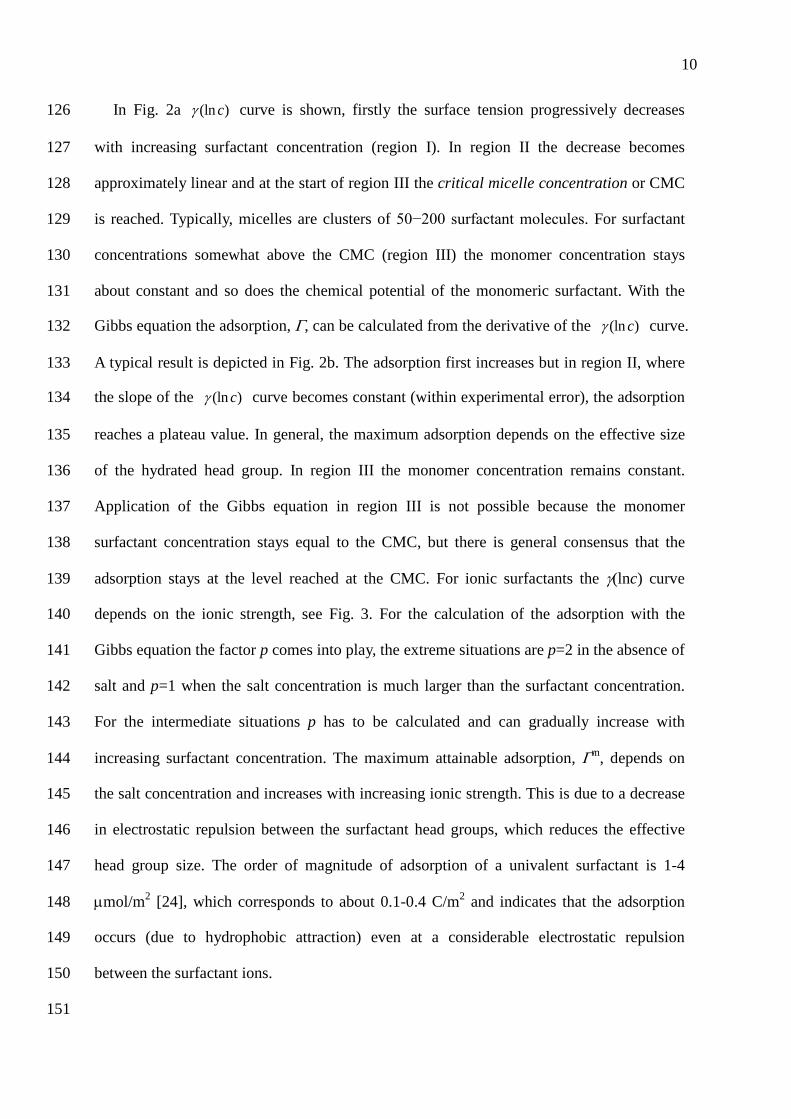
In Fig. 2a (ln )cγ curve is shown, firstly the surface tension progressively decreases 126
with increasing surfactant concentration (region I). In region II the decrease becomes 127
approximately linear and at the start of region III the critical micelle concentration or CMC 128
is reached. Typically, micelles are clusters of 50−200 surfactant molecules. For surfactant 129
concentrations somewhat above the CMC (region III) the monomer concentration stays 130
about constant and so does the chemical potential of the monomeric surfactant. With the 131
Gibbs equation the adsorption, Γ, can be calculated from the derivative of the (ln )cγ curve. 132
A typical result is depicted in Fig. 2b. The adsorption first increases but in region II, where 133
the slope of the (ln )cγ curve becomes constant (within experimental error), the adsorption 134
reaches a plateau value. In general, the maximum adsorption depends on the effective size 135
of the hydrated head group. In region III the monomer concentration remains constant. 136
Application of the Gibbs equation in region III is not possible because the monomer 137
surfactant concentration stays equal to the CMC, but there is general consensus that the 138
adsorption stays at the level reached at the CMC. For ionic surfactants the γ(lnc) curve 139
depends on the ionic strength, see Fig. 3. For the calculation of the adsorption with the 140
Gibbs equation the factor p comes into play, the extreme situations are p=2 in the absence of 141
salt and p=1 when the salt concentration is much larger than the surfactant concentration. 142
For the intermediate situations p has to be calculated and can gradually increase with 143
increasing surfactant concentration. The maximum attainable adsorption, Γm, depends on 144
the salt concentration and increases with increasing ionic strength. This is due to a decrease 145
in electrostatic repulsion between the surfactant head groups, which reduces the effective 146
head group size. The order of magnitude of adsorption of a univalent surfactant is 1-4 147
µmol/m2 [24], which corresponds to about 0.1-0.4 C/m2 and indicates that the adsorption 148
occurs (due to hydrophobic attraction) even at a considerable electrostatic repulsion 149
between the surfactant ions. 150
151

11
2.3. Micelles and their shape 152
The presence of micelles at surfactant concentrations above the CMC is a very important 153
property of surfactants. Micelles are governed by energetic and geometric considerations. A 154
comprehensive review on the models that describe micellization can be found in [25]. In a 155
micelle the hydrophobic attraction between the hydrophobic moieties is just balanced by the 156
repulsion between the hydrated head groups. The hydrophobic attraction is in this case the 157
difference between the Gibbs energy of the surfactant tails in the aqueous solution and that in 158
the core of the micelles. The shape of the micelles depends on the geometric characteristics of 159
the surfactant molecules. In general, the concentration at which the CMC occurs depends on 160
the surfactant structure and solution conditions. With respect to the surfactant structure the 161
variation in the length of the hydrophobic tail of the surfactant is the most important factor 162
and, in general, the CMC decreases as the hydrophobic character of the surfactant increases, 163
see Fig. 2c. For nonionics also the head group size is important; in general the CMC and the 164
surface tension at the CMC increases with the head group size, see Fig. 2d. 165
The solution conditions affect the CMC of nonionic surfactants when the solvent quality 166
for the head groups is affected. For ionic surfactants the ionic strength and type of surfactant 167
counterion are important. By way of illustration, Fig. 3 shows how the NaCl concentration 168
affects the surface tension of an ionic surfactant: sodium dodecyl pyridinium chloride 169
(C12PC). It is obvious that the salt concentration changes both the CMC and the slope of 170
the curves. The presence of electrolytes in solution reduces the CMC by shielding the 171
electrostatic repulsion between the ionic head groups. In soils, the CMC of ionic surfactants 172
is likely to be reduced due to the salts present in the soil-solution. 173
The above illustrates that the CMC of surfactants in aqueous solution varies with surfactant 174
structure and presence of electrolyte in the case of ionic surfactants; the presence of various 175
organic compounds and the temperature also affect the CMC. Although the CMC of a 176
surfactant may vary under different conditions, the CMC is a characteristic property of a 177
12
surfactant. Tabulated values of many surfactants (for ionic surfactants with specification of 178
the salt concentration or ionic strength) can be found in [24, 26, 27]. 179
The shape of the micelles varies from surfactant to surfactant and for ionic surfactants 180
the salt concentration is also affecting the micelle shape. In general, the micelle shape 181
depends on the area of the apolar tail, Vo/lo, where Vo is the tail volume in the micelle and lo 182
the extended tail length, and the equilibrium area, ae, of the polar/ionic head group at the 183
micelle surface. The parameter Vo varies with the number of hydrophobic groups, chain 184
unsaturation, chain branching and chain penetration by other compatible hydrophobic 185
groups, while ae is mainly governed by electrostatic interactions and head group hydration. 186
For ionic surfactants ae depends on the ionic strength and for large tails the tail packing in 187
the micelle is non-uniform and affects also the equilibrium head group area [28, 29]. The 188
ratio tail area over head group area, Vo/aelo, is called the “critical packing parameter” or 189
CPP and the CPP value provides a good indication of the shape of the micelles [30-32]. In 190
aqueous media and 0<CCP<0.3 the micelles are spherical (single chained surfactants with 191
large head group areas), for 0.3<CCP<0.5 the micelles are cylindrical (single chained 192
surfactants with small head group areas) and for 0.5<CCP<1 curved bilayers (lamellar) are 193
formed (double chained surfactant with large head group areas) and for CCP=1 flat bilayers 194
(double chained surfactant with small head group areas). For CCP>1 only inverted micelles 195
can exist. When the surfactant concentration is raised above the CMC, linear growth of 196
micelles is the dominating type of growth. Some knowledge about the shape of the micelles 197
is also important because in the adsorbed state surfactants already tend to form micellar type 198
aggregates before the CMC is reached. 199
200
3. Soil components 201
202
3.1. Humic substances 203

13
The soil organic fraction contains the non-humic substances (e.g., proteins and natural 204
macromolecules) and the humic substances. The humic substances are divided into fulvic 205
acid, humic acid and humin by their aqueous solubility; humic and fulvic acids are soluble 206
in the normal pH range and humins are not. Fulvic and humic acids are distinguished by 207
their solubility at low pH: fulvic acids are soluble in all pH, whereas humic acids precipitate 208
at low pH. For the isolation and separation of the humic substances the procedure described 209
by Swift et al. [33] is mostly used as the International Humic Substances Society 210
recommends it. 211
Humic particles found in soil, sediment and water have an extreme structural complexity. 212
In an overview Leenheer [34] discusses the successive approximations of model structures 213
to molecular structures that have appeared in literature for dissolved humic particles. 214
Present days insight is that the old “polyelectrolyte model” that represented the dissolved 215
humic particles as randomly coiled macromolecules resulting from various chemical 216
condensation and coupling reactions of smaller biomolecular constituents is no longer 217
adequate. New structural models view dissolved humic particles as dynamic associations of 218
relatively low molar mass components stabilized by hydrophobic interactions and hydrogen 219
bonds [35] or as complex supramolecular assemblies of small molecules, oligomers, and 220
polymers aggregated into supramolecular assemblies by non-covalent forces [36]. 221
From physicochemical point of view the dynamic character of the aggregation [37], the 222
presence of a diversity of functional groups that protrude in the aqueous phase [38] and the 223
fact that the aggregates have an open structure [39] that allows the aqueous solution to 224
partly permeate through the particles has to be taken into account. The functional groups 225
can dissociate or associate with protons and this causes the primary charge of the particles 226
that governs the electrostatic interactions. With physicochemical treatments humic particles 227
should therefore be considered as amorphous, polydisperse, chemically complex and 228
internally structured supramolecular particles that are held together by hydrophobic 229
14
attraction and hydrogen bonding and that are partly permeable by the aqueous solution. 230
Through their structure and dissociation or association of the functional groups with protons 231
the particles have in aqueous solutions a polyelectrolyte nature that can be classified as 232
soft-colloidal matter and both their charging and electrokinetic behavior [40] are different 233
from that of rigid solid particles. Due to their ‘open structure’ humic and fulvic acid have 234
very large sorption capacities per kg of material. The main differences between humic and 235
fulvic acids are their functional group density, average molar mass and hydrophobicity: 236
fulvic acids have a relatively low molar mass, a relatively high functional group density and 237
a relatively low hydrophobicity. Humin particles are only poorly investigated, but based on 238
the isolation procedure it may be expected that they are solid like (much less permeable 239
than humic acid) with a relatively low functional group density, have a large particle mass 240
and are hydrophobic in nature. 241
For a further physicochemical characterization of humic and fulvic acids the proton 242
binding characteristics of humic and fulvic acids are relevant. The heterogeneity of the 243
proton binding groups of humic substances is considerable with, in general, two main 244
classes of groups each with a wide distribution [41, 42]. The low proton affinity groups are 245
mostly referred to as ‘carboxylic’ groups (pKH around 3-4) and the high proton affinity 246
groups as ‘phenolic groups’ (pKH around 8-9). For the pH conditions in natural waters 247
humic and fulvic acid are negatively charged and pH and ionic strength affect the proton 248
charge density [43], the hydrodynamic radius of the humic particles [44] and their 249
electrokinetic behavior [40]. Fig. 4 gives a typical example of proton binding to a humic 250
acid at four different salt concentrations [45]. 251
Much attention has been paid to modeling proton (and heavy metal ion) binding to humic 252
and fulvic acids and the literature is reviewed in [46-50]. In general, models should (i) take 253
explicitly into account the heterogeneity of the functional groups of humic and fulvic acids, 254
(ii) distinguish between electrostatic and ion-specific binding and (iii) account for 255

15
competition for binding among ions. Models that confirm to these conditions are based on 256
intrinsic parameters that are independent of the environmental conditions (e.g., pH, ionic 257
strength). The two most successful models that suit the above conditions are Tipping’s 258
ion-binding Model VI/VII [51-53] and the NICA-Donnan model [38, 43, 54-56]. These 259
models can be applied across a wide range of environmental conditions and be used to make 260
predictions outside the calibration range. The heterogeneity of the humic substances is 261
described in Model VI/VII with a wide discrete distribution of (intrinsic) proton affinity 262
constants [47, 51] and in the NICA-Donnan model with a bi-modal continuous distribution 263
[57, 58]. For the electrostatic interactions a simple Donnan model is used in the 264
NICA-Donnan model [54] and recently also in Tipping’s model [52, 53]. The Donnan 265
models describe the electrostatic interaction with only one average smeared-out electrostatic 266
Donnan potential at given environmental conditions [59]. The Donnan model leads to 267
calculated Donnan potentials that are highly non-Nernstian, see [54]. This means that the 268
Donnan potential is non-linear with a change in pH and that its value is also strongly ionic 269
strength dependent. By considering a great deal of the existing data up to 2003, Milne et al. 270
[55, 56] have been able to establish two sets of parameters that can describe the proton and 271
other ion binding to, respectively, generic-HA and generic-FA. These generic-HS 272
compounds can be used as substitutes when no detailed information is present on a specific 273
HS to calculate the ion binding for many ions. 274
275
3.2 Silica and metal (hydr)oxides 276
In many parts of the world, silica (SiO2) is the major constituent of sand and silt. The 277
fine silica particles (<2 µm) are classified as clay. Oxides of iron and aluminum are most 278
prominent in soils of the tropics but are widespread elsewhere. Silica has a number of 279
distinct crystalline forms in addition to amorphous forms. Amongst the various 280
crystallographic forms of silica, α-quartz is the most abundant, as it is the most stable 281

16
crystalline silica phase. Thus, α-quartz has been widely used as a model for the 282
investigations of water/silica interface systems in environmental processes. Due to their 283
coarse size, quartz particles have a low specific surface area and do not have colloidal 284
properties, yet they exhibit adsorption. In contrast, amorphous silicas can be very fine and 285
mostly have a large specific surface area. Also because their industrial uses, the adsorption 286
properties of amorphous silicas (mostly synthetic) have attracted much attention. 287
The surface structure of silica is composed of siloxane sites (-Si-O-Si-) and silanol 288
(-SiOH) sites. Siloxane sites are hydrophobic and silanol sites are hydrophilic; therefore, the 289
higher the silanol content is, the larger is the hydrophilicity of the surface. The silanol 290
groups can be subdivided into isolated (or single), geminal (-Si(OH)2) and vicinal or 291
bridged silanols. The vicinal OH groups are two nearest neighbors that are bound together 292
by a hydrogen bond. The silanol sites are formed by hydroxylation of siloxane bridges. 293
Based on dehydration studies, Zhuravlev [60] has shown that amorphous silica surfaces will 294
contain predominantly single and geminal silanol groups and siloxane bridges, the relative 295
content of each type of group depending on the temperature of dehydration and the 296
subsequent rehydration conditions. Direct information on the distribution of silanol groups 297
over isolated, geminal and vicinal groups can be obtained from NMR studies. Chuang and 298
Maciel [61] have reported that the surface of amorphous silica powders have a roughly 299
equal distribution of isolated and geminal silanols. Yang and Wang [62], who reviewed 300
computational simulations, conclude that the normal siloxane bond is hard to be hydrolyzed 301
because of the high reaction barrier, but siloxane surface structures with a large strain stress 302
and surface defects are rather readily broken by water attack, especially with the aid of extra 303
water molecules. The presence of silanols next to siloxane groups thus also follows from the 304
simulation studies. 305
From hydration-dehydration and tritium and deuterium exchange studies it can be 306
concluded that when an amorphous silica surface is hydroxylated to the maximum state the 307
17
silanol density is around 4.9 groups per nm2 independent on the history of the sample [60]. 308
This number is about two times smaller than the classical value of number of silanols of 309
about 8 groups per nm2 derived by Iler using the assumption that for each surface Si there is 310
one OH group [63]. The difference can be explained by the fact that only half of the Si 311
atoms are capable of holding OH groups [64]. Tamura et al. [65] give an overview of 312
hydroxyl site densities of silicas and a range of metal oxides (Al, Fe, Mn, Ti, Sn, Zn, Mg). 313
From the collected densities it follows that the hydroxyl content of silica is substantially 314
lower than that of the metal oxide surfaces. The high hydroxyl content of the metal oxides 315
explains that these surfaces are more hydrophilic than the silica surface. 316
The sites responsible for the charging of the aqueous interface of silica and metal oxides 317
can be derived from the mineral structure. For crystalline minerals the structure is well 318
known through X-ray diffraction measurements and in combination with electron 319
microscopy also the dominant crystal faces that make up the surface can be detected. Using 320
this information in combination with Pauling’s bond valence concept [66] and its refinement 321
[67-69] the protonation properties of the oxygen containing surface groups can be derived. 322
In the bond valence concept, the charge of the central cation is distributed over the 323
surrounding O-ligands and the sum of bond valences around oxygen should be equal to the 324
oxygen valence. Hiemstra et al. [70, 71] have used the bond valence concept in the 325
multi-site complexation (MUSIC) model to describe the protonation of mineral surfaces. 326
The model allows differentiating various types of surface groups in terms of formal charge 327
and takes into account that most metal oxide surfaces have multiple types of surface oxygen 328
groups that can react with protons. The pKH values of the groups can be predicted and the 329
model has highlighted that the two pKH values of two successive protonation steps on one 330
and the same O-ligand differ by about 10 pK-units (∆logKH ≈ 10). This implies that 331
practically only one proton association or dissociation step per surface group can occur in 332
the normal pH window. Other predictions are: (i) the inertness of double coordinated 333

18
surface groups on sesquioxides, which may result in non-charged perfect crystal faces for 334
gibbsite [72, 73] and hematite [73, 74], and (ii) the difference in proton affinity for the two 335
basic types of triply coordinated groups of goethite [71]. The MUSIC model may also 336
account for changes in temperature as shown by Machesky et al. [75]. It should further be 337
noted that the predicted ∆pKH value of 10 provides evidence that the older description of the 338
proton charging of mineral surfaces based on two protonation steps for each surface group 339
(≡SO− to ≡SOH0 to ≡SOH2+; 2-pK model) is fundamentally wrong. 340
It is instructive to discuss the primitive, but relevant, situation of a homogeneous silica 341
and gibbsite surface; each containing singly coordinated surface hydroxyls only [76-78]. 342
According to the bond valence concept, the silanol group has a formal charge of zero 343
(≡SiOH0), while the aluminol group has a formal charge of -1/2 (≡AlOH−1/2). By varying 344
the pH of the aqueous solution the ≡SiOH0 can release its proton and becomes ≡SiO-1, while 345
the ≡AlOH−1/2 group may associate with a proton to form ≡AlOH2+1/2; therefore, the silica 346
surface is acidic and the gibbsite surface is amphoteric. This difference leads to a different 347
type of point of zero net proton charge (pznpc): the silica charge approaches the pznpc 348
asymptotically (all groups in the protonated form at low pH), while the charge of gibbsite 349
changes linearly around the pznpc (equal numbers of ≡AlOH−1/2 and ≡AlOH2+1/2). To be 350
able to calculate the charge vs. pH curves at different ionic strength a further model is 351
required that describes the electrical double layer. For flat surfaces the diffuse part of the 352
electrical double layer can be described with the Debye-Hückel or the Gouy-Chapman 353
model [79], but for a good description of the electrical double layer of silica, gibbsite and 354
other mineral surfaces it is necessary to incorporate besides the diffuse layer also a Stern 355
layer adjacent to the surface. The Stern layer accounts for the dimensions of the counterions 356
close to the surface and allows the structure of water near the mineral surface to be different 357
from bulk water [80]. The MUSIC model in combination with the double layer model 358
provides the means to calculate the proton charge pH curves of silica and gibbsite. As a 359

19
consequence of protonation reactions and the different points of zero net proton charge, the 360
shape of the proton charge curve as function of pH of silica is rather different from that of 361
gibbsite. Also the surface potential behavior is different: the surface potential of silica is 362
highly non-Nernstian (i.e. strongly dependent on the ionic strength and non-linear with a 363
change in pH), while the surface potential of gibbsite is approximately Nernstian (linear 364
with a pH change and nearly independent of the ionic strength) [76-78]. Other metal oxide 365
surfaces have also fractional formal charges and react in a similar way as gibbsite. At 366
constant pH also the surface potential of metal oxide surfaces is about constant and about 367
independent of further solution conditions, therefore metal oxide surfaces are also called 368
‘constant (surface) potential’ surfaces. The fact that most surfaces have multiple types of 369
surface oxygen groups that can react with protons makes the situation more complicated, 370
but the principle difference between silica-type and gibbsite-type behavior remains. The 371
proton charge vs. pH at different ionic strength values, as observed for gibbsite [81], silica 372
[82] and hematite [83] is depicted in Fig. 5. 373
The multiple types of surface oxygen groups on silica and metal oxides and a detailed 374
electrical double layer model are of most importance for a good understanding of ion 375
binding other than protons, because these ions often do not react with all surface groups 376
and/or may lose part of their hydration shell depending on the type of surface group 377
(inner-sphere versus outer-sphere complex formation). Information on the type and structure 378
of the adsorption complexes has to be derived from spectroscopic studies and can be used in 379
the extended MUSIC model for ion binding, the CD-MUSIC model [84, 85], where CD 380
stands for charge distribution of the bound ions. For goethite the available parameters allow 381
calculations with many different ions and reliable predictions can be made based on ‘model 382
goethite’ even in complex situations. 383
Concluding, silica and metal oxides have rather different surface properties: (i) silica 384
contains both hydrophilic and hydrophobic sites (siloxanes), while the normal metal oxides 385

20
are hydrophilic, (ii) silica has an asymptotic point of zero net proton charge and a highly 386
non-Nernstian surface potential, while the metal oxides charging curves are linear in the 387
point of zero net proton charge and their surface potentials are close to Nernstian. Metal 388
oxide surfaces can be called, to a good approximation, ‘constant potential’ surfaces. For ion 389
adsorption to goethite accurate parameters are available for many ions so that reliable 390
predictions can be made for soils dominated by goethite. 391
392
3.3 Silicate clays (alumino-silicates) 393
A very important fraction of soils are the clays or alumino-silicates. Clay particles are 394
crystalline and found around the world but they are more widespread in temperate areas. A 395
main difference with most metal oxides is that silicate clays have a layered structure [14, 396
86]. The basic structure is composed of a sheet of tetrahedrons of silicon atoms surrounded 397
by oxygen atoms and a sheet of octahedrons in which an aluminum ion is surrounded by six 398
hydroxyl groups or oxygen atoms. The tetrahedrons in a sheet are linked by three of the 399
oxygens in the tetrahedron with adjacent tetrahedra and arranged in hexagonal rings, which 400
allow the sheet to extend indefinitely in the plane direction; the remaining oxygen is linked 401
to Al in the octahedral sheet. Also apical oxygen atoms are common to adjoining tetrahedral 402
and octahedral sheets. Combinations of stacked tetrahedral and octahedral sheets are termed 403
layers. Many layers are found in each crystal and in some clays the layers are separated by 404
interlayers in which water and adsorbed cations are found. In nature, cations having nearly 405
the same radius as Si4+ (e.g. Al3+) can replace Si4+ in the tetrahedral sheet by isomorphous 406
substitution. Isomorphous substitution can also take place in the octahedral sheet with Al3+ 407
being replaced by a similar-sized cation (e.g. Mg2+). The substitution finds mostly place 408
with cations that have a lower valence than either Si4+ or Al3+ and this results in unsatisfied 409
negative charges within the crystal, therefore isomorphous substitution is the primary source 410
21
of the negative charge of clay surfaces. The negative charges attract cations from the soil 411
solution. 412
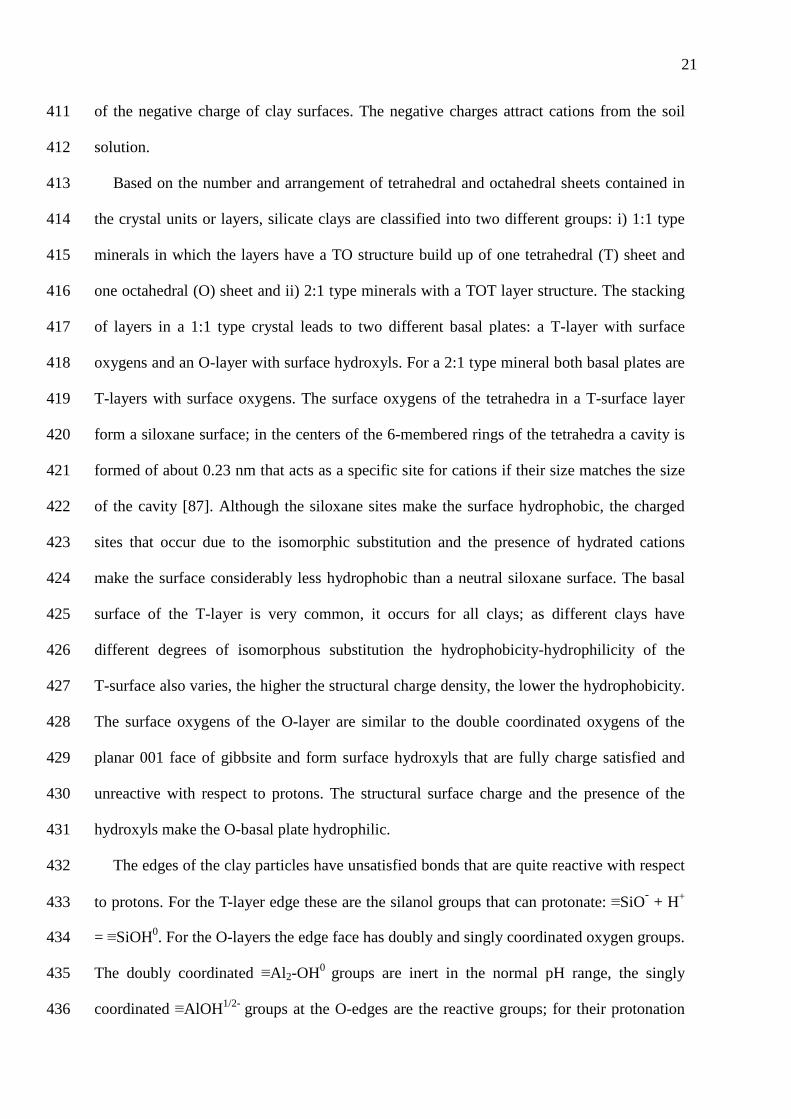
Based on the number and arrangement of tetrahedral and octahedral sheets contained in 413
the crystal units or layers, silicate clays are classified into two different groups: i) 1:1 type 414
minerals in which the layers have a TO structure build up of one tetrahedral (T) sheet and 415
one octahedral (O) sheet and ii) 2:1 type minerals with a TOT layer structure. The stacking 416
of layers in a 1:1 type crystal leads to two different basal plates: a T-layer with surface 417
oxygens and an O-layer with surface hydroxyls. For a 2:1 type mineral both basal plates are 418
T-layers with surface oxygens. The surface oxygens of the tetrahedra in a T-surface layer 419
form a siloxane surface; in the centers of the 6-membered rings of the tetrahedra a cavity is 420
formed of about 0.23 nm that acts as a specific site for cations if their size matches the size 421
of the cavity [87]. Although the siloxane sites make the surface hydrophobic, the charged 422
sites that occur due to the isomorphic substitution and the presence of hydrated cations 423
make the surface considerably less hydrophobic than a neutral siloxane surface. The basal 424
surface of the T-layer is very common, it occurs for all clays; as different clays have 425
different degrees of isomorphous substitution the hydrophobicity-hydrophilicity of the 426
T-surface also varies, the higher the structural charge density, the lower the hydrophobicity. 427
The surface oxygens of the O-layer are similar to the double coordinated oxygens of the 428
planar 001 face of gibbsite and form surface hydroxyls that are fully charge satisfied and 429
unreactive with respect to protons. The structural surface charge and the presence of the 430
hydroxyls make the O-basal plate hydrophilic. 431
The edges of the clay particles have unsatisfied bonds that are quite reactive with respect 432
to protons. For the T-layer edge these are the silanol groups that can protonate: ≡SiO- + H+ 433
= ≡SiOH0. For the O-layers the edge face has doubly and singly coordinated oxygen groups. 434
The doubly coordinated ≡Al2-OH0 groups are inert in the normal pH range, the singly 435
coordinated ≡AlOH1/2- groups at the O-edges are the reactive groups; for their protonation 436

22
one can thus write ≡AlOH1/2- +H+ = ≡AlOH21/2+. Note that the site density of ≡SiO- at the 437
edges for a 2:1 clay will be higher than that at the edges of a 1:1 clay. In the normal pH 438
range the silanol sites will be partly negative, partly neutral, while the aluminol sites will be 439
partly positive, partly negative, the edge surface is therefore amphoteric. The above is the 440
simplest representation of the edge, in practice the situation is more complicated because of 441
non-ideal structures and end effects that cause bond-length relaxation and charge 442
redistribution at the edge surface [88-90]. 443
Proton binding to clays is considerably more complex than to silica or metal oxides; 444
protons will participate in the cation exchange at the basal planes and in the protonation or 445
deprotonation of the edges. Because of the presence of the structural charge on the basal 446
planes next to the variable charge of the edge, one deals with a patchwise heterogeneous 447
surface and for such surfaces the points of zero net proton charge are dependent on the 448
differences between the patches and the electrolyte concentration [83, 91]. One of the 449
complications is that the proton binding to the edges can be affected by the structural charge 450
due to ‘spillover’ of the electrostatic potential between basal and edge surface. In a 451
relatively simple model Avena et al. [92] incorporated both the structural charges that can 452
exhibit ion exchange and the variable edge charge that can change with pH according to a 453
simple proton association - dissociation reaction. The spillover of the potential is taken into 454
account by smearing-out the total particle charge over the entire surface. This model 455
captures the basic features of the proton charging and exchange reasonably well, but the 456
parameters have to be fitted. Fig. 6 depicts the measured proton charge curves for 457
montmorillonite that clearly show the shifts of the points of zero net proton charge, together 458
with the calculated curves [92]. 459
When the spillover effect is calculated in a sophisticated way and the site structure and 460
reactivity are modeled with the MUSIC approach with predicted pKH values the situation is 461
considerably more complicated. Bourg et al. [88] mention the various models that have been 462

23
used to describe the proton charging of montmorillonite and discuss the experimental results 463
and the most promising sophisticated models. 464
It is also instructive to briefly discuss how the layers are held together for the main clay 465
types. In the 1:1 type crystals, with kaolinite as most prominent example, the layers are held 466
together by hydrogen bonds; as these bonds are strong, the layers are closely held together 467
in stacks that are large in size, have no internal surfaces and do not swell when wetted. Also 468
the isomorphous substitution is low, consequently, these minerals have a relatively low 469
adsorption capacity for cations. The so-called cation exchange capacity or CEC is largely 470
due to cation adsorption on the edges of the particles and therefore relatively strongly 471
depending on the pH. The 2:1 clays can be subdivided in four general groups depending on 472
how strongly the layers are bound together: micas, chlorites, vermiculites and smectites. In 473
micas a relatively high fraction (~25%) of the silicon atoms in the tetrahedral sheets have 474
been replaced by aluminum. The resulting large negative charge is satisfied by potassium 475
ions held rigidly between the adjoining 2:1 layers and preventing expansion of the crystal. 476
As a consequence of the strong binding they have a fairly large stacking of layers and are 477
non-expanding. They resemble the 1:1 type clays somewhat and have a relatively low CEC 478
that is also fairly pH dependent. The chlorites are also non-expansive, the adjacent negative 479
layers are held together by a positively charged magnesium-dominated octahedral sheet in 480
the interlayer between the two 2:1 layers. Chlorites have particle sizes, CECs, and physical 481
properties similar to those of fine-grained micas. Vermiculites have a significant substitution 482
of aluminum for silicon in the tetrahedral sheets as well as some substitution of magnesium 483
for aluminum in the octahedral sheet, but lower than in micas. The individual 2:1 layers are 484
held together only loosely by Mg2+ and Ca2+ ions that act as bridges between the structural 485
charges in the adjoining layers. Water molecules are attracted between the layers and 486
vermiculites expand when wet and shrink when dry. Due to the weak attraction between the 487
layers the surfaces adjoining the interlayer are also available for adsorption and this leads to 488
24
a very large total interface and a large CEC. Due to the limited expansion and the high CEC, 489
vermiculites have a high affinity for weakly hydrated cations such as K+, NH4+ and Cs+. The 490
final group contains the smectites, with montmorillonite as well known member. In the 491
smectites some magnesium has been substituted for aluminum in the octahedral sheet and 492
some aluminum for silicon in the tetrahedral sheet, but the degree of substitution is less than 493
in vermiculite and the interlayer is larger. Due to the relatively low structural negative 494
charge, K+ fixation is lower than in vermiculite. As in vermiculite, the cations in the 495
interlayer are exchangeable and this gives rise to high CECs. It may be clear that also 496
surfactant binding to non-expanding clays is far simpler than that to the expanding clays. 497
498
3.4. Concluding remarks 499
Comparing the ion binding models for metal oxides and silica with those of humic 500
substances it follows that the electrostatic part of the model for metal oxides and silica is far 501
more complicated than that of the humic substances, especially when the adsorption of ions 502
other than protons is considered; for humic substances the heterogeneity is most important. 503
Adequate understanding of proton adsorption to silicate clays is only possible when a 504
distinction is made between the edges and the basal planes and considering the spillover of 505
the electrostatic potential of the basal planes to the edges. For all systems the proton 506
charging may change when another species is adsorbed (primary charge adjustment) due to 507
generic electrostatic effects and/or site competition. The different particles also differ in 508
hydrophobicity. Humic substances have many hydrophobic parts, the silica surface is partly 509
hydrophobic and the metal oxides are hydrophilic. Furthermore, adsorption on silica should 510
be distinguished from that on the metal oxides, because of the differences in proton 511
charging behavior and hydrophobicity. With silicate clays the edges are hydrophilic and the 512
basal planes of 2:1 clays are hydrophobic, but the hydrophobicity is weakened by the 513
presence of the structural charge and the adsorbed cations. For kaolinite (1:1 clay) the basal 514

25
siloxane surface is fairly hydrophobic, but the basal aluminol surface is hydrophilic; with 515
montmorillonite (2:1 clay) the two basal siloxane surfaces are less hydrophobic than the 516
siloxane surface of kaolinite due to the greater degree of isomorphic substitution. 517
518
4. Surfactant binding to humic substances 519
520
4.1. Early experimental studies and isotherms measured with surfactant electrodes 521
The investigations of surfactant binding to humic and fulvic acids are relatively recent, 522
still limited, and have not been reviewed. Therefore, the most important binding studies will 523
be discussed. Early reports are of Tombacz [93, 94] who investigated alkylammonium - 524
humate complexes with X-ray and interfacial tension measurements. Binding isotherms to 525
dissolved humic substances were reported for the first time in 1996 by Traina et al. [95], 526
who used an ultra-centrifugation technique and fluorescence quenching to obtain the 527
binding characteristics of C10-, C12-, and C14-linear alkyl-benzene sulfonates (LAS; in 528
0.03M NaCl and 0.01M CaCl2) to dissolved humic substances. By using pulse-field gradient 529
NMR Otto et al. [96] found that humic substances enhance the aggregation of the anionic 530
sodium dodecylsulfate (SDS) prior to micellization and that they form ion pairs with 531
cationic C16-trimethylammonium bromide. 532
The first isotherms ranging from low surfactant concentrations till the CMC were 533
reported by Koopal et al. [97], who used a potentiometric method with a surfactant 534
electrode to measure the equilibrium surfactant concentration. Three surfactants were used, 535
one anionic (SDS) and two cationic (C12- and C16-pyridinium chloride or C12PC and 536
C16PC) and the binding to purified Aldrich humic acid (PAHA) was investigated at three 537
pH values (5, 7, 10) at 0.025 M background electrolyte concentration. No binding could be 538
observed for SDS under the given conditions. The isotherms of the cationic surfactants were 539
independent of the humic acid (HA) content in solution (0.2-0.5 g/L), which indicates that 540

26
the results were not affected by possible dynamic aggregation/segregation of HA. The 541
observed isotherms for the cationic surfactants are depicted in Fig. 7; the binding is plotted 542
vs. c/CMC0, where c is the surfactant concentration and CMC0 is the CMC in the absence of 543
HA. The binding of C12PC and C16PC increased with increasing pH to maxima that 544
corresponded to the negative charge of the HA (arrows in Fig. 7). By plotting the binding vs. 545
log c/CMC0 the isotherms of C12PC and C16PC merged largely, indicating that next to the 546
electrostatic attraction hydrophobic bonding is important. When the charge neutralization 547
point was reached the cationic surfactant–PAHA complexes precipitated, which occurred at 548
approximately 10% of the CMC. For C16PC, the precipitation was complete, but in the case 549
of C12PC, a noticeable fraction of PAHA remained in solution. 550
Subsequent binding studies were made by Yee et al. [98-101], Matsuada et al. [102] and 551
Ishiguro et al. [103], who all used the potentiometric technique with a surfactant electrode 552
to measure the equilibrium surfactant concentrations. Yee et al. [100] also investigated the 553
binding of SDS to HA using Aso HA (AHA) derived from the Aso area of Kyushu Island, 554
Japan. At pH 9.18 and low ionic strength (0.03M) no binding could be observed between 555
SDS and AHA with either the potentiometric or dynamic light scattering (DLS) method, 556
which confirmed the result of Koopal et al. [97]. However, with the DLS method some 557
interaction could be detected at pH 3.98 and high ionic strength (0.10M). The attraction can 558
be explained by the fact that at 0.1M the electrostatic repulsion is suppressed, but the 559
hydrophobic attraction remains the same and the net effect is a weak attraction. Temperature 560
studies of C12-pyridiniumbromide binding to Aso fulvic (AFA) and AHA at pH 9.18 and 561
ionic strength of 0.03M showed that the binding of C12P+ with AFA was endothermic, i.e. 562
driven by a positive entropy [99], while the enthalpy of C12P+ binding with AHA was 563
slightly negative [101]. For AFA different binding modes were observed at two pH regions, 564
i.e., cooperative binding at pH > 7 and non-cooperative binding at pH < 7 , see Fig. 8 [99]. 565
27
For the AHA-C12P+ system no cooperative binding was observed, but the C12P+ 566
concentration at which the first binding was observed was much lower for AHA than for 567
AFA [101]. The latter reflects that AHA is more hydrophobic than AFA because the acidic 568
type of groups to which the surfactant head groups bind are very similar for FA and HA and 569
the negative charge density of FA is in general larger than that of HA. The C12P+ binding to 570
AFA did rise steeply just before the CMC, i.e. AFA-C12P+ cooperation occurred very close 571
to the CMC. The isotherm of C12P+ binding to AHA leveled-off just before the CMC as the 572
binding was close to its maximum value. The behavior of the AFA-C12P+ system at pH>7 573
could therefore also be caused by enhanced C12P+ micellization in the presence of AFA, 574
instead of typical C12P+ binding to AFA. The stronger hydrophobicity of AHA than of AFA 575
was confirmed by studying the effect of the aliphatic chain length (n) of the surfactant tail 576
(n: 12, 14, 16) [98]; the results are plotted in Fig. 9. In all cases the comparable isotherms 577
started for AHA at concentrations that were ~10x lower than for AFA. The isotherms shifted 578
with increasing chain length roughly with the same factor as the CMC, but the shift was 579
larger for AFA than for AHA. The results for AHA correspond with the observations of 580
Koopal et al. [97] and Ishiguro et al. [103]. 581
It should be realized that two different hydrophobic interactions have to be considered 582
with surfactant-HS interaction: (i) the hydrophobic effect of transferring the hydrocarbon 583
tail of surfactant into the hydrophobic parts of humic substances (HS) and (ii) the lateral 584
hydrophobic attraction between bound surfactants; (i) contributes to the greater binding 585
strength of HA than FA and (ii) may cause cooperative binding. However, when the 586
hydrophobic effect of transfer of the tail into the hydrophobic parts of HS is large, than the 587
extra effect of (ii) will be small. This explains why (ii) is larger for AFA than for AHA. 588
Yee et al. [99, 101] also investigated the role of the HS content (0.2-0.5g/L), pH and 589
ionic strength. In accordance with Koopal et al. [97], no HS concentration dependence of 590
binding was observed in both systems; possible self-aggregation of HS did not affect the 591

28
binding. The binding of C12P+ increased with increasing pH, similarly as observed by 592
Koopal et al. [97] for C12P+ and C16P+, and this can be explained by the increase of the 593
negative charge of HS with increasing pH. The bound amount decreased with increasing 594
ionic strength, due to the screening of the electrostatic attraction between surfactant ions 595
and HS; the effect was larger for AHA than for AFA. With DLS the hydrodynamic radii of 596
the AHA-C12PB (PB = pyridinium bromide) and AFA-C12PB complexes were measured at 597
pH 9.2 at ionic strength values of 0.03M and 0.1M for a constant concentration of AFA or 598
AHA of 0.05 g/L. In the absence of surfactant no reliable average size could be measured, 599
but in the presence of surfactant good results were obtained. At low surfactant binding the 600
aggregate diameters were about 200 nm and with increasing surfactant binding up to ~4 601
mmol C12PB/g the aggregate sizes increased; at 0.1M the increase in aggregate size was 602
similar for AFA and AHA (~1400 nm), while at 0.03M the increase in size was somewhat 603
lower for AFA (~1200 nm) but considerably less for AHA (~500 nm). The difference might 604
be due to the fact that the particle concentration in the case of AFA is much higher; at high 605
ionic strength rapid aggregation may occur for both HS, while at 0.03M the kinetics are 606
important. 607
The binding of Cn-trimethylammonium (CnTA+) ions to AFA and AHA has been studied 608
by Yee et al. [100] and Matsuda et al. [102]. Yee et al. compared the binding of C12TA+ 609
with that of C12P+ at pH 9.2 and 0.03 M at 25 oC. The binding of C12TA+ to AFA or AHA 610
was weaker than that of C12P+, presumably due to the relatively large size of the headgroup 611
of C12TA+, that prevents a close approach to the negative sites of HS. The differences 612
between the CnTA+ isotherms for AFA and AHA were similar as in the case of 613
C12P+-AFA/AHA A stronger interaction with HA than with FA for C16TAB was also 614
observed by Otto et al. [96] using NMR diffusion analysis. The surfactant head group 615
structure also affects the aggregation behavior: the hydrodynamic diameters of 616
AFA-C12TAB and AHA-C12TAB aggregates were smaller than those of AFA-C12PB and 617

29
AHA-C12PB aggregates. Similarly as for C12PB the aggregate size of the HS-C12TAB 618
aggregates increased with surfactant binding and the AFA-C12TAB aggregates were larger 619
than those of AHA-C12TAB. Thieme and Niemeyer [104] also observed an increase in size 620
of HS-C12TAB aggregates with increasing C12TAB binding. 621
Matsuda et al. [102] investigated first the binding of C12TA+ and C10TA+ surfactants to 622
PHA (derived from an HA-rich layer in Heilongjiang, China) at pH 8 and different NaCl 623
concentrations (0-50 mM) and subsequently that in the presence of divalent metal ions (Cu, 624
Cd, Zn, Pb, and Ca) at pH 8. With respect to C16TA+ the binding curves of C12TA+ were 625
shifted to higher surfactant concentrations; the shift was comparable to the shift in CMC. As 626
stated before, the stronger binding for C12TAB than C10TAB indicates the role of the 627
hydrophobic interaction between the tail of the surfactant ions and the hydrophobic parts of 628
PHA. The affinity of C12TA+ for PHA decreased linearly with the square root of the NaCl 629
concentration. In the presence of 0.5 mM divalent metal salts, the PHA-CnTA+ binding 630
decreased significantly, which can be explained by site competition and screening of the 631
electrostatic attraction. The effect of the different metal ions on C12TAB binding to PHA 632
was similar, but for C10TAB binding to PHA the effect decreases in the order Cd, Zn, Pb, 633
Ca, and Cu. 634
Ishiguro et al. [103] studied the binding of Cn-pyridinium chloride (C12PC and C16PC) 635
to purified Aldrich humic acid (PAHA), Dando humic acid (DHA, Japan), Inogashira humic 636
acid (IHA, Japan), Laurentian fulvic acid (LFA, Canada) and Strichen Bs fulvic acid (SFA, 637
Netherlands) at pH 5 and 0.005M NaCl, and C16PC binding to PAHA was also studied at 638
0.1M NaCl. Besides surfactant isotherms also titrations of HS with surfactant were carried 639
out using an automatic titrator combined with a Mütek particle charge detector (M-PCD) 640
[105, 106]. This M-PCD-method is well suited to measure the charge sign of colloidal 641
particles and in the case of titrations with a complexing agent of opposite charge the 642
iso-electric point (IEP) can be detected. The M-PCD titrations were used to determine the 643

30
charge of the HS samples at the given conditions (pH 5 and 0.005M NaCl) with 644
poly-DADMAC (poly-diallyldimethylammonium chloride) a strong cationic polyelectrolyte 645
[107, 108] and with C16P+. For this charge determination the IEP is required. For the HA 646
samples the charges determined with C16P+ were slightly higher than those observed with 647
poly-DADMAC, this could be explained by better screening and stronger charge adaptation 648
in the case of C16P+. For the two FA samples the charges obtained with C16P+ were 649
significantly larger than those measured with poly-DADMAC. This difference was 650
explained by the relatively low hydrophobicity and corresponding relatively low affinity 651
between FA and C12P+. By binding of C16P+ a surfactant-FA complex becomes more 652
hydrophobic, this enhances the affinity and the isotherm becomes very steep; for such 653
conditions the rate of titration was likely too fast and leading to too high IEPs. With C12P+ 654
the M-PCD method was only used to obtain at the given conditions the bound amount of 655
surfactant at the IEP and the corresponding solution concentration of surfactant. 656
Comparison of the C16P+ results with those of C12P+ showed that for PAHA the bound 657
amounts (mol/g) of C16P+ and C12P+ were the same, i.e. at the IEP the charge associated 658
with the HS was neutralized by bound surfactant ions. For the other HS samples the bound 659
amount of C12P+/C12PC at the IEP was larger than that of C16P+. This must indicate that at 660
the IEP some C12PC was included in the complex, as there is no reason to believe that the 661
screening of the HS charge by C12P+ is better than that by C16P+ when the HS-C12P+ 662
affinity is weaker. Chloride inclusion is most likely caused by the fact that around the IEP 663
the C12PC concentration in solution is relatively high. The behavior of CnP+ surfactants 664
often shows a dependence on the type of counterion, indicating incomplete dissociation 665
[109]. With C16PC the affinity for HS is so high that the amount of C16PC left in solution 666
is very low. Therefore, binding of uncharged C16PC to HS is insignificant for C16PC. The 667
M-PCD titrations with the surfactants also reveal that the surfactant–HS complexes reached 668
their IEP before the CMC was reached. Around the IEP some flocculation of the complexes 669

31
could be observed, and upon continuation of the titration charge reversal of the aggregated 670
complexes occurred. This may have lead to partial re-dispersion of the aggregates. Shang 671
and Rice [110] and Subbiah and Mishra [111] investigated HA-C16TB complexes by, 672
respectively, small-angle X-ray scattering and synchronous and excitation emission matrix 673
fluorescence, both found (partially) reversible flocculation around the CMC. Shang and 674
Rice used a purified peat HA; Subbiah and Mishra, who used Aldrich HA that was purified 675
by two filtration steps, also investigated SDS and Triton-X100 (t-Octyl-C6H4-(OCH2CH2)xOH, 676
x=9-10), a nonionic surfactant, and found only very weak interactions for these surfactants. 677
Binding isotherms of C16P+ to PAHA at two ionic strength values reported in [103] are 678
reproduced in Fig. 10. The binding is plotted in panel a) vs. log ceq(surfactant) and in panel 679
b) the same result is depicted but now as double logarithmic plot. The horizontal dashed line 680
indicates the bound amount of C16P+ and the approximate concentration at the IEP as 681
measured with the M-PCD. The thin vertical lines in the top of the figures indicate the CMC 682
values. In panel a) also the proton release due to C16P+ binding is included. Two striking 683
effects can be observed: (i) the isotherms at different salt concentration intersect at the IEP 684
of the complex and (ii) close to or at the CMC the isotherms rise steeply. The latter is an 685
artifact; it is binding of surfactant in micelles, not to PAHA. At the common intersection 686
point (CIP = IEP) the charge of PAHA is neutralized by C16P+. The CIP occurs at a 687
surfactant concentration smaller than the CMC and the C16P+ binding continues till the 688
CMC because of hydrophobic attraction. Binding above the CIP=IEP indicates that C16P+ 689
binds super-equivalently to PAHA. Before the CIP, where the complex is negative, the salt 690
concentration screens the negative charge of the complex and this diminishes the head 691
group surface attraction, at the CIP the complex is net uncharged and salt has no effect, 692
beyond the CIP the complex is positive and the salt concentration screens the repulsion 693
between the head groups. As a consequence the salt concentration dependence inverses at 694
the CIP=IEP. The proton release is up to the CIP very small, C16P+ binding occurs on 695

32
already dissociated groups; beyond the CIP the proton release increases and is only slightly 696
smaller than the increase in surfactant binding, so most of the increment in surfactant charge 697
is balanced by proton release. 698
For sake of comparison the binding of C12P+ to sodium polystyrene sulfonate (SPSS), a 699
flexible linear anionic polyelectrolyte, is also plotted in Fig. 10, panels c) and d) [112]. The 700
C12P+ isotherms of SPSS at the three different ionic strength values merge before the CMC 701
(the measurements are not accurate enough to observe a CIP); however, for SPSS-C16P+ a 702
clear CIP could be detected [112]. The double logarithmic plots (b and d) are best suited to 703
investigate cooperativity of binding. It should be remarked that sometimes the S-shape of 704
single logarithmic plots is used to indicate cooperativity, but this leads easily to erroneous 705
results, because the Langmuir isotherm (no cooperativity) also has an S-shape in these plots. 706
Firstly, the binding of C12P+ to SPSS is considered as this system shows the various aspects 707
most clearly (this is the reason that in Fig. 10 SPSS-C12P+ was preferred above 708
SPSS-C16P+). Along the isotherm four regions can be distinguished. Region I, at the very 709
low surfactant binding (or surfactant concentration) is the region where the slope of the 710
isotherm is unity, this is the “Henry region” where binding and concentration are 711
proportional; the surfactant is ideally bound on isolated sites of equal energy. For 712
SPSS-C16P+, region I cannot be observed; the slope is very steep from the start due to the 713
strong cooperativity [112]. In region II, the slope of isotherms becomes larger than unity, 714
which clearly indicates cooperativity. The transition point of region I and II is defined as the 715
critical association concentration (CAC); at the CAC aggregation of surfactant starts. In 716
region II the number of aggregates along the polyelectrolyte chain increases with increasing 717
surfactant concentration. In region III the slope of the isotherms gradually lowers and 718
becomes smaller than unity due to three factors: 1) the attractive electrostatic interaction 719
becomes smaller due to the decrease of the negative charge of SPSS-C12P+ complex, 2) the 720
mixing entropy of “free” and C12P+-occupied sites decreases and 3) polymer chain 721

33
conformations become more restricted. The last factor will be of little importance for HS, 722
which is internally structured. The CIP marks the end of region III and the start of region IV, 723
the negative charge of the polymer is compensated by the positive charge of bound 724
surfactant. In region IV the aggregates grow slightly further and the SPSS-C12P+ complex 725
becomes increasingly positive. 726
Let’s now return to the PAHA-C16P+ system [103]; in the double logarithmic plot the 727
‘Henry slope’ is indicated by the dashed line. At 0.005M NaCl a CAC and cooperativity 728
cannot be observed, but there is a slight kink in the isotherm that could be the transition 729
point between regions I and II. Region III (up to the CIP) and region IV beyond the CIP can 730
be clearly observed. At 0.1M the isotherm starts with a slope higher than unity, that implies 731
some cooperativity is observed at low surfactant concentration, but the CAC cannot be 732
established. The increase in cooperativity with increasing electrolyte concentration occurs 733
because the electrostatic repulsion between the bound surfactants decreases. 734
In Fig. 11 the binding at 0.005 M NaCl of C16P+ is compared to that of C12P+. The 735
influence of carbon chain length on binding can be clearly observed. The C16P+ binds at 736
much lower surfactant concentrations than C12P+ and the isotherm is somewhat steeper. 737
The larger affinity for C16P+ is largely due to the fact that C16P+ ‘hates’ the aqueous 738
solution more than C12P+, because the shift of the two isotherms is similar to that of the 739
CMC. This reveals the importance of the hydrophobic effect for the binding. 740
The C12P+ binding isotherms for the different humic and fulvic acids at 0.005 M NaCl 741
are compared in Fig. 12. The shape of the binding isotherms to the humic acids is distinctly 742
different from that of the fulvic acids and the C12P+ binding decreases in the order of 743
PAHA>>IHA≈ DHA>>SFA≈LFA. The order ranks the HS with respect to hydrophobicity, 744
PAHA is most hydrophobic the FA’s the least. Cooperativity is not observed at pH 5 and 745
0.005 M NaCl because the slopes of the curves are almost unity or smaller than unity. These 746
results correspond with the findings of Yee et al. [98, 100, 101] discussed above. 747
34
748
4.2. Surfactant binding measured by solid-phase micro-extraction 749
Recently, Chen et al. [113] have demonstrated that polyacrylate (PA) coated microfiber 750
sorbs organic cations via ion exchange at the carboxylic groups. When the binding isotherm 751
is known, it can be used to determine the freely dissolved concentration of the given 752
cationic surfactants. The free surfactant concentration in a HS-surfactant system can be 753
obtained by extracting the surfactant bound to PA and determine the extracted amount by 754
HPLC, hereafter the calibration line gives the equilibrium surfactant concentration. The 755
method is called solid-phase micro-extraction (SPME). The method will work well when 756
the surfactant binding to PA is negligible compared to the binding to HS. The double 757
logarithmic representation of the surfactant isotherm to PA fiber is used as calibration curve 758
for the dissolved surfactant, because in this way the isotherm is linear in the low 759
concentration range. Binding isotherms of hexadecyl-trimethylammonium chloride 760
(C16TAC) and benzyldimethyl-dodecyl-ammonium chloride (C12BDAC) to PA are 761
reported as examples; the isotherms of these two surfactants coincide, while their CMCs 762
differ by more than a factor 10. Based on the difference in hydrophobicity this must imply 763
that PA is strongly hydrophilic and that there is-no hydrophobic contribution to the specific 764
affinity for the PA-carboxylic groups, mainly the surfactant head group chemistry seems 765
important. The linear part of the log-log isotherms of the two surfactants cover a 766
concentration range from about 10-10 to 10-6.5 M. The upper limit of this range is 103 to 104 767
times smaller than the CMCs. This implies that accurate measurements are only possible in 768
an equilibrium surfactant concentration range considerably below the CMC, for higher 769
concentrations the sensitivity lowers with increasing concentration. Therefore, the method is 770
most valuable for the linear part of the log-log surfactant HS isotherms. The preliminary 771
conclusion is that the PA-SPME will be of substantial added value in the low surfactant 772
concentration range, but that the surfactant electrode will be superior in the higher 773

35
concentration range (>10-3CMC). Anyhow, this new technique is highly welcome and will 774
promote further research of cationic surfactant binding. As example a series of binding 775
isotherms of C12BDAC to purified Aldrich humic acid (purified AHA) at pH 6 and 776
different salts and salt concentrations were measured. Chen et al. [114] continued the latter 777
study in a subsequent paper in which the pH range of the measurements was extended to pH 778
3, some results are reproduced in Fig. 13. 779
780
4.3. Modeling surfactant - humic substance interaction 781
Ishiguro and Koopal [115] modeled the results of C12PC and C16PC to different humic 782
and fulvic acids with the NICA-Donnan model [38, 43, 54-56] (see also section 7) under the 783
assumption that the surfactant (s) was dominant: (kscs)ns ≈ Σ(kici)ni with ki the intrinsic 784
affinity, ci the concentration and ni the stoichiometry of component i. This implies that only 785
the low affinity or carboxylic groups were considered and that the surfactant binding to 786
these groups was larger than the proton binding. For these conditions the NICA equation 787
simplifies to a Hill type equation, but the cooperativity parameter, m, includes the 788
cooperativity ns and the site heterogeneity parameter, p: m=ns•p. This Hill-type equation is 789
complemented with the Donnan model that accounts in a simple way for the electrostatic 790
interactions by assuming that for a given set of conditions there is only one electrostatic 791
potential that governs the behavior in the Donnan phase. With the combined model the 792
experimental results for the binding of the different surfactants to the different HAs at 793
different salt concentration and pH could be well described. For the FAs only the linear part 794
of the log-log isotherms could be described well. 795
Chen et al. [114] also modeled the surfactant isotherms with the NICA-Donnan model. 796
As the measured isotherms were restricted to the linear range, they made the assumption 797
that the total binding was hardly or not affected by the surfactant (s) binding: (kscs)ns << 798
Σ(kici)ni with ki the intrinsic affinity, ci the concentration and ni the stoichiometry of 799
36
component i. In this limit the NICA equation becomes a Hill-type equation (m=ns) for 800
which (kscs)ns <<1, which has the same form as the classical Freundlich equation. By 801
combining this equation with the Donnan model to incorporate the electrostatics and using 802
the generic description of HA as provided by Milne et al. [55, 56] the salt effects at pH 6 803
could all be explained well. 804
By considering the successful modeling attempts by Ishiguro and Koopal [115] and Chen 805
et al. [114] and the fact that two different limiting forms of the NICA equation both lead to a 806
Hill type equation also explains the success of the use of the Hill equation in the work of 807
Yee et al. [98-101]. However, as the Donnan (electrostatic) part was omitted by Yee et al. no 808
explanation could be provided for pH and salt effects. For more information on the 809
NICA-Donnan equation section 7 should be consulted. 810
811
4.4. Sorption of organic cations and risk assessment 812
Droge and Goss [116] studied the sorption of organic cations to soil organic matter 813
(SOM) using dynamic column experiments (peat mixed with silicium carbide) with 814
different compositions of electrolytes in aqueous eluents. The sorption affinity of the 815
organic cations to Pahokee peat soil (i) strongly decreased with increasing electrolyte 816
concentration, (ii) was higher in NaCl solutions than in CaCl2 solutions of similar ionic 817
strength, and (iii) was more sensitive to a decrease in NaCl than to a decrease in CaCl2. 818
Based on the results of this comprehensive study the authors made three remarks. (1) The 819
mass action law equations for ion-exchange reactions predicted trends in a qualitative but 820
not in a quantitative way. (2) Complex models, such as the NICA-Donnan model, are 821
required to fully account for the contributions of ionic interactions to the sorption of organic 822
cations to SOM. (3) The results imply that risk assessment models for organic bases should 823
take ion-exchange processes adequately into account when estimating soil sorption 824
coefficients and bioavailability. These findings indicate that, in general, the NICA-Donnan 825
37
model can play an important role in the description of organic cation exchange with soil 826
organic matter. 827
828
5. Surfactant adsorption to metal (hydr)oxides and silicas 829
830
5.1 General aspects and reviews 831
In contrast to the binding of surfactants to HS, the adsorption of surfactants to mineral 832
surfaces has received much attention, because insight in the structure that adsorbed 833
surfactants adopt is vital for practical applications. In older studies most attention was 834
focused on adsorption isotherms and their description. The typical isotherm of ionic 835
surfactants on oppositely charged metal oxides, when depicted as logarithm adsorbed 836
amount vs. logarithm concentrationeq (as done in the section on surfactant binding to SPSS 837
and HS), can be subdivided into four regions. Somasundaran and Fuerstenau [117] have 838
introduced this “four-regions” concept and it has been followed in many studies. Typically, 839
the four-regions isotherm extends over about three decades in concentration and adsorbed 840
amount; two examples of the four-regions isotherm are presented in Fig. 14(a), the isotherm 841
to the left depicts the adsorption of an anionic surfactant (sodium C9-benzene sulfonate) on 842
rutile at low pH, the isotherm at the right shows the adsorption of a cationic surfactant 843
(C12-pyridinium chloride) on rutile at high pH; for sake of comparison the same isotherms 844
are presented in Fig. 14(b) as semi-logarithmic plot that provides better insight in the higher 845
adsorbed amounts close to the CMC [118]. 846
To interpret the four-regions isotherm, the adsorption is best described with the relation 847
Γ = Kcn, where Γ is the adsorbed amount, c the concentration divided by the standard state 848
concentration (1 mol/L), K the effective affinity constant and n the cooperativity. In region I 849
isolated surfactant molecules adsorb and slope-I =1 or close to unity, which implies nI =1 850
and ideal behavior. In region II, which starts at low amounts adsorbed, slope-II is mostly >1 851

38
and thus nII > 1 which is due to cooperative association of adsorbed molecules caused by 852
hydrophobic attraction. For nII > nI the transition I/II is called the critical surface 853
association concentration (CSAC). At transition II/III the slope of the log-log isotherm 854
mostly decreases, i.e. nIII < nII; for nIII > 1 there is still cooperative adsorption but the 855
cooperation is less than in region II; for nIII < 1 there is negative cooperativity likely caused 856
by a decrease in configurational entropy due to high surfactant adsorption. Region IV 857
begins at the CMC, beyond which the chemical potential of the monomeric surfactant 858
remains approximately constant, therefore also the adsorption is constant. In some cases, e.g. 859
for cationic surfactant adsorption on silica at low ionic strength, a four-regions isotherm is 860
observed that does not confirm to the above picture: nII < nI (=1) and nII < nIII with nIII > 1, 861
thus region III has the steepest slope. In that case the concentration at which the transition 862
II/III occurs is the CSAC. Although the four-region-type isotherm is well established, 863
especially the interpretation of transition II/III is debated together with the structure of the 864
adsorbed molecules in both adjoining regions. This discussion is enhanced by the results of 865
modern techniques that give information on the adsorbed layer structures. An important 866
contribution to the discussion has been the paper of Manne et al. [119] in which convincing 867
evidence, based on atomic force microscopy (AFM), was presented that surfactants tend to 868
self-assemble at surfaces to form analogues of the micelles in bulk solution. Since then the 869
attention has shifted from adsorption isotherms to modern techniques that provide 870
information on the adsorbed structures. Most reviews of ionic surfactant adsorption pay 871
attention to the four-regions isotherms, but the debate around the four-regions isotherm is 872
still not fully settled and in reviews different views may be expressed. We will return to the 873
four-regions isotherm when the measured isotherms on silica and the metal oxides at 874
constant pH and different ionic strength values will be discussed. First, the various reviews 875
on surfactant adsorption to silica and metal oxides will be briefly introduced. 876

39
Several authors have reviewed the state of art of surfactant adsorption, mostly with 877
emphasis to their specialism in the field. The older studies are reviewed in [120, 121] and 878
Rosen’s book [24] provides a general review of surfactants and surfactant adsorption with 879
emphasis on surfactants and their mixtures both in solution and at interfaces and on the 880
modification of the surface properties by surfactants. After the pioneering work of Manne et 881
al. [119, 122] to directly visualize the structure of aggregates formed on surfaces using high 882
resolution scanning probe and atomic force microscopy (AFM), these techniques have been 883
used regularly. This work has been reviewed in [123] and in [119]. Johnson and Nagarajan 884
have presented a theory of surfactant self-assembly on isotropic hydrophobic and 885
hydrophilic surfaces [124, 125]. The theory is extending the treatment of self-assembly in 886
solution [28, 126] with an additional term that accounts for the replacement of the solid 887
surface-water contact by the solid surface-aggregate contact. This contribution depends on 888
the surfactant and surface properties and can be calculated for an assumed geometrical 889
shape of the aggregate; for hydrophobic surfaces and nonionic surfactants it is the Gibbs 890
energy change of replacing surface-water contact by solid surface-aggregate core contact, 891
while for hydrophilic surfaces and ionic surfactants it is (i) the electrostatic interaction 892
between the charged surfactant head groups and the hydrophilic surface, if the surface is 893
charged, plus (ii) the Gibbs energy change associated with displacing water by the 894
surfactant head groups wherever aggregate solid surface contact occurs. The CSAC and the 895
aggregate morphology can be predicted by computing the equilibrium Gibbs energy of 896
formation for a range of assumed geometrical structures and selecting the structure with the 897
lowest Gibbs energy. The CSAC is always predicted to be lower than the bulk phase CMC 898
and a variety of aggregate morphologies are predicted. Morphological transformations of 899
surface aggregates to less energetically favorable structures will occur when the surfactant 900
concentration increases. For hydrophobic surfaces the morphologies include hemispheres, 901
hemicylinders, finite disks, and continuous monolayers depending upon surfactant, solid 902
40
surface and surfactant concentration. For hydrophilic surfaces the situation is more complex 903
and in addition to full spheres and cylinders a series of composite structures are proposed 904
which are composed of monolayers oriented with head groups in contact with the surface 905
and covered with either hemispheres, hemicylinders, finite disks, or another monolayer 906
(making the full structure a bilayer). It should be noted that the authors have assumed that 907
monolayer structures with head groups in contact with the surface are instable and 908
transform in composite structures of covered monolayers. This is only correct for surfactant 909
concentrations close to the CMC. Stability and wetting studies have shown that beyond the 910
CSAC the instability and contact angle still increase up to the point where surfactant charge 911
and surface charge compensate each other [127], which points to largely uncovered 912
monolayer type structures or teepee-micelles [128]. Nevertheless, the model provides basic 913
insight in surface aggregation and allows a better judgment of the AMF images that are 914
mostly obtained around or above the CMC. 915
Derived from results obtained with modern measurement techniques Tiberg et al. [129] 916
have discussed in a comprehensive way the adsorption mechanisms and interfacial 917
structures of nonionic and ionic surfactants for both hydrophobic and hydrophilic surfaces. 918
It is an excellent review for a good orientation on surfactant adsorption. 919
Atkin et al. [128] have given a follow-up on this review with emphasis on the adsorption 920
process for ionic surfactants. Traditional equilibrium data (including the four-regions 921
isotherms), discrete aggregation on the substrate (mainly silica), and the morphology of the 922
aggregates are thoroughly discussed. As the AFM is most useful at detecting periodicity, 923
surfactant–substrate combinations that produce highly regular morphologies produce the 924
clearest AFM images. The hydrophobic cleavage plane of graphite orients the adsorbed 925
surfactant structures more strongly than any other substrate, and hemi-cylindrical structures 926
are formed for surfactant chains with more than 10 carbon atoms, smaller chains result in a 927
laterally featureless adsorbed layer. The hydrophilic, crystalline mica substrate also orients 928
41
the adsorbed surfactant structures, but not as strongly as graphite. The alkyl trimethyl- 929
ammonium surfactants form cylindrical admicelles, which were stable at relatively high 930
ionic strength, but less stable at low ionic strength. The morphology of adsorbed gemini 931
surfactants on mica depend strongly on the geometry of the surfactant monomer. On silica 932
surfactants are less strongly oriented, due to a lower surface charge and the amorphous state 933
of the substrate. The adsorbed configuration of C16TAB was concentration dependent, with 934
short rods at 0.9*CMC and worms at 10*CMC. Similar structures have been observed for 935
C14TAB and C12TAB on silica. For C16TAC, only spheroidal structures were present. In 936
all cases there was little or no long range ordering of the adsorbed aggregates. By 937
sequentially increasing the substrate hydrophobicity the structure of adsorbed nonionic 938
surfactants can be changed in a controlled manner from diffuse adsorbed micelles on the 939
least hydrophobic interface, to densely packed micelles, to a bilayer, to a monolayer on the 940
most hydrophobic interface. The information gained by AFM, fluorescence quenching and 941
neutron reflectivity is discussed and with this knowledge, kinetic data obtained from 942
ellipsometry and optical reflectometry, are analyzed. In the summary the likely mechanisms 943
of adsorption along the four-regions isotherm are proposed. 944
Zhmud and Tiberg [130] discuss applications of modern techniques (tensiometry, 945
ellipsometry, photon correlation spectroscopy, and neutron reflectivity) with emphasis on 946
the physical principles and theoretical aspects related to the adsorption and desorption 947
kinetics, interfacial structure development, wetting enhancement, and interfacial dynamics. 948
The review includes mathematical derivations that demonstrate how raw data can be 949
transformed into sought layer characteristics. After the discussion of the techniques the 950
intermolecular interactions in aggregated surfactant complexes are discussed and 951
experimental studies on the dynamics and structure of adsorbed surfactant layers are briefly 952
reviewed. The discussion of the isotherm for ionic surfactants is somewhat confusing 953
because two surface association concentrations are considered, the hemi-micelle 954

42
concentration and the critical surface association concentration. Although different names 955
have been used for the concentration at which aggregation starts, there is for a given system 956
only one concentration where the four-region isotherm steeply increases. In the last part of 957
the review wetting enhancement by surfactants and the effect of surfactants on the damping 958
of capillary waves are discussed. 959
A topical review on in-situ surface-enhanced infrared and non-linear vibrational 960
sum-frequency spectroscopy in relation to a better understanding of adsorption at 961
mineral–water interfaces is presented by Schrödle and Richmond [131]. Particular 962
consideration is given to organic adsorbates including surfactants. The authors conclude that 963
non-linear optical methods greatly extend the well-established linear IR techniques and 964
provide many opportunities to advance our understanding of the structure and dynamics of 965
mineral–water interfaces. This will be true, but, as the material is quite complex, help of an 966
expert will be required for the data analysis. 967
Many of the experimental results discussed in the above reviews are obtained on graphite, 968
mica, quartz and silica and these surfaces are different from the metal oxide surfaces. 969
Reviews that put more emphasis on metal oxide surfaces are those of Paria and Khilar [132] 970
and Zhang and Somasundaran [133]. Paria and Khilar discuss the four-regions isotherms of 971
ionic surfactants on oppositely charged metal oxides, and pay special attention to region IV, 972
that occurs for surfactant concentrations > CMC, where some anomalies have been 973
observed. Influences of molecular structure, temperature, salt concentration that are very 974
important in surfactant adsorption are reviewed for both nonionic and ionic surfactants and 975
the state of aggregation of the adsorbed surfactants is discussed on the basis of AFM and 976
fluorescence measurements. Also the adsorption behavior and mechanism of different 977
mixed surfactant systems (anionic–cationic, anionic–nonionic and cationic–nonionic) are 978
reviewed. Mixtures of surface-active materials can show synergistic interactions, which can 979
be manifested as enhanced surface activity, spreading, foaming and detergency. 980

43
The review of Zhang and Somasundaran [133] is concerned with adsorption of single 981
surfactants as well as mixtures of various types and provides lists of systems (surfactant / 982
surface / method) that have been studied for both ionic and nonionic surfactants. Also 983
zwitterionic surfactants are briefly discussed. The information derived from the isotherms, 984
combined with fluorescence spectroscopies, electron spin resonance (ESR), Raman 985
spectroscopies, small angle neutron scattering, neutron reflectivity and AFM, has been used 986
to discuss the structural properties of the surface aggregates along the isotherms. Compared 987
to the adsorption of single surfactants, adsorption of mixtures of anionic– cationic, anionic– 988
nonionic, cationic– nonionic, cationic– zwitterionic and nonionic– nonionic types generally 989
exhibit synergy at interfaces. To predict the shape of mixed aggregates of nonionic 990
surfactant mixtures a new model of the critical packing parameter is derived that takes into 991
account the mole fractions of adsorbed surfactants. 992
993
5.2 Surfactant adsorption and charge regulation 994
In the next sections the adsorption isotherms of ionic surfactants to rutile (TiO2) and 995
silica measured at constant pH and different background 1-1 electrolyte concentrations will 996
be critically examined, together with the adaptation of the surface charge as a result of the 997
surfactant adsorption. Results for rutile are taken from [118, 134-136], those for silica from 998
[137, 138]. It will be shown that these surfaces behave differently with respect to surfactant 999
adsorption. A strictly constant pH allows the calculation of the surface charge regulation 1000
(adaptation) and measurements at different ionic strength at constant pH can be of help with 1001
unraveling the orientation of the adsorbed surfactant. In order to keep the pH constant, the 1002
pH is regularly checked during the course of adsorption and restored to its initial value. The 1003
amounts of alkali or acid to restore the pH are used to calculate the proton charge adaptation 1004
of the surface. The surface charge adjustment is important in itself (in many studies the 1005
effect of a change in surface charge is simply ignored), but it can also help to create a 1006
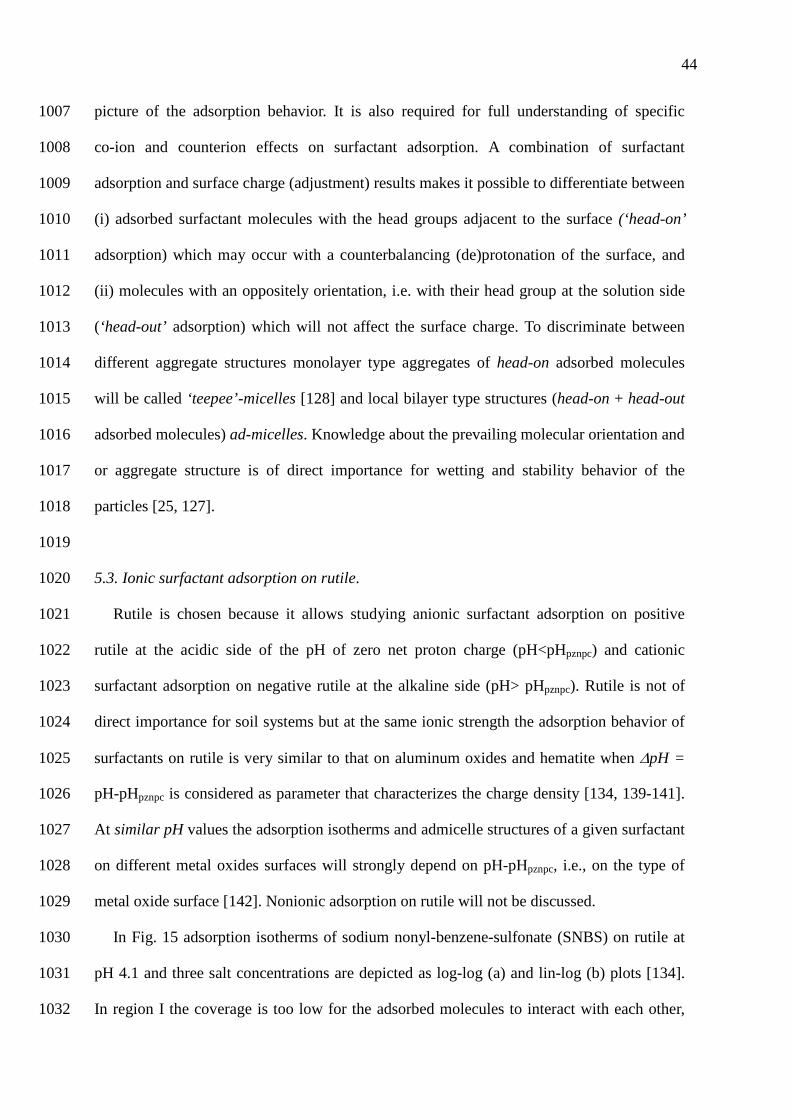
44
picture of the adsorption behavior. It is also required for full understanding of specific 1007
co-ion and counterion effects on surfactant adsorption. A combination of surfactant 1008
adsorption and surface charge (adjustment) results makes it possible to differentiate between 1009
(i) adsorbed surfactant molecules with the head groups adjacent to the surface (‘head-on’ 1010
adsorption) which may occur with a counterbalancing (de)protonation of the surface, and 1011
(ii) molecules with an oppositely orientation, i.e. with their head group at the solution side 1012
(‘head-out’ adsorption) which will not affect the surface charge. To discriminate between 1013
different aggregate structures monolayer type aggregates of head-on adsorbed molecules 1014
will be called ‘teepee’-micelles [128] and local bilayer type structures (head-on + head-out 1015
adsorbed molecules) ad-micelles. Knowledge about the prevailing molecular orientation and 1016
or aggregate structure is of direct importance for wetting and stability behavior of the 1017
particles [25, 127]. 1018
1019
5.3. Ionic surfactant adsorption on rutile. 1020
Rutile is chosen because it allows studying anionic surfactant adsorption on positive 1021
rutile at the acidic side of the pH of zero net proton charge (pH<pHpznpc) and cationic 1022
surfactant adsorption on negative rutile at the alkaline side (pH> pHpznpc). Rutile is not of 1023
direct importance for soil systems but at the same ionic strength the adsorption behavior of 1024
surfactants on rutile is very similar to that on aluminum oxides and hematite when ∆pH = 1025
pH-pHpznpc is considered as parameter that characterizes the charge density [134, 139-141]. 1026
At similar pH values the adsorption isotherms and admicelle structures of a given surfactant 1027
on different metal oxides surfaces will strongly depend on pH-pHpznpc, i.e., on the type of 1028
metal oxide surface [142]. Nonionic adsorption on rutile will not be discussed. 1029
In Fig. 15 adsorption isotherms of sodium nonyl-benzene-sulfonate (SNBS) on rutile at 1030
pH 4.1 and three salt concentrations are depicted as log-log (a) and lin-log (b) plots [134]. 1031
In region I the coverage is too low for the adsorbed molecules to interact with each other, 1032

45
the slope is about unity. Mutual attraction starts in region II, where the coverage is still very 1033
low: roughly between 0.03 and 3% of the maximum coverage. The concentration at the 1034
transition point between region I and II is the critical surface association concentration or 1035
CSAC. A straight line with a slope of about four fits the data points in region II, indicating a 1036
strongly positive cooperativity of the adsorption and proof for surfactant self-assembly. The 1037
slope in region III is considerably lower than that of region II and it depends notably on the 1038
salt concentration. It is less than unity for low salt concentrations and somewhat higher than 1039
unity for 0.1M salt. Salt addition promotes the adsorption in region III by screening the 1040
head group repulsion. The transition between regions II and III is more pronounced for low 1041
salt concentrations, which also indicates that at low salt concentrations the repulsion 1042
between head groups becomes important in region III. The CMC marks the transition to 1043
region IV, where the plateau is reached. 1044
Due to the fact that isotherms at three salt concentrations are plotted another important 1045
phenomenon occurs: the three isotherms at different salt concentration intersect in a 1046
common intersection point or CIP. The presence of such a CIP was first noted by De Keizer 1047
et al. [143] who also showed that in the absence of specific adsorption of other ions and/or 1048
activity effects the CIP should correspond to the IEP of the particles covered with surfactant. 1049
In Fig. 15(b), the lin-log plot, the strong cooperativity present at low coverage is evident at 1050
low salt concentrations as a weak shoulder in the isotherms. The lin-log isotherms show 1051
much better than the log-log isotherms that the ‘bulk’ of the adsorption occurs in region III. 1052
Also the position of the (near) CIP is clearly shown. The plateau values reached in region IV 1053
are about the same for the different salt concentrations. 1054
The adsorption of SNBS and surface charge of rutile are shown in Fig. 16 as function of 1055
the surfactant concentration at three pH values and two salt concentrations [134]. To 1056
facilitate the comparison the surface charge is divided by F, the Faraday, so that proton 1057
excess, Γ(0), and adsorbed amount of surfactant, Γs (SNBS), are both expressed in µmol/m2. 1058

46
Information about the structure of the adsorbed layer can be obtained by comparing Γ(0) 1059
and Γs. For a given pH, see e.g. pH 4.1 (Fig. 16, panel a and b), head-on adsorbed surfactant 1060
ions may either have displaced adsorbed Cl- ions or caused the formation of new proton 1061
charges at the surface to counter balance the surfactant charge and the latter increases Γ(0) . 1062
Head-out adsorption will not affect the surface charge. Therefore, as long as the surface 1063
charge adjusts to the surfactant adsorption head-on adsorption occurs. Initially Γ(0) > 1064
Γ(SNBS) because the surface charge is already present (best seen at 0.1 M NaCl) but at 1065
somewhat larger surfactant concentrations Γ(0) < Γ(SNBS). Beyond the intersection point 1066
the difference between Γs and Γ(0) is due to head-out adsorption plus some head-on 1067
adsorption of molecules that are accompanied by a counter ion; therefore, head-out 1068
adsorption is about proportional to Γs-Γ(0) but not necessarily equal to this difference. The 1069
proton uptake due to surfactant adsorption is the strongest at low surfactant adsorption and 1070
low salt concentrations: with almost every adsorbing surfactant molecule a proton is 1071
adsorbed, indicating that all surfactant ions will be adsorbed head-on. At higher salt 1072
concentrations the initial surface charge is higher, therefore the initial slope of the Γ(0) 1073
curve is less, surfactant ions cause displacement of Cl- ions at the surface by NBS- ions and 1074
proton adsorption. At high amounts adsorbed the surface charge becomes almost 1075
independent of the salt concentration: the surfactant is responsible for the screening of the 1076
surface charge. Very similar results are obtained at pH 5.1 and 6.0. At pH 6 the pure rutile 1077
surface is slightly negative (pHpznpc rutile 5.85); however, the specific affinity of the head 1078
group for the surface is sufficient to overcome the coulomb repulsion and the surfactant 1079
adsorption induces a positive charge on the surface. Therefore, only positive surface charges 1080
are observed once surfactant is present, and the two curves coincide at low surfactant 1081
concentrations. 1082
In general, the proton adsorption tends to level off after the CIP in the isotherms. The 1083
CIP corresponds for SNBS with the IEP and with the point where the surface charge and the 1084

47
surfactant charge balance, the equivalence point. The strong surface charge adjustment 1085
before the CIP in combination with the observed steep slope of region II of the isotherms 1086
indicates that teepee-micelles are formed at the surface. Teepee-micelle formation is 1087
promoted by the ‘flexibility’ of the surface charge. Changes in surface charge due to SNBS 1088
adsorption still occur beyond the CIP. This demonstrates that the head-on adsorption is not 1089
completed at the CIP. The substantial difference between Γs and Γ(0) beyond the CIP 1090
indicates that a large part of the additionally adsorbing molecules is oriented head-out: after 1091
the CIP the formation of admicelles is dominant. The rate of transition from teepee- to 1092
ad-micelles depends strongly on the salt concentration; the higher the salt concentration the 1093
sharper becomes the transition. The SNBS adsorption around the CMC depends only 1094
weakly on the salt concentration, increasing the salt concentration increases the adsorption 1095
somewhat due to the better screening of the head group charges. 1096
Comparing the behavior at the three pH values (Fig. 16) it can be observed that the pH 1097
effect on the SNBS adsorption is most strongly at the initial part of the isotherm (region I 1098
and II): the smaller ∆pH = pH-pHpznpc is, the lower is the affinity of the surfactant for the 1099
surface. However, the pH may also affect the admicelle structure because an increase in 1100
surface charge density can lead to a reduction in the effective headgroup area of the 1101
adsorbed surfactant and this may decrease the critical packing parameter [142]. Further 1102
adsorption studies on positively charged rutile with four sodium p-dodecylbenzene 1103
sulfonate isomers (3SDBS, ISDBS, 5SDBS, 6SDBS) [135] to study the effects of aliphatic 1104
chain length and architecture, revealed that the adsorption increases with chain length and 1105
decreases if the point of attachment of the aliphatic chain to the hydrophilic part of the 1106
molecule is shifted from a terminal to a medial position. 1107
The adsorption on negative rutile was studied by using two pyridinium surfactants (C12, 1108
C14) and the results were compared with those of SNBS (see Fig. 14) [118, 136]. The 1109
four-regions isotherm and the CIP are found also for the anionic surfactant adsorption on 1110

48
positive rutile, but for the weakly adsorbing CnP+ ions the situation is considerably more 1111
complicated than for the strongly adsorbing NBS- ion. Due to the relatively weak CnP+ 1112
adsorption, the competition with the salt cations (K+) becomes noticeable and the ‘CIP’ is 1113
no longer ‘sharp’, the IEP shifts with the salt concentration and differs from the ‘CIP’. 1114
However, the ‘CIP’ remains the transition point for tepee- to ad-micelle formation. For more 1115
details and a further discussion of surfactant adsorption on rutile or the metal hydroxides in 1116
general the quoted references should be consulted. 1117
1118
5.4. Ionic surfactant adsorption on silica 1119
The adsorption of cationic surfactants on silica (negative) is far greater than the adsorption 1120
of anionic surfactants. Nevskaia et al. [144] have shown that small amounts of anionic 1121
surfactants (C9H19-phenol-(OCH2-CH2)n-SO4- Na+, with n = 4 and 10) could be adsorbed on 1122
quartz but the relevance is very limited. Therefore, no further attention will be paid to anionic 1123
adsorption to silica. 1124
The adsorption isotherms for C12PC on Aerosil, measured at pH 9 and two salt 1125
concentrations are shown in Fig. 17(a) as log-log plot and in Fig. 17(b) as lin-log plot [137]. 1126
The isotherms at low and high salt concentrations have different shapes. At low salt 1127
concentration the adsorption shows a ‘hesitation’ in the both the lin-log and log-log plot. This 1128
is usually observed for adsorption of cationic surfactants on silica in the absence of salt or at 1129
low salt concentrations [145-148]. At both low and high salt concentrations four regions may 1130
be distinguished in the log-log plots and for low salt concentration the different regions can 1131
also be observed in the lin-log plot. The slope in region I of the C12PC isotherms is equal to 1132
unity within experimental error. In this region specific and coloumbic attraction between 1133
surface and surfactant ions take place, but the adsorbed molecules don’t interact with each 1134
other. In region II, the slope of isotherms, measured at low salt concentration, is less than 1135
unity. This demonstrates that surfactant self-assembly still does not occur! Self-assembly is 1136

49
counteracted by mutual head group repulsion and by the partial hydrophobicity of the 1137
pyrogenic silica surface that interacts with the surfactant tails by hydrophobic attraction. This 1138
behavior deviates strongly from that observed for adsorption of C12PC on rutile [118, 136] 1139
and in general from surfactant adsorption on the crystalline metal oxides. On silica surfactant 1140
molecules adsorb, at low salt concentration, without appreciable lateral interaction up to the 1141
end of region II. In the same concentration range the surface charge adapts strongly to the 1142
surfactant adsorption. Therefore, the mutual repulsion between the headgroups will be modest 1143
and most likely the tail-surface interaction is the main reason for the absence of self-assembly. 1144
Evidence for tail-surface interaction was obtained from both comparison of the effect of 1145
C16TAB and tetramethyl-ammonium bromide on the charging behavior of Aerosil [138] and 1146
theoretical calculations using the SCFA model [137]. The surfactant concentration has to 1147
increase to about 0.1*CMC before region III begins and the aggregation starts. Due to lateral 1148
hydrophobic attraction the slope of the isotherm in region III is steeper than that in II and the 1149
CSAC is located at the transition of region II to region III. 1150
Increasing the salt concentration increases the slope of region II due to the higher initial 1151
surface charge and a better screening of the lateral head group repulsion. At 0.1M salt the 1152
slope of region II is larger than that at region I; therefore, the CSAC now occurs at the 1153
transition from region I to region II. A relatively high salt concentration leads to a relatively 1154
high surface charge due to the presence of many counterions close to the surface, and this 1155
reduces the surface hydrophobicity. Consequently, not only the mutual head group repulsion 1156
is diminished, but also the tail-surface attraction, therefore surfactant self-assembly occurs at 1157
a much earlier stage than at low salt concentration. The slope in region III depends only 1158
weakly on the salt concentration and is now smaller than in region II. The transition to region 1159
IV is observed at the CMC. An increase in the salt concentration leads to a rise of the plateau 1160
value and small decrease of concentration (CMC), where plateau is reached: diminishing the 1161
lateral repulsion allows a closer packing of the molecules and/or a higher aggregate density. 1162

50
The isotherms show a CIP in region II, the concentration at which the intersection occurs, 1163
corresponds well with the point where the surfactant charge and the surface charge balance, 1164
the equivalence point. The fact that CIP and equivalence point coincide is direct evidence that 1165
the binding of C12P+ to Aerosil is much stronger than that of K+. The much stronger binding 1166
of C12PC to silica than to rutile [118, 136] is also likely due to the tail-surface affinity in the 1167
case of silica. The reasons for the CIP are the same as those mentioned for SNBS adsorption 1168
on rutile. The difference with the SNBS-rutile case is that the CIP is located in region II 1169
instead of in region III of the isotherm. 1170
The effect of C12PC adsorption on the surface charge of Aerosil at pH 9 is shown in Fig. 1171
18 for two salt concentrations (0.001 M and 0.1M KCl) [138, 149]. To allow easy comparison 1172
of the adsorbed amount of surfactant, Γs, and the surface charge the latter is divided by F, the 1173
Faraday, an indicated as, Γ(0); they are both expressed in µmol/m2. The maximum change in 1174
surface charge occurs at low surfactant and low salt concentrations, where the adsorption and 1175
surface charge isotherms almost coincide. It means, that at low salt concentrations with almost 1176
every adsorbing surfactant ion a proton is desorbed and practically all adsorbed surfactant 1177
ions will adsorb head-on. After compensation of the surface charge by surfactant (the 1178
equivalence point) the surface charge continues to increase weakly whereas the surfactant 1179
adsorption increases substantially. This indicates that locally adsorption of surfactant in 1180
head-out position starts, i.e. head group directed to the solution. The weak increase of Γ(0) 1181
shows that some of the additionally adsorbing molecules are still head-on adsorbed. On top of 1182
this some other surfactant ions may adsorb head-on if they are accompanied with a counter- 1183
ion. In general, one may conclude that small admicelles are formed around the initially 1184
head-on adsorbed (isolated) molecules. This representation of the surface aggregate 1185
corresponds with that suggested by Zhu et al. [150, 151]. 1186
At high salt concentration the changes in surface charge due to the surfactant adsorption 1187
are much less, evidently C12P+/K+ exchange is important. The high salt concentration 1188

51
screens the surface charge fairly well and it is difficult for the surfactant to start its 1189
adsorption. Once the adsorption starts it increases strongly over a rather small concentration 1190
range and a sharp intersection point with the Γ(0) isotherm is found. This equivalence point 1191
corresponds with the CIP of the C12PC isotherms. Before the equivalence point C12P+ 1192
adsorption occurs by exchange of K+, beyond the equivalence point the adsorbing surfactant 1193
ions bring their ‘own’ counter ions to compensate their charge. These adsorption 1194
mechanisms have been indicated before by Bijsterbosch [148]. The super-equivalent 1195
adsorption indicates admicelle (head-on + head-out adsorption) formation. The effect of a 1196
high salt concentration is twofold: (1) before the CIP teepee-micelles are formed (steep 1197
slope of region II of the log-log isotherm) and (2) the transition from head-on adsorbed 1198
molecules to admicelles becomes very sharp. In summary, below the CIP head-on 1199
adsorption occurs: at low salt concentration as isolated molecules, at high salt concentration 1200
as teepee-micelles, above the CIP head-out adsorption and ad-micelle formation occurs at 1201
all salt concentrations. Increasing the salt concentration increases the packing density of the 1202
adsorbed surfactants, but the values of the Γ(0) at the CMC hardly depend on the salt 1203
concentration. This indicates that the admicelles become more asymmetric and that around 1204
the CMC the screening of the surface charge is almost entirely done by surfactant. 1205
Goloub et al. [137] also studied the adsorption behavior of C16PC and the effect of the pH 1206
on both C12PC and C16PC; in general the behavior for C16PC is very similar but the 1207
isotherms are shifted to lower concentrations, which makes it difficult to study the lower 1208
regions of the four-regions isotherms. Lowering the pH to 7 or 5 also makes the study of the 1209
isotherm more difficult because less adsorption occurs when the negative surface charge is 1210
relatively low. For a further discussion the original papers should be consulted. 1211
The experimental results for both rutile and silica have also been compared with 1212
calculations using the Self-Consistent-Field Adsorption (SCFA) model [25, 134, 135, 137, 1213
152, 153] (see also section 7) both SCFA theory and experiments show that the course of the 1214
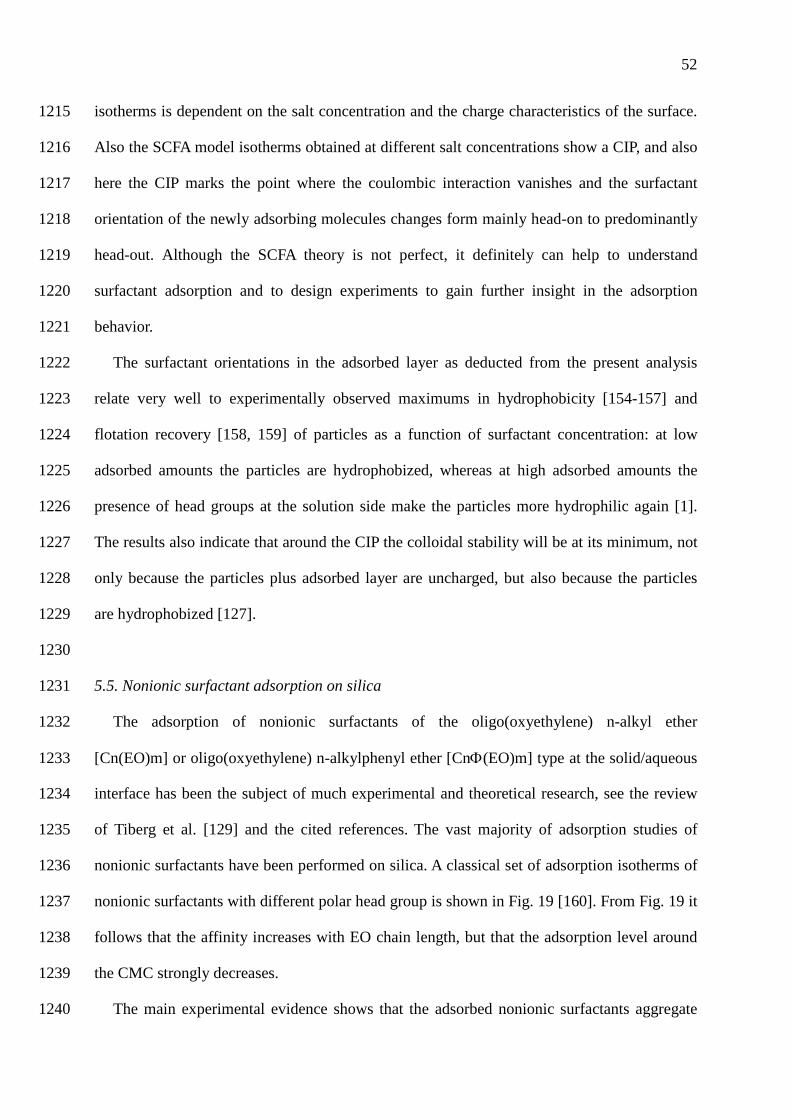
52
isotherms is dependent on the salt concentration and the charge characteristics of the surface. 1215
Also the SCFA model isotherms obtained at different salt concentrations show a CIP, and also 1216
here the CIP marks the point where the coulombic interaction vanishes and the surfactant 1217
orientation of the newly adsorbing molecules changes form mainly head-on to predominantly 1218
head-out. Although the SCFA theory is not perfect, it definitely can help to understand 1219
surfactant adsorption and to design experiments to gain further insight in the adsorption 1220
behavior. 1221
The surfactant orientations in the adsorbed layer as deducted from the present analysis 1222
relate very well to experimentally observed maximums in hydrophobicity [154-157] and 1223
flotation recovery [158, 159] of particles as a function of surfactant concentration: at low 1224
adsorbed amounts the particles are hydrophobized, whereas at high adsorbed amounts the 1225
presence of head groups at the solution side make the particles more hydrophilic again [1]. 1226
The results also indicate that around the CIP the colloidal stability will be at its minimum, not 1227
only because the particles plus adsorbed layer are uncharged, but also because the particles 1228
are hydrophobized [127]. 1229
1230
5.5. Nonionic surfactant adsorption on silica 1231
The adsorption of nonionic surfactants of the oligo(oxyethylene) n-alkyl ether 1232
[Cn(EO)m] or oligo(oxyethylene) n-alkylphenyl ether [CnΦ(EO)m] type at the solid/aqueous 1233
interface has been the subject of much experimental and theoretical research, see the review 1234
of Tiberg et al. [129] and the cited references. The vast majority of adsorption studies of 1235
nonionic surfactants have been performed on silica. A classical set of adsorption isotherms of 1236
nonionic surfactants with different polar head group is shown in Fig. 19 [160]. From Fig. 19 it 1237
follows that the affinity increases with EO chain length, but that the adsorption level around 1238
the CMC strongly decreases. 1239
The main experimental evidence shows that the adsorbed nonionic surfactants aggregate 1240
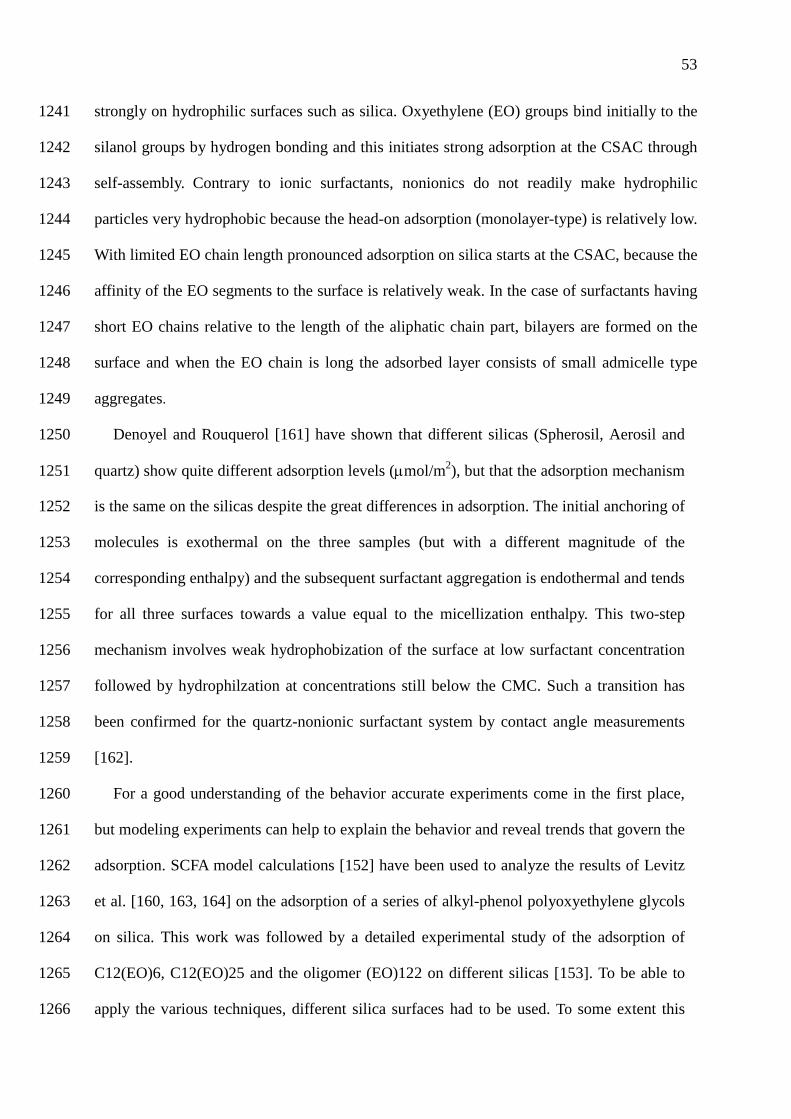
53
strongly on hydrophilic surfaces such as silica. Oxyethylene (EO) groups bind initially to the 1241
silanol groups by hydrogen bonding and this initiates strong adsorption at the CSAC through 1242
self-assembly. Contrary to ionic surfactants, nonionics do not readily make hydrophilic 1243
particles very hydrophobic because the head-on adsorption (monolayer-type) is relatively low. 1244
With limited EO chain length pronounced adsorption on silica starts at the CSAC, because the 1245
affinity of the EO segments to the surface is relatively weak. In the case of surfactants having 1246
short EO chains relative to the length of the aliphatic chain part, bilayers are formed on the 1247
surface and when the EO chain is long the adsorbed layer consists of small admicelle type 1248
aggregates. 1249
Denoyel and Rouquerol [161] have shown that different silicas (Spherosil, Aerosil and 1250
quartz) show quite different adsorption levels (µmol/m2), but that the adsorption mechanism 1251
is the same on the silicas despite the great differences in adsorption. The initial anchoring of 1252
molecules is exothermal on the three samples (but with a different magnitude of the 1253
corresponding enthalpy) and the subsequent surfactant aggregation is endothermal and tends 1254
for all three surfaces towards a value equal to the micellization enthalpy. This two-step 1255
mechanism involves weak hydrophobization of the surface at low surfactant concentration 1256
followed by hydrophilzation at concentrations still below the CMC. Such a transition has 1257
been confirmed for the quartz-nonionic surfactant system by contact angle measurements 1258
[162]. 1259
For a good understanding of the behavior accurate experiments come in the first place, 1260
but modeling experiments can help to explain the behavior and reveal trends that govern the 1261
adsorption. SCFA model calculations [152] have been used to analyze the results of Levitz 1262
et al. [160, 163, 164] on the adsorption of a series of alkyl-phenol polyoxyethylene glycols 1263
on silica. This work was followed by a detailed experimental study of the adsorption of 1264
C12(EO)6, C12(EO)25 and the oligomer (EO)122 on different silicas [153]. To be able to 1265
apply the various techniques, different silica surfaces had to be used. To some extent this 1266
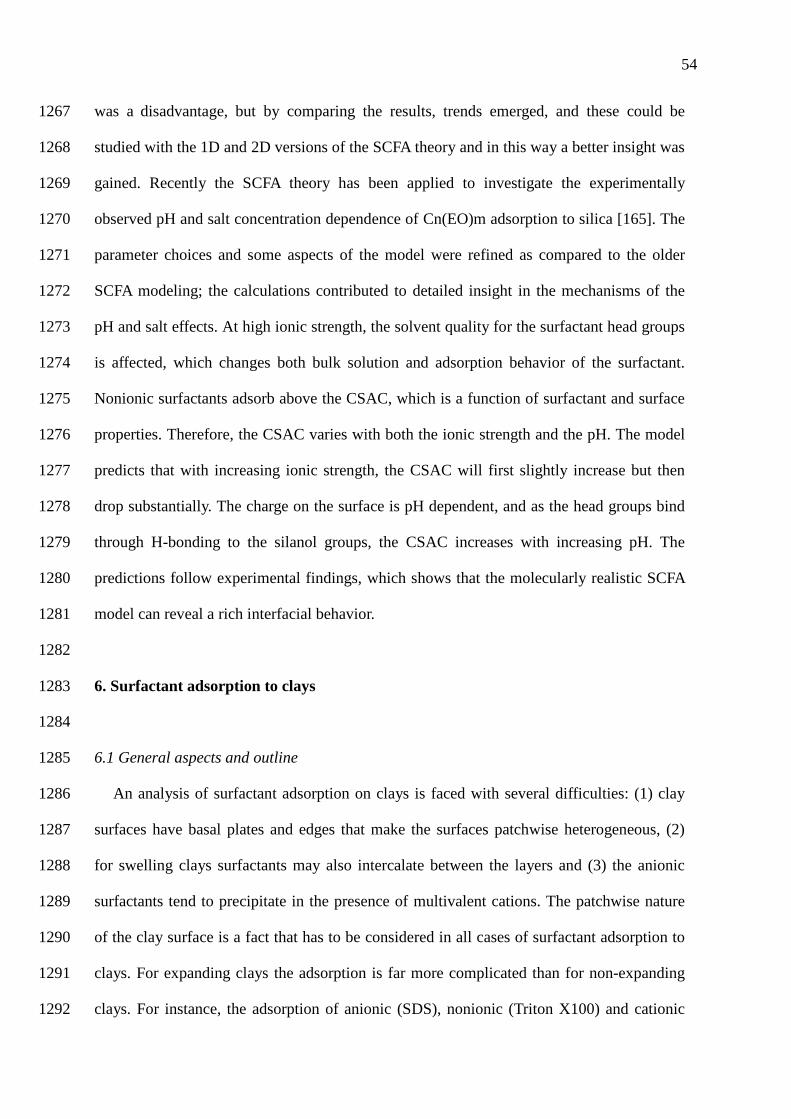
54
was a disadvantage, but by comparing the results, trends emerged, and these could be 1267
studied with the 1D and 2D versions of the SCFA theory and in this way a better insight was 1268
gained. Recently the SCFA theory has been applied to investigate the experimentally 1269
observed pH and salt concentration dependence of Cn(EO)m adsorption to silica [165]. The 1270
parameter choices and some aspects of the model were refined as compared to the older 1271
SCFA modeling; the calculations contributed to detailed insight in the mechanisms of the 1272
pH and salt effects. At high ionic strength, the solvent quality for the surfactant head groups 1273
is affected, which changes both bulk solution and adsorption behavior of the surfactant. 1274
Nonionic surfactants adsorb above the CSAC, which is a function of surfactant and surface 1275
properties. Therefore, the CSAC varies with both the ionic strength and the pH. The model 1276
predicts that with increasing ionic strength, the CSAC will first slightly increase but then 1277
drop substantially. The charge on the surface is pH dependent, and as the head groups bind 1278
through H-bonding to the silanol groups, the CSAC increases with increasing pH. The 1279
predictions follow experimental findings, which shows that the molecularly realistic SCFA 1280
model can reveal a rich interfacial behavior. 1281
1282
6. Surfactant adsorption to clays 1283
1284
6.1 General aspects and outline 1285
An analysis of surfactant adsorption on clays is faced with several difficulties: (1) clay 1286
surfaces have basal plates and edges that make the surfaces patchwise heterogeneous, (2) 1287
for swelling clays surfactants may also intercalate between the layers and (3) the anionic 1288
surfactants tend to precipitate in the presence of multivalent cations. The patchwise nature 1289
of the clay surface is a fact that has to be considered in all cases of surfactant adsorption to 1290
clays. For expanding clays the adsorption is far more complicated than for non-expanding 1291
clays. For instance, the adsorption of anionic (SDS), nonionic (Triton X100) and cationic 1292

55
(C18TAB) surfactants did not modify the X-ray diffraction diagrams of kaolinite and 1293
sepiolite (non-expanding clay types), but the interlayer space of montmorillonite (expanding 1294
clay type) increased through nonionic and cationic surfactant adsorption [166]. When the 1295
interlayer spacing expands upon surfactant adsorption the adsorption capacity becomes a 1296
function of the amount adsorbed and this leads to complex shaped adsorption isotherms that 1297
do not follow classical behavior. A further complication with anionic surfactant adsorption 1298
is that cations bound to the clay surface may exchange with the counterions of the anionic 1299
surfactant and this can lead to precipitation of the anionic surfactant, especially when the 1300
clay charge is (partially) compensated by multivalent cations [167]. Furthermore, at 1301
relatively low pH leaching of Al3+ ions from the clay may occur and can be promoted by the 1302
presence of anionic surfactants through Al3+ complexation with the anionic surfactant 1303
followed by surfactant precipitation [168-170]. Any precipitation of the surfactant obscures 1304
the pure adsorption results. 1305
The most studied non-expanding clay with respect to surfactant adsorption is kaolinite 1306
and cat-, an- and nonionic surfactant adsorption to kaolinite will be discussed in the next 1307
sections, with emphasis to cationic surfactants. Subsequently, surfactant adsorption to 1308
montmorillonite will be discussed at surfactant concentrations up to the CMC. The situation 1309
of surfactant binding to expanding clays to produce organo-clays for various specific 1310
applications is a field in itself. For reviews of this field we refer to [171-174] and to some 1311
original papers [175-178]. 1312
1313
6.2 Cationic Surfactant adsorption on kaolinite 1314
De Keizer et al. [143, 179, 180] have made a very thorough study of the adsorption of 1315
cationic surfactant adsorption (C16TAB and C12PC) on kaolinite (Sigma Chemicals) by 1316
investigating the adsorption behavior at different pH values and salt concentrations as a 1317
function of temperature. Adsorption isotherms (lin-log) of C16TAB and C12PC at different 1318

56
electrolyte concentrations show a well-defined CIP where the adsorption is independent of 1319
the electrolyte concentration [143, 179], see Fig. 20. The CIP coincided with the IEP of the 1320
particles with adsorbed surfactant, indicating that at this point the surface charge is 1321
compensated by the surfactant charge, including any counter-charge that may be present 1322
within the slip layer. The presence of a CIP and the correspondence with the IEP seems to 1323
be a general property for adsorption of organic ions on a surface with an opposite charge. 1324
Very similar behavior occurred for the surfactant adsorption on silica and rutile (metal 1325
oxides). Also for kaolinite head-out (second layer) adsorption driven by hydrophobic 1326
attraction starts after the CIP. This view is supported by the effect of the temperature on the 1327
adsorption. Below the CIP, adsorption is independent of temperature, whereas after the CIP 1328
it has a maximum as a function of temperature. With increasing temperature the adsorption 1329
changes from endothermic to exothermic, as for micellization. The CIP occurred for both 1330
surfactants at about 32 µmol/g, roughly 40% of the maximally attained value. In the 1331
CIP=IEP the charged surfactant groups just compensate the surface charge. Therefore, the 1332
above value may also be compared with the cation-exchange capacity (CEC). The CEC 1333
according to the silver-thiourea method was 57 µmol/g (exchange on plates plus edges), 1334
while the CEC with the ammonium acetate method at pH 7 was 30 µmol/g (cation exchange 1335
on the plates). This provided evidence that C16TAB and C12PC adsorption took place 1336
essentially on the plate surfaces. 1337
In part 3 of the study [180] the investigations were complemented with 1338
micro-calorimetric measurements of the adsorption enthalpies of C12PC on Na-kaolinite at 1339
two electrolyte concentrations (5 and 100 mM NaCl) and three temperatures (6, 20 and 1340
60 °C). Curves of cumulative adsorption enthalpies against amount adsorbed show a break 1341
around the CIP adsorption. The curves are about linear both before and after the break, and 1342
result in partial molar adsorption enthalpy values that are independent of surface coverage, 1343
confirming that the surface is homogeneous with respect to the C12PC adsorption. This is 1344

57
additional evidence that the surfactant is hardly adsorbed on the edges. The isotherms are 1345
independent of temperature up to CIP coverage, implying a zero isosteric adsorption 1346
enthalpy, but upon formation of the second layer (head-out mode) the adsorption has a 1347
maximum at about 23 oC, implying a transition from an endothermic to an exothermic 1348
process. The calorimetric adsorption enthalpies change sign at T ≈ 24-30 oC. In this respect, 1349
the adsorption process is very similar to micellization [181]. The electrolyte concentration 1350
has a minor effect on the adsorption enthalpies of the first (head-on adsorption) and second 1351
(head-out adsorption) layers. The directly measured heats agree qualitatively with the 1352
isosteric heats. 1353
In the last paper [180] the isotherms were also modeled with a simple two-layer model 1354
based on the Frumkin-Fowler-Guggenheim model that takes into account both the 1355
interaction with the surface and the lateral interaction, therefore the standard Gibbs energies 1356
have two contributions: ∆G0surface and ∆G0
lat. For the first layer it is assumed that the 1357
molecules adsorb head-on to the mineral surface with their tails at the solution side, for 1358
adsorption in the second layer the ‘surface’ is made-up of the tails of the first layer and the 1359
molecules adsorb head-out with their tails contacting the new ‘surface’. Since the 1360
adsorption on kaolinite particles involves chemical and electrical contributions, the changes 1361
in the standard Gibbs energies can be written as ∆G0 = ∆G0chem+ ∆G0
el. ∆G0el accounts for 1362
the generic interactions due to the ‘smeared-out’ electrostatic potentials, ∆G0chem contains 1363
chemical (specific), hydrophobic and ‘local’ electrostatic interactions (local self-atmosphere 1364
potentials). Because of their special nature and important role the hydrophobic attractions 1365
are separately indicated. The standard Gibbs energy of adsorption in contact with the 1366
surface (layer: 1, surface: s), ∆G01,s can then be written as ∆G0
1,s = ∆G01,s-spec + 1367
∆G01,s-hydrophobic + ∆G0
1,s-el); ∆G01,s becomes less negative with increasing electrolyte 1368
concentration, because salt addition decreases the electrostatic attraction part ∆G01,s-el. The 1369
effect of salt addition on ∆G01,s is opposite to that on ∆G0
1,lat, because for ∆G01,lat 1370

58
(=∆G01,lat-hydrophobic + ∆G0
1,lat-el) the salt effect is favorable (repulsion between surfactant head 1371
groups decreases). The two salt effects compensate each other at the CIP. The ∆G02,s 1372
(second layer) values are hardly dependent on the salt level, because the second layer starts 1373
when the particle potential is close to zero (CIP ≈ IEP); therefore, to a good approximation, 1374
∆G02,s ≈ ∆G0
2,s-chem ≈∆G02,s-hydrophobic, the standard hydrophobic attraction between layer 2 1375
and layer 1 (which is the new s). However, the lateral attraction in layer 2, ∆G02,lat, 1376
(=∆G02,lat-hydrophobic + ∆G0
2,lat-el) also contributes and increasing the salt concentration from 1377
20 to 100 mM causes a decrease of ∆G02,lat-el as a result of a decrease in the electrostatic 1378
repulsion between the head groups and, in turn, this increases net attraction and hence the 1379
adsorption. 1380
The sum (∆G01,s + ∆G0
1,lat) turns out to be hardly temperature dependent. This shows that 1381
the independence of the temperature of the adsorption in the first layer is caused by internal 1382
compensation. As a result, according to the Gibbs-Helmholtz equation, ∆H01,s ≈ 0. However, 1383
for the second layer the sum (∆G02,s + ∆G0
2,lat) is smaller at 20 °C than at 60 oC, in line with 1384
the exothermic nature of the process over this temperature range. At 20 °C the adsorption 1385
enthalpies, ∆H1,s, are much smaller than ∆G01,s indicating that entropic contributions dominate 1386
at both electrolyte concentrations. Apparently, for both layers the enthalpies of hydrophobic 1387
bonding of the tails and those due to interactions of the head group and/or change of hydration 1388
at the surface compensate. At 60 °C the entropy has decreased, but the (exothermic) enthalpy 1389
renders the standard Gibbs energies virtually temperature independent. This is another 1390
example of enthalpy entropy compensation which is characteristic for hydrophobic bonding 1391
and which has also been found for the solubility of alkanes in aqueous solution [182, 183]. 1392
Xu and Boyd [184] have obtained very similar C16TAC isotherms (lin-log) on kaolinite 1393
(Source Clay Minerals Repository, University of Missouri, Columbia) at pH 6.5 and two 1394
salt concentrations (2 and 42 mM), see Fig. 21. The (C)IP of the isotherms is found at about 1395
20 µmol/g (0.5CEC). The reported CEC value at pH 6.5 was 40 µmole/g; this would imply 1396

59
that about 50 % of the CEC is due to the plate surfaces. Although the authors measured 1397
electrophoretic mobilities and dispersion stability of montmorillonite, it is a pity that they 1398
did not state such results for kaolinite, because this might have shown the correspondence 1399
of their (C)IP with the IEP or the minimum in dispersion stability. 1400
Wang et al. [185] studied the adsorption of a series of alkyl-trimethylammonium 1401
bromides (RR1N(CH3)Br) with different chain lengths on sodium kaolinite (Source Clay 1402
Minerals Repository, University of Missouri, Columbia) by micro-electrophoresis and 1403
adsorption isotherms. The isotherms (lin-log) were measured over a relatively large 1404
concentration range and have a similar shape than those measured by de Keizer et al. [143], 1405
Mehrian et al. [179] and Xu and Boyd [184]. At very low concentrations the adsorbed 1406
amount increased only slowly with increasing surfactant concentration; the second stage of 1407
adsorption occurred at higher surfactant concentrations below the CMC and a sharp increase 1408
of adsorption was observed. Adsorption in the second stage is accompanied by a sharp 1409
change in the ζ-potential, charge reversal and second layer formation. The third region is 1410
located around the CMC with a constant adsorption above the CMC, where the monomer 1411
concentration and the adsorption remain constant. For all surfactants the amount adsorbed at 1412
the IEP is about 10-12 µmol/g. Though kaolinite came from the same source as that of Xu 1413
and Boyd [184], this value is about half the value reported by Xu and Boyd [184]. The CEC 1414
of the kaolinite is not reported in the paper so no further comparison can be made between 1415
the adsorption at the IEP and the CEC. An increase in the number of CH2 groups in the 1416
shorter alkyl chain of the double chain surfactant, or the introduction of another kind of 1417
alkylgroup (phenyl group), was found to have much less effect on the adsorption behavior 1418
than changing the length of the alkyl chain in the single-chain surfactants. This corresponds 1419
with the trend in CMCs and with the findings of Böhmer et al. [135] for surfactant 1420
adsorption on rutile. Intra-molecular association reduces the effective hydrophobicity of the 1421
shorter chains in the double-chain surfactants. 1422

60
A further study on chain architecture and adsorption on kaolinite was made by Qi et al. 1423
[186] who compared the adsorption of C16TAB with a C16-2-C16 gemini surfactant of 1424
similar structure (2 CH2 segments as spacer) at pH 6 and a ionic strength of about 0.02 M 1425
salt. Compared to C16TAB the affinity of the gemini surfactant was higher and the isotherm 1426
was steeper, but the maximum adsorptions in µmol/g at the CMC were rather similar. The 1427
maximum adsorption was about 1.4CEC, so well above the charge compensation point, 1428
which provides evidence for the presence of the second layer. 1429
An alternative approach to detect the onset of the head-out adsorption and the ratio 1430
head-out / head-on adsorption (maximum adsorbed amount in the second ‘layer’ relative to 1431
that in the first ‘layer’) has been introduced by Li et al. [187-189]. The somewhat simplified 1432
notion of the adsorption behavior is that first complete cation exchange occurs due to 1433
head-on surfactant adsorption (maximum first layer surfactant adsorption = CEC) and that 1434
subsequently further surfactant is adsorbed in the head-out mode by hydrophobic attraction 1435
(second layer adsorption). In the absence of added background electrolyte, surfactant bound 1436
head-on by ion exchange will loose its counterion and the cations that were adsorbed to the 1437
negative sites on basal planes will be released. For the second layer, formed by hydrophobic 1438
attraction, the mechanism is different: it leads to head-out surfactant adsorption and these 1439
surfactant ions will still require counter ions in the diffuse layer to compensate their charge 1440
and as the surfactant counterion is the only negative ion present except for some OH-, the 1441
surfactant ion adsorption will be accompanied by adsorption of its counterion. Thus, by 1442
comparing the surfactant adsorption with the counterion release from the clay (or with the 1443
CEC) and with the surfactant counterion co-adsorption a distinction can be made between 1444
first layer and second layer surfactant adsorption. This type of investigation goes back to the 1445
classical study of Bijsterbosch [148] of the counterion binding to C16TAB and C12TAB on 1446
silica. 1447

61
Li and Bowman [187] studied kaolinite (KGa-1; Source Clay Minerals Repository, 1448
University of Missouri, Columbia, MO) and a zeolite, clinoptilolite, and observed (1) that 1449
the maximum adsorption of C16TAX (X= Br-, Cl- or HSO4-) was in all cases larger than the 1450
CECs of the minerals, which implied that the adsorption was in excess of ion exchange 1451
and (2) that the maximum adsorption increased in the order HSO4-<Cl-<Br- which showed 1452
the surfactant counterion effect for the adsorption in the second layer. At the adsorption 1453
maximum the ratio surfactant counterion adsorption / surfactant adsorption ranged from 1454
0.33 to 0.55 in going from HSO4- to Br-, which is a clear indication of the formation of a 1455
second layer and that the counterion affects the amount of surfactant that is adsorbed 1456
head-out. 1457
In a subsequent study Li and Gallus [188, 189] investigated C16TAB adsorption on two 1458
kaolinites, KGa-1b and KGa-2 (Clay Mineral Repository; Purdue University, West Lafayette, 1459
IN, USA); the CECs determined by an ammonia method were 30 and 37 mmol/g, 1460
respectively. Relatively crude surfactant and counterion isotherms were measured, together 1461
with the accumulative cation desorption The discussion of the results is not always 1462
convincing, but the cation release as function of the surfactant adsorption provides clear 1463
information about the situation up to the CMC. Around the CMC the maximum amounts of 1464
C16TA+ adsorbed of about 58 and 85 µmol/g were reached and the corresponding amounts 1465
of cation released were about 18±2 µmole/g and 11±2 µmole/g for KGa-1b and KGa-2, 1466
respectively. However, at about 10 µmol/g surfactant adsorption the total cation release was 1467
already about 90% of the maximum release, and at 30-40 µmol/g nearly all the cations were 1468
released. This indicates that the adsorption in the second layer started at adsorption values 1469
of about 10-15 µmol/g; upon further surfactant adsorption a small fraction of the ions will 1470
still be head-on adsorbed, but the majority of surfactant ions was adsorbed head-out (second 1471
layer). Therefore, the head-out adsorption started at surfactant concentrations clearly below 1472
the CMC and the contribution of the head-out adsorption (by hydrophobic attraction) was 1473

62
far greater than that of the head-on adsorption (by cation exchange) and this means that 1474
asymmetric admicelles were formed. In the kinetic experiments the adsorption of bromide 1475
ions differed by about 15 µmol/g from the surfactant adsorption, which is close to the above 1476
estimate of the head-on adsorption. FTIR measurements showed a consistent shift of C–C 1477
symmetric and asymmetric vibration from high to low frequencies, which supported the 1478
view of a transition from head-on adsorbed monomers to admicelles as the C16TAB 1479
adsorption increased. 1480
Li and Gallus [189] also investigated the effect of surfactant chain length (C12TAB and 1481
C16TAB) and surfactant mixtures on kaolinite. As expected the surfactant chain length had no 1482
effect on the head-on adsorption (= cation exchange or first layer adsorption), but it did affect 1483
the adsorbed amount in the head-out mode (second layer). For C16TAB the head-out 1484
adsorption was considerably larger than the head-on adsorption, but for C12TAB the situation 1485
was reversed. For the 50/50 mixture the adsorbed amounts in head-on and head-out mode 1486
were comparable. Regardless of how much alkyl-ammonium adsorbed at the adsorption 1487
plateau, the amounts of cations desorbed were 15-18 µmole/g for KGa-1b and 9-11 µmole/g 1488
for KGa-2, respectively. Therefore, the CEC of KGa-1b and KGa-2 as determined by 1489
alkyl-ammonium adsorption/cation desorption will be 15-18 µmole/g, and 9-11 µmole/g, 1490
respectively. These values are much less than the values determined by an ammonia method 1491
[190] or the reference values listed on Clay Mineralogical Society website 1492
(http://cms.lanl.gov/ chem.htm). However, the value of cations desorbed from KGa-1b 1493
through surfactant adsorption was similar to the CEC values of KGa-1 determined by a 1494
complexation method using copper bisethylenediamine and copper triethylenetetramine in the 1495
presence and absence of the buffer tris(hydroxymethyl)- aminomethane [191]. Comparing this 1496
with the results of Mehrian et al. [179] would imply that the difference should be related to 1497
the CEC of the plates as compared to the total CEC (plates + edges). 1498
63
Recently, Malek and Ramli. [192] investigated C16PB on kaolinite with respect to 1499
antibacterial activity. Based on X-ray diffraction they first concluded that the structure of 1500
kaolinite was not affected by the surfactant adsorption. Although the interpretation of the 1501
results by the authors contains several errors, it is interesting that the antibacterial activity 1502
started after the IEP, i.e., when the surfactant started to adsorb in the head-out mode that 1503
made the overall particle charge positive, which must have caused the action of C16P+ 1504
against the bacteria cells. 1505
1506
6.3 Anionic surfactant adsorption on kaolinite 1507
Adsorption of anionic surfactants to kaolinite also occurs and for this adsorption the 1508
amphoteric edge sites are crucial. The point of zero net proton charge of the edge of 1509
kaolinite depends on the ionic strength and kaolinite composition, and is found to be in the 1510
pH range 4 to 7 [193]. Therefore, the net proton charge of the edge is positive at relatively 1511
low pH and negative at relatively high pH. The investigations of anion adsorption have 1512
mainly been carried out at relatively low pH, which can lead to some dissolution of 1513
kaolinite and surfactant precipitation so that next to surfactant adsorption also surfactant 1514
(surface) precipitation occurs. The total amount of surfactant removed from the solution is 1515
therefore called the surfactant abstraction. Somasundaran et al. [168-170, 194, 195] have 1516
investigated these aspects in detail in their studies of sodium dodecyl benzenesulfonate and 1517
sodium dodecyl sulfonate abstraction by kaolinite. Results obtained under various ionic 1518
strengths and pH values indicated a complex abstraction mechanism involving surfactant 1519
adsorption by ion exchange and hydrophobic attraction and metal activated adsorption and 1520
surface precipitation of surfactant, all depending on the solution pH. The precipitation of 1521
sulfonate with dissolved mineral species results in an adsorption maximum in micellar 1522
solutions. The dissolution of kaolinite and the resulting solution speciation can be found in 1523
[169]. Results for the abstraction of sodium dodecyl benzenesulfonate on Na-kaolinite 1524

64
(Georgia kaolinite from the clay repository at University of Missouri subjected to an 1525
ion-exchange treatment) as a function of pH at 0.1 M NaCl and 25 oC as obtained by 1526
Siracusa and Somasundaran [195] are summarized in Fig. 22. The authors made the 1527
following remarks concerning the abstraction (adsorption) mechanisms. (1) At acidic pH 1528
levels below pH 3.7 significant precipitation of the dodecylbenzene sulfonate with cationic 1529
dissolved aluminum species occurs and subsequent re-dissolution of the 1530
aluminum-sulfonate precipitates above the CMC produces an abstraction maximum. (2) At 1531
or near pH 4.4 (the pznpc of the sample) a reduction in the concentration of dissolved 1532
cationic aluminum species results in decreased precipitation such that the adsorption 1533
maximum is no longer observed. However, some contribution of aluminum-sulfonate 1534
precipitation is still present. (3) At pH levels above pH 4.4, both in the neutral region (pH 1535
7.9) and the alkaline region (pH 10.8), incongruent dissolution of kaolinite can result in 1536
phase transformations to gibbsite; therefore, adsorption occurs at levels governed not only 1537
by the surface of the kaolinite, but also by that of gibbsite. 1538
Very similar pH dependent results have been obtained by Torn et al. [196] for the 1539
dodecylbenzenesulfonate / Na-Kaolinite (Sigma Company) system at 0.01 M NaCl and 25 1540
oC, but in this case the abstraction maximum occurred at pH 4.8-4.9. Proton titrations of the 1541
kaolinite sample suggested a pznpc of about 7 [197], which is higher than the pznpc of the 1542
kaolinite used by Siracusa and this might explain the shift of the maximum. Torn et al. [196] 1543
concluded that both electrostatic and hydrophobic interactions play a role in the adsorption 1544
of the sulfonate surfactant to kaolinite. 1545
Poirer and Cases [167] have studied the effect of chain length (C14 and C12) and the 1546
presence of a benzene ring in the apolar chain (C10Φ) of the sulfonate surfactants on their 1547
adsorption to kaolinite. The adsorption isotherms at 28 oC showed a sharp increase in 1548
abstraction close to the saturation concentration of the surfactants, which was due to the 1549
precipitation of the sulfonates. The isotherms were shifted toward lower equilibrium 1550

65
surfactant concentrations as the hydrophobic moiety of the surfactant increased. The shifts 1551
were due to the increase in hydrophobic attraction and corresponded with the differences in 1552
CMC with surfactant structure. The benzene ring was about equivalent to three methylene 1553
groups. Del Hoyo et al. [166] investigated the adsorption of SDS on kaolinite by FTIR 1554
measurements and observed modification of the CH stretching wavenumbers of SDS 1555
indicating a re-arrangement of the adsorbed surfactant molecules and hydrophobic attraction 1556
between the hydrocarbon chains of the surfactant. 1557
How the structure of the adsorbed surfactant layer evolved as a function of the surfactant 1558
concentration has not been discussed in the above mentioned studies, but most likely also in 1559
this case head-on adsorption occurs at low adsorption values and head-out adsorption at 1560
surfactant concentrations closer to the CMC. 1561
1562
6.4 Nonionic surfactant adsorption on kaolinite 1563
The adsorption of nonionic surfactants on kaolinite resembles that on silica. Also on 1564
kaolinite the surfactant monomers adsorb by hydrogen bonding between the 1565
polyoxyethylene segments and the hydroxyl groups on the surface. In addition interaction 1566
may occur with the hydrated cations on the siloxane basal plate as is observed for 1567
montmorillonites [198]. The energy involved in the initial adsorption process is somewhat 1568
stronger than with silica. Similar as for silica, the energetic balance at the beginning of the 1569
adsorption is exothermic, because contacts between the surface and the ethoxy segments of 1570
the polar chains are enthalpically favorable. When the coverage of the surface increases, the 1571
enthalpy decreases down to the appearance of an endothermic regime. In the latter regime 1572
the molar enthalpy of adsorption is comparable to that of micellization in aqueous solution 1573
and this is characteristic for the presence of surfactant admicelles (or two adsorption layers) 1574
on the surface [161]. The temperature dependence of the adsorption [161, 199] is in 1575
agreement with this adsorption mechanism. Two steps can be observed along the adsorption 1576

66
isotherms [144, 161, 199, 200], some typical isotherms are depicted in Fig. 23. The first 1577
pseudo-step occurs at low coverage and is followed by a rapid but gradual rise of the 1578
adsorption up to the CMC, somewhat above the CMC the adsorption plateau is reached. 1579
Due to the polydispersity of most nonionic surfactants the plateau starts somewhat beyond 1580
the CMC. The second step corresponds with a cooperative adsorption mechanism and the 1581
formation of admicelles. The relative importance of the first step increases with the EO 1582
chain length (stronger adsorption), but the adsorption level at the CMC strongly decreases 1583
with EO chain length because the large head group makes it more difficult for the apolar 1584
chains to associate by hydrophobic attraction. The plateau adsorption is reached at higher 1585
surfactant concentrations for longer EO chains. The reason for this is that when oxyethylene 1586
length rises, the monomer solubility in water is higher and, thus, the CMC is also higher. 1587
For different kaolinite samples (Supreme, Charentes, Aldrich, Sigma) the isotherms 1588
have a similar shape, but the adsorption levels of the first step and the final plateau around 1589
the CMC differ [200], which implies that the structural organization of the surface 1590
aggregates is dependent on the surface heterogeneity of the kaolin crystals. Based on the 1591
characteristics of the kaolinite samples and the adsorption results no final conclusion could 1592
be reached regarding the role of the edge surfaces and the basal surfaces. 1593
1594
6.5 Anionic surfactant adsorption on montmorillonite 1595
The adsorption of surfactants to montmorillonite differs from that of kaolinite for two 1596
reasons. (1) Kaolinite has two different basal plate surfaces and a relatively large edge 1597
surface, while the basal plate surfaces for montmorillonite are the same and the edge area is 1598
relatively small. (2) Montmorillonite is an expanding clay-type, which implies that the 1599
adsorption capacity may increase with increasing surfactant adsorption, depending on the 1600
conditions. Anionic surfactant adsorption will mainly occur on the edges and the anions will 1601
not easily intercalate between the clay platelets, this and the relatively small edge area of 1602

67
montmorillonite make anionic surfactant adsorption on pure montmorillonite relatively 1603
unimportant. Similarly as for kaolinite, adsorption of anionic surfactants to montmorillonite 1604
is complicated by surfactant precipitation when multivalent ions are present as counterions 1605
of the negative clay charge and by partial clay dissolution and precipitation phenomena as 1606
described for kaolinite. For instance, Yang et al. [201] have shown that the abstraction 1607
(adsorption + precipitation) of sodium dodecylbenzene sulfonate (SDBS) by 1608
montmorillonite was affected by the presence of Ca2+ ions. They observed that: (i) SDBS 1609
was abstracted significantly by montmorillonite saturated with Ca2+, but little by 1610
Na-saturated montmorillonite; (ii) the amount of SDBS abstracted by Ca-montmorillonite 1611
was enhanced by NaCl; and (iii) no significant intercalation of SDBS into 1612
Ca-montmorillonite was observed by X-ray diffraction analysis. Therefore the abstraction 1613
for the Ca-montmorillonite was largely due to surfactant precipitation with Ca released by 1614
ion exchange. 1615
1616
6.6 Cationic surfactant adsorption on montmorillonite 1617
The binding of cationic surfactants on montmorillonite is dominated by adsorption at the 1618
plate surfaces, therefore, for these surfactants adsorption in the interlayers plays an 1619
important role. The adsorption behavior at the external surface of montmorillonite will be 1620
similar to that on silica and/or kaolinite, but the adsorbed amount and the conformation of 1621
adsorbed molecules in the interlayer space are affected by the two neighboring surfaces and 1622
the distance between these surfaces (the interlayer distance). In fact one deals with 1623
adsorption in a narrow slit pore with the complication that the slit width increases step wise 1624
with increasing surfactant adsorption. The interaction between the platelet surfaces and, 1625
therefore, the interlayer distance, are affected by the surfactant adsorption and vice versa. In 1626
other words, the interlayer distance, the adsorbed amount of surfactant and the conformation 1627
68
of the adsorbed surfactant molecules are mutually related and this makes the adsorption 1628
behavior complicated. 1629
To unravel cationic surfactant adsorption in practice, next to information on the adsorbed 1630
amount, at least, also information is required on the interlayer distance and/or the 1631
conformation of the adsorbed surfactant molecules in the interlayer. Somewhat similar to 1632
Mehrian et al. [180], Pan et al. [202] measured C12TA+/C12TAB isotherms and adsorption 1633
enthalpies for Na- and Al-montmorillonites in a wide pH range; the results support the 1634
two-stage adsorption above the IEP. Very illustrative experimental results on the adsorption 1635
of hexadecyl-trimethylammonium (C16TA+ = HDTMA) on montmorillonite (Wyoming 1636
montmorillonite, SWy-1; CEC = 900 µmole/g) and kaolinite (Na-kaolinite, CEC = 40 1637
µmole/g at pH 6.5) are provided by Xu and Boyd [184, 203]. They studied the adsorption by 1638
combining adsorption isotherms, electrophoretic mobility, colloidal stability and X-ray 1639
diffraction to determine the effects of clay type and solution composition on the adsorption 1640
of cationic surfactants and to unravel the orientation and/or conformation of the adsorbed 1641
surfactants on the external and internal (interlayer) surfaces and the dispersion stability of 1642
surfactant-clay complexes. Some of their results are depicted in Figs. 24 and 25. Fig. 24 1643
shows the isotherms of C16TAC on three different clays; isotherms provide information on 1644
the total surfactant adsorption. With a single isotherm further information is required to 1645
make a distinction between the adsorptions on external and internal surfaces. The C16TAC 1646
adsorption isotherm on Ca-montmorillonite (Ca-SWy-1) follows the ‘normal’ isotherm 1647
pattern and is similar to that on Na-kaolinite (non-swelling), but the adsorption isotherm on 1648
Na-montmorillonite (Na-SWy-1) differs from the other isotherms with its peculiar S-shape 1649
at relatively low C16TAC adsorption (< 1CEC). The fact that the shape of the C16TAC 1650
isotherms on Na-kaolinite and Ca-SWy-1 are rather similar indicates that the swelling of 1651
C16TA/Ca-SWy-1 due to surfactant adsorption is negligible small. The peculiar S-shape of 1652
the of C16TA/Na-SWy-1 system with different adsorption values for one equilibrium 1653

69
concentration must be due to interlayer expansion due to surfactant adsorption. The 1654
behavior of the C16TA+/Na+-montmorillonite clay is further illustrated in Fig. 25 to 1655
provide proof for this behavior. 1656
The C16TA+/C16TAC isotherm on Na-SWy-1 (Fig. 25a) can be divided into four distinct 1657
regions. Region 1 (0-0.75 CEC) is non-monotonic and characterized by an equivalence of 1658
Na release and C16TA+ adsorption, resulting in superimposable C16TA+ adsorption and 1659
cation release curves. In regions 2 and 3, the adsorption isotherm is monotonic and the 1660
adsorbed amount of C16TA+/C16TAC is greater than the corresponding Na+ release; this 1661
implies that the head-on adsorption (ion exchange) slows down and the head-out adsorption 1662
increases (difference between the C16TA+/C16TAC and Na+ isotherms). The head-out 1663
adsorption is due to surfactant adsorption to already adsorbed surfactants by hydrophobic 1664
attraction between the surfactant tails. The slope of the C16TA+/C16TAC adsorption 1665
isotherm in region 3 is much larger than in region 2, which indicates cooperative adsorption 1666
in region 3. Moreover, the difference between the C16TA+/C16TAC and the Na isotherms 1667
increases strongly, indicating that head-out adsorption to already adsorbed surfactants 1668
increases much stronger than the ion exchange. At the CMC the C16TA+/C16TAC and Na 1669
isotherms reach a plateau (region 4). 1670
Fig. 25b shows the behavior of the electrophoretic mobility with increasing surfactant 1671
adsorption; it reflects the situation at the external surface of the clay. In region 1 Na+ 1672
exchanges for C16TA+, therefore it is to be expected that the electrophoretic mobility of the 1673
C16TA/Na-SWy-1 particles remains the same as for homoionic Na-SWy-1; this is indeed 1674
the case. In region 2 (0.75 CEC to 1.0 CEC) the net particle charge is relatively low; more 1675
C16TA+ is adsorbed than Na+ is released and the electrophoretic mobility increases rapidly, 1676
it passes the IEP (particle charge changes sign) and reaches a maximum value at 1CEC, the 1677
end of region 2. The fact that the IEP is reached before C16TA+ (ads) = CEC implies that 1678
the Na+ ions also contribute to the charge neutralization at the IEP. The fact that the 1679

70
mobility changes sign confirms that the surfactant adsorption is super-equivalent and this 1680
implies that beyond the IEP head-out adsorption by hydrophobic attraction starts. The 1681
mobility is very sensitive to changes in charge around the IEP where the particle charge is 1682
low, therefore the information in region 2 is directly related to the charge situation of the 1683
clay complex and provides valuable information. In region 3 the mobility decreases slightly 1684
and stays constant in region 4. Somewhat outside the IEP (zeta potentials > 50 mV) 1685
retardation and relaxation effects can easily lead to only small changes in mobility with 1686
particle charge [204]. Moreover, the changing particle (aggregate) sizes (see the stability) 1687
further complicate the situation. Therefore, further interpretation of the mobilities in regions 1688
1 and 3 or 4 is not feasible. 1689
The adsorption behavior at the external surface was further investigated by dispersion 1690
stability measurements (optical density of the clay suspension), see Fig. 25b. The degree of 1691
clay dispersion decreases with increasing surfactant adsorption till the IEP is reached. This 1692
is due to (i) the decrease of the net negative charge of the C16TA/Na-SWy-1 particles, so 1693
that the electrostatic repulsion between the particles decreases and (ii) at the same time the 1694
hydrophobicity of the particles increases because the surfactant tails point to the solution 1695
(ion exchange and head-on surfactant adsorption) and this increases the inter-particle 1696
(hydrophobic) attraction. The stability has a minimum around the IEP because the net 1697
particle charge is zero and the amount of unscreened surfactant tails pointing towards the 1698
solution is at its maximum, which makes the particles maximally hydrophobic. Beyond the 1699
IEP further C16TA+ adsorption in the head-out mode makes the C16TA+-SWy-1 particles 1700
positive and increases the particle hydrophilicity, together this results in a strong increase in 1701
the dispersion stability. 1702
In Fig. 25c d(001)-spacings obtained by X-ray diffraction are shown for water saturated, 1703
partially wet (dried at 95% relative humidity, RH), and dry (dried at 5% RH) 1704
C16TA+/Na+-SWy-1 as function of the C16TA+ adsorption. These results reflect the 1705

71
situation at the interlayer surfaces. The clays are nearly identical at high C16TA+ adsorption, 1706
but completely different at low C16TA+ loadings (< 1CEC). As the C16TA+ loading 1707
increased from 0.1 CEC to 0.75 CEC (region 1), the d-spacings of wet (100% RH) clay 1708
samples (C16TA+/Na+-SWy-1) increased gradually from 1.76 to 2.21 nm. No further change 1709
in the d-spacing was observed at higher C16TA+ adsorption. Partial air-drying (95% RH) or 1710
drying (5% RH) of the clays decreases the d-spacings and results in stepwise d-spacing vs. 1711
C16TA+ loading curves. At loading levels up to 0.3 CEC, the d-spacing was around 1.4 nm. 1712
The first step occurs between 0.3 and 0.5 CEC and raises the spacing to about 1.8 nm, the 1713
second step occurs at C16TA+ loadings of 0.5 to 0.8 CEC leads to a final d-spacing of about 1714
2.2 nm. The steps are sharp for the dry clay. The step-wise behavior of the d-spacing 1715
indicates that the conformation of the adsorbed surfactant ions changes stepwise. Confining 1716
the interlayer to lower values of the d-spacing by drying allows only specific surfactant 1717
conformations and sudden conformational changes result. However, at 100% RH the 1718
d-spacing increases gradually, therefore the capacity for surfactant adsorption increases 1719
gradually and the actual conformation of the adsorbed surfactant is more random than for 1720
the (partially) dried clays. 1721
With the C16TA/Ca-SWy-1 system and adsorption values of about 0.25 CEC to 0.8 CEC 1722
the d-spacing stays around 1.8 nm and then increases gradually with higher loadings to 2.16 1723
nm (not shown). The higher charge of the Ca2+ ions keeps the two interlayer surfaces better 1724
together and only close to C16TA+ adsorption values = 1CEC some swelling is observed 1725
and the isotherm has a similar shape as the C16TA+ isotherm to kaolinite. The peculiar 1726
shape of the C16TA+ isotherm for Na-SWy-1 and the ‘normal’ shape of the isotherm for 1727
Ca-SWy-1 is thus due to the fact that in the adsorption range 0-0.8 CEC swelling occurs for 1728
Na-SWy-1 and no swelling for Ca-SWy-1. Due to swelling and a concomitant change of the 1729
adsorption capacity in the case of the C16TA/Na-SWy-1 system different adsorption values 1730
can occur at one equilibrium surfactant concentration. 1731

72
When for the C16TA/Na-SWy-1 system the ionic strength is increased by increasing the 1732
NaCl concentration, the isotherms gradually change to the ‘normal’ shape at about 42 1733
mmol/L NaCl. At this ionic strength the d-spacing stays about constant up to 0.8 CEC. 1734
Around loadings close to the CEC the isotherms at different NaCl concentration intersect 1735
and after the intersection point (loadings larger than the CEC) the adsorption increases with 1736
increasing NaCl concentration. The residual water in the interlayer allows salt ions to enter 1737
the interlayer, and similarly as at the external surface, this leads to an increased screening of 1738
the lateral repulsion between the charged head-groups of super-equivalently bound 1739
surfactant ions and an increase in adsorption. For the same reason also surfactant 1740
counterions that partially associate with the surfactant ions increase the surfactant 1741
adsorption for loadings beyond the CEC. The NaCl concentration has little effect on the 1742
C16TA/Ca-SWy-1 system at C16TA+ loadings up to the CEC and after the CEC the 1743
behavior is similar to than of the C16TA/Na-SWy-1 system. 1744
Concluding, based on the results of Xu and Boyd [184] it follows that the swelling of 1745
expanding clays due to cationic surfactant adsorption depends on the strength at which the 1746
clay layers are held together. It is well known that the attraction between the clay layers 1747
depends on the degree of isomorphic substitution, the valence and size of the counterions of 1748
the clay charge and the ionic strength [205]. Therefore, also the swelling of clays due to 1749
cationic surfactant adsorption is depending on these variables. Swelling occurs when the 1750
surfactant isotherm shows a peculiar S-shape for surfactant loadings up to 0.8 CEC; the 1751
adsorption capacity is a function of the adsorbed amount and this makes it possible that 1752
different adsorption values may occur at one equilibrium surfactant concentration. The 1753
surfactant adsorption at the external surface of expanding clays shows a very similar 1754
behavior to that at kaolinite. Up to loadings close to the IEP of the external particle surface 1755
(roughly corresponding with a loading approaching 1 CEC) the surfactant adsorption occurs 1756
by ion exchange and head-on adsorption. Beyond the IEP of the external surface (or 1757

73
loadings ≥1 CEC), adsorption of the surfactant by hydrophobic attraction starts and this 1758
adsorption increases strongly with further surfactant loading. The adsorption beyond the 1 1759
CEC increases with increasing ionic strength and is sensitive to the kind of surfactant 1760
counterion. The clay stability is strongly affected by this adsorption behavior. The minimum 1761
dispersion (colloidal) stability occurs at the IEP of the external surface where the net 1762
particle charge is zero and the hydrophobicity of the particles is at its maximum due to the 1763
unscreened surfactant tails protruding into the solution. The results of Xu and Boyd are 1764
largely supported by Tahani et al. [206] who investigated the adsorption of the 1765
benzyldimethyl dodecyl ammonium chloride on a Na-montmorillonite by various 1766
techniques. 1767
An interesting complementary study, specifically oriented towards the structural 1768
characteristics of the surfactant adsorbed in clay interlayers, has been presented by Zhu et al. 1769
[207] who studied the interlayer aggregates of C16TA+/C16TAB in a bentonite (> 95% pure 1770
montmorillonite, < 5% quartz; CEC 1084 µmole/g) for different surfactant loading levels 1771
(0.20 CEC to 2.56 CEC), using in situ X-ray diffraction (XRD) and Fourier Transform Infra 1772
Red (FTIR) spectroscopy on samples in the hydrated state. For the dried and hydrated 1773
organo-bentonites, the measured basal spacings depended on surfactant loadings and 1774
indicated that the water molecules present play an important role in regulating the 1775
microenvironment, even at high surfactant loads. In the presence of water the surfactant 1776
tails formed aggregate structures in the interlayer space due to hydrophobic attraction. As a 1777
result, the values of the d001 spacing increased gradually with increase in surfactant loading. 1778
In situ FTIR spectra indicated that the surfactant intercalated at high loading had a more 1779
ordered and compact structure than the associates at low surfactant sorption density: the 1780
surfactant state in wet organic bentonites changed from a liquid-like (disordered) state to a 1781
solid-like (ordered) state. 1782

74
Based on the FTIR results, the XRD data, and the dimensions of the C16TAB surfactant 1783
in moist organo-bentonites with different surfactant loading, Zhu et al. proposed that 1784
C16TA+/C16TAB arrangements in wet organo-bentonites were different from that in dried 1785
organo-bentonites. For the wet organo-bentonites the interlayer spacing around 0.2 CEC is 1786
1.02 nm and the C16TA+ ions lie about parallel to the silicate interlayer surfaces. Then a 1787
smooth step in the interlayer spacing occurs and at 0.4 to 1.2 CEC the spacings of 2.0 - 2.5 1788
nm are roughly the length of C16TA+. Therefore, a possible arrangement could involve the 1789
C16TA+ head groups being adsorbed on the two interlayer surfaces and the ‘interfingered’ 1790
long alkyl chains roughly perpendicular to the interlayer surfaces. When the loading level 1791
further increases (1.2 to 2.6 CEC), a next smooth step in interlayer spacing occurs to about 1792
3.3 nm and the C16TA+ ions (ion exchanged) and C16TAB molecules (hydrophobically 1793
attracted) form a partly ‘interfingered’ admicellar type layer. With these surfactant 1794
conformations at loadings > 0.4 CEC the surfactant phase in the interlayer is divided into 1795
three regions: region 1 and 3 are adjacent to the two interlayer surfaces, each extending to 1796
about 0.5 nm from the surface, containing H2O, surfactant head groups and, if loaded in 1797
excess of the CEC, also the surfactant counterions (Br-), and region 2 with a thickness of 1798
about 2 nm in the center of the interlayer space, containing the aggregated tails of the alkyl 1799
chains and residual water. The total structure is bilayer-like and/or resembles flattened 1800
admicelles. The core region with the tails becomes more aliphatic and less aqueous as the 1801
surfactant loading increases from 0.40 to 2.6 CEC. With increasing surfactant loading the 1802
core region becomes more hydrophobic, but induced steric hindrances increase and the 1803
space left for ad-solubilization decreases; therefore, the partitioning of organic contaminants 1804
shows a maximum around loading levels of 1 CEC. This maximum corresponds roughly 1805
with the maximum hydrophobicity of the surfactant layer at the external surfaces of the clay 1806
around loadings of 1 CEC, but the structure of the external surfactant layer is rather 1807

75
different (head-on monolayer type and/or teepee-like micelles) from that in the interlayer 1808
(flattened admicelle-like). 1809
The specific behavior of surfactant adsorption in confined space has also been 1810
investigated theoretically by Molecular Dynamics studies. Initially these studies modeled 1811
dry organo-clays [177, 208-210] but in later studies water was included in the simulations 1812
[211, 212]. The latter are most relevant with respect to understanding the adsorbed 1813
surfactant conformations in the interlayer space. The introduction of the paper by Liu et al. 1814
[178] provides a brief overview of the history of MD calculations on organo-clays and the 1815
force fields used; in that of Zhou et al. [213] the most relevant experimental results and the 1816
recent MD simulations are mentioned. Liu et al. [178] discuss the structure and dynamics of 1817
alkylammonium-intercalated wet SWy-type montmorillonite with emphasis to the alkyl 1818
chain length; the paper is complementary to the recent paper of Zhou et al. [213], which will 1819
be discussed here. The study of Zhou et al. [213] on C16TA+/C16TAB intercalated 1820
Ca-montmorillonites (Mt) in the water-saturated condition largely mimics the experimental 1821
system of Zhu et al. [207] discussed above, and provides a good illustration of the 1822
information that can be gained by MD simulations. 1823
The simulation results of Zhou et al. [213] show that, as the surfactant adsorption on 1824
montmorillonite (CEC 1060 µmol/g) increases, the arrangement of C16TA+/C16TAB 1825
transforms from flat bilayer-type to inclined paraffin-type with a large amount of water in 1826
the interlayer space. This configuration is different from that in dry systems; for dry samples 1827
the surfactant conformation changes from monolayer to bilayer and to pseudo-trilayer as 1828
surfactant loading increases [171, 175]. Compared to the dry models, the percentage of 1829
gauche conformations of C16TA+ decreases in the water saturated condition. The head 1830
groups of C16TA+ are located close to the centers of the six-member rings of the silicate 1831
surfaces and coordinated with 4–6 water molecules. Their mobility is low due to the 1832
electrostatic interactions, while the alkyl chains show a higher mobility. Montmorillonite 1833

76
with a high CEC (1310 µmol/g) has a stronger confining effect on both C16TA+/C16TAB 1834
and water, which reduces the mobility of alkyl chains and water molecules within the 1835
interlayer space. 1836
A general impression of the surfactant conformations in the interlayer space as function 1837
of surfactant loading is provided by the density distributions for ammonium N, alkyl C, 1838
Ca2+, Br− and water O [213]. The calculated density distributions for montmorillonite with a 1839
CEC of 1060 µmole/g are depicted in Fig. 26 for different loading levels relative to the CEC 1840
as indicated in the figure. Corresponding snapshots of C16TA+ intercalated in the interlayer 1841
that further visualize the distribution are presented in Fig. 27. For Mt-0.25CEC-1nm (= 1842
montmorillonite with a C16TA+/C16TAB loading equal to 0.25 CEC and an interlayer 1843
spacing of about 1 nm) both ammonium N and alkyl C are arranged in two layers according 1844
to the two clear peaks of the density distributions, indicating a bilayer structure, see Figs. 1845
26a and 27a. As the surfactant loading level increases (Mt-0.5CEC-2nm; Figs. 26b and 27b), 1846
the density distribution of ammonium N remains two peaks close to the silicate surface due 1847
to the strong electrostatic attraction between the negative charge site and the cationic 1848
ammonium N. The distribution of alkyl C is rather different from that at 0.25 CEC, it 1849
transforms to one broad peak in the center and the arrangement of alkyl chains is inclined to 1850
the Mt surface. In these two incomplete cation exchange cases Ca2+ displays a symmetrical 1851
distribution with ammonium N to balance the residual negative charge. Ca2+ plays no role 1852
for surfactant loadings > 1.0 CEC, but in this case the negative surfactant counterion (Br-) 1853
comes into play. For Mt-1.0CEC-2.2nm (Figs. 26c and 27c), the situation is similar as for 1854
Mt-0.5CEC-2nm, but more pronounced. The broad central peak of alkyl is larger, indicating 1855
strong association of the alkyl chains in the interlayer space; the arrangement of alkyl chains 1856
is still inclined to the Mt surface. In the excessive surfactant loading case (Mt-2.0CEC-3nm; 1857
Figs. 26d and 27d), most N is still close to the surfaces, but part of N is distributed over the 1858
core of the interlayer. The N distribution is roughly paralleled by the Br distribution, but 1859

77
close to the surface N and Br occupy separate layers. The magnitudes of the N and Br peaks 1860
close to the surface indicate that a large part of head groups that did not participate in the 1861
ion exchange is also located close to the surface. The small peaks of ammonium N in the 1862
interlayer space are balanced with Br in the core of the interlayer space. The alkyl chains are 1863
connected closely, reflecting the association by hydrophobic attraction. In all cases, the 1864
density of water near the Mt surfaces is somewhat higher than in the center, which is 1865
probably related to the hydration of the accumulated ions and ammonium head groups close 1866
to the surface. The hydrophilicity of the interlayer surfaces is somewhat questionable, 1867
because a siloxane surface without charge is fairly hydrophobic. The density distributions of 1868
interlayer species for Mt with a high CEC (1310 µmol/g) are in most cases similar as those 1869
shown here. However, for the Mt-0.25CEC-1nm system, the alkyl C forms several peaks 1870
near the center of the interlayer space instead of two peaks. The ammonium head groups 1871
close to the surface cause most likely obstruction of the orientation of the alkyl chains 1872
parallel to the surface. To sum up, under the water saturated condition and low surfactant 1873
loading the surfactant alkyl chains are oriented roughly parallel to the surface; at loadings ≥ 1874
0.5 CEC alkyl chains are concentrated in the center of the Mt interlayer space and most 1875
head groups are close to the surface. The calculated results are consistent with the 1876
experimental results of Zhu et al. [207] and the density profiles are subtler versions of the 1877
schematic models suggested by Zhu et al. 1878
An alternative way of modeling surfactant binding from aqueous solutions in confined 1879
space is by Self-Consistent Field calculations with the SCFA model [214-217]. With the 1880
SCFA model surfactant isotherms can be calculated for two surfaces at a given distance and 1881
the interlayer spacing can only be changed by discrete step of about the diameter of a water 1882
molecule; simultaneous with the adsorption isotherm the interaction force between the two 1883
surfaces can be calculated. Calculations made [214-217] have not addressed the specific 1884
clay-surfactant systems, but some knowledge of the obtained results is still useful for a 1885

78
better understanding of the complications that occur with surfactant adsorption in confined 1886
space. For charged hydrophilic surfaces the SCFA calculations have provided insight in the 1887
adsorption behavior below and above the charge compensation point [214, 215]. The 1888
confined space drives the adsorbed surfactant layer toward a structure similar to that 1889
obtained at the charge compensation point. At solid-solid separations where the surfactant 1890
layers on each surface begin to merge with each other (proximal adsorption), there is a 1891
confinement-induced phase transition leading to complex adsorption and interaction 1892
behavior at very small separations. In addition, calculations show that the interaction 1893
between surfactant tails is a key contributor to both the magnitude of proximal adsorption 1894
and the exchange between surfactant and co-ions at the surface. For (charged) hydrophobic 1895
surfaces [216, 217] a first-order phase transition takes place when the slit width approaches 1896
the thickness of the two surfactant layers; the transition is driven by the unfavorable 1897
hydrophobic-water contacts. At the transition, the average orientation of the surfactants 1898
switches from a high concentration of tails at the surface and head groups in the center to a 1899
bilayer configuration where the tail profiles from both sides merge in the center and the 1900
head groups are in the vicinity but slightly away from the surface. For more information the 1901
original papers should be consulted. 1902
1903
6.7 Nonionic surfactant adsorption on montmorillonite 1904
Similarly as with cationic surfactants the binding of nonionic surfactants on 1905
montmorillonite is dominated by adsorption at the plate surfaces, therefore, also for these 1906
surfactants adsorption in the interlayers plays an important role. Detailed results on the 1907
adsorption of nonionic surfactants on montmorillonite at low surfactant concentrations are 1908
scarce; recent results mainly concentrate on concentrations around and above the CMC 1909
because the interest is on preparation of organo-clays made with nonionic surfactants. 1910
Rheinländer et al. [218] have investigated C12(EO)8 on four different clays 1911

79
(Na-montmorillonite = Na-Mt, Ca-bentonite (95% montmorillonite) = Ca-Mt, Na-kaolinite 1912
and Na-illite) based on adsorption isotherms and for the swelling clay minerals (Na-Mt and 1913
Ca-Mt) microcalorimetry and X-ray diffraction. The measured isotherms were presented as 1914
double logarithmic plots that are reproduced in Fig. 28. The isotherm on Na-kaolinite runs 1915
below that on Na-illite, and both isotherms (mmol/g) are clearly below those on the swelling 1916
minerals. However, when the adsorbed amount is expressed per m2 the maximum adsorption 1917
values on the Na-clays are similar and about twice as high as that on Ca-Mt. The isotherms 1918
for Na-Mt and Ca-Mt are similar; however, the adsorption for Ca-Mt is stronger at low 1919
concentrations than that of Na-Mt, but at high concentrations the situation is reversed 1920
(maximum adsorptions Na-Mt and Ca-Mt, respectively, 0.94 and 0.35 mmol/g). A greater 1921
(exothermic) initial differential molar enthalpy (heat) of adsorption confirms the higher 1922
affinity of C12(EO)8 for Ca-Mt than for Na-Mt. The heat of adsorption of the two clays 1923
decreases about linearly with surfactant loading and becomes zero above 0.26 mmol/g, which 1924
is below the adsorption maximum of the two clays. The behavior of the heat of adsorption 1925
indicates two steps in the adsorption process: (i) adsorption due to interaction with the surface 1926
and (ii) adsorption by mainly hydrophobic attraction with already adsorbed surfactant. The 1927
observations that zero heat of adsorption to Ca-Mt and Na-Mt is reached at the same loading 1928
(mmol/g), but that the maximum amounts adsorbed are rather different indicates that the 1929
second adsorption step is larger for Na-Mt than for Ca-Mt. Although the adsorption process 1930
contains two steps, the shape of the log-log isotherms indicates that there is no critical surface 1931
association concentration (CSAC), all isotherms show a gradual increase in adsorption and 1932
the slope is of the isotherms is always ≤ 1. Therefore, the transition of the first to the second 1933
adsorption process is gradual. This is the case for all four clay samples studied. 1934
The X-ray diffraction results showed that the basal (d001) spacing of pure air-dried 1935
Na-Mt of about 1.25 nm differed significantly from that of Ca-Mt of 1.5 nm due to stronger 1936
hydration of the Ca2+ than of Na+. The basal spacing of Na-Mt with surfactant goes from 1937

80
1.25 nm to 1.4 nm for 0.1-0.35 mmol/g and to about 1.8 nm for higher adsorption values. 1938
For Ca-Mt the spacing changes from 1.5 to 1.8 nm between 0.2 and 0.3 mmol/g. These 1939
values are for both swelling clay minerals indicative of the formation of flat-lying 1940
C12(EO)8 molecules in the first adsorption step and of the formation of a ‘flat’ bilayer 1941
structure in the second adsorption step. As the spacings are derived from air-dried samples, 1942
the distances will be likely different in the water saturated situation (and therefore the 1943
surfactant conformation), but the two steps in the adsorption process are reflected in the 1944
measured values. The stronger hydration of Ca2+ than of Na+ has, most likely, also caused 1945
the higher affinity of C12(EO)8 for Ca-Mt than for Na-Mt. 1946
Sonon and Thompson [219] investigated the adsorption of C12(EO)<23> (=Brij 35; the 1947
notation <n> indicates that the EO chain length is polydisperse) on two smectites (Wyoming 1948
montmorillonite and Panther Creek smectite) that were brought in the K and Ca form. For 1949
both smectites the adsorption affinity and adsorption plateau were somewhat larger for the 1950
Ca-smectite than the K-smectites. The d001 values of both air-dried K-saturated smectites 1951
increased in two steps from 1.11 nm to about 1.7 nm as more surfactant was sorbed, while 1952
the d001 spacing of the air-dried Ca-smectites increased gradually from 1.47 nm to about 1953
1.7 nm. These results confirm those of Rheinländer et al. [218]. 1954
Backhaus et al. [220] continued the work of Rheinländer and investigated the adsorption of 1955
the octylphenol poly(ethylene oxide)s [(C8Φ(EO)<n>], TX100 (<n> = 9.5), TX-165 (<n> = 1956
16) and TX-305 (<n> = 30), on Ca-Mt and silica. Note that the hydrophobic character of a 1957
C8Φ group is very similar to that of a C12 group. The adsorption isotherms of 1958
C8Φ(EO)<9.5> (= TX100) on Ca-Mt at pH 4 and pH 9 in 10-2 mol/L CaCl2 showed only 1959
small differences, which indicated that the share of the edge surfaces to the surfactant 1960
adsorption on Ca-Mt is small. Furthermore, the affinity (measured by the initial slope of the 1961
isotherm) of C8Φ(EO)<9.5> at pH 4 to Ca-Mt was higher than that on silica, which point to a 1962
different binding mechanism. With silica the EO segments mainly bind to the silanol groups 1963
81
by H-bonds, but with expanding layered silicates these groups are hardly present and the 1964
binding mechanism is most likely H-bonds with the hydration water of the bound counterions 1965
on the clay surfaces. The interlayer spacings of Ca-Mt with adsorbed C8Φ(EO)<9.5> in the 1966
dried and moist state show a similar behavior as in the case of C12(EO)8 [218], but the 1967
spacings for the moist sample are even at the largest adsorption values considerably (2nm) 1968
larger than the spacings of the air-dried sample. This indicates again that in aqueous solution 1969
the interlayer spacings will be different from that of the air-dried samples. 1970
The isotherms (non-logarithmic) of the three surfactants (TX100, TX-165, TX-305) [220] 1971
were all L2-type [221], i.e. a steep rise towards the maximum adsorption. For TX-100 1972
adsorption on montmorillonite or bentonite the L2 type isotherm has also been observed by 1973
[218, 222, 223]. Somewhat above the CMC the isotherms show a plateau that decreases with 1974
increasing EO head group length. The fact that the plateau adsorption is reached beyond the 1975
CMC is due to the fact that head group polydispersity leads to a relatively low CMC and a 1976
maximum adsorption at relatively high concentration [224]. The lack of the S-shaped course 1977
and thus of cooperative effects suggests that, unlike in the case of silica gel, no aggregate 1978
formation took place on the surface at low surfactant concentrations. This behavior is to be 1979
expected when the affinity of the surfactant molecules to the surface (hydrated Ca ions) is 1980
greater than the hydrophobic attraction between the surfactant molecules. With the relatively 1981
small interlayer spacing, the second step caused by hydrophobic attraction will be largely 1982
lateral (tail-tail) attraction. For steric reasons the lateral hydrophobic attraction decreases by 1983
the head group size and this explains the decreasing plateau adsorption with increasing head 1984
group size. 1985
A decrease in the adsorption with increasing head group size for a given alkyl chain length 1986
has also been observed by Shen [225] who measured the adsorption of C9(EO)<10>, 1987
C9(EO)<20> and C18(EO)<20> (= Brij 78) on bentonite at pH 6-7 and 0.01 M NaCl. 1988
Doubling the alkyl chain length at a given degree of ethoxylation increased the adsorption 1989

82
maximum also but the effect was much smaller than that of doubling the head group size, 1990
especially when the adsorption was expressed as mmol/g. Deng et al. [226] who studied the 1991
adsorption of C16(EO)<10> (= Brij-56) and C9Φ(EO)<12> (= Igepal-CO720) on 1992
Ca-bentonite found somewhat larger adsorption for the surfactant with the smaller head 1993
group in line with the results of Shen [225]. However, the proposed surfactant conformation 1994
for the freeze-dried composites with EO segments in the interlayer and the alkyl chains 1995
sticking-out in air, is highly unlikely for water saturated samples and for the situation of the 1996
intercalated smectite in contact with an aqueous surfactant solution, because in this case 1997
hydrophobic attraction comes into play and the proposed conformation would lead to many 1998
unfavorable CH2-water contacts which can be avoided when the alkyl chains associate in 1999
the interlayer space. Therefore, it is to be expected that with adsorption from solution the 2000
conformation will be somewhat similar to that of cationic surfactants in the interlayer as 2001
described in the previous section. 2002
To unravel the EO binding mechanism and the EO chain conformation of intercalated 2003
polymeric nonionic surfactants Deng et al. [198] also investigated the intercalation of 2004
bentonites (with different cations) by: C16(EO)<10> (= Brij 56), C18(EO)<100> (= Brij 700), 2005
C2(CH2-CH2)<15>(EO)<40> (= polyethylene-polyethylene oxide or PE-PEO) and 2006
(EO)<76> (= PEO). The surfactants and the organo-bentonites were characterized with X-ray 2007
diffraction (XRD) and Fourier transform infrared (FT-IR) spectroscopy. The surfactants 2008
intercalated the bentonite and expanded the d001 spacing of the freeze-dried samples to nearly 2009
1.8 nm. The shapes and positions of the IR bands of interlayer surfactants resembled 2010
amorphous PEO. The EO segments of the surfactants were arranged in a distorted and 2011
extended form in the interlayer, instead of in the favored helical conformation of the 2012
crystalline state. The shifts of the C–O–C stretching bands of the intercalated surfactants 2013
pointed to H-bonding of the EO oxygen atom with water in the hydration shell of the 2014
exchangeable cations, or to direct coordination or ion–dipole interaction between the 2015

83
exchangeable cations and the oxygen atoms. The type of exchangeable cations (Na+ , K+ , 2016
Ca2+ , Mg2+ , Cu2+ , Ni2+ , H+) in the interlayer of smectite did not affect the conformation of 2017
the EO chain of the intercalated surfactants. These results give valuable information on the 2018
binding mechanisms and indicate clearly that the (EO)<n> conformations in the interlayer of 2019
the freeze-dried samples are more disordered than in the crystalline state. However, as 2020
indicated above, in the case of water-saturated samples the conformation of the EO chains is 2021
likely more random and affected by the presence of the apolar segments in the interlayer, 2022
because the apolar segments will locally associate due to hydrophobic attraction and not 2023
protrude into the aqueous solution. 2024
The studies by Guégan [227, 228] on the intercalation of C10(EO)3 in the interlayers of 2025
Ca- and Na-montmorillonite (SWy-2) also deserve some attention because this surfactant 2026
easily forms in solution somewhat above the CMC a lamellar phase that consists of the 2027
stacking of molecules by hydrophobic attraction and it is well known that relatively small 2028
Cn(EO)m surfactants with m<n, such as C12(EO)6, adsorb on silica with a condensation 2029
step just before the CMC in a bilayer arrangement [153, 164]. With Ca-Mt the adsorption 2030
isotherm of C10(EO)8 was high affinity with a pseudo plateau reached at about the CMC. 2031
X-ray diffraction and FT-IR measurements on samples dried at 70 oC indicated an 2032
expansion of the basal spacing to 1.7 nm and adsorption in two adsorbed monolayers 2033
parallel to the clay surface [227]. In a subsequent study [228] intercalation of Na-Mt by 2034
C10(EO)3 was investigated, the Na-Mt suspension was well swollen and showed a stable 2035
hydration state in which silicate layers were widely expanded and already opened when the 2036
surfactant solution was added, thus allowing an easier adsorption. Moreover initial solution 2037
concentrations of C10(EO)3 were selected that where several times the CMC which already 2038
displayed the Lα-lamellar phase. The adsorption values that where reached were similar and 2039
somewhat higher (40%) than those in the Ca-Mt system. The results obtained with small 2040
angle X-ray scattering and with FT-IR (samples dried at 70 oC) however revealed d001 2041

84
spacings from 1.1 nm for Na-Mt and 3.8 nm for the loaded samples and in the interlayer 2042
space a well-ordered surfactant bilayer, with a structure similar to that of the lamellar phase. 2043
The X-ray diffraction patterns further indicated that the C10E3 molecules were not 2044
aggregated on the external clay surfaces. Although the translation of these results to the 2045
surfactant conformations that are adopted with adsorption from solution is not straight 2046
forward, it seems plausible that a kind of bilayer with a hydrophobic core in the interlayer 2047
space might also be possible with simple C10(EO)3 adsorption. Calculations with the SCFA 2048
model might provide further insight; calculations for nonionic surfaces have been made 2049
before [152, 153, 165] and can be extended to adsorption in a confined space as has been 2050
done for ionic surfactants [214-217]. 2051
2052
7. Surfactant adsorption modeling 2053
7.1 General remarks 2054
Surfactant adsorption isotherms have been qualitatively and (semi-) quantitatively 2055
interpreted using several adsorption models, ranging from the Langmuir equation to very 2056
sophisticated models. For a review of the models used to describe surfactant adsorption, 2057
including those specifically designed for surfactant adsorption to solid-liquid interfaces, the 2058
reader is referred to [25], where also references can be found. Here some classical models 2059
are briefly discussed in relation to surfactant adsorption. In general two types of modeling 2060
can be distinguished, (i) mean-field models in which the adsorbed layer is assumed to be 2061
smeared-out homogeneously over the surface and (ii) aggregation models in which the 2062
surfactants are adsorbed as aggregated, micellar type structures. Simple examples of the 2063
first category are the Langmuir-, the Frumkin-Fowler-Guggenheim- and the Freundlich 2064
-equation;. examples of the aggregate models are the Hill- and the Gu-equation. 2065
2066
7.2 Mean-field models of monocomponent solute adsorption 2067
85
The famous Langmuir model applies to sorption from an ideally dilute solution of 2068
non-interacting molecules on homogeneous binding sites. The binding sites should be 2069
attached to particles, but the geometry of the particles and precise location of the sites is not 2070
relevant, only the homogeneity of the sites is important. The Langmuir (L) Eq. can be 2071
written as: 2072
(1) 2073
where θ is the fraction of the sites covered with the adsorbate, c the equilibrium 2074
concentration and K the equilibrium affinity constant accounting for all types of interactions 2075
with the sites. Preferably, the concentration, c, is expressed as normalized concentration, 2076
i.e., with respect to a chosen standard state: c = c’ / c*, therefore, as both c’ and c* should 2077
have the same units, c is dimensionless. When the concentration c’ is expressed in mol/L a 2078
convenient standard state is c* = 1 mol/L. For a good understanding of the obtained 2079
parameter values the standard state should be indicated. In the case of a normalized 2080
concentration also the affinity constant K is dimensionless and can be expressed as a 2081
Boltzmann factor containing the standard molar Gibbs energy of adsorption: K = 2082
exp(-∆G0/RT), the surface covered with water (considered as a continuum) is taken as the 2083
standard state for the energy difference, R is the universal gas constant and T the absolute 2084
temperature. The site coverage can be expressed as the covered amount of sites divided by 2085
the total amount of sites, or, as is done most often in practice, the adsorption, Γ, divided by 2086
the maximum adsorption, Γm, and in that case the L-equation becomes 2087
(2) 2088
As the L-eq. applies to ideal sorption it will, in general, not be able to describe surfactant 2089
adsorption, but when it does, the obtained parameters K and Γm are conditional, that is to 2090
say, depending on the conditions of the experiment (surfactant concentration range and 2091
environmental conditions). Literature examples of reasonable fits of the L-eq. for surfactant 2092

86
adsorption are mostly based a limited surfactant concentration range around the CMC where 2093
the plateau adsorption is reached. 2094
The Frumkin-Fowler-Guggenheim (FFG) equation is an extension of the L-eq. in which 2095
lateral interaction between the adsorbed molecules is taken into account; it can be written as 2096
(3) 2097
where b is a dimensionless lateral interaction parameter: with the 2098
standard Gibbs energy of lateral interaction. This equation is more realistic for surfactant 2099
adsorption than the L-eq. because next to the interaction with the surface (K), the lateral 2100
hydrophobic attraction is included explicitly; the parameter b can be expressed as linearly 2101
dependent on the alkyl chain length. In many studies of surfactant adsorption FFG-type 2102
models have been used to qualitatively understand the role of surface-surfactant attraction 2103
as compared to the lateral hydrophobic attraction. 2104
When the binding sites are heterogeneous and randomly or regularly mixed the 2105
adsorption isotherm can be obtained by solving the integral adsorption equation that 2106
contains both the local isotherm for binding on equal energy sites and the heterogeneity 2107
distribution. A Freundlich-type isotherm equation is obtained when the local isotherm is 2108
L-type and the heterogeneity distribution is given by a quasi-Gaussian distribution function 2109
[57]: 2110
(4) 2111
where is the median value of the affinity and p (0 < p ≤ 1) is a measure of the width of 2112
the distribution, for p =1 the surface is homogeneous. The quasi-Gaussian distribution 2113
function is called ‘Sips-distribution’ after Sips [229, 230] who derived Eq. 4. Eq. 4 is called 2114
the Langmuir-Freundlich equation, for p = 1 it reduces to the L-eq.. Because of the presence 2115
of an exponent in the equation the use of a dimensionless solute concentration is a must, it 2116
makes the interpretation of K possible. For sorbed amounts much lower than Γm Eq. 4 2117

87
reduces to the common Freundlich equation, , where K* is a 2118
composite parameter that can be indicated as the effective affinity constant; it has the same 2119
dimension as Γ, (provided c is normalized) but information on Γm cannot be obtained. 2120
Freundlich type equations are more ‘flexible’ than the L-eq.; therefore, they have been 2121
mainly applied when the L-eq. did not fit the results well. The interpretation of the obtained 2122
parameters is however not so easy. Below we return to this aspect. 2123
So far electrostatic interactions are not considered explicitly; in mean-field models these 2124
interactions can be formally introduced in the mentioned models by replacing the 2125
(normalized) equilibrium concentration of solute by the equilibrium solute concentration 2126
adjacent to the adsorption site: 2127
(5) 2128
where cs is the solute-ion concentration at the location of the binding site, cb the normalized 2129
equilibrium solute concentration in the dilute bulk solution, the Boltzmann factor accounts 2130
for the smeared-out electrostatic interaction at the location of the binding sites (mostly the 2131
surface) that the solute ion experiences, z is the valence of the solute ion and ψs is the 2132
electrostatic potential at the location of the site. The value of cb can be multiplied by the 2133
activity coefficient calculated with, for instance the Debye-Hückel or Davis model [231], 2134
when the ionic strength is such that activity corrections are necessary. 2135
A problem with Eq. 5 is that mostly no adequate information is present on ψs. For low 2136
and moderate ionic strength values the zeta-potential, obtained with one of the 2137
electrokinetic methods [204], can be used as approximation for ψs. Alternatively, a model 2138
can be used that the relates the particle charge to ψs, For flat surfaces and not too high 2139
surface potentials the Debye-Hückel model can be used [79], it relates ψs to the total (net) 2140
surface charge density, σt (C/m2): 2141

88
(6) 2142
where κ is the inverse Debye length, ε0 the permittivity in vacuum and εr the relative 2143
permittivity of water. The value of κ is determined by the ionic strength of the solution, at 2144
room temperature and a z-z electrolyte of concentration cz 2145
(7) 2146
Substitution of Eqs. 5-7 in Eq. 3 provides an equation that explicitly takes into account the 2147
specific interaction with the surface, the electrostatic interactions both with the surface and 2148
in the adsorbed layer and the lateral interactions: 2149
(8) 2150
where use has been made of the fact that the total (net) particle charge density 2151
with σp the primary surface charge density and the charge 2152
density contribution due to the ionic solute adsorption. This type of equation can be used to 2153
explain the presence of a common intersection point (CIP) of ionic surfactant isotherms 2154
measured at different ionic strength values. At the CIP the electrostatic interaction vanishes, 2155
as there is no effect of the salt concentration on the adsorption. This must mean that 2156
, i.e., the adsorbed surfactant charge just compensates the primary 2157
surface charge. For concentrations below the CIP the primary particle charge dominates and 2158
an increase in ionic strength (increase in κ) decreases the electrostatic surface-surfactant 2159
attraction, therefore the adsorption decreases with increasing ionic strength. For 2160
concentrations beyond the CIP the surfactant adsorption dominates the electrostatic 2161
interaction and with an increase in ionic strength the repulsion between the charged 2162
surfactant head groups decreases, therefore the adsorption increases with increasing ionic 2163
strength. From the above equations Eq. 8 is best equipped to understand qualitative or 2164

89
(semi)-quantitative ionic surfactant adsorption behavior. Eq. 8 is a FFG-type equation this 2165
can be shown by regrouping the various terms: 2166
(9) 2167
where and . Eq. 9 shows that 2168
when the electrostatic interactions are not explicitly considered with ionic surfactant 2169
adsorption and the simple FFG- Eq. (3) is applied, that both the affinity and the lateral 2170
interaction parameter contain an electrostatic contribution. Further extensions of Eqs. 3, 6, 8 2171
and 9 are discussed in [232, 233]. 2172
Ionic surfactant adsorption is often at least partly due to ion exchange and/or 2173
accompanied by adaptation of the primary surface charge. None of the above equations 2174
considers the multicomponent nature or the competition. This implies that when the 2175
equations are applied in practice they are conditional, or stated differently, the fitted 2176
parameters are no longer adequate when the concentration of the competing ion (e.g., H+ or 2177
OH-) is changed. This can be illustrated by using the multicomponent Langmuir equation: 2178
(10) 2179
where is the conditional affinity, which is only constant at constant c2. Eq. 10 is also 2180
Langmuir-type but it provides information on how changes with changing conditions. A 2181
condition for the application of Eq. 10 is that Γm should be the same for both components; 2182
otherwise also the stoichiometry of the exchange has to be taken into account. 2183
With ionic surfactants and charged surfaces adsorption is often a two-step process. The 2184
first step is binding to the charged surface, where some kind ion exchange and lateral 2185
hydrophobic attraction play a role, and the second step is governed by hydrophobic 2186
attraction to already adsorbed molecules and lateral hydrophobic and electrostatic 2187

90
interaction in the second layer. With the above single layer models this distinction is not 2188
made, which implies that the second layer adsorption can only be due to lateral interaction. 2189
As a result the b parameter has a composite character, it accounts for both the layer-layer 2190
and the lateral hydrophobic attraction. A simple model that tries to avoid this problem is the 2191
FFG two-layer model of Mehrian et al. [180] in which not only the affinities for the first and 2192
second layer are different but also the lateral interactions, however the electrostatic 2193
interactions are not made explicit. The results of this model are discussed in the section on 2194
cationic surfactant adsorption to kaolinite. Scamehorn et al. [234] also used a two-layer 2195
FFG equation without treating the electrostatic interactions explicitly. With their parameter 2196
choice the affinity for the first and second layer differed, but the lateral interactions were 2197
assumed to be the same. With the chosen parameter values the model predicted a strong 2D 2198
phase transition at low surfactant concentrations and heterogeneity was invoked to explain 2199
the experimental isotherms. As explained above for the FFG-eq., also a two-layer FFG 2200
model, that does not treat electrostatics explicitly, is only suited for the description of 2201
experiments done at constant pH and constant salt concentration. 2202
2203
7.3 Aggregation models for monocomponent solute adsorption 2204
The second group of adsorption models starts with the Hill equation that describes the 2205
formation of homogeneous aggregates containing n solute molecules on Ns homogeneous 2206
binding sites: 2207
(11) 2208
where θn is the fraction of sites covered with n molecules, K is the affinity of the binding of 2209
1 molecule, Kn that of the n molecules, c the normalized solute concentration, the actual 2210
adsorption equals Γn, and the total (maximum) adsorption Γt is equal to nNs. The process of 2211
adsorption is cooperative because one adsorption step brings n molecules to a site, n is 2212

91
therefore also called the cooperativity parameter. The Hill-eq. reduces to the L-eq. for n = 1; 2213
isotherms for n >1 are somewhat S-shaped and the isotherm is steeper than the L-isotherm 2214
(positive cooperativity); for high n the steepness of the adsorption isotherm is large and 2215
close to a two-dimensional (2D) phase transition. It is also possible to derive the Hill-eq. for 2216
the situation that one molecule occupies n* sites (n*-dentate adsorption), so that on one site 2217
only 1/n* molecules are adsorbed. In this case n =1/n* or n < 1, i.e., for n =1/2 the 2218
adsorption is bidentate. For n <1 there is negative cooperativity and the isotherm is less 2219
steep than the Langmuir isotherm because it more difficult to find n* sites than 1 site. 2220
Instead of calling n the cooperativity parameter, n can thus also be called the stoichiometry 2221
parameter: n >1 more than 1 molecule per site, n < 1 more than 1 site required to adsorb 1 2222
molecule. 2223
It should be noted that the mathematical forms of the Hill-eq. and the 2224
Langmuir-Freundlich-eq. are identical; in terms of the Hill-eq. heterogeneity is a form of 2225
negative cooperativity, where adsorption becomes more difficult when the coverage 2226
increases. When the Hill-eq. or the LF-equation is applied in a practical situation the 2227
cooperativity parameter might therefore be affected by site heterogeneity, and the 2228
heterogeneity parameter by the cooperativity. 2229
Zhu and Gu [150, 151] have proposed an extension of the Hill-eq., they make a 2230
distinction between a first and second step in the adsorption process. In the first step solute 2231
molecules are bound to the sites and in the second steps these bound molecules act as nuclei 2232
for an aggregation step or positive cooperative adsorption. The adsorbed amount in the first 2233
state equals 2234
2235
that in the second state 2236

92
2237
and the total adsorption is obtained by summation of the two contributions 2238
(12) 2239
In these equations k is the ratio between the affinities of the first and second state, K the 2240
affinity of the second state, therefore, kK is the binding affinity for the first state. For k = 1 2241
the affinities for the first and the second state are equal, but the nuclei formation is initially 2242
stronger than the aggregation because there are more free sites than nuclei. For k >> 1 the 2243
isotherm is typical stepwise, the first step is pronounced at low concentration and the 2244
second step occurs at somewhat higher concentrations. The parameter n is in this case equal 2245
to the ratio of the first adsorption plateau over the second. For k <<1 the equation becomes 2246
similar to the Hill equation and the isotherm depicts one step. Eq. 12 is often called the 2247
Gu-equation, it is a very ‘flexible’ equation and regularly used to describe quantitatively the 2248
adsorption of both nonionic and ionic surfactants. 2249
In the case of ionic surfactants the description is conditional, because for each change in 2250
solution conditions (pH and ionic strength) new parameters are required. Moreover, the 2251
affinity for the first step is for ionic surfactants determined by both the specific and 2252
electrostatic interaction and lateral interactions, the parameter k accounts for the first two 2253
interactions, K for the lateral attraction. Ion competition for the surface sites is not 2254
considered. The affinity in the second step comprises the hydrophobic affinity for the nuclei 2255
and the lateral interactions; the latter contain for ionic surfactants not only the hydrophobic 2256
attraction but also the electrostatic repulsion. Part of the lateral interaction for the second 2257
step is however also incorporated in the value of n. It is therefore difficult to give a more 2258
detailed interpretation of the parameter values. The main advantage of the Eq. 12 is that a 2259
distinction can be made between the overall affinities for the first and the second step. 2260
93
When it is assumed that the adsorbed states are governed by the same electrostatic 2261
adsorption potential it is possible to incorporate the electrostatic interactions in the Gu-eq. 2262
in the same way as illustrated above for the FFG-eq., but this has not been done. 2263
Two sophisticated models for surfactant adsorption that take aggregation into account are 2264
that of Rudzinski et al. [235, 236] and Li and Ruckenstein [237]. The model by Li and 2265
Ruckenstein [237] is most advanced, it has much in common with the description of 2266
micellization of ionic surfactants but it also reflects the scaled particle theory used by 2267
Rudzinski et al. [235, 236]. Solvent molecules, surfactant monomers and two types of 2268
surfactant aggregates of various sizes cover the surface. The competition between the 2269
enthalpic and entropic contributions to the Gibbs energy in the adsorbed phase is 2270
responsible for the composition of the adsorbed phase; the standard Gibbs energy change in 2271
going from the solution to the surface aggregates is calculated by considering five 2272
contributions: hydrophobic, conformational, electrostatic, steric and interfacial. The 2273
electrostatic contributions are treated within the framework of the Poisson-Boltzmann 2274
equation for flat plates. The model can well predict the four-region isotherms, but no 2275
predictions have been made of ionic strength effects. 2276
2277
7.4 SCFA model for surfactant adsorption 2278
The SCFA or Self-Consistent-Field theory for Adsorption model is a sophisticated 2279
model in which the structure and properties of the components present in the system are 2280
explicitly taken into account by considering them as composed of different segments that 2281
are linked together. The type and number of segments of a molecule, their charge and the 2282
way they are linked determine the structure and the properties of a molecule. Most 2283
molecules in the system are composed of just one or a few segments, but the molecular 2284
structure of the surfactant molecules is mimicked as closely as possible. The flat surface is 2285
also composed of segments that characterize the surface, for charged surfaces a part of the 2286

94
segments can associate or dissociate a proton. The model is an extension of the theory of 2287
polymer solutions by Flory [107] to systems that have inhomogeneities in one direction (1D 2288
SCFA), i.e. perpendicular to the surface or the center of the lattice, or in two directions (2D 2289
SCFA), i.e. perpendicular to the surface and in concentric rings parallel to the surface. In the 2290
1D SCFA option a mean field approximation is used in every lattice layer around to the 2291
center of the lattice or parallel to the surface. In the 2D case the mean field approximation is 2292
used in every ring. The interactions between the segments are calculated using 2293
Flory-Huggins interaction parameters, similarly as in the Flory theory. Starting from system 2294
characteristics such as the structure of the surface, the number of different types of 2295
molecules, the amount of each of them, their structure and properties, and the interactions 2296
between the various segments, the equilibrium distribution of molecules in the adsorbed 2297
layer is calculated. The conformational statistics of the chains in the layer are evaluated 2298
using Boltzmann statistics, i.e., each step of the walk is weighted with a Boltzmann factor 2299
that accounts for the interactions that the segment experiences in the adsorbed layer. The 2300
electrostatic interactions in the adsorbed layer are calculated using a multi-plate condenser 2301
model. In the absence of surfactants the electrostatic potential profiles correspond with the 2302
potential calculated with the Stern-Gouy-Chapman model. The detailed equilibrium 2303
distribution of surfactant segments within the adsorbed layer, i.e. within a potential field 2304
exerted by the presence of the surfactant molecules themselves and the surface, is calculated 2305
by an iterative minimization of the Gibbs energy of the system. At equilibrium the segment 2306
density distribution in the adsorbed layer and the potential field exerted by the segments and 2307
the surface are fully in accordance with each other (field is self-consistent). Once this is 2308
achieved the structure of the adsorbed layer and the thermodynamic properties of the system 2309
can be obtained. Similarly as in the model of Li and Ruckenstein [237], the SCFA theory 2310
has a closely related variant for self-assembly in solution [238, 239] so that the surfactant 2311
micellization can also be predicted. When micellization of a given surfactant is predicted 2312

95
with a certain set of parameters, the same set of parameters should be used to predict the 2313
adsorption. The only new parameters for the adsorption calculation are in that case those 2314
that describe the interactions of the segments with the solid surface. As mentioned in the 2315
text on several places, the SCFA model has been very helpful for a better understanding of 2316
the surfactant adsorption behavior. Reference [25] is a fairly recent review in which 2317
experimental surfactant adsorption results obtained for metal oxides and silicas are 2318
compared with SCFA calculations. More recent results for surfactant adsorption in confined 2319
space can be found in the section on cationic surfactant adsorption on montmorillonite. For 2320
the SCF calculations a computer code, the SF-box, is available; for further information 2321
and/or application of the SF-Box see [240]. 2322
2323
7.5 NICA-Donnan model applied to surfactant sorption on humic and fulvic acids 2324
Surfactant sorption to humic and fulvic acids can be described with the NICA-Donnan 2325
model as an ion exchange process. In this model the humic substance is considered as a 2326
collection of particles that contain the binding sites and that are permeable for solvent and 2327
solute. The particles form the Donnan phase in which the electrostatic interactions are 2328
governed by a smeared-out electrostatic potential that is the result of the fixed charges and 2329
the mobile charges in the Donnan phase. The binding to the heterogeneous sites is described 2330
by the NICA model, which is based on the multicomponent Hill equation as local isotherm 2331
in combination with the Sips distribution and can be written as [57, 58] 2332
(13) 2333
where QHmax is the maximum sorption of protons, the Hill-parameter that accounts for the 2334
average stoichiometry of component i with the proton sites, is the median affinity of 2335

96
component i for the sites and p the heterogeneity parameter. It is assumed that the first 2336
characterization of the humic substance is done through proton sorption, therefore this ion is 2337
used as reference for the total number of sites (QHmax) and the factor accounts for 2338
the fact that the maximum sorption of i can be different from that of the proton. The 2339
concentration cD,i is the concentration of i in the Donnan phase that can be obtained from 2340
the bulk solution concentration using Eq. 5 with ψs = ψD. In the Donnan model the charge 2341
of the humic particles is neutralized by counter- and co-ions within the Donnan volume, the 2342
latter is calculated with a simple empirical relation. Based on this electroneutrality the 2343
Donnan potential can be calculated and cD,i can be obtained for all ions present [38]. The 2344
NICA equation is a master equation that reduces to the multicomponent Langmuir equation 2345
for all =1, and p =1, to the multicomponent Langmuir -Freundlich eq. for all =1 and 2346
to the multicomponent Hill eq. for p = 1. 2347
The last quotient in Eq.13 is the total coverage of the sites with all types of ions present 2348
in the system, the second quotient is the fraction of the total coverage that is occupied by 2349
component i. Therefore, in the case of sorption of a trace component, j, 2350
( ) the total coverage is hardly affected by the binding of 2351
species j and the NICA eq. reduces to 2352
(14) 2353
where Ω is considered to be constant. When the total adsorption is constant, then also the 2354
Donnan potential will be constant and the electrostatic interactions do not significantly 2355
change with sorption of j, thus also cD,j can be replaced by cj (Boltzmann factor becomes 2356
included in Ω). Therefore, at low solute concentrations in a multicomponent system the 2357
sorption equation of a trace ionic component to the active sites of the humic substance, at 2358
97
otherwise constant solution conditions (pH, ionic composition and ionic strength) is ruled 2359
by a simple equation that resembles the monocomponent Hill-eq. for low loadings. Because 2360
the sorption of j is low, the site heterogeneity is not detected but the cooperativity / 2361
stoichiometry ( ) is relevant. When the humic substance is well studied, Ω is known and 2362
the changes of Ω with changing solution conditions (e.g., change of pH) can be calculated, 2363
therefore the behavior of the trace component with changing solution conditions can be 2364
predicted, once and are known. When no information is present on the humic 2365
acid, the generic humic acid proposed by Milne et al. [55, 56] can be used to represent the 2366
unknown humic acid and by using the parameters collected by Milne the total sorption can 2367
be calculated under the given conditions. Thus also in this case Eq. 14 can be used in 2368
combination with Eq. 5 to investigate trace component sorption and how it is affected by, 2369
e.g., pH. 2370
In the case of metal ion binding a double NICA-Donnan equation has been used, where 2371
the first equation accounts for the low proton affinity sites (‘carboxylic’) and the second for 2372
the high affinity proton sites (‘phenolic’). The above way of analyzing trace component 2373
binding is still relevant as long as the total sorption on both the phenolic and carboxylic type 2374
of groups is constant. In most cases the trace sorption will occur with either the carboxylic 2375
or the phenolic groups and in this case the type of groups that do not participate can be 2376
neglected. 2377
For the surfactant binding only a limiting cases of the single NICA-Donnan equation 2378
have been used. As discussed in the section ‘Modeling surfactant - humic substance 2379
interaction’ Chen et al. [114] used Eq. 14 to unravel the surfactant binding and the Hill 2380
equations used by Yee et al. [98-101] are identical to Eq. 14. Ishiguro and Koopal [115] 2381
made a different simplification for their analysis of surfactant adsorption to various humic 2382

98
acids; they assumed that the surfactant sorption was dominant, i.e., 2383
. In that case the NICA eq. reduces to 2384
(15) 2385
Eq. 15 is mathematically equivalent to the Langmuir-Freundlich equation, but here the 2386
exponent is a composite parameter that reflects both the cooperativity and the heterogeneity. 2387
Because the surfactant sorption covered the entire sorption range up to Qjmax the exponent in 2388
Eq. 15 is also affected by the heterogeneity. For the calculation of the Donnan potential the 2389
total (net) charge of the humic acids was used and the proton charge adjustment due to the 2390
surfactant adsorption was accounted for. When the charge adjustments are not known and a 2391
computer code for NICA-Donnan calculations is available, a good method is to use the full 2392
(single) NICA-Donna equation together with humic substance specific parameters or 2393
generic humic substance parameters [55, 56], because then the charge adjustments are 2394
automatically taken into account. Computer codes that include the NICA-Donnan model are 2395
ECOSAT [241] and Visual MINTEQ ver. 3.0 / 3.1 [242]. Furthermore, the computer code 2396
‘Fit’ [243] is designed to fit experimental results to a range of adsorption isotherm 2397
equations. 2398
2399
8. Surfactant adsorption on soils 2400
2401
8.1 General considerations and trends 2402
Soils are composed of organic and inorganic components each with different adsorption 2403
characteristics as discussed in the previous sections. Therefore, the adsorption of a 2404
surfactant on a soil sample will depend on both the types of soil constituents and their 2405
relative proportions. This has also been stated in literature [244]. The overall surfactant 2406
99
adsorption to a given soil can be thus be approximated by a weighted summation of the 2407
adsorptions to the individual constituents, or oppositely, the soil composition has to be 2408
known to be able to understand the surfactant adsorption behavior. Yet, the overall 2409
adsorption is not necessarily equal to the sum of the adsorptions to the different components 2410
because the soil components may mutually interact and this interaction will affect the 2411
adsorption. The mutual interaction is especially relevant and strong in the case of net 2412
positively charged metal oxides or layered silicates and the negatively charged humic and 2413
fulvic acids [245-249]. A similar situation is encountered with trace element binding to soils 2414
[50]. 2415
Some general trends have also been observed for surfactant adsorption to soils. 2416
Hydrophobic interaction is important with surfactant adsorption. Due to increasing 2417
hydrophobic attraction surfactant adsorption increases, in general, with increasing organic 2418
matter content of the soils [250-256]. Treatment of a soil with H2O2 to remove the organic 2419
matter will therefore, in general, decrease the surfactant adsorption [228, 229], but the 2420
contrary has also been observed [231]. Nonionic surfactants bind to soil surfaces with 2421
hydrogen bonding on the –OH sites of soils besides hydrophobic interaction [257], but 2422
hydrogen bonding is also possible to the hydrated cations on siloxane basal planes [198]. 2423
Longer alkyl chains lead to stronger lateral hydrophobic attraction, this explains that there is 2424
also a positive correlation between aliphatic chain length and surfactant adsorption on soils. 2425
An example of this behavior has been presented by Westall et al. [255] who showed that 2426
linear alkylbenzene sulfonates with longer carbon chains adsorbed stronger on a sediment 2427
(Fig. 29). Adsorption studies comparing linear and branched aliphatic chain structures have 2428
also been performed for soils and alumina [258-261]. For surfactants with the same number 2429
of CH2 segments, branching leads to lower adsorbed amounts at the same surfactant 2430
concentration. This is largely due to a decrease of the hydrophobic attraction; the decrease 2431
in adsorption corresponds with the increase in CMC with branching [261]. 2432

100
Soils possess both permanent and pH-dependent charges [262, 263]. The contents of 2433
those charges differ among soils and affect the adsorption of charged surfactants strongly. 2434
Soils and sediments generally have negative charges, therefore, the adsorption of anionic 2435
surfactants on soils and sediments is much lower than that of nonionic and cationic 2436
surfactants [251, 255, 256, 264, 265]. Bera et al. [266] showed that surfactant adsorption on 2437
a sand was in the order of cationic > nonionic > anionic (Fig. 30). For surfactants with a 2438
similar alkyl chain the adsorption of the cationic surfactant is largest because of the 2439
electrostatic attraction between surface and surfactant and that of the anionic surfactant is 2440
smallest because of the electrostatic repulsion. An example where the relatively low anionic 2441
surfactant adsorption to sand is applied is surfactant-enhanced soil remediation. With 2442
surfactant-enhanced soil remediation, surfactant adsorption to the soil particles increases the 2443
surfactant use and this decreases the efficiency. Therefore, anionic surfactants have usually 2444
been chosen in these technologies [267-269]. However, nonionic surfactants are also often 2445
used for the remediation because of their lower CMC compared to ionic surfactants, higher 2446
degree of surface tension reduction, and relatively constant properties in the presence of salt 2447
[268, 269]. 2448
A positive correlation is observed between cationic surfactant adsorption and the soil 2449
CEC because the CEC characterizes the soil negative charge density and the latter generates 2450
the electrostatic attraction with cationic surfactants [270]. For the soils which possess 2451
variable charges the pH also affects the adsorption as shown in Fig. 31 [266]. Anionic 2452
surfactant adsorption decreases as pH increases [254, 255, 258-260, 266, 271] because the 2453
soil negative charge increases and/or the positive charge decreases. On the other hand, the 2454
opposite occurs for cationic surfactant adsorption as shown in Fig. 31 [266]. When after 2455
sodium citrate - bicarbonate - dithionite treatment the fraction amorphous oxides in soils is 2456
decreased, the adsorption of anionic surfactant also decreases because the density of 2457
positively charged sites of the soils decreases [260]. Nonionic surfactant adsorption 2458

101
increases as pH decreases at low pH and remains almost constant at high pH (Fig. 31) [266]. 2459
The increase at low pH resulted from the increase of the surface hydroxyl sites (due to 2460
protonation of the surface oxygens) to which the EO segments of the nonionics can bind by 2461
hydrogen bonding. 2462
The electrolyte concentration also affects ionic surfactant adsorption. It is observed that 2463
anionic surfactant adsorption on negatively charged soils increases, in general, with the 2464
increase of electrolyte concentration [255, 258, 266]. This must be due to a larger screening 2465
of both the electrostatic repulsion between surface and surfactant and the mutual 2466
electrostatic repulsion between the adsorbed surfactant ions. Increase of cationic surfactant 2467
adsorption on negatively charged soils with the increase of electrolyte concentration is also 2468
observed [272, 273]. This is caused by the screening of the electrostatic repulsion between 2469
the head-out adsorbed head groups of the cationic surfactants. This situation occurs for 2470
bilayer and/or admicelle adsorption where part of the head groups are directed to the soil 2471
solution; this part of the surfactants is adsorbed by hydrophobic attraction to the carbon 2472
chains of the surfactants adsorbed in the first layer. In this case, the cationic surfactant 2473
adsorption is also affected by the type of anion of the electrolyte. The surfactant adsorption 2474
increases in the order of SO42->Br->Cl- because the screening effect increases in this order 2475
[272]. The influence of the electrolyte concentration becomes reverse for ionic surfactants 2476
adsorbed in direct contact with the oppositely charged soil surface (head-on adsorption). 2477
The adsorption decreases with the increase of electrolyte concentration due to the screening 2478
of the electrostatic surfactant-surface attraction. 2479
An example of the influence of the electrolyte concentration on the sorption of dodecyl 2480
benzene sulfonate (DBS) on a humic soil is depicted in Fig. 32 [258]. The adsorption 2481
decreases with decreasing electrolyte concentration because the electrostatic repulsion 2482
increases. The influence of the (smeared-out) electrostatic potential at the location of the 2483
adsorption sites can be evaluated by using the Langmuir-Donnan model. In this model it is 2484
102
assumed that the soil particles are covered with humic substances and that the surfactant 2485
binds to the sites in the humic layer according to a Langmuir equation that is extended by 2486
including the electrostatic attraction by a Boltzmann factor, exp(-zFψD/RT), where ψD is the 2487
Donnan potential in the humic layer (see section 7): 2488
'1
'
,
,max
jD
jDjj cK
cKQQ
+= (16) 2489
−=
RTψFz
cc DjjbjD exp,, (17) 2490
where, Qj is the surfactant adsorption, Qjmax the maximum surfactant adsorption, K’ the 2491
specific or chemical affinity constant (surface-surfactant), , zj the valence of the surfactant 2492
ion, cD,j the surfactant concentration in the Donnan phase and cb,j the surfactant 2493
concentration in the bulk solution. When for all salt concentrations the value of Qjmax is put 2494
equal to the surfactant sorption at the CMC (estimated to be 20 µmol/g), the affinity 2495
constant, K’, and the Donnan potentials, ψD, can be obtained by fitting Eq. 16+17 to the 2496
experimental data in the region where the slope of the double logarithmic plots is about 2497
equal to unity (region where Eq. 16 applies). The fitted adsorption isotherms and obtained 2498
Donnan potentials are depicted in Fig. 32. The negative value of Donnan potential increases 2499
at constant salt concentration due to the fact that DBS sorption increases the negative charge 2500
of the particles. Increasing the salt concentration at a given DBS sorption has the opposite 2501
effect: the salt ions screen the particle charge; therefore, the repulsive Donnan potential 2502
decreases with increasing the salt concentration. At the lowest surfactant concentrations the 2503
isotherms rise very steeply; this likely indicates strong sorption to some highly active sites 2504
of the soil sample. 2505
2506
8.2 Fate of surfactants in soils; degradation, hysteresis and precipitation 2507
103
When the fate of surfactants in soil and water environments is considered, surfactant 2508
degradation is important, as well as adsorption. However, different classes of surfactants 2509
have different degradation behavior in the environment [264]. Sodium dodecylsulfate (SDS) 2510
easily degrades, especially in humic soil. Therefore, the influence of degradation on 2511
adsorption experiments is significant. Results of some batch experiments of SDS in the 2512
presence of a highly humic non-allophanic andosol are depicted in Fig. 33 [274]; the sum of 2513
adsorption and degradation corresponds to the SDS decay in the soil solution. The 2514
“adsorption + degradation” amount at intermediate SDS concentrations increases with time 2515
due to increasing of degradation. The initial steep increase is somewhat puzzling; the 2516
irregular behavior suggests that either or both degradation and cooperative adsorption are 2517
important in this region [274]. 2518
The environment also affects the degradation; sodium dodecylbenzenesulfonate with a 2519
linear carbon chain (L-DBS) degrades in river water with a half-life of less than 3 days, but 2520
its degradation in aerobic soil with a half-life of 7‒33 days is much longer [264]. In general, 2521
adsorption restricts L-DBS degradation, especially in soils with allophane and amorphous 2522
metal oxides [260], which adsorb the anionic surfactant by electrostatic attraction. 2523
Hysteresis of adsorption, which implies different adsorbed amounts for the adsorption 2524
and the desorption isotherm [168, 169, 275], must be also considered as a distinctive 2525
phenomenon. In general, the adsorbed amount with desorption is larger than that of 2526
adsorption [169, 275]. The hysteresis can, in general, be due to kinetic and/or 2527
multicomponent adsorption effects. An important kinetic reason for the difference between 2528
the adsorption and desorption isotherm is that the kinetics of desorption become very slow 2529
when the adsorption isotherm is rather steep [276]. In this case the adsorption isotherm is 2530
the true isotherm, the desorption isotherm is an artifact. In multicomponent systems the 2531
adsorption conditions are often not the same as the desorption conditions. This is especially 2532
the case in the presence of impurities adsorbed to the solid and when the solid area to 2533
104
solution volume ratio is different in the ad- and desorption experiment. In the case of 2534
adsorption by ion exchange (‘first layer’ adsorption) and hydrophobic attraction (admicelle 2535
formation or ‘second layer’ adsorption), desorption of the ‘second layer’ shows no 2536
hysteresis. This has, for instance, been observed for cationic surfactant adsorption on 2537
vermiculitic soil with a negative charge [272]. 2538
Ionic surfactant insolubility must be considered when the Krafft temperature is larger 2539
than the temperature under the conditions of the adsorption [201, 277, 278]. The Krafft 2540
temperature or Krafft point is the minimum temperature at which surfactants can form 2541
micelles, below the Krafft temperature surfactant added to a solution with a monomer 2542
concentration close to the CMC remains in the crystalline form. Therefore, micelles are not 2543
formed when the temperature is lower than the Krafft point. The Krafft point becomes 2544
higher when the coion of the surfactant is multivalent. 2545
2546
8.3 Influence of surfactant adsorption on soil structure and permeability 2547
Because surfactants modify the surface characteristics of solids, they affect the structure 2548
of soils and this affects the water permeability and gas diffusion in soils [279-283]. Proper 2549
permeability and gas diffusion are required for crop growth; therefore, a good soil structure 2550
must be maintained in crop fields. When a soil disperses and swells during the irrigation or 2551
rainfall, dispersed soil particles clog the macro-pores (water transmission pores) in the soil 2552
and permeability is decreased. A change in soil structure that leads to a decrease in 2553
permeability is a negative factor in relation to agriculture and soil- water environment. 2554
Moreover, sometimes flooded water conveys soils and causes erosion; important soil is lost 2555
and the nutrients or chemicals in the eroded soil cause water contamination. The soil 2556
dispersion is generally caused by clays and the reduction of hydraulic conductivity is larger 2557
when the clay content in the soil is larger [280]. When the soil organic matter content is 2558

105
reduced, the reduction of hydraulic conductivity becomes larger because clays in soils with 2559
a high organic content are not easily dispersed [279]. 2560
A review on soil structure can be found in [284]. Soil and clay structural changes with 2561
changing inter-particle interaction have been described in [263, 285-288]. In general, 2562
repulsive inter-particle interaction allows the particles to slip along each other, which leads 2563
to relatively dense structures; with attractive inter-particle interactions the particles stick 2564
together which retards further individual movement and the clustering leads to a relatively 2565
open structure. It is general knowledge that a settling stable dispersion forms a compact 2566
structure and a settling unstable dispersion forms an open structure. The use of surfactants 2567
for soil washing to remove low-solubility organic contaminants, such as oils, also changes 2568
the inter-particle interactions and can result in a significant change in the hydraulic 2569
conductivity of porous media [279, 283]. Electrolyte concentration, pH and specific ions 2570
that all likely affect the particle-particle interaction may also change the soil permeability 2571
[263, 288-297]. An example of the effect of surfactant adsorption on soil stability is 2572
depicted in Fig. 34 [272], which shows the adsorption isotherm of 2573
hexadecyltrimethylammonium (HDTMA=C16TA+), on two vermiculitic soils (Na and Ca), 2574
and the corresponding effects on the electrophoretic mobility of the soil particles and the 2575
optical density of the soil suspension. When the soil is better dispersed, the optical density 2576
becomes larger. For the Na-soil, the shape of the isotherm in region I indicates that the 2577
vermiculite is expanding upon adsorption. Up to about adsorbed amounts equal to 1.0 CEC, 2578
the soil gradually flocculates with increasing surfactant adsorption and the electrophoretic 2579
mobility changes from negative to zero at the IEP, where the surfactant adsorption is about 2580
equal to the CEC. The negative charge of the soil is gradually compensated with the 2581
adsorbed surfactant charge; therefore, the electrostatic repulsion between the soil particles 2582
gradually vanishes and the dispersion is completely flocculated. With a vermiculitic soil and 2583
a cationic surfactant the adsorption occurs initially by ion exchange, this implies surfactant 2584

106
head groups in contact with the surface and tails contacting the solution; therefore, also the 2585
hydrophobicity of the soil particles increases and this is likely a second contribution to the 2586
decrease in dispersion stability. When the adsorption becomes larger than the soil CEC 2587
further adsorption will occur by hydrophobic attraction and the formation of an admicellar 2588
layer (second layer) on the surface. With further adsorption the soil particles become 2589
positive and less hydrophobic and the soil disperses again. The positive charge is indicated 2590
by the positive electrophoretic mobilities, For the Ca-vermiculite-soil, the behavior is 2591
different. The shape of the isotherm indicates that there is negligible swelling of the 2592
vermiculite. Moreover, the electrophoretic mobilities are rather low and this explains the 2593
poor initial degree of dispersion. Surfactant adsorption by ion exchange hardly changes the 2594
external particle charge and hence the mobility stays low as does the degree of dispersion. 2595
The Ca-soil begins to disperse after passing the IEP where the particles become positive and 2596
the second adsorption layer starts, but the stability of dispersion stays somewhat lower than 2597
for the Na-soil. The latter may be due to the effect of the released Ca ions on the ionic 2598
strength. 2599
Allred and Brown [279] showed that the soil hydraulic conductivity significantly 2600
decreased with the infiltration of ionic and nonionic surfactant solutions at high 2601
concentration (1 mol/kg); the behavior is depicted in Fig. 35. The curves of N1, N2 and N3 2602
in Fig. 35A represent the nonionic surfactants, the curves of A1 and A2 in Fig. 35B 2603
represent the anionic surfactants, the curves of C1 and C2 in Fig. 35B represent the cationic 2604
surfactants, and the curve of AM1 in Fig. 35B represents the amphoteric surfactant. The 2605
hydraulic conductivity reduction was larger for ionic surfactants than nonionic surfactants. 2606
When an anionic surfactant is adsorbed on a negatively charged soil, the negative charge of 2607
the soil surface becomes larger and the soil particles disperse easier, and the particles slip 2608
easier along each other; therefore, the hydraulic conductivity decreases. When a cationic 2609
surfactant is adsorbed on the negatively charged soil, the situation is somewhat similar to 2610

107
that described in the previous section for the vermiculite soils. The stability of dispersion 2611
goes through a minimum, but when the positive charge due to surfactant adsorption is 2612
sufficient the soil particles become well dispersive and the hydraulic conductivity tends to 2613
decrease. When the electrolyte concentration is large, the influence of ionic surfactant 2614
adsorption on the decrease of hydraulic conductivity is restricted [281], because the soil 2615
dispersion ability is inhibited by the strong screening of the particle-particle repulsion. 2616
As a nonionic surfactant does not change the particle charge its effect on the dispersion 2617
stability can only result from the way the surfactant is adsorbed. On most natural surfaces 2618
the hydrophilic head group will be in contact with the surface and similarly as for cationic 2619
surfactants a second layer may become adsorbed at surfactant concentrations around the 2620
CMC. For short EO chains the adsorption in the ‘first layer’ is moderate and the transition 2621
to the ‘second layer’ occurs in a narrow concentration range close to the CMC. For long EO 2622
chains the adsorption in the ‘first layer’ is larger, but due to the large head group it is 2623
difficult for the alkyl chains to associate and only when the alkyl chains are also fairly long 2624
a sufficient ‘second layer’ will form. Also with kaolinite the edge surface probably 2625
contributes, but on montmorillonite this contribution is relatively small. Therefore, the 2626
behavior with respect to hydraulic conductivity will strongly depend on the type of nonionic 2627
surfactant and the type of soil surface. Mustafa and Letey [298] indicated for a hydrophobic 2628
sandy loam, a hydrophilic sandy loam and a hydrophilic clay loam that nonionic surfactant 2629
adsorption induced soil dispersion by decreasing the aggregate size. 2630
Water infiltration into dry soils with a hydrophobic surface is also affected by surfactant 2631
adsorption. Fig. 36 shows the upward water infiltration into a peat moss column [299]. The 2632
bottom of the air-dried peat moss column was set 20 cm below the water table. A 70-mM 2633
SDS solution infiltrated faster than pure water because the surface became wettable after the 2634
adsorption of SDS. On the other hand, infiltration of the surfactant solution into dry sand 2635
became slower compared to pure water infiltration, because the sand was already wettable 2636

108
without surfactant. In this case, they explained that the surface tension of surfactant solution 2637
was smaller than that of pure water and the viscosity of surfactant solution was larger than 2638
pure water and both effects decreased the rate of capillary infiltration. 2639
2640
Acknowledgements 2641
The authors thank Hokkaido University for providing a ‘Visiting Professor’ grant to 2642
LKK for a period of 2 months and the ‘Japan Society for the Promotion of Science’ for the 2643
financial support via ‘Grants-in-Aid for Scientific Research (No. 25252042)’. 2644
2645
References 2646
[1] Koopal LK. Wetting of solid surfaces: Fundamentals and charge effects. Adv Colloid Interface Sci 2647 2012;179:29-42. 2648
[2] Myers D. Surfactant science and technology. 3rd ed: John Wiley & Sons; 2005. 2649 [3] Tadros TF. Surfactants in agrochemicals: CRC Press; 1994. 2650 [4] Mulligan CN, Yong RN, Gibbs BF. Surfactant-enhanced remediation of contaminated soil: A review. 2651
Eng Geol 2001;60:371-80. 2652 [5] Mao XH, Jiang R, Xiao W, Yu JG. Use of surfactants for the remediation of contaminated soils: A 2653
review. J Hazard Mater 2015;285:419-35. 2654 [6] Kosswig K. Surfactants. Ullmann's encyclopedia of industrial chemistry: Wiley-VCH; 2002. 2655 [7] McAvoy DC, Eckhoff WS, Rapaport RA. Fate of linear alkylbenzene sulfonate in the environment. 2656
Environ Toxicol Chem 1993;12:977-87. 2657 [8] Zoller U. Handbook of detergents: Environmental impact : Surfactant science series 121: CRC Press; 2658
2004. 2659 [9] Jahan K, Balzer S, Mosto P. Toxicity of nonionic surfactants. In: Kungolos AG, Brebbia CA, 2660
Zamorano M, (eds). Environmental Toxicology II. Vol. 110: WIT Press; 2008. 2661 [10] Rebello S, Asok AK, Mundayoor S, Jisha MS. Surfactants: Toxicity, remediation and green 2662
surfactants. Environ Chem Lett 2014;12:275-87. 2663 [11] McWilliams P. Bioaccumulation potential of surfactants: A review. Aberdeen: European Oilfield 2664
Speciality Chemicals Association; 2000. http://www.eosca.com/publications-documents 2665 [12] Scott MJ, Jones MN. The biodegradation of surfactants in the environment. Biochimica et Biophysica 2666
Acta (BBA)-Biomembranes 2000;1508:235-51. 2667 [13] Gheorghe S, Lucaciu I, Paun I, Stoica C, Stanescu E. Ecotoxicological behavior of some cationic and 2668
amphoteric surfactants (biodegradation, toxicity and risk assessment). In: Chamy R, Rosenkranz F, 2669 (eds). Biodegradation - life of science. INTECH; 2013. 2670

109
[14] Tan KH. Principles of soil chemistry. 4th ed: CRC Press; 2011. 2671 [15] Schwarzenbach RP, Gschwend PM, Imboden DM. Environmental organic chemistry. 2nd ed: 2672
Wiley-Interscience; 2003. 2673 [16] Brackmann B, Hager C. The statistical world of raw materials, fatty alcohols and surfactants. CD 2674
Proceedings 6th World Surfactant Congress CESIO, Berlin, Germany2004. 2675 [17] Mulligan CN. Environmental applications for biosurfactants. Environ Pollut 2005;133:183-98. 2676 [18] Bustamante M, Duran N, Diez MC. Biosurfactants are useful tools for the bioremediation of 2677
contaminated soil: A review. J Soil Sci Plant Nutr 2012;12:667-87. 2678 [19] Everett DH. Manual of symbols and terminology for physicochemical quantities and units, appendix 2679
II: Definitions, terminology and symbols in colloid and surface chemistry. Pure Appl Chem 2680 1972;31:577-638. 2681
[20] Koopal LK. Definitions, terminology and symbols in colloid and surface chemistry , internet version 2682 with annotations of dh everett, manual of symbols and terminology for physicochemical quantities 2683 and units, appendix II: Definitions, terminology. Web Edition; 1972. 2684 http://old.iupac.org/reports/2001/colloid_2001/manual_of_s_and_t/manual_of_s_and_t.html 2685
[21] Matijević E, Pethica B. The properties of ionized monolayers. Part 1.—sodium dodecyl sulphate at 2686 the air/water interface. Trans Faraday Soc 1958;54:1382-9. 2687
[22] Matijević E, Pethica B. The properties of ionized monolayers. Part 2.—the thermodynamics of the 2688 ionic double layer of sodium dodecyl sulphate. Trans Faraday Soc 1958;54:1390-9. 2689
[23] Matijević E, Pethica B. The properties of ionized monolayers. Part 3.—the thermodynamics of the 2690 ionic double layer of sodium octanoate. Trans Faraday Soc 1958;54:1400-7. 2691
[24] Rosen MJ. Surfactants and interfacial phenomena. 3rd ed. New York: Wiley & Sons; 2004. 2692 [25] Koopal LK. Modeling association and adsorption of surfactants. In: Esumi K, Ueno M, (eds). 2693
Structure-performance relationships in surfactants. Surfactant science series Vol. New York: Marcel 2694 Dekker; 2003. p. 111-96. 2695
[26] Mukerjee P, Mysels KJ. Critical micelle concentrations of aqueous surfactant systems. Vol. 2696 NSRDS-NBS 36: National Institute of Standards and Technology, Washington D.C. USA; 1971. 2697
[27] van Os NM, Haak JR, Rupert LAM. Physico-chemical properties of selected anionic, cationic and 2698 nonionic surfactants: Elsevier; 1993. 2699
[28] Nagarajan R, Ruckenstein E. Theory of surfactant self-assembly: A predictive molecular 2700 thermodynamic approach. Langmuir 1991;7:2934-69. 2701
[29] Nagarajan R. Molecular packing parameter and surfactant self-assembly: The neglected role of the 2702 surfactant tail. Langmuir 2002;18:31-8. 2703
[30] Israelachvili JN, Mitchell DJ, Ninham BW. Theory of self-assembly of hydrocarbon amphiphiles into 2704 micelles and bilayers. J Chem Soc Faraday Trans 2 1976;72:1525-68. 2705
[31] Israelachvili J. The science and applications of emulsions—an overview. Colloids Surf A 2706 1994;91:1-8. 2707
[32] Mitchell DJ, Ninham BW. Micelles, vesicles and microemulsions. J Chem Soc Faraday Trans 2 2708 1981;77:601-29. 2709
110
[33] Swift RS. Organic matter characterization. In: Sparks D, Page A, Helmke P, Loeppert R, Soltanpour P, 2710 Tabatabai M, et al., (eds). Methods of soil analysis part 3-chemical methods. Madison: Soil Science 2711 Society of America; 1996. p. 1011-69. 2712
[34] Leenheer JA. Progression from model structures to molecular structures of natural organic matter 2713 components. Ann Environ Sci 2007;1:15. 2714
[35] Sutton R, Sposito G. Molecular structure in soil humic substances: The new view. Environ Sci 2715 Technol 2005;39:9009-15. 2716
[36] Langford CH, Melton JR. When should humicsubstances be treated as dynamic combinatorial 2717 systems? . In: Ghabbour EA, Davies G, (eds). Humic substances: Molecular details and applications 2718 in land and water conservation. New York: Taylor & Francis; 2005. p. 65-78. 2719
[37] Avena MJ, Wilkinson KJ. Disaggregation kinetics of a peat humic acid: Mechanism and pH effects. 2720 Environ Sci Technol 2002;36:5100-5. 2721
[38] Koopal LK, Saito T, Pinheiro JP, van Riemsdijk WH. Ion binding to natural organic matter: General 2722 considerations and the NICA-donnan model. Colloids Surf A 2005;265:40-54. 2723
[39] Schulten H-R, Schnitzer M. Chemical model structures for soil organic matter and soils. Soil Sci 2724 1997;162:115-30. 2725
[40] Duval JFL, Wilkinson KJ, Van Leeuwen HP, Buffle J. Humic substances are soft and permeable: 2726 Evidence from their electrophoretic mobilities. Environ Sci Technol 2005;39:6435-45. 2727
[41] Nederlof MM, De Wit JC, Van Riemsdijk WH, Koopal LK. Determination of proton affinity 2728 distributions for humic substances. Environ Sci Technol 1993;27:846-56. 2729
[42] Nederlof MM, van Riemsdijk WH, Koopal LK. Heterogeneity analysis for binding data using an 2730 adapted smoothing spline technique. Environ Sci Technol 1994;28:1037-47. 2731
[43] Kinniburgh DG, van Riemsdijk WH, Koopal LK, Borkovec M, Benedetti MF, Avena MJ. Ion binding 2732 to natural organic matter: Competition, heterogeneity, stoichiometry and thermodynamic consistency. 2733 Colloids Surf A 1999;151:147-66. 2734
[44] Avena MJ, Vermeer AWP, Koopal LK. Volume and structure of humic acids studied by viscometry 2735 pH and electrolyte concentration effects. Colloids Surf A 1999;151:213-24. 2736
[45] Tan WF, Koopal LK, Weng LP, van Riemsdijk WH, Norde W. Hurnic acid protein complexation. 2737 Geochim Cosmochim Acta 2008;72:2090-9. 2738
[46] Jones MN, Bryan ND. Colloidal properties of humic substances. Adv Colloid Interface Sci 2739 1998;78:1-48. 2740
[47] Tipping E. Cation binding by humic substances. Cambridge (UK): Cambridge University Press; 2741 2002. 2742
[48] Dudal Y, Gérard F. Accounting for natural organic matter in aqueous chemical equilibrium models: A 2743 review of the theories and applications. Earth-Sci Rev 2004;66:199-216. 2744
[49] Merdy P, Huclier S, Koopal LK. Modeling metal-particle interactions with an emphasis on natural 2745 organic matter. Environ Sci Technol 2006;40:7459-66. 2746
[50] Groenenberg JE, Lofts S. The use of assemblage models to describe trace element partitioning, 2747 speciation, and fate: A review. Environ Toxicol Chem 2014;33:2181-96. 2748

111
[51] Tipping E. Humic ion-binding model VI: An improved description of the interactions of protons and 2749 metal ions with humic substances. Aquat Geochem 1998;4:3-47. 2750
[52] Smith E, Rey‐Castro C, Longworth H, Lofts S, Lawlor A, Tipping E. Cation binding by acid‐2751 washed peat, interpreted with humic ion‐binding model VI‐fd. Eur J Soil Sci 2004;55:433-47. 2752
[53] Tipping E, Lofts S, Sonke J. Humic ion-binding model VII: A revised parameterisation of 2753 cation-binding by humic substances. Environ Chem 2011;8:225-35. 2754
[54] Benedetti MF, Van Riemsdijk WH, Koopal LK. Humic substances considered as a heterogeneous 2755 donnan gel phase. Environ Sci Technol 1996;30:1805-13. 2756
[55] Milne CJ, Kinniburgh DG, Tipping E. Generic NICA-donnan model parameters for proton binding by 2757 humic substances. Environ Sci Technol 2001;35:2049-59. 2758
[56] Milne CJ, Kinniburgh DG, Van Riemsdijk WH, Tipping E. Generic NICA-donnan model parameters 2759 for metal-ion binding by humic substances. Environ Sci Technol 2003;37:958-71. 2760
[57] Koopal LK, Van Riemsdijk WH, De Wit JCM, Benedetti MF. Analytical isotherm equations for 2761 multicomponent adsorption to heterogeneous surfaces. J Colloid Interface Sci 1994;166:51-60. 2762
[58] Koopal LK, van Riemsdijk WH, Kinniburgh DG. Humic matter and contaminants. General aspects 2763 and modeling metal ion binding. Pure Appl Chem 2001;73:2005-16. 2764
[59] Saito T, Nagasaki S, Tanaka S, Koopal LK. Electrostatic interaction models for ion binding to humic 2765 substances. Colloids Surf A 2005;265:104-13. 2766
[60] Zhuravlev L. The surface chemistry of amorphous silica. Zhuravlev model. Colloids Surf A 2767 2000;173:1-38. 2768
[61] Chuang I-S, Maciel GE. Probing hydrogen bonding and the local environment of silanols on silica 2769 surfaces via nuclear spin cross polarization dynamics. J Am Chem Soc 1996;118:401-6. 2770
[62] Yang J, Wang E. Reaction of water on silica surfaces. Curr Opin Solid State Mater Sci 2006;10:33-9. 2771 [63] Iler RK. The chemistry of silica: Solubility, polymerization, colloid and surface properties, and 2772
biochemistry. New York: Wiley-Interscience; 1979. 2773 [64] Boehm HP. Chapter 5. Advances in catalysis and related subjects, vol 16. Academic Press, New 2774
York; 1966. p. 179. 2775 [65] Tamura H, Tanaka A, Mita K, Furuichi R. Surface hydroxyl site densities on metal oxides as a 2776
measure for the ion-exchange capacity. J Colloid Interface Sci 1999;209:225-31. 2777 [66] Pauling L. The principles determining the structure of complex ionic crystals. J Am Chem Soc 2778
1929;51:1010-26. 2779 [67] Brown ID. The chemical bond in inorganic chemistry. London: Oxford Univ. Press; 2002. 2780 [68] Brown ID, Altermatt D. Bond-valence parameters obtained from a systematic analysis of the 2781
inorganic crystal structure database. Acta Crystallogr Sect B: Struct Sci 1985;41:244-7. 2782 [69] Brown ID. Recent developments in the methods and applications of the bond valence model. Chem 2783
Rev 2009;109:6858-919. 2784 [70] Hiemstra T, Van Riemsdijk WH, Bolt GH. Multisite proton adsorption modeling at the solid/solution 2785
interface of (hydr) oxides: A new approach: I. Model description and evaluation of intrinsic reaction 2786 constants. J Colloid Interface Sci 1989;133:91-104. 2787

112
[71] Hiemstra T, Venema P, Van Riemsdijk WH. Intrinsic proton affinity of reactive surface groups of 2788 metal (hydr) oxides: The bond valence principle. J Colloid Interface Sci 1996;184:680-92. 2789
[72] Hiemstra T, Vanriemsdijk WH, Bruggenwert MGM. Proton adsorption mechanism at the gibbsite and 2790 aluminum-oxide solid-solution interface. Neth J Agric Sci 1987;35:281-93. 2791
[73] Hiemstra T, Van Riemsdijk WH. Effect of different crystal faces on experimental interaction force 2792 and aggregation of hematite. Langmuir 1999;15:8045-51. 2793
[74] Hiemstra T, van Riemsdijk WH. On the relationship between surface structure and ion complexation 2794 of oxide-solution interface. In: Hubbard AT, (ed). Encyclopedia of surface and colloid science. New 2795 York: ; Marcel Dekker; 2002. p. 3773-99. 2796
[75] Machesky ML, Wesolowski DJ, Palmer DA, Ridley MK. On the temperature dependence of intrinsic 2797 surface protonation equilibrium constants: An extension of the revised MUSIC model. J Colloid 2798 Interface Sci 2001;239:314-27. 2799
[76] Koopal LK. Mineral hydroxides: From homogeneous to heterogeneous modelling. Electrochim Acta 2800 1996;41:2293-305. 2801
[77] Koopal LK. Ion adsorption on mineral oxide surfaces. In: Dabrowski A, Tertykh VA, (eds). 2802 Adsorption on new and modified inorganic sorbents. Studies in surface science and catalysis Vol. 99. 2803 Amsterdam: Elsevier; 1996. Chapter 3, 5. p. 757 -96. 2804
[78] Hiemstra T, Van Riemsdijk WH. Physical chemical interpretation of primary charging behaviour of 2805 metal (hydr) oxides. Colloids Surf 1991;59:7-25. 2806
[79] Hiemenz PC. Principles of colloid and surface chemistry, 2nd edition, revised and expanded. New 2807 York: Marcel Dekker; 1986. 2808
[80] Hiemstra T, Van Riemsdijk WH. On the relationship between charge distribution, surface hydration, 2809 and the structure of the interface of metal hydroxides. J Colloid Interface Sci 2006;301:1-18. 2810
[81] Hiemstra T, Yong H, Van Riemsdijk WH. Interfacial charging phenomena of aluminum (hydr) oxides. 2811 Langmuir 1999;15:5942-55. 2812
[82] Abendroth R. Behavior of a pyrogenic silica in simple electrolytes. J Colloid Interface Sci 2813 1970;34:591-6. 2814
[83] Gibb AW, Koopal LK. Electrochemistry of a model for patchwise heterogeneous surfaces: The 2815 rutile-hematite system. J Colloid Interface Sci 1990;134:122-38. 2816
[84] Hiemstra T, Van Riemsdijk WH. A surface structural approach to ion adsorption: The charge 2817 distribution (CD) model. J Colloid Interface Sci 1996;179:488-508. 2818
[85] Rietra RP, Hiemstra T, van Riemsdijk WH. The relationship between molecular structure and ion 2819 adsorption on variable charge minerals. Geochim Cosmochim Acta 1999;63:3009-15. 2820
[86] Schulze DG. An introduction to soil mineralogy. In: Dixon JB, Schulze DG, (eds). Soil mineralogy 2821 with environmental application. Sssa book series no. 7 Vol. Madison: Soil Science Society of 2822 America 2002. Chapter 1. p. 1-34. 2823
[87] Johnston CT, Tombacz E. Surface chemistry of soil minerals. In: Dixon JB, Schuze DG, (eds). Soil 2824 mineralogy with environmental application. Sssa book series no. 7 Vol. Madison: Soil Science 2825 Society of America; 2002. Chapter 2. p. 37-67. 2826

113
[88] Bourg IC, Sposito G, Bourg AC. Modeling the acid–base surface chemistry of montmorillonite. J 2827 Colloid Interface Sci 2007;312:297-310. 2828
[89] Liu X, Lu X, Meijer EJ, Wang R, Zhou H. Atomic-scale structures of interfaces between 2829 phyllosilicate edges and water. Geochim Cosmochim Acta 2012;81:56-68. 2830
[90] Liu X, Lu X, Sprik M, Cheng J, Meijer EJ, Wang R. Acidity of edge surface sites of montmorillonite 2831 and kaolinite. Geochim Cosmochim Acta 2013;117:180-90. 2832
[91] Koopal LK, van Riemsdijk WH. Electrosorption on random and patchwise heterogeneous surfaces: 2833 Electrical double-layer effects. J Colloid Interface Sci 1989;128:188-200. 2834
[92] Avena MJ, De Pauli CP. Proton adsorption and electrokinetics of an argentinean montmorillonite. J 2835 Colloid Interface Sci 1998;202:195-204. 2836
[93] Tombacz E, Regdon I. Humic substances as various colloidal systems. In: Senesi N, Miano TM, (eds). 2837 Humic substances in the global environment and implications on human health. Amsterdam: Elsevier; 2838 1994. p. 139-44. 2839
[94] Tombácz E, Varga K, Szántó F. An X-ray diffraction study of alkylammonium humate complexes. 2840 Colloid Polym Sci 1988;266:734-8. 2841
[95] Traina SJ, McAvoy DC, Versteeg DJ. Association of linear alkylbenzenesulfonates with dissolved 2842 humic substances and its effect on bioavailability. Environ Sci Technol 1996;30:1300-9. 2843
[96] Otto WH, Britten DJ, Larive CK. NMR diffusion analysis of surfactant–humic substance interactions. 2844 J Colloid Interface Sci 2003;261:508-13. 2845
[97] Koopal LK, Goloub TP, Davis TA. Binding of ionic surfactants to purified humic acid. J Colloid 2846 Interface Sci 2004;275:360-7. 2847
[98] Yee MM, Miyajima T, Takisawa N. Evaluation of amphiphilic properties of fulvic acid and humic 2848 acid by alkylpyridinium binding study. Colloids Surf A 2006;272:182-8. 2849
[99] Yee MM, Miyajima T, Takisawa N. Thermodynamic studies of dodecylpyridinium ion binding to 2850 fulvic acid. Colloids Surf A 2006;287:68-74. 2851
[100] Yee MM, Miyajima T, Takisawa N. Study of ionic surfactants binding to humic acid and fulvic acid 2852 by potentiometric titration and dynamic light scattering. Colloids Surf A 2009;347:128-32. 2853
[101] Yee MM, Miyajima T, Takisawa N. Thermodynamic studies of dodecylpyridinium ion binding to 2854 humic acid and effect of solution parameters on their binding. Colloids Surf A 2007;295:61-6. 2855
[102] Matsuda M, Kaminaga A, Hayakawa K, Takisawa N, Miyajima T. Surfactant binding by humic acids 2856 in the presence of divalent metal salts. Colloids Surf A 2009;347:45-9. 2857
[103] Ishiguro M, Tan WF, Koopal LK. Binding of cationic surfactants to humic substances. Colloids Surf 2858 A 2007;306:29-39. 2859
[104] Thieme J, Niemeyer J. Interaction of colloidal soil particles, humic substances and cationic detergents 2860 studied by X-ray microscopy. In: Rehage H, Peschel G, (eds). Structure, dynamics and properties of 2861 disperse colloidal systems. Progress in colloid & polymer science Vol.: Steinkopff; Prog. Colloid 2862 Polym. Sci. 111; 1998. Chapter 33. p. 193-201. 2863
[105] Barron W, Murray BS, Scales PJ, Healy TW, Dixon DR, Pascoe M. The streaming current detector - a 2864 comparison with conventional electrokinetic techniques. Colloids Surf A 1994;88:129-39. 2865

114
[106] Walker CA, Kirby JT, Dentel SK. The streaming current detector: A quantitative model. J Colloid 2866 Interface Sci 1996;182:71-81. 2867
[107] Kam S-K, Gregory J. The interaction of humic substances with cationic polyelectrolytes. Water Res 2868 2001;35:3557-66. 2869
[108] Tan W-F, Norde W, Koopal LK. Humic substance charge determination by titration with a flexible 2870 cationic polyelectrolyte. Geochim Cosmochim Acta 2011;75:5749-61. 2871
[109] Dobias B. Surfactant adsorption and dispersion stability in mineral flotation. In: Dobias B, (ed). 2872 Coagulation and flocculation: Theory and applications Surfactant science series Vol. 126. 2nd ed. 2873 New York: Taylor and Francis (CRC Press) Boca Raton (USA); 2005. Chapter 10. p. 663-765. 2874
[110] Shang C, Rice JA. Investigation of humate-cetyltrimethylammonium complexes by small-angle 2875 X-ray scattering. J Colloid Interface Sci 2007;305:57-61. 2876
[111] Subbiah D, Mishra AK. Humic acid–cetyltrimethylammonium bromide interaction: A fluorimetric 2877 study. Luminescence 2009;24:84-9. 2878
[112] Ishiguro M, Koopal LK. Binding of alkylpyridinium chloride surfactants to sodium polystyrene 2879 sulfonate. Colloids Surf A 2009;347:69-75. 2880
[113] Chen Y, Droge ST, Hermens JL. Analyzing freely dissolved concentrations of cationic surfactant 2881 utilizing ion-exchange capability of polyacrylate coated solid-phase microextraction fibers. J 2882 Chromatogr A 2012;1252:15-22. 2883
[114] Chen Y, Hermens JL, Droge ST. Influence of organic matter type and medium composition on the 2884 sorption affinity of c12-benzalkonium cation. Environ Pollut 2013;179:153-9. 2885
[115] Ishiguro M, Koopal LK. Predictive model of cationic surfactant binding to humic substances. 2886 Colloids Surf A 2011;379:70-8. 2887
[116] Droge S, Goss K-U. Effect of sodium and calcium cations on the ion-exchange affinity of organic 2888 cations for soil organic matter. Environ Sci Technol 2012;46:5894-901. 2889
[117] Somasundaran P, Fuerstenau D. Mechanisms of alkyl sulfonate adsorption at the alumina-water 2890 interface1. J Phys Chem 1966;70:90-6. 2891
[118] Koopal LK, Lee EM, Böhmer MR. Adsorption of cationic and anionic surfactants on charged 2892 metal-oxide surfaces. J Colloid Interface Sci 1995;170:85-97. 2893
[119] Manne S, Cleveland J, Gaub H, Stucky G, Hansma P. Direct visualization of surfactant hemimicelles 2894 by force microscopy of the electrical double layer. Langmuir 1994;10:4409-13. 2895
[120] Hough DB, Rendall HM. Adsorption of ionic surfactants. In: Parfitt CD, Rochester CH, (eds). 2896 Adsorption from solution at the solid/liquid interface. London: Academic Press; 1983. p. 247-319. 2897
[121] Clunie JS, Ingram BT. Adsorption non-ionic surfactants. In: Parfitt CD, Rochester CH, (eds). 2898 London: Academic Press; 1983. p. 105-52. 2899
[122] Manne S, Gaub HE. Molecular-organization of surfactants at solid-liquid interfaces. Science 2900 1995;270:1480-2. 2901
[123] Manne S, Gaub HE. Force microscopy: Measurement of local interfacial forces and surface stresses. 2902 Current Opinion in Colloid & Interface Science 1997;2:145-52. 2903

115
[124] Johnson R, Nagarajan R. Modeling self-assembly of surfactants at solid–liquid interfaces. II. 2904 Hydrophilic surfaces. Colloids Surf A 2000;167:21-30. 2905
[125] Johnson RA, Nagarajan R. Modeling self-assembly of surfactants at solid/liquid interfaces. I. 2906 Hydrophobic surfaces. Colloids Surf A 2000;167:31-46. 2907
[126] Nagarajan R. Theory of micelle formation. In: Esumi K, Ueno M, (eds). Structure-performance 2908 relationships in surfactants Surfactant science series Vol. 112. 2nd ed. New York: Marcel Dekker 2909 (CRC Press); 1997. p. 1-109. 2910
[127] Koopal LK, Goloub T, de Keizer A, Sidorova MP. The effect of cationic surfactants on wetting, 2911 colloid stability and flotation of silica. Colloids Surf A 1999;151:15-25. 2912
[128] Atkin R, Craig VSJ, Wanless EJ, Biggs S. Mechanism of cationic surfactant adsorption at the 2913 solid–aqueous interface. Adv Colloid Interface Sci 2003;103:219-304. 2914
[129] Tiberg F, Brinck J, Grant L. Adsorption and surface-induced self-assembly of surfactants at the 2915 solid–aqueous interface. Current opinion in colloid & interface science 1999;4:411-9. 2916
[130] Zhmud B, Tiberg F. Interfacial dynamics and structure of surfactant layers. Adv Colloid Interface Sci 2917 2005;113:21-42. 2918
[131] Schrödle S, Richmond GL. In situ non-linear spectroscopic approaches to understanding adsorption 2919 at mineral–water interfaces. J Phys D: Appl Phys 2008;41:033001 (14pp). 2920
[132] Paria S, Khilar KC. A review on experimental studies of surfactant adsorption at the hydrophilic 2921 solid–water interface. Adv Colloid Interface Sci 2004;110:75-95. 2922
[133] Zhang R, Somasundaran P. Advances in adsorption of surfactants and their mixtures at solid/solution 2923 interfaces. Adv Colloid Interface Sci 2006;123:213-29. 2924
[134] Böhmer MR, Koopal LK. Adsorption of ionic surfactants on variable-charge surfaces. 1. Charge 2925 effects and structure of the adsorbed layer. Langmuir 1992;8:2649-59. 2926
[135] Böhmer MR, Koopal LK. Adsorption of ionic surfactants on variable-charge surfaces. 2. Molecular 2927 architecture and structure of the adsorbed layer. Langmuir 1992;8:2660-5. 2928
[136] Lee EM, Koopal LK. Adsorption of cationic and anionic surfactants on metal oxide surfaces: Surface 2929 charge adjustment and competition effects. J Colloid Interface Sci 1996;177:478-89. 2930
[137] Goloub TP, Koopal LK. Adsorption of cationic surfactants on silica. Comparison of experiment and 2931 theory. Langmuir 1997;13:673-81. 2932
[138] Goloub TP, Koopal LK, Bijsterbosch BH, Sidorova MP. Adsorption of cationic surfactants on silica. 2933 Surface charge effects. Langmuir 1996;12:3188-94. 2934
[139] Somasundaran P, Kunjappu JT. Insitu investigation of adsorbed surfactants and polymers on solids in 2935 solution. Colloids Surf 1989;37:245-68. 2936
[140] Gebhardt JE, Fuerstenau DW. The effect of trace surfactant impurities on the adsorption of sodium 2937 dodecyl sulfonate on hematite. J Colloid Interface Sci 1984;101:278-9. 2938
[141] Bhagat RP. Kinetics of sodium dodecyl benzene sulfonate adsorption on hematite and its interaction 2939 with polyacrylamide. Colloid Polym Sci 2001;279:33-8. 2940

116
[142] Wangchareansak T, Craig VS, Notley SM. Adsorption isotherms and structure of cationic surfactants 2941 adsorbed on mineral oxide surfaces prepared by atomic layer deposition. Langmuir 2942 2013;29:14748-55. 2943
[143] De Keizer A, Böhmer MR, Mehrian T, Koopal LK. Adsorption of organic ions at the 2944 solid—electrolyte interface. Interpretation of common intersection points. Colloids Surf 2945 1990;51:339-57. 2946
[144] Nevskaia DM, Guerrero-Ruiz A, Lopez-Gonzalez JD. Adsorption of polyoxyethylenic nonionic and 2947 anionic surfactants from aqueous solution: Effects induced by the addition of nacl and CaCl2. J 2948 Colloid Interface Sci 1998;205:97-105. 2949
[145] Rupprecht HH. Influence of solvents on adsorption of ionic surfactants on highly dispersed silicas. J 2950 Pharm Sci 1972;61:700-2. 2951
[146] Gao YY, Du JH, Gu TR. Hemimicelle formation of cationic surfactants at the silica-gel water 2952 interface. J Chem Soc Faraday Trans 1 1987;83:2671-9. 2953
[147] Gu T, Huang Z. Thermodynamics of hemimicellization of cetyltrimethylammonium bromide at the 2954 silica-gel water interface. Colloids Surf 1989;40:71-6. 2955
[148] Bijsterbosch BH. Characterization of silica surfaces by adsorption from solution - investigations into 2956 mechanism of adsorption of cationic surfactants. J Colloid Interface Sci 1974;47:186-98. 2957
[149] Koopal LK, Goloub TP. Self-assembly of ionic surfactants adsorbed on mineral oxides: Surface 2958 charge and salt effects. In: Sharma R, (ed). Surfactant adsorption and surface solubilization acs 2959 symposium series 615. 78. Washington: American Chemical Society; 1995. Chapter 6. p. 78-103. 2960
[150] Zhu BY, Gu TR. General isotherm equation for adsorption of surfactants at solid liquid interfaces. J 2961 Chem Soc Faraday Trans 1 1989;85:3813-7. 2962
[151] Zhu BY, Gu TR, Zhao XL. General isotherm equation for adsorption of surfactants at solid liquid 2963 interfaces .2. Applications. J Chem Soc Faraday Trans 1 1989;85:3819-24. 2964
[152] Böhmer MR, Koopal LK. Association and adsorption of nonionic flexible chain surfactants. 2965 Langmuir 1990;6:1478-84. 2966
[153] Böhmer MR, Koopal LK, Janssen R, Lee EM, Thomas RK, Rennie AR. Adsorption of nonionic 2967 surfactants on hydrophilic surfaces - an experimental and theoretical-study on association in the 2968 adsorbed layer. Langmuir 1992;8:2228-39. 2969
[154] Moudgil BM, Soto H, Somasondaran P. In: Nagaraj DR, Somasundaran P, Moudgil BM, (eds). 2970 Reagents in mineral technology. Surfactant science series Vol. New York: M. Dekker (CRC Press); 2971 1988. Chapter 3. p. 79. 2972
[155] Pashley RM, Israelachvili JN. A comparison of surface forces and interfacial properties of mica in 2973 purified surfactant solutions. Colloids Surf 1981;2:169-87. 2974
[156] Herder PC. Interactions between mica surfaces in dodecyl-and octylammonium chloride solutions. J 2975 Colloid Interface Sci 1990;134:346-56. 2976
[157] Menezes JL, Yan J, Sharma MM. The mechanism of alteration of macroscopic contact angles by the 2977 adsorption of surfactants. Colloids Surf 1989;38:365-90. 2978
117
[158] Mishra SK. In: Nagaraj DR, Somasundaran P, Moudgil BM, (eds). Reagents in mineral technology. 2979 Surfactant science series Vol. New York: M. Dekker(CRC Press); 1987. Chapter 7. p. 195. 2980
[159] Novich BE. Flotation response prediction from interfacial properties. Colloids Surf 1990;46:255-69. 2981 [160] Levitz P. Adsorption of non ionic surfactants at the solid/water interface. Colloids Surf A 2982
2002;205:31-8. 2983 [161] Denoyel R, Rouquerol J. Thermodynamic (including microcalorimetry) study of the adsorption of 2984
nonionic and anionic surfactants onto silica, kaolin, and alumina. J Colloid Interface Sci 2985 1991;143:555-72. 2986
[162] Gonzalez G, Travalloni-Louvisse AM. The effect of Triton X-100 and ethanol on the wettability of 2987 quartz. Langmuir 1989;5:26-9. 2988
[163] Levitz P, Van Damme H, Keravis D. Fluorescence decay study of the adsorption of nonionic 2989 surfactants at the solid-liquid interface. 1. Structure of the adsorption layer on a hydrophilic solid. J 2990 Phys Chem 1984;88:2228-35. 2991
[164] Levitz P, Van Damme H. Fluorescence decay study of the adsorption of nonionic surfactants at the 2992 solid-liquid interface. 2. Influence of polar chain length. J Phys Chem 1986;90:1302-10. 2993
[165] Postmus BR, Leermakers FAM, Cohen Stuart MA. Self-consistent field modeling of non-ionic 2994 surfactants at the silica-water interface: Incorporating molecular detail. Langmuir 2008;24:3960-9. 2995
[166] Del Hoyo C, Dorado C, Rodríguez-Cruz M, Sánchez-Martín M. Physico-chemical study of selected 2996 surfactant-clay mineral systems. J Therm Anal Calorim 2008;94:227-34. 2997
[167] Poirier JE, Cases JM. Anionic surfactant adsorption onto silicate minerals the role of the cations. 2998 Colloids Surf 1991;55:333-44. 2999
[168] Siracusa PA, Somasundaran P. Adsorption desorption and hysteresis of sulfonates on kaolinite - pH 3000 effects. J Colloid Interface Sci 1986;114:184-93. 3001
[169] Siracusa PA, Somasundaran P. Mechanism of hysteresis in sulfonate kaolinite adsorption desorption 3002 systems - chromatographic-separation of isomers. J Colloid Interface Sci 1987;120:100-9. 3003
[170] Ananthapadmanabhan KP, Somasundaran P. Mechanism for adsorption maximum and hysteresis in a 3004 sodium dodecylbenzenesulfonate/kaolinite system. Colloids Surf 1983;7:105-14. 3005
[171] Lagaly G, Dékany I. Adsorption on hydrophobized surfaces: Clusters and self-organization. Adv 3006 Colloid Interface Sci 2005;114:189-204. 3007
[172] Bergaya F, Theng BKG, Lagaly G. Modified clays and clay minerals. In: Bergaya F, Lagaly G, (eds). 3008 Handbook of clay science. 2nd ed: Elsevier; 2013. p. 261-3. 3009
[173] Lagaly G, Ogawa M, Dekany I. Clay mineral organic interactions. In: Bergaya F, Lagaly G, (eds). 3010 Handbook of clay science. 2nd ed: Elsevier; 2013. Chapter 7.3. p. 309-78. 3011
[174] de Paiva LB, Morales AR, Díaz FRV. Organoclays: Properties, preparation and applications. Appl 3012 Clay Sci 2008;42:8-24. 3013
[175] Lagaly G. Interaction of alkylamines with different types of layered compounds. Solid State Ionics 3014 1986;22:43-51. 3015
[176] Osman MA, Ploetze M, Skrabal P. Structure and properties of alkylammonium monolayers 3016 self-assembled on montmorillonite platelets. J Phys Chem B 2004;108:2580-8. 3017

118
[177] Heinz H, Vaia RA, Krishnamoorti R, Farmer BL. Self-assembly of alkylammonium chains on 3018 montmorillonite: Effect of chain length, head group structure, and cation exchange capacity. Chem 3019 Mater 2007;19:59-68. 3020
[178] Liu X, Lu X, Wang R, Zhou H, Xu S. Interlayer structure and dynamics of 3021 alkylammonium-intercalated smectites with and without water: A molecular dynamics study. Clays 3022 Clay Miner 2007;55:554-64. 3023
[179] Mehrian T, De Keizer A, Lyklema J. Effect of temperature on the adsorption of organic cations on 3024 charged surfaces. Langmuir 1991;7:3094-8. 3025
[180] Mehrian T, De Keizer A, Korteweg A, Lyklema J. Thermodynamics of adsorption of 3026 dodecylpyridinium chloride on Na-kaolinite. Colloids Surf A 1993;73:133-43. 3027
[181] Mehrian T, Dekeizer A, Korteweg AJ, Lyklema J. Thermodynamics of micellization of 3028 n-alkylpyridinium chlorides. Colloids Surf A 1993;71:255-67. 3029
[182] Patterson D, Barbe M. Enthalpy-entropy compensation and order in alkane and aqueous systems. J 3030 Phys Chem 1976;80:2435-6. 3031
[183] Shinoda K. Iceberg formation and solubility. J Phys Chem 1977;81:1300-2. 3032 [184] Xu S, Boyd SA. Cationic surfactant adsorption by swelling and nonswelling layer silicates. Langmuir 3033
1995;11:2508-14. 3034 [185] Wang J, Han B, Dai M, Yan H, Li Z, Thomas R. Effects of chain length and structure of cationic 3035
surfactants on the adsorption onto Na–kaolinite. J Colloid Interface Sci 1999;213:596-601. 3036 [186] Qi L, Liao W, Bi Z. Adsorption of conventional and gemini cationic surfactants in nonswelling and 3037
swelling layer silicate. Colloids Surf A 2007;302:568-72. 3038 [187] Li Z, Bowman RS. Counterion effects on the sorption of cationic surfactant and chromate on natural 3039
clinoptilolite. Environ Sci Technol 1997;31:2407-12. 3040 [188] Li Z, Gallus L. Surface configuration of sorbed hexadecyltrimethylammonium on kaolinite as 3041
indicated by surfactant and counterion sorption, cation desorption, and ftir. Colloids Surf A 3042 2005;264:61-7. 3043
[189] Li Z, Gallus L. Adsorption of dodecyl trimethylammonium and hexadecyl trimethylammonium onto 3044 kaolinite—competitive adsorption and chain length effect. Appl Clay Sci 2007;35:250-7. 3045
[190] Borden D, Giese RF. Baseline studies of the clay minerals society source clays: Cation exchange 3046 capacity measurements by the ammonia-electrode method. Clays Clay Miner 2001;49:444-5. 3047
[191] Ammann L. Cation exchange and adsorption on clays and clay minerals. Dissertation: 3048 Christian-Albrechts-Universität, Kiel; 2003. 3049
[192] Malek NANN, Ramli NI. Characterization and antibacterial activity of cetylpyridinium bromide 3050 (cpb) immobilized on kaolinite with different cpb loadings. Appl Clay Sci 2015;109:8-14. 3051
[193] Tertre E, Castet S, Berger G, Loubet M, Giffaut E. Surface chemistry of kaolinite and 3052 Na-montmorillonite in aqueous electrolyte solutions at 25 and 60 c: Experimental and modeling study. 3053 Geochim Cosmochim Acta 2006;70:4579-99. 3054
[194] Hanna HS, Somasundaran P. Equilibration of kaolinite in aqueous inorganic and surfactant solutions. 3055 J Colloid Interface Sci 1979;70:181-91. 3056
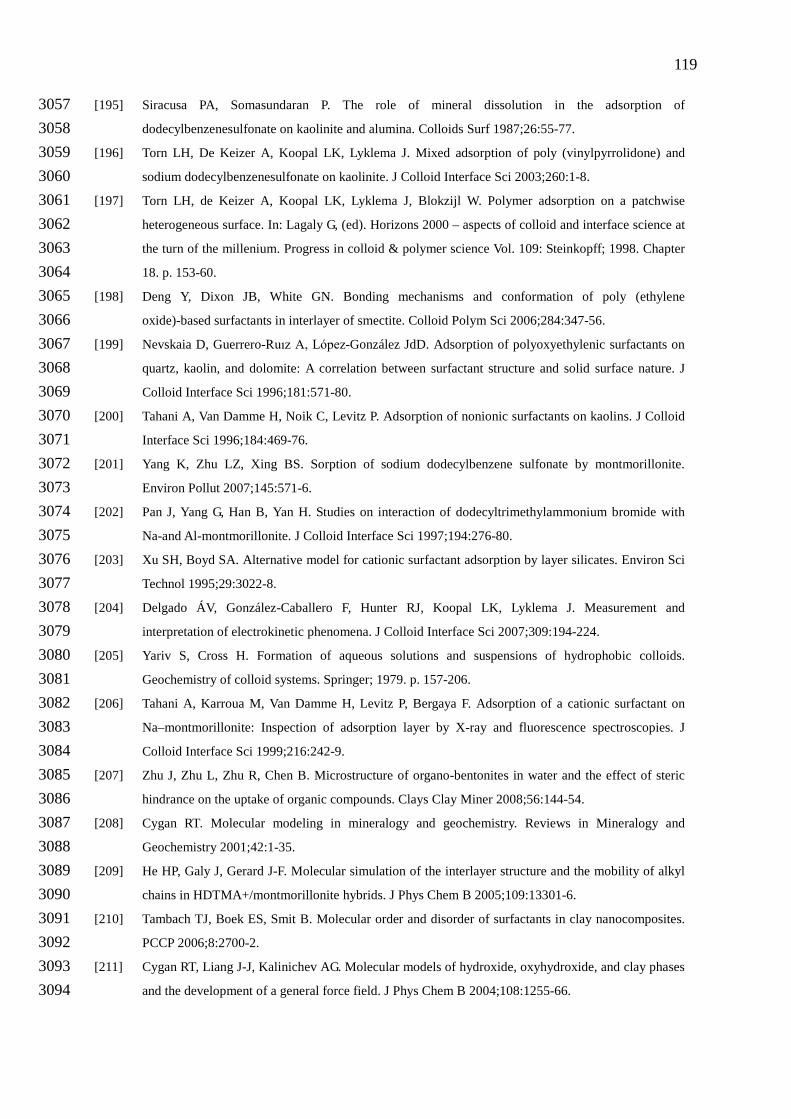
119
[195] Siracusa PA, Somasundaran P. The role of mineral dissolution in the adsorption of 3057 dodecylbenzenesulfonate on kaolinite and alumina. Colloids Surf 1987;26:55-77. 3058
[196] Torn LH, De Keizer A, Koopal LK, Lyklema J. Mixed adsorption of poly (vinylpyrrolidone) and 3059 sodium dodecylbenzenesulfonate on kaolinite. J Colloid Interface Sci 2003;260:1-8. 3060
[197] Torn LH, de Keizer A, Koopal LK, Lyklema J, Blokzijl W. Polymer adsorption on a patchwise 3061 heterogeneous surface. In: Lagaly G, (ed). Horizons 2000 – aspects of colloid and interface science at 3062 the turn of the millenium. Progress in colloid & polymer science Vol. 109: Steinkopff; 1998. Chapter 3063 18. p. 153-60. 3064
[198] Deng Y, Dixon JB, White GN. Bonding mechanisms and conformation of poly (ethylene 3065 oxide)-based surfactants in interlayer of smectite. Colloid Polym Sci 2006;284:347-56. 3066
[199] Nevskaia D, Guerrero-Ruız A, López-González JdD. Adsorption of polyoxyethylenic surfactants on 3067 quartz, kaolin, and dolomite: A correlation between surfactant structure and solid surface nature. J 3068 Colloid Interface Sci 1996;181:571-80. 3069
[200] Tahani A, Van Damme H, Noik C, Levitz P. Adsorption of nonionic surfactants on kaolins. J Colloid 3070 Interface Sci 1996;184:469-76. 3071
[201] Yang K, Zhu LZ, Xing BS. Sorption of sodium dodecylbenzene sulfonate by montmorillonite. 3072 Environ Pollut 2007;145:571-6. 3073
[202] Pan J, Yang G, Han B, Yan H. Studies on interaction of dodecyltrimethylammonium bromide with 3074 Na-and Al-montmorillonite. J Colloid Interface Sci 1997;194:276-80. 3075
[203] Xu SH, Boyd SA. Alternative model for cationic surfactant adsorption by layer silicates. Environ Sci 3076 Technol 1995;29:3022-8. 3077
[204] Delgado ÁV, González-Caballero F, Hunter RJ, Koopal LK, Lyklema J. Measurement and 3078 interpretation of electrokinetic phenomena. J Colloid Interface Sci 2007;309:194-224. 3079
[205] Yariv S, Cross H. Formation of aqueous solutions and suspensions of hydrophobic colloids. 3080 Geochemistry of colloid systems. Springer; 1979. p. 157-206. 3081
[206] Tahani A, Karroua M, Van Damme H, Levitz P, Bergaya F. Adsorption of a cationic surfactant on 3082 Na–montmorillonite: Inspection of adsorption layer by X-ray and fluorescence spectroscopies. J 3083 Colloid Interface Sci 1999;216:242-9. 3084
[207] Zhu J, Zhu L, Zhu R, Chen B. Microstructure of organo-bentonites in water and the effect of steric 3085 hindrance on the uptake of organic compounds. Clays Clay Miner 2008;56:144-54. 3086
[208] Cygan RT. Molecular modeling in mineralogy and geochemistry. Reviews in Mineralogy and 3087 Geochemistry 2001;42:1-35. 3088
[209] He HP, Galy J, Gerard J-F. Molecular simulation of the interlayer structure and the mobility of alkyl 3089 chains in HDTMA+/montmorillonite hybrids. J Phys Chem B 2005;109:13301-6. 3090
[210] Tambach TJ, Boek ES, Smit B. Molecular order and disorder of surfactants in clay nanocomposites. 3091 PCCP 2006;8:2700-2. 3092
[211] Cygan RT, Liang J-J, Kalinichev AG. Molecular models of hydroxide, oxyhydroxide, and clay phases 3093 and the development of a general force field. J Phys Chem B 2004;108:1255-66. 3094

120
[212] Kumar PP, Kalinichev AG, Kirkpatrick RJ. Hydration, swelling, interlayer structure, and hydrogen 3095 bonding in organolayered double hydroxides: Insights from molecular dynamics simulation of 3096 citrate-intercalated hydrotalcite. J Phys Chem B 2006;110:3841-4. 3097
[213] Zhou Q, Shen W, Zhu JX, Zhu RL, He HP, Zhou JH, Yuan P. Structure and dynamic properties of 3098 water saturated CTMA-montmorillonite: Molecular dynamics simulations. Appl Clay Sci 3099 2014;97-98:62-71. 3100
[214] Lokar WJ, Koopal LK, Leermakers FAM, Ducker WA. Self-consistent field analysis of ionic 3101 surfactant adsorption regulation in the aqueous film between two neutral solids. J Phys Chem B 3102 2004;108:3633-43. 3103
[215] Lokar WJ, Koopal LK, Leermakers FAM, Ducker WA. Confinement-induced phase behavior and 3104 adsorption regulation of ionic surfactants in the aqueous film between charged solids. J Phys Chem B 3105 2004;108:15033-42. 3106
[216] Koopal LK, Leermakers FAM, Lokar WJ, Ducker WA. Confinement-induced phase transition and 3107 hysteresis in colloidal forces for surfactant layers on hydrophobic surfaces. Langmuir 3108 2005;21:10089-95. 3109
[217] Leermakers FAM, Koopal LK, Lokar WJ, Ducker WA. Modeling of confinement-induced phase 3110 transitions for surfactant layers on amphiphilic surfaces. Langmuir 2005;21:11534-45. 3111
[218] Rheinländer T, Klumpp E, Schwuger MJ. On the adsorption of hydrophobic pollutants on 3112 surfactant/clay complexes: Comparison of the influence of a cationic and a nonionic surfactant. J 3113 Dispersion Sci Technol 1998;19:379-98. 3114
[219] Sonon LS, Thompson ML. Sorption of a nonionic polyoxyethylene lauryl ether surfactant by 2 : 1 3115 layer silicates. Clays Clay Miner 2005;53:45-54. 3116
[220] Backhaus WK, Klumpp E, Narres H-D, Schwuger MJ. Adsorption of 2, 4-dichlorophenol on 3117 montmorillonite and silica: Influence of nonionic surfactants. J Colloid Interface Sci 2001;242:6-13. 3118
[221] Giles CH, Smith D, Huitson A. A general treatment and classification of the solute adsorption 3119 isotherm. I. Theoretical. J Colloid Interface Sci 1974;47:755-65. 3120
[222] Lee J-F, Liao P-M, Kuo C-C, Yang H-T, Chiou CT. Influence of a nonionic surfactant (Triton X-100) 3121 on contaminant distribution between water and several soil solids. J Colloid Interface Sci 3122 2000;229:445-52. 3123
[223] Yang K, Zhu L, Zhao B. Minimizing losses of nonionic and anionic surfactants to a montmorillonite 3124 saturated with calcium using their mixtures. J Colloid Interface Sci 2005;291:59-66. 3125
[224] Koopal LK. The effect of polymer polydispersity on the adsorption isotherm. J Colloid Interface Sci 3126 1981;83:116-29. 3127
[225] Shen Y-H. Preparations of organobentonite using nonionic surfactants. Chemosphere 3128 2001;44:989-95. 3129
[226] Deng Y, Dixon JB, White GN. Intercalation and surface modification of smectite by two non-ionic 3130 surfactants. Clays Clay Miner 2003;51:150-61. 3131
[227] Guégan R, Gautier M, Bény J-M, Muller F. Adsorption of a C10E3 non-ionic surfactant on a 3132 Ca-smectite. Clays Clay Miner 2009;57:502-9. 3133

121
[228] Guégan R. Intercalation of a nonionic surfactant (C10E3) bilayer into a Na-montmorillonite clay. 3134 Langmuir 2010;26:19175-80. 3135
[229] Sips R. On the structure of a catalyst surface. J Chem Phys 1948;16:490-5. 3136 [230] Sips R. On the structure of a catalyst surface. II. J Chem Phys 1950;18:1024-6. 3137 [231] Bolt GH, Bruggenwert MGM. Soil chemistry, A. Basic elements. Amsterdam: Elsevier; 1978. 3138 [232] Koopal LK, Ralston J. Chain-length effects in the adsorption of surfactants at aqueous interfaces - 3139
comparison of existing adsorption models with a new model. J Colloid Interface Sci 3140 1986;112:362-79. 3141
[233] Koopal LK, Keltjens L. Adsorption of ionic surfactants on charged solids. Adsorption models. 3142 Colloids Surf 1986;17:371-88. 3143
[234] Scamehorn JF, Schechter RS, Wade WH. Adsorption of surfactants on mineral oxide surfaces from 3144 aqueous-solutions .1. Isomerically pure anionic surfactants. J Colloid Interface Sci 1982;85:463-78. 3145
[235] Drach M, Rudziński W, Narkiewicz-Michalek J. Theoretical modeling of ionic surfactant adsorption 3146 on mineral oxide surfaces. J Dispersion Sci Technol 2000;21:683-710. 3147
[236] Lajtar L, Narkiewicz-Michalek J, Rudzinski W, Partyka S. A new theoretical approach to adsorption 3148 of ionic surfactants at water/oxide interfaces: Studies of the mechanism of cationic surfactant 3149 adsorption. Langmuir 1994;10:3754-64. 3150
[237] Li B, Ruckenstein E. Adsorption of ionic surfactants on charged solid surfaces from aqueous 3151 solutions. Langmuir 1996;12:5052-63. 3152
[238] Leermakers FAM, Scheutjens JMHM. Statistical thermodynamics of association colloids. I. Lipid 3153 bilayer membranes. J Chem Phys 1988;89:3264-74. 3154
[239] Böhmer MR, Koopal LK, Lyklema J. Micellization of ionic surfactants: Calculations based on a 3155 self-consistent field lattice model. J Phys Chem 1991;95:9569-78. 3156
[240] Leermakers FAM. Physical chemistry and soft matter (pcc); to research; to self-consistent field theory 3157 and its applications (prof.Dr.Ir. Frans leermakers). 3158 http://www.wageningenur.nl/en/Expertise-Services/Chair-groups.htm 3159
[241] Keizer M, Van Riemsdijk WH. ECOSAT. Department of Environmental Science, Subdepartment Soil 3160 Science and Plant Nutrition: Wageningen Agricultural University Wageningen; 1998. 3161 http://www.wageningenur.nl/en/Expertise-Services/Chair-groups.htm. 3162
[242] Gustafsson JP. Visual MINTEQ ver. 3.0 / 3.1. KTH Royal Institute of Technology, Sweden, email: 3163 [email protected]. 3164
[243] Kinniburgh DG, Tang CK. FIT; Technical Report WD/93/23. British Geological Survey, Natural 3165 Environment Research Council.: Keyworth, Great Britain; 1993. 3166
[244] Zhu LZ, Yang K, Lou BF, Yuan BH. A multi-component statistic analysis for the influence of 3167 sediment/soil composition on the sorption of a nonionic surfactant (Triton X-100) onto natural 3168 sediments/soils. Water Res 2003;37:4792-800. 3169
[245] Davis JA. Adsorption of natural dissolved organic matter at the oxide/water interface. Geochim 3170 Cosmochim Acta 1982;46:2381-93. 3171

122
[246] Varadachari C, Chattopadhyay T, Ghosh K. Complexation of humic substances with oxides of iron 3172 and aluminum. Soil Sci 1997;162:28-34. 3173
[247] Gu B, Schmitt J, Chen Z, Liang L, McCarthy JF. Adsorption and desorption of natural organic matter 3174 on iron oxide: Mechanisms and models. Environ Sci Technol 1994;28:38-46. 3175
[248] Vermeer AWP, Van Riemsdijk WH, Koopal LK. Adsorption of humic acid to mineral particles. 1. 3176 Specific and electrostatic interactions. Langmuir 1998;14:2810-9. 3177
[249] Saito T, Koopal LK, van Riemsdijk WH, Nagasaki S, Tanaka S. Adsorption of humic acid on 3178 goethite: Isotherms, charge adjustments, and potential profiles. Langmuir 2004;20:689-700. 3179
[250] Murti GSR, Volk VV, Jackson ML. Soil adsorption of linear alkylate sulfonate. Soil Sci Soc Am Proc 3180 1966;30:685-&. 3181
[251] Urano K, Saito M, Murata C. Adsorption of surfactants on sediments. Chemosphere 3182 1984;13:293-300. 3183
[252] Hand VC, Williams GK. Structure-activity-relationships for sorption of linear alkylbenzenesulfonates. 3184 Environ Sci Technol 1987;21:370-3. 3185
[253] McAvoy DC, White CE, Moore BL, Rapaport RA. Chemical fate and transport in a domestic septic 3186 system - sorption and transport of anionic and cationic surfactants. Environ Toxicol Chem 3187 1994;13:213-21. 3188
[254] Fytianos K, Voudrias E, Papamichali A. Behavior and fate of linear alkylbenzene sulfonate in 3189 different soils. Chemosphere 1998;36:2741-6. 3190
[255] Westall JC, Chen H, Zhang WJ, Brownawell BJ. Sorption of linear alkylbenzenesulfonates on 3191 sediment materials. Environ Sci Technol 1999;33:3110-8. 3192
[256] Rodriguez-Cruz MS, Sanchez-Martin MJ, Sanchez-Camazano M. A comparative study of adsorption 3193 of an anionic and a non-ionic surfactant by soils based on physicochemical and mineralogical 3194 properties of soils. Chemosphere 2005;61:56-64. 3195
[257] Somasundaran P, Snell ED, Xu Q. Adsorption behavior of alkylarylethoxylated alcohols on silica. J 3196 Colloid Interface Sci 1991;144:165-73. 3197
[258] Ahmed F, Ishiguro M. Effect of adsorption site potential on adsorption of sodium 3198 dodecylbenzenesulfonate in highly humic volcanic ash soil. Soil Sci Plant Nutr 2015;61:432-9. 3199
[259] Ahmed F, Ishiguro M, Moriguchi K. Adsorption of sodium dodecylbenzene sulfonate on highly 3200 humic non-allophanic andisol at high-electrolyte concentration. J Jpn Soc Soil Phys 2012:45-54. 3201
[260] Inoue K, Kaneko K, Yoshida M. Adsorption of dodecylbenzenesulfonates by soil colloids and 3202 influence of soil colloids on their degradation. Soil Sci Plant Nutr 1978;24:91-102. 3203
[261] Dick SG, Fuersten.D.W., Healy TW. Adsorption of alkylbenzene sulfonate (abs) surfactants at 3204 alumina-water interface. J Colloid Interface Sci 1971;37:595-&. 3205
[262] Ishiguro M, Song KC, Yuita K. Ion-transport in an allophanic andisol under the influence of variable 3206 charge. Soil Sci Soc Am J 1992;56:1789-93. 3207
[263] Iwata S, Tabuchi T, Warkentin BP. Soil-water interactions: Mechanisms and applications. New York: 3208 Marcel Dekker; 1995. 3209

123
[264] Ying GG. Fate, behavior and effects of surfactants and their degradation products in the environment. 3210 Environ Int 2006;32:417-31. 3211
[265] Atay NZ, Yenigun O, Asutay M. Sorption of anionic surfactants SDS, AOT and cationic surfactant 3212 hyamine 1622 on natural soils. Water Air Soil Pollut 2002;136:55-67. 3213
[266] Bera A, Kumar T, Ojha K, Mandal A. Adsorption of surfactants on sand surface in enhanced oil 3214 recovery: Isotherms, kinetics and thermodynamic studies. Appl Surf Sci 2013;284:87-99. 3215
[267] Sanchez-Martin MJ, Rodriguez-Cruz MS, Sanchez-Camazano M. Study of the desorption of linuron 3216 from soils to water enhanced by the addition of an anionic surfactant to soil-water system. Water Res 3217 2003;37:3110-7. 3218
[268] Deshpande S, Shiau BJ, Wade D, Sabatini DA, Harwell JH. Surfactant selection for enhancing ex situ 3219 soil washing. Water Res 1999;33:351-60. 3220
[269] Paria S. Surfactant-enhanced remediation of organic contaminated soil and water. Adv Colloid 3221 Interface Sci 2008;138:24-58. 3222
[270] Lee JF, Hsu MH, Lee CK, Chao HP, Chen BH. Effects of soil properties on surfactant adsorption. J 3223 Chin Inst Eng 2005;28:375-9. 3224
[271] Li XX, Yang GP, Cao XY. Sorption behaviors of sodium dodecylbenzene sulfonate (sdbs) on marine 3225 sediments. Water Air Soil Pollut 2008;194:23-30. 3226
[272] Xu SH, Boyd SA. Cationic surfactant sorption to a vermiculitic subsoil via hydrophobic bonding. 3227 Environ Sci Technol 1995;29:312-20. 3228
[273] Paria S, Yuet PK. Effects of chain length and electrolyte on the adsorption of n-alkylpyridinium 3229 bromide surfactants at sand-water interfaces. Ind Eng Chem Res 2006;45:712-8. 3230
[274] Ishiguro M, Torigoe T, Kameoka Y, Akae T. Linear anionic surfactant (SDS) transport in high humic 3231 volcanic ash soil and its permeability. Irrig Drain Rural Eng J 2008;76:485-91. 3232
[275] Kang S, Jeong HY. Sorption of a nonionic surfactant Tween 80 by minerals and soils. J Hazard Mater 3233 2015;284:143-50. 3234
[276] Koopal LK, Avena MJ. A simple model for adsorption kinetics at charged solid–liquid interfaces. 3235 Colloids Surf A 2001;192:93-107. 3236
[277] West CC. Surfactant-enhanced solubilization of tetrachloroethylene and degradation products in 3237 pump and treat remediation. ACS Symp Ser 1992;491:149-58. 3238
[278] Rouse JD, Sabatini DA, Harwell JH. Minimizing surfactant losses using twin-head anionic 3239 surfactants in subsurface remediation. Environ Sci Technol 1993;27:2072-8. 3240
[279] Allred B, Brown GO. Surfactant-induced reductions in soil hydraulic conductivity. Ground Water 3241 Monit Rem 1994;14:174-84. 3242
[280] Liu MW, Roy D. Surfactant-induced interactions and hydraulic conductivity changes in soil. Waste 3243 Manage (Oxford) 1995;15:463-70. 3244
[281] Gabr MA, Chen J, Thomas R. Soil clogging during surfactant-enhanced flushing of 3245 naphthalene-contaminated sand-kaolinite. Can Geotech J 1998;35:976-85. 3246
[282] Gardner KH, Arias MS. Clay swelling and formation permeability reductions induced by a nonionic 3247 surfactant. Environ Sci Technol 2000;34:160-6. 3248

124
[283] Tumeo MA. A survey of the causes of surfactant-induced changes in hydraulic conductivity. Ground 3249 Water Monit Rem 1997;17:138-44. 3250
[284] Warkentin BP. Soil structure: A history from tilth to habitat. Adv Agron 2008;97:239-72. 3251 [285] Quirk JP. Interparticle forces - a basis for the interpretation of soil physical behavior. Adv Agron 3252
1994;53:121-83. 3253 [286] Low PF. Physical chemistry of clay-water interaction. Adv Agron 1961;13:269-327. 3254 [287] Lagaly G, Ziesmer S. Colloid chemistry of clay minerals: The coagulation of montmorillonite 3255
dispersions. Adv Colloid Interface Sci 2003;100:105-28. 3256 [288] Evangelou V. Environmental soil and water chemistry. New York: Wiley Interscience; 1998. 3257 [289] Hillel D. Environmental soil physics: Fundamentals, applications, and environmental considerations: 3258
Academic press; 1998. 3259 [290] Ishiguro M. Ion transport and permeability in an allophanic andisol at low pH. Soil Sci Plant Nutr 3260
2005;51:637-40. 3261 [291] Ishiguro M, Nakaishi K, Nakajima T. Saturated hydraulic conductivity of a volcanic ash soil affected 3262
by repulsive potential energy in a multivalent anionic system. Colloids Surf A 2003;230:81-8. 3263 [292] Ishiguro M, Nakajima T. Hydraulic conductivity of an allophanic andisol leached with dilute acid 3264
solutions. Soil Sci Soc Am J 2000;64:813-8. 3265 [293] Suarez D, Rhoades J, Lavado R, Grieve C. Effect of pH on saturated hydraulic conductivity and soil 3266
dispersion. Soil Sci Soc Am J 1984;48:50-5. 3267 [294] Callaghan MV, Cey EE, Bentley LR. Hydraulic conductivity dynamics during salt leaching of a sodic, 3268
structured subsoil. Soil Sci Soc Am J 2014;78:1563-74. 3269 [295] McNeal BL, Coleman NT. Effect of solution composition on soil hydraulic conductivity. Soil Sci Soc 3270
Am Proc 1966;30:308-12. 3271 [296] McNeal BL, Layfield DA, Norvell WA, Rhoades JD. Factors influencing hydraulic conductivity of 3272
soils in presence of mixed-salt solutions. Soil Sci Soc Am Proc 1968;32:187-90. 3273 [297] Shainberg I, Rhoades J, Prather R. Effect of low electrolyte concentration on clay dispersion and 3274
hydraulic conductivity of a sodic soil. Soil Sci Soc Am J 1981;45:273-7. 3275 [298] Mustafa M, Letey J. The effect of two nonionic surfactants on aggregate stability of soils. Soil Sci 3276
1969;107:343-7. 3277 [299] Ishiguro M, Fujii T. Upward infiltration into porous media as affected by wettability and anionic 3278
surfactants. Soil Sci Soc Am J 2008;72:741-9. 3279
3280

125
3281
Figure captions 3282
3283
Fig. 1. Some examples of synthetic and natural surfactants. 3284
Fig. 2. Schematic illustration of the effect of surfactants on the surface tension of dilute 3285 aqueous solutions (a, c, d) and the adsorption isotherm (b) that can be obtained from 3286 figure (a) through application of the Gibbs equation. The kink in the surface tension 3287 plots (a, c, d) is the CMC. 3288
Fig. 3. Set of surface tension vs. ln c curves for aqueous solutions of sodium dodecyl 3289 pyridinium chloride (DPC) in the presence of different concentrations of NaCl ( 0 3290 mmol/L; 5 mmol/L; 20 mmol/L; Δ 100 mmol/L). 3291
Fig. 4. Example of proton binding to a humic acid at four KCl concentrations. Data from ref. 3292 [45]. 3293
Fig. 5. Comparison of the charge density curves vs. pH and ionic strength of gibbsite, silica 3294 and hematite. The ionic strength values of the curves of hematite are (∆) 0.002 M, 3295 (X) 0.01 M, and (O) 0.1 M. Data from ref. [81-83]. 3296
Fig. 6. Proton charge density of the montmorillonite for three values of the 1-1 electrolyte 3297 concentration (symbols) and model predictions (curves). Data from ref. [92]. 3298
Fig. 7. Binding of C12PC and C16PC to PAHA (mmol surfactant/g PAHA) at I = 0.025 M 3299 and (a) pH 5, (b) pH 7, and (c) pH 10. The reduced monomer concentration, c/CMC, 3300 normalizes the concentration differences betwe en C12PC and C16PC. The arrows 3301 indicate the amount of negative charge (mmol/g) of PAHA in 0.02 M KNO3 at the 3302 given pH values. Data from ref. [97]. 3303
Fig. 8. Binding isotherms for C12P+–AFA system as a function of pH at: (a) I = 0.03 mol 3304 dm−3 and (b) I = 0.10 mol dm−3, (*) pH 3.97, () pH 7.41, () pH 9.18, () pH 3305 10.01. Data from ref. [99]. 3306
Fig. 9. Binding isotherms for (a) AHA system and (b) AFA system. Data from ref. [98]. 3307
Fig. 10. Binding isotherms of C16P+ to humic acid (PAHA) at two ionic strengths, (a) 3308

126
log-normal plot with H+ release, (b) double logarithmic plot, and binding isotherms 3309 of C12P+ to anionic polyelectrolyte (SPSS) at three ionic strengths, (c) log-normal 3310 plot, (d) double logarithmic plot. Data from ref.[103, 112]. 3311
Fig. 11. Influence of cationic surfactant carbon-chain length on binding to purified Aldrich 3312 humic acid (PAHA). C16P+ = cetylpyridinium; C12P+ = dodecylpyridinium; 0.005 3313 M NaCl. (a) log-normal plot, (b) double logarithmic plot. Data from ref. [103]. 3314
Fig. 12. Binding of cationic surfactant (dodecylpyridinium chloride, C12PC) to various 3315 humic and fulvic acids at 0.005 M NaCl and pH 5. PAHA, Aldrich humic acid; 3316 IHA, Inogashira humic acid; DHA, Dando humic acid; SFA, Strichen fulvic acid; 3317 LFA, Laurentian fulvic acid. (a) log-normal plot, (b) double logarithmic plot. Data 3318 from ref.[103]. 3319
Fig. 13. Benzyldimethyldodecyl-ammonium chloride (C12-BAC) sorption to purified 3320 Aldrich humic acid (AHA) determined at different background electrolytes at pH 6 3321 (A) and at different pH in the presence of 5 mM NaCl or CaCl2 (B). The isotherms 3322 were fitted with Freundlich equation with Freundlich exponent (nF) of 0.8. Data 3323 from ref. [114]. 3324
Fig. 14. Adsorption isotherms of SNBS (sodium C9-benzene sulfonate; pH 4.1) and DPC 3325 (C12-pyridinium chloride; pH 8.0) on rutile at 0.01 M NaCl. Panel (a) is a double 3326 logarithmic representation of the isotherms and depicts the typical four-regions 3327 isotherms; panel (b) depicts the same results in a semi-logarithmic plot. Data from 3328 ref. [118]. 3329
Fig. 15. Adsorption isotherms of sodium nonyl-benzene-sulfonate (SNBS) on rutile at pH 3330 4.1 and three salt concentrations are depicted as log-log (a) and lin-log (b) plots. 3331 Data from ref.[134]. 3332
Fig. 16. Adsorption of SNBS and the net proton adsorption, Γ(0), on rutile as a function of 3333 the equilibrium SNBS concentration at three pH values and two NaCl 3334 concentrations; the pHpznpc of rutile is 5.85. Data from ref. [134]. 3335
Fig. 17. Adsorption isotherms for C12PC on Aerosil, measured at pH 9 and two salt 3336 concentrations (a) as log-log plot and (b) as lin-log plot. Data from ref. [137]. 3337
Fig. 18. Effect of DPC adsorption on the surface charge of Aerosil, Γ(0), at pH 9. Data from 3338 ref. [138]. 3339

127
Fig. 19. Adsorption of tertiair-octylbenzene polyoxyethylene glycol surfactants on Spherosil 3340 silica at 25 oC and pH 6.5. The TBE surfactants are monodisperse [TBE = 3341 C8Φ(EO)Np], the TX surfactants are polydisperse [TX = C8Φ(EO)<Np>] Np is 3342 indicated in the figure. Data from ref. [160]. 3343
Fig. 20. Adsorption of C12PC on sodium kaolinite as a function of the NaCl concentration at 3344 pH 5 and 20 oC; the horizontal line indicates the isoelectric situation and the axis on 3345 the right side indicates the sign of the electrophoretic mobility. Data from ref. [179]. 3346
Fig. 21. Adsorption isotherms of C16TAC (=HDTMA) on kaolinite at pH 6.5 and two NaCl 3347 concentrations. The adsorption is expressed relative to the CEC at pH 6.5, which is 3348 40 µmol/g. Data from ref. [184] 3349
Fig. 22. Abstraction (adsorption + precipitation) isotherms of sodium dodecylbenzene 3350 sulfonate (SDBS) - kaolinite system at different pH (indicated), 0.1M NaCl and 25 3351 oC. Data from ref. [195]. 3352
Fig. 23. Adsorption isotherms of three nonionic surfactants on kaolinite at pH 3.8 and 3353 T=25oC. The three surfactants are polydisperse alkylbenzene polyoxyethelenes 3354 form the Triton series: TX100 = C8H17ΦEO9.5, TX165 = C8H17ΦEO16 and TX305 = 3355 C8H17ΦEO30. Data from ref. [161]. 3356
Fig. 24. Characteristic C16TAC (=HDTMA) adsorption isotherms on Na- and Ca-saturated 3357 montmorillonite (Wyoming montmorillonite, SWy-1; CEC = 900 µmol/g), 3358 compared with that on Na-kaolinite (Source Clays Repository, Dept. of Geology, 3359 University of Missouri, Columbia; CEC = 40 µmol/g at pH 6.5).The adsorbed 3360 amount is expressed relative to the CEC, the concentration of C16TAC 3361 (=HDTMA) is in mol/L. The clays were free of organic matter and homo-ionic 3362 (washing first with a NaCl solution and for Ca-clays subsequently with a CaC12 3363 solution). Data from ref. [203]. 3364
Fig. 25. (a) Adsorption of C16TAC (=HDTMA) on Na-SWy-1 in 5 mmol/L NaCl solution 3365 and the concomitant Na release. (b) Electrophoretic mobility (solid symbols) and 3366 degree of dispersion stability (open symbols) of C16TAC-Na-SWy-1 as a function 3367 of the C16TAC adsorption; (c) d(001)-spacings of C16TAC-Na-SWy-1 obtained by 3368 X-ray diffraction as a function of C16TAC adsorption at three different water 3369 contents (dried at different relative humidity, the RH values are indicated). The 3370 C16TAC adsorption is expressed relative to the CEC (900 µmol/g). Data from ref. 3371 [184]. 3372

128
Fig. 26. Calculated density distributions for ammonium N, alkyl C, Ca2+, Br− and water O 3373 for montmorillonite (Mt) with a CEC of 1060 µmole/g and different loading levels 3374 of C16TA+/C16TAB relative to the CEC; the loadings are indicated in the figure. 3375 Data from ref. [213]. 3376
Fig. 27. Snapshots of the surfactant configurations in the Mt-C16TA+/C16TAB system. The 3377 panels a, b, c and d correspond with, respectively, Figs. 25a, 25b, 25c, and 25d. 3378 The stick layers represents the Mt-layers, the atoms in the interlayer are colored: 3379 Ca = green, N = blue, C = grey, Br = brown, H = white, O water = red. Data from 3380 ref. [213]. 3381
Fig. 28. Adsorption isotherms of C12(EO)8 on different layer silicates: () Na-kaolinite, 3382 ()Na-illite, () Na-montmorillonite (Na-Mt) and () Ca-bentonite (Ca-Mt). 3383 Data adapted from ref. [218]. 3384
Fig. 29. Effect of carbon chain length on linear alkylbenzenesulfonate (LAS) adsorption in a 3385 sediment. Data from ref. [255]. 3386
Fig. 30. Adsorption isotherms of cationic (C16TAB), nonionic (Tergitol 15-S-7 = 3387 C11-15(EO)7; secondary alcohol ethoxylate) and anionic (SDS) surfactants for 3388 sand. Data from ref. [266] 3389
Fig. 31. Influence of pH on cationic (C16TAB), nonionic (Tergitol 15-S-7= C11-15(EO)7) 3390 and anionic (SDS) surfactant adsorption on sand. Data from ref. [266] 3391
Fig. 32. (a) Influence of electrolyte concentration on the adsorption of the anionic surfactant, 3392 sodium dodecylbenzenesulfonate on highly humic non-allophanic andosol. The 3393 NaCl concentrations are indicated in the figure. Symbols are measured values. 3394 Solid lines are calculated with the Langmuir-Donnan model. (b) Donnan potentials 3395 obtained with the Langmuir-Donnan model. Data from ref. [258]. 3396
Fig. 33. Sodium dodecylsulfate (SDS) adsorption and degradation in a soil suspension 3397 (highly humic nonallophanic andosol) in relation to mixing time. Data from ref. 3398 [274]. 3399
Fig. 34. The adsorption of hexadecyltrimethylammonium (HDTMA=C16TA+) on two 3400 vermiculitic soils (Na and Ca version) and the corresponding electrophoretic 3401 mobilities and optical densities of the soil suspensions. (a) Adsorption isotherms, 3402

129
(b) electrophoretic mobilities of the soils and (c) optical densities of the soils. Data 3403 from [272]. 3404
Fig. 35. Soil hydraulic conductivity during percolation with a 1 mol/kg surfactant solution 3405 (A) nonionic surfactants (N1, N2, N3), (B) anionic surfactants (A1, A2), cationic 3406 surfactants (C1, C2) and amphoteric surfactant (Am). Data from ref. [279]. 3407
Fig. 36. Comparison of upward infiltration of sodium dodecylsulfate (SDS) solution at 70 3408 mmol/L with that of pure water in a peat moss column. The water table connected 3409 with the column was set at height 0 cm. Data from ref. [299] 3410

Fig. 1.
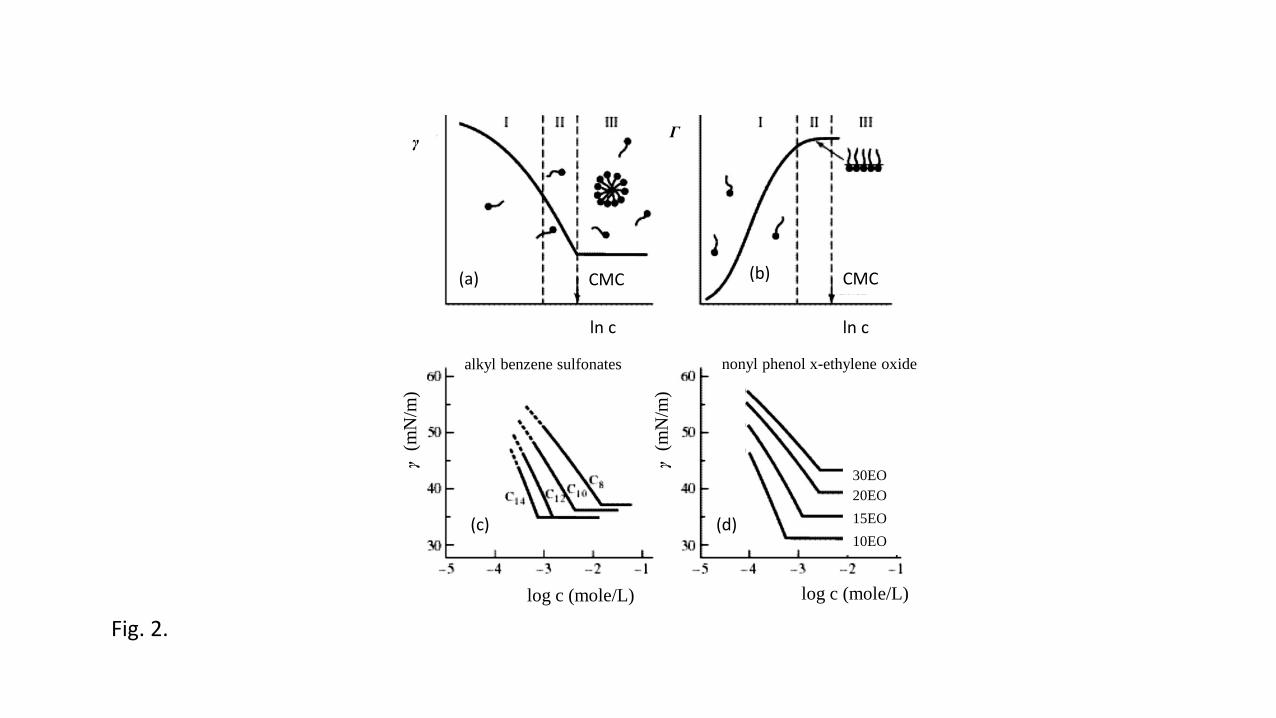
Fig. 2.
(a) (b)
(c) (d)
CMC CMC
ln c ln c
log c (mole/L) log c (mole/L)
γ (m
N/m
)
γ (m
N/m
)
γ Γ
alkyl benzene sulfonates nonyl phenol x-ethylene oxide
30EO
20EO
15EO
10EO

Fig. 3.
γ (m
N/m
) 70
60
50
40
-10 -8 -6 -4 -2
ln CDPC
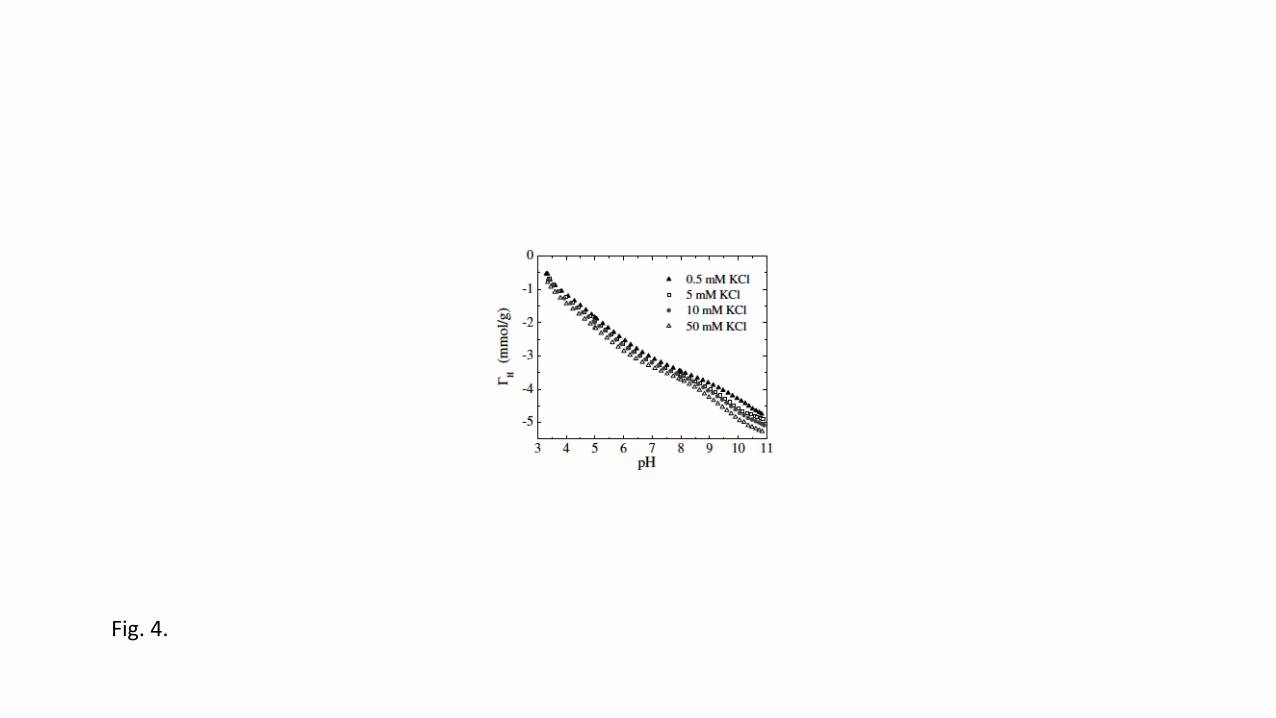
Fig. 4.

Fig. 5.
Fig. 6.
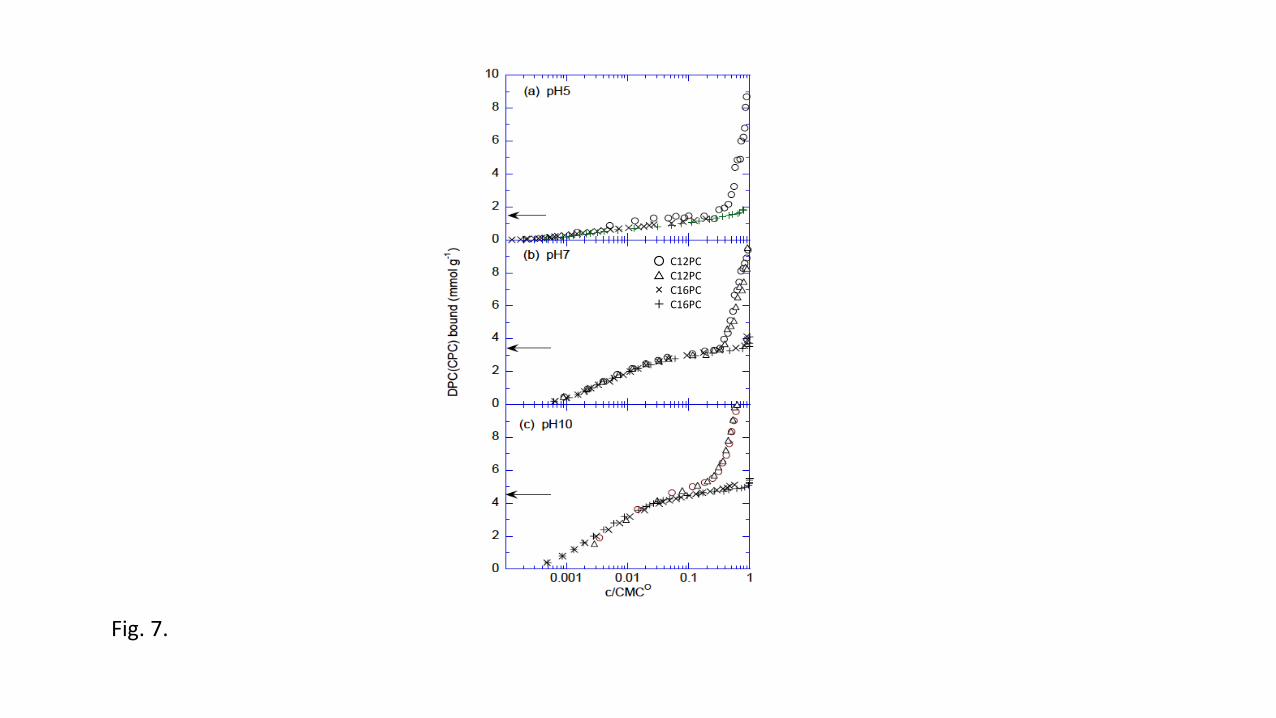
Fig. 7.
C12PC C12PC × C16PC + C16PC

Fig. 8.

Fig. 9.
C12P+ C14P+
C12P+ C14P+
C16P+
C16P+
(a)
(b)

Fig. 10.
0
1
2
3
1.E-09 1.E-07 1.E-05 1.E-03
C16
P+P
-PA
HA
Bin
din
g
or
H+ R
elea
se (m
ol/
kg)
C16PC Conc. (M)
H+
C16P+
NaCl 0.005 M
0.005 M
0.1 M
0.1 M
(a)
IEP
CMC
10-8 10-6 10-4
0.01
0.1
1
1E-9 1E-7 1E-5 1E-3
C16
P+-P
AH
A B
indin
g (
mol/
kg)
C16PC Conc. (M)
C16P+
NaCl 0.005 M
0.1 M
(b)
10-8 10-6 10-4
slope 1
0
1
2
3
4
5
1.E-07 1.E-05 1.E-03 1.E-01
C12P
+ -SP
SS B
indi
ng
(mol/
kg)
Surfactant Concentration (M)
0.005 M NaCl
0.025 M NaCl
0.1 M NaCl
10-6 10-4 10-2 C12PC Concentration (M)
(c)
0.01
0.1
1
10
1.E-07 1.E-05 1.E-03 1.E-01
C12P
+ -SP
SS B
indi
ng
(mol/
kg)
Surfactant Concentration (M)
0.005 M NaCl
0.025 M NaCl
0.1 M NaCl
Ⅰ
Ⅱ
Ⅲ Ⅳ
Critical Association Concentration (CAC)
10-6 10-4 10-2 C12PC Concentration (M)
(d)

Fig. 11.
0
0.5
1
1.5
2
2.5
1.E-09 1.E-07 1.E-05 1.E-03
CnP
+-P
AH
A B
indin
g (m
ol/
kg)
CnPC Conc. (M)
C12P+
C16P+
10-8 10-6 10-4
(a)
0.01
0.1
1
10
1.E-09 1.E-07 1.E-05 1.E-03
CnP
+-P
AH
A B
indin
g (m
ol/
kg)
CnPC Conc. (M)
C12P+
C16P+
10-8 10-6 10-4
(b)

Fig. 12.
0
0.5
1
1.5
2
2.5
1.E-07 1.E-06 1.E-05 1.E-04 1.E-03 1.E-02
C12
P+-H
S b
indi
ng (m
ol/
kg)
C12PC Conc. (M)
PAHA
IHA
DHA
SFA
LFA
10-6 10-5 10-4 10-3
(a)
0.01
0.1
1
10
1.E-07 1.E-06 1.E-05 1.E-04 1.E-03 1.E-02
C12
P+-H
S b
indi
ng (m
ol/
kg)
C12PC Conc. (M)
PAHAIHADHASFALFAHenry slope
10-6 10-5 10-4 10-3
(b)

Fig. 13.

Fig. 14.

Fig. 15.

Fig. 16.
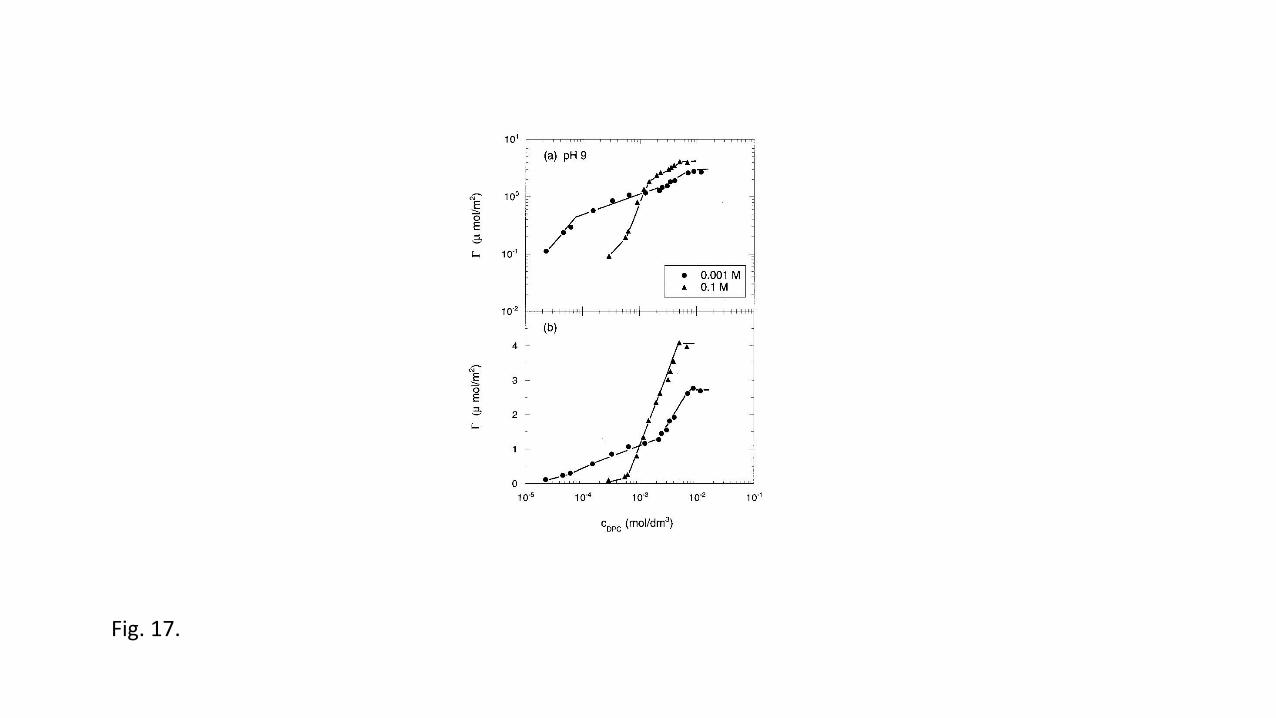
Fig. 17.
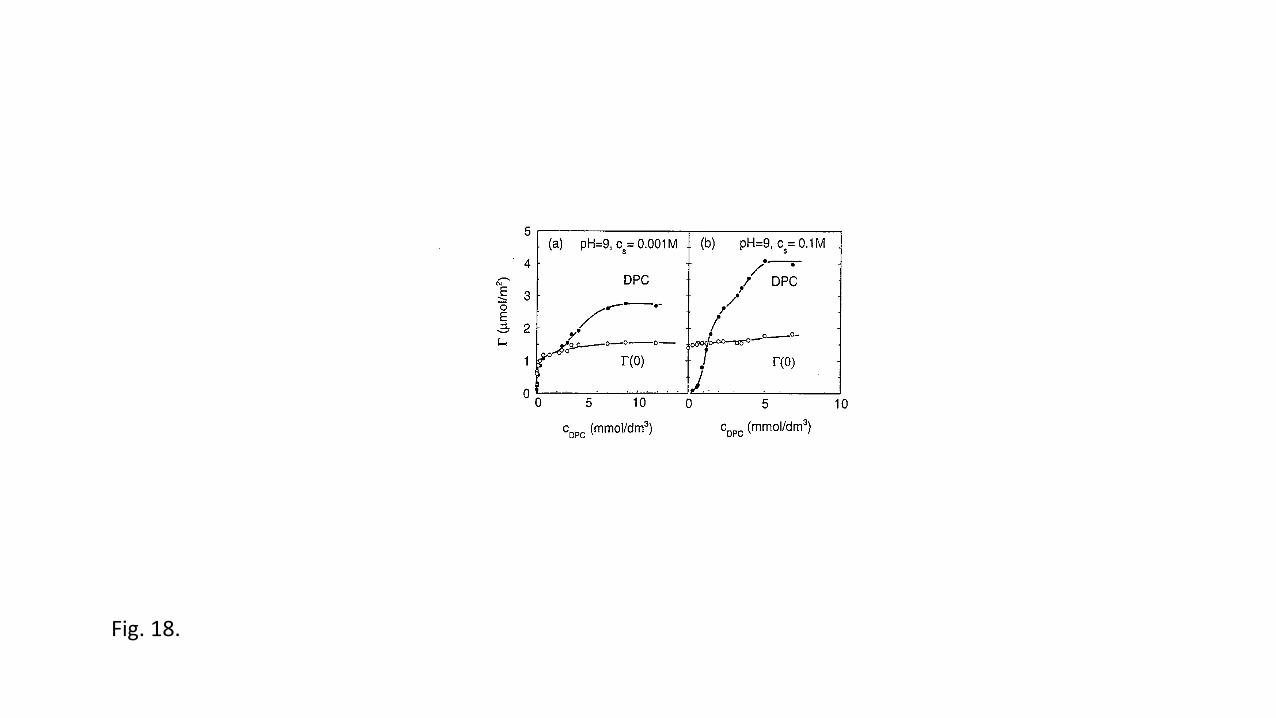
Fig. 18.

Fig. 19.

Fig. 20.
Su
rfac
tan
t A
dso
rpti
on
(1
0-6
mo
l/g) Mobility
NaCl 100 mM
20 mM
5 mM
log CC12PC

Fig. 21.

Fig. 22.

Fig. 23.

Fig. 24.
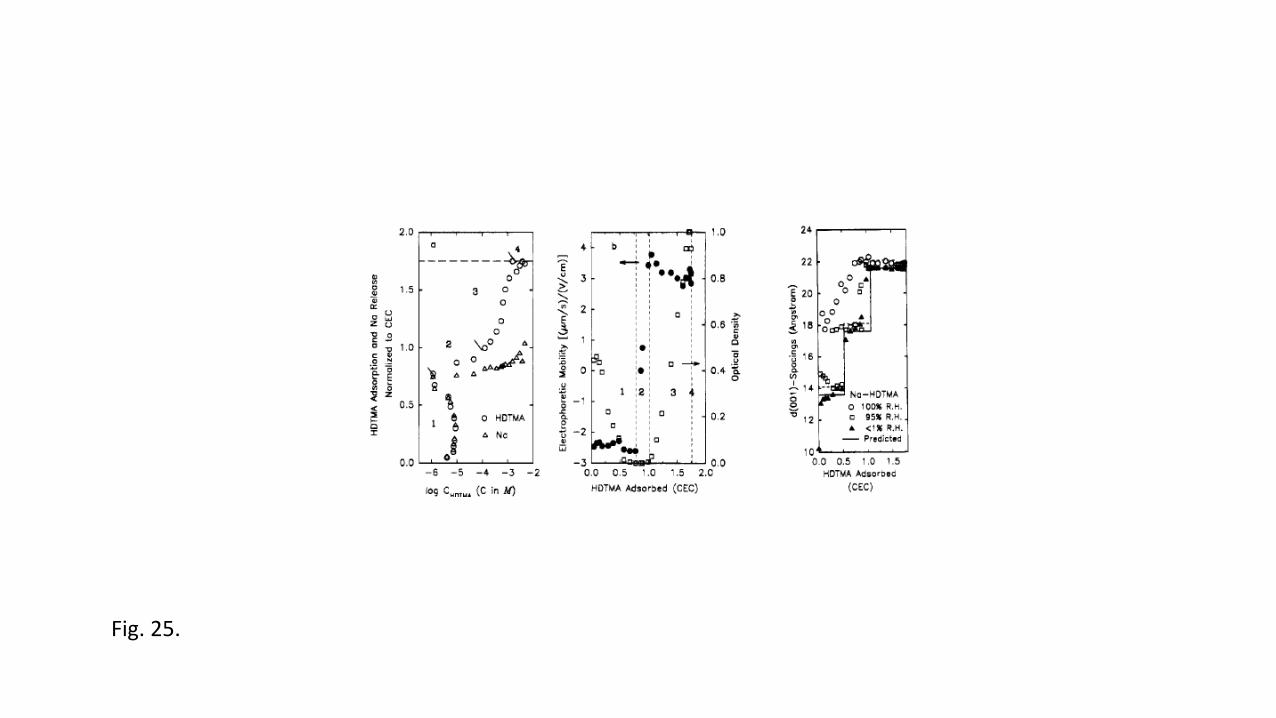
Fig. 25.

Fig. 26.

Fig. 27.

Fig. 28.

Fig. 29

Fig. 30
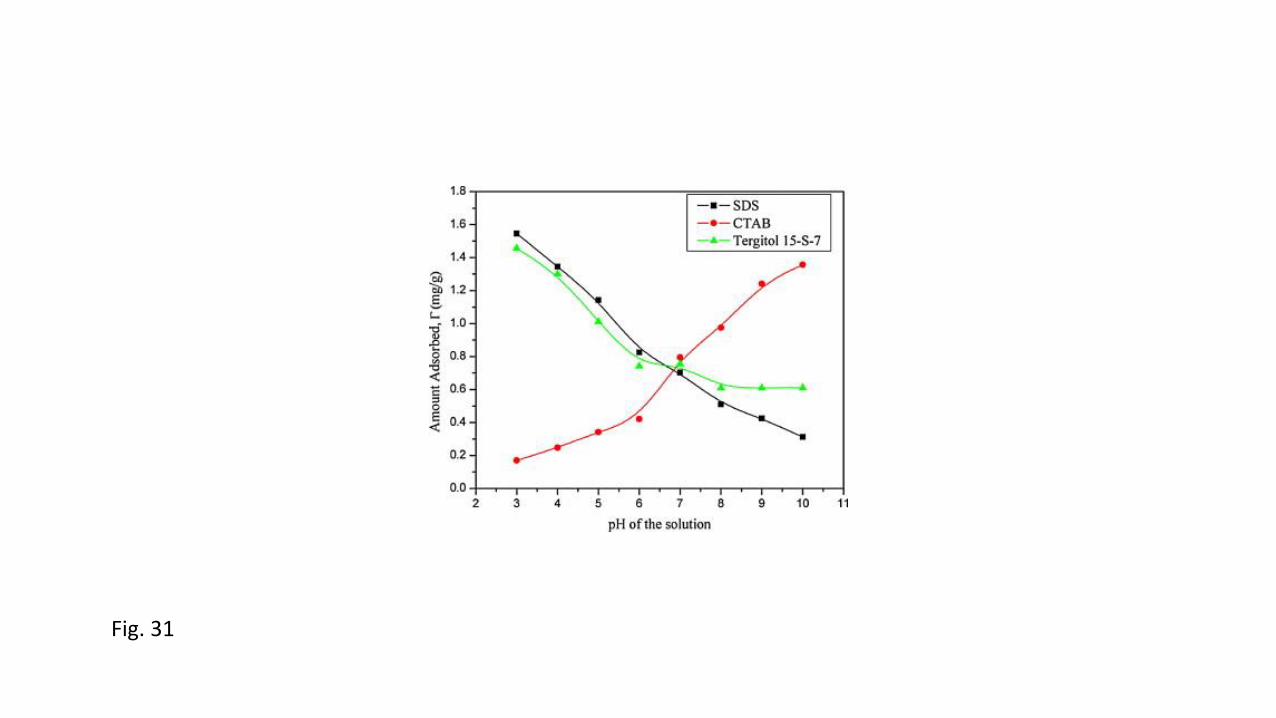
Fig. 31
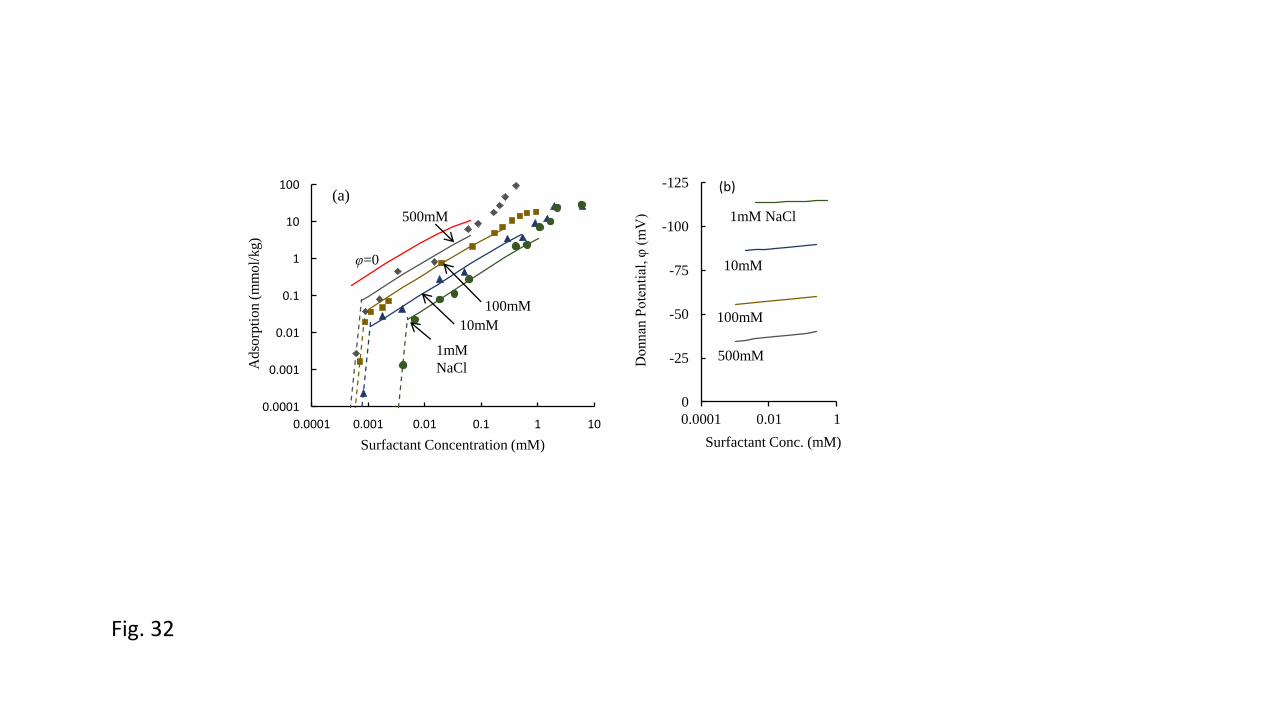
Fig. 32
0.0001
0.001
0.01
0.1
1
10
100
0.0001 0.001 0.01 0.1 1 10
Adso
rpti
on (
mm
ol/
kg)
Surfactant Concentration (mM)
500mM
100mM
10mM
1mM
NaCl
φ=0
(a) -125
-100
-75
-50
-25
0
0.0001 0.01 1
Donnan
Pote
nti
al, φ
(m
V)
Surfactant Conc. (mM)
500mM
100mM
10mM
1mM NaCl
(b)
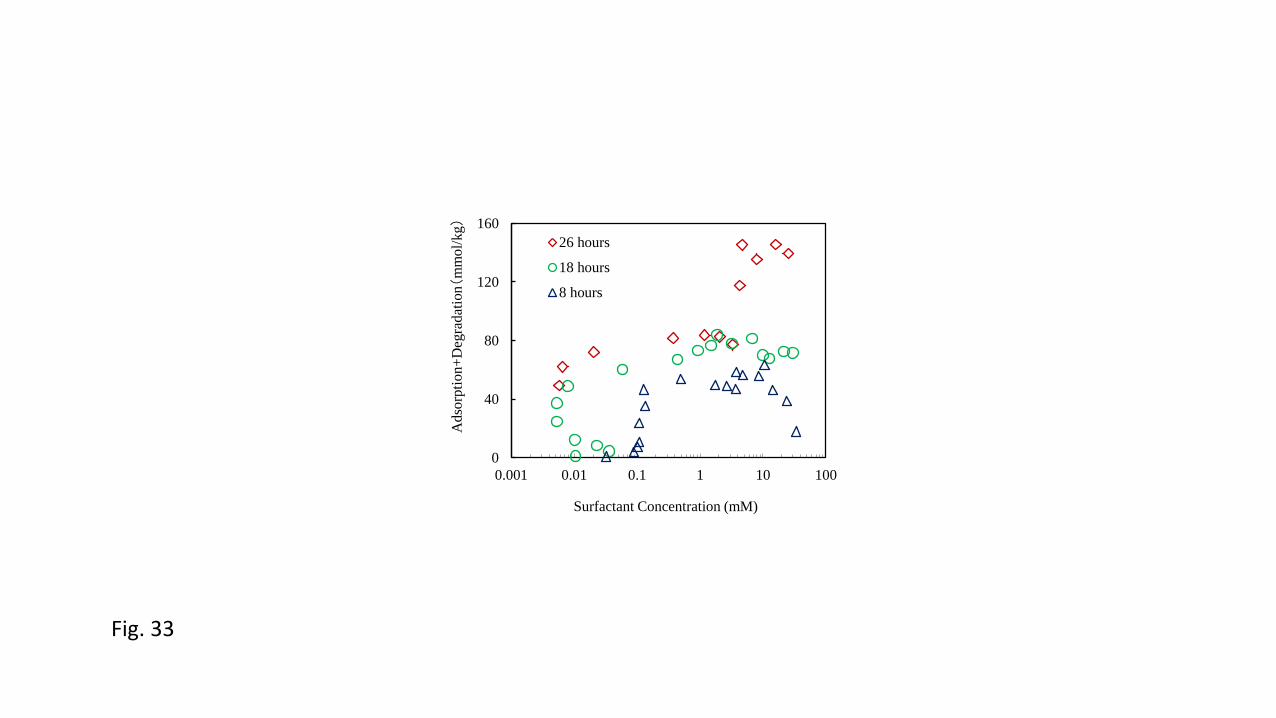
Fig. 33
0
40
80
120
160
0.001 0.01 0.1 1 10 100
Ad
sorp
tio
n+
Deg
radat
ion(m
mol/
kg)
Surfactant Concentration (mM)
26 hours
18 hours
8 hours

Fig. 34

Fig. 35

Fig. 36
-20
-10
0
10
20
1 10 100 1000
Hei
gh
t o
f In
filt
rati
on
Fro
nt
(cm
)
Time (min)
pure
water
70mM
SDS