surface transformations and water uptake on liquid and
TRANSCRIPT

1
Surface Transformations and Water Uptake on Liquid and Solid
Butanol near the Melting Temperature
Panos Papagiannakopoulos*,1,2, Xiangrui Kong1, Erik S. Thomson1, Nikola Markovic´3, and
Jan B. C. Pettersson*,1 1 Department of Chemistry and Molecular Biology, Atmospheric Science, University of
Gothenburg, SE-412 96 Gothenburg, Sweden 2 Department of Chemistry, Laboratory of Photochemistry and Kinetics, University of Crete,
GR-71 003 Heraklion, Greece 3 Department of Chemical and Biological Engineering, Physical Chemistry, Chalmers
University of Technology, SE-412 96 Gothenburg, Sweden
* To whom correspondence should be addressed. E-mail: [email protected] (P.P.) or
[email protected] (J.B.C.P); Tel. +46 31 7869072; Fax: +46 31 7721394.

2
Abstract
Water interactions with organic surfaces are of central importance in biological systems and
many Earth system processes. Here we describe experimental studies of water collisions and
uptake kinetics on liquid and solid butanol from 160 to 200 K. Hyperthermal D2O molecules
(0.32 eV) undergo efficient trapping on both solid and liquid butanol, and only a minor
fraction scatters inelastically after an 80% loss of kinetic energy to surface modes. Trapped
molecules either desorb within a few ms, or are taken up by the butanol phase during longer
times. The water uptake and surface residence time increase with temperature above 180 K
indicating melting of the butanol surface 4.5 K below the bulk melting temperature. Water
uptake changes gradually across the melting point and trapped molecules are rapidly lost by
diffusion into the liquid above 190 K. This indicates that liquid butanol maintains a surface
phase with limited water permeability up to 5.5 K above the melting point. These surface
observations are indicative of an incremental change from solid to liquid butanol over a range
of 10 K straddling the bulk melting temperature, in contrast to the behavior of bulk butanol
and previously studied materials.
Keywords: alcohol, D2O, surface ordering, surface melting, accommodation, kinetics

3
1. Introduction
Water interactions with organic compounds are of central importance for biological systems1
and many components of the Earth system2 including organic aerosols in the atmosphere.3 In
biochemical processes, protein folding and function critically depend on the interactions with
surrounding water molecules. Intermolecular interactions with water also result in clustering
of hydrophobic molecules and contribute to the aggregation of lipids into membranes where
hydrophilic groups interact with the surrounding water, while the hydrophobic termini remain
hidden within the layer. The precise role of water in these important biological processes
remains imperfectly understood, and resolving how water behaves near hydrophobic surfaces
cannot rely on structure alone but must also consider the water dynamics.1
Water interactions also play a wide variety of roles in atmospheric processes.2, 4 Primary
emitted organic compounds are transformed in the atmosphere through a series of gas phase
reactions, and low vapor pressure products condense on existing aerosol particles or are
involved in the formation of new particles. Coating aerosols and cloud particles with organic
trace species leads to modifications of their chemical and physical properties,5-7 with potential
impacts on climate vis-à-vis cloud formation and radiative forcing.3, 4 In the atmosphere,
primary hydrophobic compounds become increasingly hydrophilic through slow oxidation
involving oxidizing agents like OH and ozone,8 and thus the hygroscopicity of particles may
change with age and oxidation state of the surface-bound compounds.9 Secondary organic
aerosol particles are usually assumed to be liquid, but they may also become solid or glassy
with large resulting effects on gas uptake.10
Alcohols constitute one important group of atmospheric compounds and their competing
hydrophobic and hydrophilic properties make them interesting as model systems for both
atmospheric and biochemical systems. The smallest alcohol, methanol, is water soluble, even
though detailed studies show that these small molecules tend to cluster in liquid water.11 The
rapid mixing of water and methanol is confirmed by molecular beam experiments where
water is incorporated into a liquid methanol monolayer on the microsecond timescale already
at temperatures below 200 K.12 The solubility of the alcohols in water decreases rapidly with
molecular size and although the four carbon molecule butanol still has a high solubility,
octanol is only slightly soluble in water. Octanol-water partition coefficients are extensively
used to predict processes of environmental and pharmacological importance, and the success

4
of 1-octanol as a model solvent is generally attributed to its amphiphilic nature, which
captures some of the complexity of real systems.13 The bulk structure of 1-octanol consists of
a diverse spectrum of aggregates, dominated by linear aggregates in dry octanol and by large
micelle structures in water saturated octanol.13, 14 In contrast to the random orientation in the
bulk, molecular dynamics (MD) simulations show that octanol molecules near the surface
become oriented into bilayers that at 298 K extend several molecular layers deep.15 The water
uptake and penetration into these types of surfaces is expected to depend sensitively on the
bulk material properties and temperature, but the current understanding of the governing
mechanisms is incomplete. Related MD simulations of organic systems suggest that
penetration of water molecules into the interfacial region plays a significant role at water-oil
interfaces,16 and water permeation through model membranes can be significant on timescales
of 100 ns and more.17
Alcohols are surface active on liquid and solid water and tend to form monolayers or
multilayers that reduce water condensation and evaporation rates.18 The effect depends on
alcohol chain length and chain alcohols with 14 to 22 carbon atoms are reported to impede
water evaporation by up to four orders of magnitude.19, 20 Recent molecular beam experiments
show that the effect of a methanol monolayer on ice is negligible, while a butanol layer on ice
reduces uptake by 20-40% compared to pure ice.21 Molecular dynamics simulations of
butanol-covered liquid water suggest that water condensation is reduced by a factor of three at
300 K.22 However, other studies on the water evaporation from supercooled sulfuric acid
through butanol films show little to no effect of the butanol.23, 24 These differing results
suggest that the water interactions are quite sensitive to the detailed chemical and physical
properties of adsorbed alcohol surface layers.
Detailed molecular level studies of system dynamics and kinetics often rely on spectroscopy
and modeling, while the use of other sophisticated experimental methods including molecular
beam techniques and surface science methods are usually hampered by the relatively high
vapor pressures of the systems. The recent development of the environmental molecular beam
(EMB) method makes studies of dynamics and kinetics possible at pressures up to 1⋅10-2
mbar,25, 26 and applications include studies of water interactions with thin alcohol layers on
ice21, 25 and graphite12, 26. Here we employ the EMB method for detailed studies of water
interactions with solid and liquid n-butanol with the overall aim to characterize the
mechanisms for water accommodation and bulk uptake. n-Butanol has a number of properties

5
that makes it an interesting system for detailed studies. It is amphiphilic in nature and forms
relatively strong hydrogen bonds. It is easily super-cooled but also has interesting solid phase
properties at low temperature.27-31 The EMB studies are carried out with D2O rather than H2O
to enhance sensitivity in the experiments and cover the temperature from 160 to 200 K - thus
including both solid and liquid bulk phases on either side of the 184.5 K bulk melting
temperature of butanol.32, 33 Of particular interest are the effects of surface structure on water
uptake near the melting point. The implications for the understanding of water interactions
with organic phases are discussed.
2. Experimental methods
A. Experimental setup
The D2O-butanol experiments were performed in an EMB apparatus; a six-chamber vacuum
system that has been described in detail elsewhere.25, 26 A molecular beam is generated by a
pulsed gas source with part of the gas passing through a skimmer and a subsequent chopper to
form a directed low density beam with square-wave-like 400 µs beam pulses. The beam
source is run with a D2O:He gas mixture at a total pressure of 2 bar and a partial D2O pressure
of approximately 25 mbar, which produces a beam with mean kinetic energies of 0.32 ± 0.02
and 0.064 ± 0.003 eV for D2O and He, respectively.
The beam is directed towards a butanol-covered graphite surface (Advanced Ceramics Corp.;
highly oriented pyrolytic graphite, grade ZYB, 12 × 12 mm2) located in the center of the main
ultra-high vacuum (UHV) chamber. The UHV chamber has a background pressure of
approximately 10-9 mbar primarily due to residual background gases introduced during the
experiments. In the EMB configuration the surface is surrounded by a separate inner
environmental chamber that allows for experiments with vapor pressures into the 10-2 mbar
range. The finite pressure distinguishes the method from traditional molecular beam
experiments, and it has been termed EMB in analogy with environmental scanning electron
microscopy. The apparatus has been designed to minimize the molecular beam path length
(28 mm) within the high-pressure zone, such that the attenuation of the beam due to gas
collisions within the inner chamber becomes significant only above 10-3 mbar.25

6
The incident D2O/He beam enters the innermost chamber through a circular opening with a
diameter of 5 mm and collides with the surface at an angle of 45°. The outgoing flux passes
through a second 5 mm opening in the inner chamber wall and is monitored with a quadrupole
mass spectrometer (QMS) at an angle of 45° from the surface normal direction. The QMS is
rotatable and is also used to measure in the incident beam.
Micrometer thick n-butanol layers are produced on the graphite substrate by directly
introducing butanol gas into the environmental chamber through a gas inlet. The thickness of
the butanol layer is determined by monitoring the interference produced by the adsorbed layer
when reflecting light from a diode laser (0.86 mW, 670 nm) at 3° from the surface normal
direction.34 A refractive index for n-butanol of 1.39577 at 670 nm is used to calculate the
layer thickness.35 Butanol layers are typically produced with an initial growth rate of
approximately 70 monolayers per second (ML s-1), and the butanol pressure is then adjusted
to maintain a layer thickness of approximately 1 µm, corresponding to ca. 3000 ML
(assuming that 1 ML of butanol consists of 3.69⋅1014 molecules cm-2 36 and the unit cell
volume of crystalline butanol is 3.735⋅10-22 cm3 31) The graphite surface is cleaned between
experiments by heating to 500 K, and surface conditions are routinely confirmed by elastic
helium scattering after surface cooling to 200 K or lower.25, 26 Elastic helium scattering is also
used to confirm that the graphite surface is completely covered with butanol during the
experiments.34
B. Analysis
The time dependent flux from the surface measured by the QMS is recorded by a multi-
channel scaler with a 10 µs dwell time, and the ion intensity counts are transformed into time-
of-flight (TOF) distributions using the geometry of the system. The quantitative analysis of
the TOF distributions relies on a nonlinear least-squares fitting of the measured intensities
assuming the experimental data can be described by a combination of inelastic scattering (IS)
and trapping followed by first-order thermal desorption (TD).21 The thermal desorption is
modeled with a residence time behavior of the form,
!!"# = !!!!!",
( 1 )

7
where C1 is a scaling factor, k is the desorption rate constant, and t is time. The inelastic
scattering distribution is assumed to have the common form,37
!!" ! ! = !!! ! !!"# − ! ! !!!!"
!, ( 2 )
where C2 is a second scaling factor, v(t) is the molecule velocity calculated from the travel
time t and flight path length l between the surface and the QMS, ! !epresents the peak of the
inelastically scattered beam velocities, and vIS is,
!!" =!!!!!"!
,
( 3 )
where the temperature TIS describes the velocity spread, kB is the Boltzmann constant, and m
is the molecular mass. The flexibility of the algorithm is ensured by the free fitting parameters
C1, C2, k, ! and TIS.
The absolute probability for D2O trapping followed by thermal desorption, PTD, is computed
by normalizing each thermal desorption integral by the thermal desorption integral from a
contiguously measured bare graphite case. The trapping-desorption probability for
hyperthermal D2O scattering from graphite is constant within error limits in the temperature
range used here, and the TD component has a cosine angular distribution independent of
temperature.38 The desorption for the bare case is then linearly scaled by the sticking
coefficient sgraphite = 0.73 ± 0.07 for D2O on bare graphite under the present conditions.21
Using this sticking coefficient as a scaling parameter PTD is easily computed as,
!!" = !!"#$!!"#!!"!"#$ !!"!"#$!!"#,
( 4 )
where !!"!"#$ and !!"!"#$!!"# are the thermal desorption integrals in the butanol and graphite
cases. In each case an error estimate is calculated from the range of integral values based on
the 95% confidence intervals for the fitting parameters that contribute to the thermal decay

8
function. The final error is based on propagating the error of each integral and the uncertainty
in s.
3. Results
We have studied the dynamics and kinetics of D2O interactions with solid and liquid n-
butanol from 160 to 200 K. The experimental results consist of TOF spectra that are further
analyzed to determine desorption rate constants and the probabilities for inelastic scattering,
thermal desorption and bulk uptake of water on butanol surfaces prepared by different
procedures.
Figure 1 shows TOF distributions for D2O colliding with n-butanol at five different
temperatures together with a distribution measured in the incident beam. A new butanol
surface was prepared by vapor deposition before each experiment. Data points are overlaid by
the two component non-linear least squares fitting of the TOF distributions with each
component (IS and TD) and the sum of the two components is also depicted. The IS
component is similar in all cases while the TD component changes rapidly with temperature.
When increasing the temperature from 180 to 184 K, the TD distribution becomes wider
indicating a longer residence time for adsorbed D2O on the butanol surface. The distribution
continues to widen and the total TD intensity decreases as the temperature is further
increased. Note that the melting temperature, Tm, for n-butanol is 184.5 K32, 33, and thus the
distributions at 184 and 186 K correspond to collisions with solid and liquid butanol,
respectively. The TD distributions at 186 and 190 K are similar, but the TD component
suddenly disappears at 191 K and higher temperatures.
The beam measurement displayed in Figure 1 is carried out with the same flight distance as
the flux measurements from the surface, and the shape of the distribution therefore
corresponds to hypothetical elastic scattering of D2O from the surface. The time shift between
the incident beam distribution and the inelastic scattering peaks illustrates that water
molecules loose kinetic energy during surface contact. The kinetic energy of D2O molecules
directly scattered from the butanol surfaces was 0.064 ± 0.006 eV independent of
temperature. This corresponds to 20% of the incident beam energy indicating substantial
energy loss to surface modes in both liquid and solid butanol. Similar large energy losses have

9
previously been observed for D2O collisions with butanol and methanol monolayers on water
ice surfaces,12, 21 as well as in gas collisions with water ice surfaces.39, 40
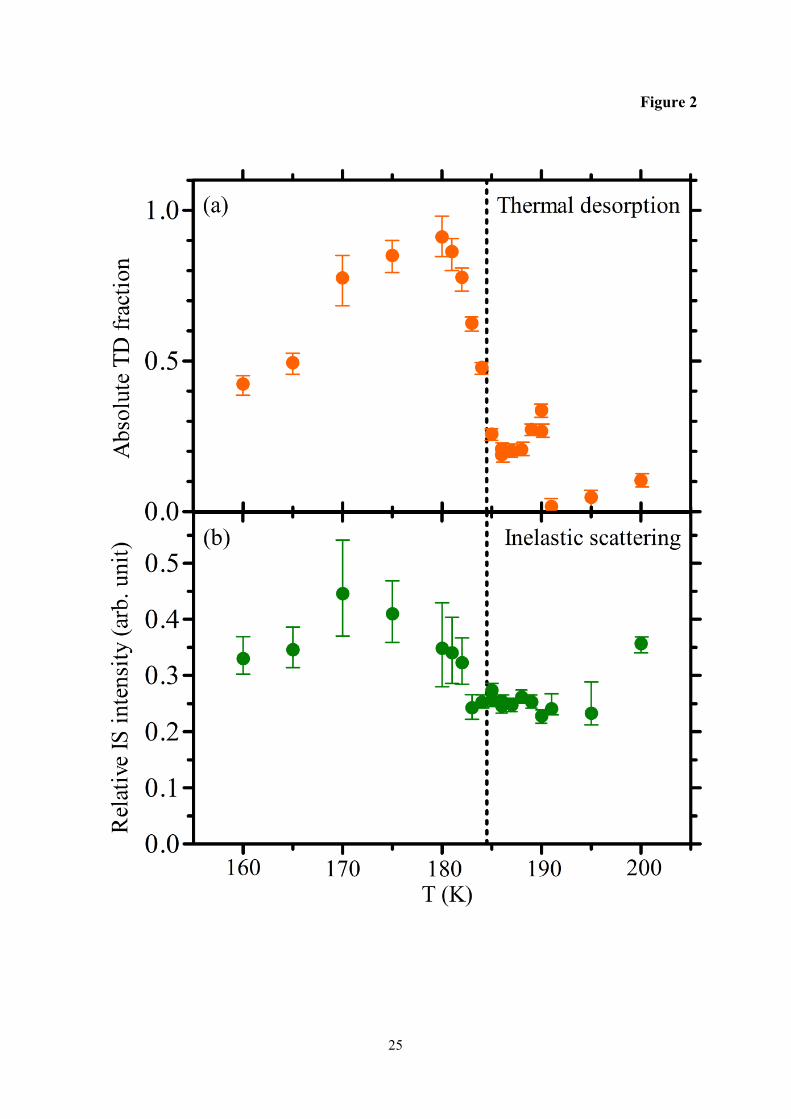
Figure 2 shows the absolute TD probability and the relative IS intensity as a function of
temperature. The angular distribution for the TD component is described by a symmetric
cosine distribution and measurements in a single direction are sufficient to calculate the total
desorbing flux.21 The absolute IS intensity can on the other hand not be determined since
measurements are only carried out for a scattering angle of 45° and the angular distribution is
unknown. The TD fraction varies widely with temperature, Figure 2a. The fraction increases
from 0.4 at 160 K to 0.9 at 180 K, and then decreases rapidly above 180 K and levels out with
values in the 0.2 – 0.35 range between 185 and 190 K. The TD fraction drops to very low
values at 191 K and remains low up to 200 K. In sharp contrast to the TD results the IS
intensity is more stable with relative values between 0.25 and 0.45, Figure 2b. The IS values
begin to drop when temperature increases above 180 K and similar values are observed
between 183 and 195 K, which indicates that the scattered D2O molecules interact with a
similar surface both below and above the melting point. The observed TD probability of 0.9 at
180 K means that the IS intensity at the same T cannot correspond to more than 10% of the
total flux. The relatively small variation in IS over the entire temperature range indicates that
the scattering probability remains low under all conditions. This conclusion is further
supported by the large loss of kinetic energy during surface collisions (Figure 1), which is
consistent with efficient trapping. We therefore conclude that the sharp decrease in TD
intensity above 180 K (Figure 2a) is due to extensive loss of D2O to the butanol phase on the
10 ms timescale of the measurements. Isotopic exchange between D2O and surface C4H9OH
molecules was also considered as a possible sink of D2O molecules, but HDO desorption was
experimentally confirmed to be below the detection level making this a less likely
explanation.
The desorption rate constants determined from TOF data are presented as an Arrhenius
diagram in Figure 3. The k values clearly exhibit different behavior across the experimental
temperature range. Starting with solid butanol at 180 K and lower, k has an Arrhenius-type
behavior and an activation energy Ea = 0.08 ± 0.03 eV and a pre-exponential factor A =
4.7⋅10(5.0 ± 0.8) s-1 are determined where error limits are 95% confidence intervals. The
desorption rate constant rapidly decreases with temperature above 180 K, with the

10
corresponding surface residence time τ = 1/k increasing from 250 µs at 180 K to about 500 µs
at the bulk melting temperature. The desorption rate constant continues to decrease as the
melting point is crossed, but now with a slightly different temperature dependence as
illustrated in Figure 3. The apparent activation energies below and above the melting point are
-0.57 ± 0.13 and -1.35 ± 0.08 eV, respectively. The surface residence time stabilizes at about
2 ms as the temperature approaches 190 K, and at higher T water is rapidly lost by diffusion
into the liquid butanol phase and no k values could be determined. The combined results in
Figures 1-3 clearly illustrate that water interactions with butanol changes significantly over a
10 K interval around the bulk melting point. The brief surface interactions experienced by
inelastically scattered molecules are not strongly affected by melting (Figure 2b), while water
molecules adsorbed on the µs to ms time scale are influenced by changes in surface properties
(Figures 2a and 3). Thus, passing the bulk melting point does not have a singular effect, rather
changes appear gradually between 180 and 190 K.
In the experiments described above, a new butanol layer was produced before each
experiment started. To further investigate the effects of surface properties additional
experiments were carried out where butanol layers were formed at specific temperatures and
maintained as the temperature was changed in steps during cooling or heating. Figure 4 shows
results from temperature ramps, where i) liquid butanol is deposited at 200 K and
incrementally cooled to 160 K, and ii) solid butanol is deposited at 160 K and warmed to 190
K. Results from the “fresh” butanol studies described in Figures 1-3 are also included for
comparison. Each measurement at an individual temperature took approximately 20 minutes
with the intervening cooling and/or warming ramps proceeding at ca. 1 K min-1. The
desorption rate constants obtained during warming agree with the fresh butanol data, Figure
4a. This is also true when butanol is cooled from 200 K to the melting point, but at lower
temperatures the k values are always significantly lower for the cooled surface. This indicates
that the surface properties of solid n-butanol, as expected, depend on the preparation
procedure. However, below 180 K the calculated Arrhenius parameters for the warming (Ea =
0.08 ± 0.05 eV, A = 7.0⋅10(5.0 ± 1.3) s-1; T = 160 – 175 K) and cooling (Ea = 0.10 ± 0.03 eV, A =
9.2⋅10(5.0 ± 0.8) s-1; T = 160 – 180 K) cases agree within error limits with the data from freshly
deposited butanol surfaces. Figure 4b shows that the TD values are similar for all three cases.
The corresponding IS data are also comparable but not shown.

11
Earlier experiments have shown that n-butanol can be deeply super-cooled down to 125 K,28,
30 and a super-cooled liquid layer could possibly form during the cooling experiments
described above. The low desorption rate constants observed for the cooling case could
indicate a longer residence time in a super-cooled liquid layer, but the TD values are on the
other hand similar to the solid butanol case indicating limited uptake into the butanol phase.
We performed independent low temperature tests where a liquid n-butanol layer was cooled to
170 K, and monitored for transient changes in water desorption behavior in excess of two
hours. No time dependence was observed indicating that the surface conditions were stable on
this time scale, and we have not conclusively determined if the surface is a super-cooled
liquid or a polycrystalline solid under these conditions.
4. Discussion
The study clearly reveals that water collisions with both liquid and solid butanol are
characterized by highly efficient energy transfer. Efficient energy transfer has previously been
observed in similar systems including water interactions with thin liquid methanol films on
graphite,8 methanol and butanol monolayers on water ice,21 and gases interacting with pure
water ice surfaces.39-40 For all of these systems, including solid and liquid butanol, a surface
accommodation coefficient close to one can be expected under thermal conditions. On n-
butanol, the trapped water molecules continue to either rapidly desorb, or become
incorporated into the bulk during longer times. The competitive kinetics between the water
desorption and uptake processes are obviously sensitive to the detailed surface conditions. In
related work the competition between water desorption and bulk uptake was studied for
methanol and butanol-covered water ice.21 While a methanol layer does not constitute a
barrier to water uptake on ice, a butanol monolayer does and a water uptake coefficient of
about 0.8 was observed in the 155 – 200 K temperature range. The detailed mechanism for
water uptake by alcohol-covered ice has not yet been identified, but it appears likely that
thermal motion of butanol molecules will enhance the chances of water penetrating the
surface layer. The alkyl chains of n-butanol prefer to orient upright on liquid water at 298 K,
but butanol molecules are neither well-ordered nor evenly distributed making the surface
layer porous, which enhances water penetration.23, 41 Breakup of intermolecular butanol-
butanol bonds also makes butanol OH groups available for hydrogen bonding and thereby
enhances water stability on the surface. This is confirmed by MD simulations of butanol on
liquid water at room temperature,22 and is likely true also at lower temperatures. The same

12
arguments apply to the neat butanol system studied here and we conclude that an increased
water uptake and a decreased desorption probability are likely related to a larger mobility of
butanol molecules in the surface layer.
The Arrhenius parameters observed for solid n-butanol below 180 K (e.g. Ea = 0.08 ± 0.03 eV
and A = 4.7⋅10(5.0 ± 0.8) s-1 in Fig. 3) are low and unlikely to correspond to an ordinary
desorption process. Considering the observed surface residence times in the µs – ms range
and assuming desorption to be a first order process with a typical Arrhenius pre-exponential
factor of 1013 s-1, a surface binding energy of 0.3 – 0.4 eV would be expected. We have used
MD simulation in order to estimate the water-butanol interaction energy employing the
TIP4P/200542 potential for water and the OPLS-AA43 potential for butanol. The butanol
molecule was in its equilibrium geometry and both molecules were treated as rigid. Starting
from random initial relative molecule-molecule geometries the potential energy was
minimized using a simple velocity damping technique. Several local minima corresponding to
water interaction with the hydrocarbon tail were found with well depths between 0.03 (water
interacting with the C4 carbon) and 0.09 eV (water interacting with the C1 carbon), while
hydrogen bonded structures had binding of energies of 0.25 or 0.34 eV. We also carried out a
limited study of the interaction between a water molecule and a relaxed cluster of 11 butanol
molecules. If the water molecule found hydroxyl groups to interact with the binding energy
was 0.32 - 0.35 eV, otherwise 0.10 - 0.12 eV. Comparison with the experimental results
suggests that the observed Ea of 0.08 - 0.10 eV may correspond to the D2O binding energy to
an interface dominated by hydrophobic tails, while the low A values and associated long
surface residence times indicate that adsorbed water molecules also form reversible hydrogen
bonds with the surface. The resulting desorption kinetics are thus affected by transfer between
at least two different types of bound states at the interface. This interpretation is consistent
with our understanding of the solid butanol surface based on earlier Brillouin scattering, X-
ray diffraction and calorimetric measurements.29, 31 A state that consists of nanocrystallites
embedded in a disordered matrix has been observed at 125 K - 160 K and a polycrystalline
solid readily forms between 160 and 180 K. Considering the preparation procedure used here
with rapid deposition of butanol we expect the solid butanol phase to be polycrystalline and
the surface may be expected to be heterogeneous and relatively rough, which should make a
range of surface sites with different properties available for water.

13
The most intriguing finding is undoubtedly the changes in water-butanol interactions observed
between 180 and 190 K, which strongly suggest that the surface changes between solid and
liquid over a 10 K interval around the melting point. Starting below the melting point, the
water uptake and desorption kinetics begin to evolve around 180 K indicating changes in
surface properties. One likely explanation for these changes is that surface melting occurs.
That is, as the solid is warmed towards its melting temperature the surface becomes
substantially disordered forming a thin liquid-like layer that grows thicker as the melting
temperature is approached.2, 44 This is a common phenomenon and numerous experimental
and theoretical studies have demonstrated that water ice44, 45 metals,46 ceramics,47 polymers48
and colloids49 undergo surface melting. Relatively few studies have been carried out with
molecular solids and studies of short-chain organic compounds like n-butanol are apparently
missing in the literature. Experimental studies of surface melting have been reported for solids
consisting of small molecules including oxygen,50 methane,51 , biphenyl52, 53 and caprolactam
(C6H11ON),54 and MD simulations of surface melting have been carried out for SF6.55 The
results can usually be described by mean field theory which predicts that the film thickness
increases as (Tm – T)-1/3 for van der Waals solids, and as ln(Tm-T) for solids dominated by
short range interactions.45 An intriguing observation in the present study is that the apparent
activation energy of -0.57 ± 0.13 eV observed for water desorption in the 180 – 184.5 K range
(Figure 3) agrees fairly well with a (Tm – T)-1/3 dependence near Tm, which suggests that the
water residence time on n-butanol may scale with the thickness of the premelted surface layer.
Previous work suggests polycrystallinity in the surface layer could contribute to a spread in
the melting transition due to a combination of grain boundary energy and crystallite size
effects.45 However, here the desorption kinetics are well described by a single exponential
decay of the D2O surface population. We therefore conclude that the whole surface is affected
by the changes taking place since any heterogeneity in surface conditions would result in
deviations from a single exponential decay. This makes us conclude that the results are not
strongly affected by polycrystallinity in the sample.
The experimental results also suggest that although the butanol surface begins to liquefy
below Tm, some molecular structure remains that limits water permeability up to 5.5 K above
Tm. The effect disappears suddenly above 190 K, which indicates that it is due to a phase with
specific properties rather than a preferential orientation of molecules at the surface that
gradually disappears with increasing T. Long chain organic molecules such as alcohols56 and
alkanes57 have previously been shown to form stable crystalline layers on top of the bulk

14
liquid above the melting temperature, and the phenomenon has been termed surface
freezing.58 For alcohols CnHmOH with chain lengths 16 < n < 28 a crystalline surface bilayer
is stable up to 1 K above Tm.56 Water may intercalate into the center of the bilayer which
results in bilayers stable up to 2 K above Tm and observed for n values down to 10.56 These
earlier studies show that alcohols have a tendency to form stable bilayers at the gas-liquid
interface. Further evidence is provided by vibrational sum frequency generation spectroscopy
(VSFG) which been used to investigate the organization of n-butanol at the air-liquid interface
at 298 K.59 VSFG spectra suggest that butanol molecules tend to aggregate into
centrosymmetric structures on the liquid surface, and the data are consistent with butanol
forming layered hydrogen-bonded structures at the interface. The effect is observed to be
larger in hexanol than in butanol. Molecular dynamics simulations of the liquid n-octanol
surface at 298 K showed that molecules tend to align perpendicular to the surface with the
octyl groups pointing outwards.15 The next layer preferentially orient antiparallel to the
surface molecules resulting in a bilayer structure, and at least four hydrogen-bonded bilayers
are identified beneath the surface before unsymmetric linear structures begin to dominate in
the bulk.13, 15 These previous studies suggest that the surface layer on liquid n-butanol may
also have a bilayer structure. One suggestion is that the phase is a smectic liquid crystal
phase,36 but additional experimental and theoretical studies are required to test this
hypothesis.
The current understanding of water uptake on atmospheric aerosol particles is far from
complete. Although organic aerosol particles are often considered to be in a liquid state, it has
recently been shown that organic aerosol particles can adopt an amorphous semisolid state
that significantly influences gas exchange and heterogeneous reactivity.60 The present study
adds to this picture by suggesting that the surfaces of organics may have unique properties
that further modify gas exchange in unpredictable ways. Is this behavior unique to small
alcohols or even to n-butanol, or is it a common behavior also for other compounds? This
provides the background for additional studies with more complex organic substances of
environmental importance including alcohols, aldehydes and carboxylic acids.
5. Conclusions
We have studied D2O interactions with solid and liquid n-butanol in the temperature range
from 160 to 200 K using EMB methods. The main conclusions can be summarized as follows:

15
• Hyperthermal collisions of D2O molecules with both solid and liquid butanol result in
efficient trapping and only a minor fraction scatters inelastically after substantial loss
(80%) of kinetic energy to surface modes.
• Inelastic scattering of D2O shows minor sensitivity to changes in surface properties in
the 160 to 200 K range, including both solid and liquid butanol surfaces prepared
under different conditions.
• A major fraction of the trapped water molecules either thermally desorbs within 0.25 –
3 ms, or is taken up by the butanol on a time scale longer than 10 ms. Desorption and
uptake both depend on the temperature and surface properties of the butanol phase.
• Traversing the bulk melting point at 184.5 K does not have a dramatic effect on water
uptake and desorption kinetics, and changes instead appear over a 10 K continuum
between 180 and 190 K.
• Water uptake and surface residence time increase rapidly with increasing temperature
above 180 K, indicating that solid butanol undergoes surface melting 4.5 K below the
melting point.
• Liquid butanol maintains a surface layer with limited water permeability up to 5.5 K
above the melting point. The permeability suddenly increases above 190 K and water
is rapidly lost by diffusion into the bulk liquid phase. This indicates that the surface
layer with limited water permeability corresponds to a distinct structure that is
destroyed around 190 K.
The surface properties of butanol change gradually from solid to liquid over a 10 K interval
centered around the bulk melting point, in sharp contrast to the behavior of the bulk material
and with significant consequences for water uptake. Further studies should proceed to
determine if the observed behavior of butanol is also found for other organic compounds, and
theoretical studies including molecular dynamics simulations will help to further improve our
understanding of water interactions with n-butanol and similar substances near melting. The
EMB method has the potential of being further developed to allow for studies at higher
pressures and temperatures25 of benefit for the molecular level understanding of interface
phenomena in biochemical and environmental systems.
Acknowledgements

16
This work is supported by the Swedish Research Council and the Nordic Top-Level Research
Initiative CRAICC. PP thanks the Wenner-Gren Foundation for providing funding for an
extended stay at the University of Gothenburg.

17
References
1. Ball, P. Water as an Active Constituent in Cell Biology. Chem. Rev. 2008, 108, 74-108.
2. Bartels-Rausch, T.; Bergeron, V.; Cartwright, J. H. E.; Escribano, R.; Finney, J. L.;
Grothe, H.; Gutierrez, P. J.; Haapala, J.; Kuhs, W. F.; Pettersson, J. B. C.; Price, S. D.;
Sainz-Diaz, C. I.; Stokes, D. J.; Strazzulla, G.; Thomson, E. S.; Trinks, H.; Uras-Aytemiz,
N. Ice Structures, Patterns, and Processes: A View across the Icefields. Rev. Mod. Phys.
2012, 84, 885-944.
3. Hallquist, M.; Wenger, J. C.; Baltensperger, U.; Rudich, Y.; Simpson, D.; Claeys, M.;
Dommen, J.; Donahue, N. M.; George, C.; Goldstein, A. H.; Hamilton, J. F.; Herrmann,
H.; Hoffmann, T.; Iinuma, Y.; Jang, M.; Jenkin, M. E.; Jimenez, J. L.; Kiendler-Scharr,
A.; Maenhaut, W.; McFiggans, G.; Mentel, T. F.; Monod, A.; Prévôt, A. S. H.; Seinfeld,
J. H.; Surratt, J. D.; Szmigielski, R.; Wildt, J. The Formation, Properties and Impact of
Secondary Organic Aerosol: Current and Emerging Issues. Atmos. Chem. Phys. 2009, 9,
5155-5236.
4. Kolb, C. E.; Cox, R. A.; Abbatt, J. P. D.; Ammann, M.; Davis, E. J.; Donaldson, D. J.;
Garrett, B. C.; George, C.; Griffiths, P. T.; Hanson, D. R.; Kulmala, M.; McFiggans, G.;
Pöschl, U.; Riipinen, I.; Rossi, M. J.; Rudich, Y.; Wagner, P. E.; Winkler, P. M.;
Worsnop, D. R.; O' Dowd, C. D. An Overview of Current Issues in the Uptake of
Atmospheric Trace Gases by Aerosols and Clouds. Atmos. Chem. Phys. 2010, 10, 10561-
10605.
5. Gill, P. S.; Graedel, T. E.; Weschler, C. J. Organic Films on Atmospheric Aerosol
Particles, Fog Droplets, Cloud Droplets, Raindrops, and Snowflakes. Rev. Geophys.
Space Phys. 1983, 21, 903-920.
6. Thornton, J. A.; Abbatt, J. P. D. N2O5 Reaction on Submicron Sea Sat Aerosol: Kinetics,
Products, and the Effect of Surface Active Organics. J. Phys. Chem. A 2005, 109, 10004-
10012.
7. Anttila, T.; Kiendler-Scharr, A.; Mentel, T. F.; Tillmann, R. Size Depnedent Partitioning
of Organic Material: Evidence for the Formation of Organic Coatings on Aqueous
Aerosols. J. Atmos. Chem. 2007, 57, 215-237.
8. Jimenez, J. L.; Canagaratna, M. R.; Donahue, N. M.; Prevot, A. S. H.; Zhang, Q.; Kroll,
J. H.; DeCarlo, P. F.; Allan, J. D.; Coe, H.; Ng, N. L.; Aiken, A. C.; Docherty, K. S.;
Ulbrich, I. M.; Grieshop, A. P.; Robinson, A. L.; Duplissy, J.; Smith, J. D.; Wilson, K.
R.; Lanz, V. A.; Hueglin, C.; Sun, Y. L.; Tian, J.; Laaksonen, A.; Raatikainen, T.;
Rautiainen, J.; Vaattovaara, P.; Ehn, M.; Kulmala, M.; Tomlinson, J. M.; Collins, D. R.;

18
Cubison, M. J.; Dunlea, E. J.; Huffman, J. A.; Onasch, T. B.; Alfarra, M. R.; Williams, P.
I.; Bower, K.; Kondo, Y.; Schneider, J.; Drewnick, F.; Borrmann, S.; Weimer, S.;
Demerjian, K.; Salcedo, D.; Cottrell, L.; Griffin, R.; Takami, A.; Miyoshi, T.;
Hatakeyama, S.; Shimono, A.; Sun, J. Y.; Zhang, Y. M.; Dzepina, K.; Kimmel, J. R.;
Sueper, D.; Jayne, J. T.; Herndon, S. C.; Trimborn, A. M.; Williams, L. R.; Wood, E. C.;
Middlebrook, A. M.; Kolb, C. E.; Baltensperger, U.; Worsnop, D. R. Evolution of
Organic Aerosols in the Atmosphere. Science 2009, 326, 1525-1529.
9. Nieto-Gligorovski, L.; Net, S.; Gligorovski, S.; Zetzsch, C.; Jammoul, A.; D’Anna, B.;
George, C. Interactions of Ozone with Organic Surface Films in the Presence of
Simulated Sunlight: Impact on Wettability of Aerosols. Phys. Chem. Chem. Phys. 2008,
10, 2964-2971.
10. Virtanen, A.; Joutsensaari, J.; Koop, T.; Kannosto, J.; Yli-Pirila, P.; Leskinen, J.; Makela,
J. M.; Holopainen, J. K.; Poschl, U.; Kulmala, M.; Worsnop, D. R.; Laaksonen, A. An
Amorphous Solid State of Biogenic Secondary Organic Aerosol Particles. Nature 2010,
467, 824-827.
11. Dixit, S.; Crain, J.; Poon, W. C. K.; Finney, J. L.; Soper, A. K. Molecular Segregation
Observed in a Concentrated Alcohol-Water Solution. Nature 2002, 416, 829-832.
12. Thomson, E. S.; Kong, X. R.; Andersson, P. U.; Markovic, N.; Pettersson, J. B. C.
Collision Dynamics and Solvation of Water Molecules in a Liquid Methanol Film. J.
Phys. Chem. Lett. 2011, 2, 2174-2178.
13. Chen, B.; Siepmann, J. I. Microscopic Structure and Solvation in Dry and Wet Octanol. J.
Phys. Chem. B 2006, 110, 3555-3563.
14. MacCallum, J. L.; Tieleman, D. P. Structures of Neat and Hydrated 1-Octanol from
Computer Simulations. J. Am. Chem. Soc. 2002, 124, 15085-15093.
15. Napoleon, R. L.; Moore, P. B. Structural Characterization of Interfacial n-Octanol and 3-
Octanol using Molecular Dynamic Simulations. J. Phys. Chem. B 2006, 110, 3666-3673.
16. Ashbaugh, H. S.; Pratt, L. R.; Paulaitis, M. E.; Clohecy, J.; Beck, T. L. Deblurred
Observation of the Molecular Structure of an Oil-Water Interface. J. Am. Chem. Soc.
2005, 127, 2808-2809.
17. Vacha, R.; Berkowitz, M. L.; Jungwirth, P. Molecular Model of a Cell Plasma Membrane
With an Asymmetric Multicomponent Composition: Water Permeation and Ion Effects.
Biophys. J. 2009, 96, 4493-4501.

19
18. Donaldson, D. J.; Valsaraj, K. T. Adsorption and Reaction of Trace Gas-Phase Organic
Compounds on Atmospheric Water Film Surfaces: A Critical Review. Environ. Sci.
Technol. 2010, 44, 865-873.
19. La Mer, V. K.; Aylmore, L. A. G.; Healy, T. W. Ideal Surface Behavior of Mixed
Monolayers of Long-Chain n-Paraffinic Alcohols. J. Phys. Chem. 1963, 67, 2793-2795.
20. Barnes, G. T. Permeation through Monolayers. Colloid Surface A 1997, 126, 149-158.
21. Thomson, E. S.; Kong, X.; Markovic, N.; Papagiannakopoulos, P.; Pettersson, J. B. C.
Collision Dynamics and Uptake of Water on Alcohol-Covered Ice. Atmos. Chem. Phys.
2013, 13, 2223-2233.
22. Gilde, A.; Siladke, N.; Lawrence, C. P. Molecular Dynamics Simulations of Water
Transport through Butanol Films. J. Phys. Chem. A 2009, 113, 8586-8590.
23. Lawrence, J. R.; Glass, S. V.; Nathanson, G. M. Evaporation of Water through Butanol
Films at the Surface of Supercooled Sulfuric Acid. J. Phys. Chem. A 2005, 109, 7449-
7457.
24. Park, S. C.; Burden, D. K.; Nathanson, G. M. Surfactant Control of Gas Transport and
Reactions at the Surface of Sulfuric Acid. Accounts Chem. Res. 2009, 42, 379-387.
25. Kong, X.; Andersson, P. U.; Markovic, N.; Pettersson, J. B. C. Environmental Molecular
Beam Studies of Ice Surface Processes. In Physics and Chemistry of Ice 2010, Furukawa,
Y., Sazaki, G., Uchida, T., Watanabe, N., Eds., Ed. Hokkaido University Press: Sapporo,
Japan, 2011: 2011; pp 79-88.
26. Kong, X. R.; Andersson, P. U.; Thomson, E. S.; Pettersson, J. B. C. Ice Formation via
Deposition Mode Nucleation on Bare and Alcohol-Covered Graphite Surfaces. J. Phys.
Chem. C 2012, 116, 8964-8974.
27. Bolshakov, B. V.; Dzhonson, A. G. On the Number of Amorphous Phases in n-Butanol:
Kinetics of Free Radicals Oxidation by Oxygen in Frozen n-Butanol. J. Non-Cryst. Solids
2005, 351, 444-454.
28. Wypych, A.; Guinet, Y.; Hédoux, A. Isothermal Transformation of Supercooled Liquid
n-Butanol near the Glass Transition: Polyamorphic Transitions in Molecular Liquids
Investigated using Raman Scattering. Phys. Rev. B 2007, 76, 144202.
29. Hassaine, M.; Jimenez-Rioboo, R. J.; Sharapova, I. V.; Korolyuk, O. A.; Krivchikov, A.
I.; Ramos, M. A. Thermal Properties and Brillouin-Scattering Study of Glass, Crystal,
and “Glacial” States in n-Butanol. J. Chem. Phys. 2009, 131, 174508.
30. Zgardzińska, B.; Paluch, M.; Goworek, T. Positronium Lifetime in Supercooled 1-
Butanol: Search for Polyamorphism. Chem. Phys. Lett. 2010, 491, 160-163.

20
31. Shmyt'ko, I. M.; Jimenez-Rioboo, R. J.; Hassaine, M.; Ramos, M. A. Structural and
Thermodynamic Studies of n-Butanol. J. Phys.-Condens. Matter 2010, 22, 195102.
32. Wilhoit, R. C.; Chao, J.; Hall, K. R. Thermodynamic Properties of Key Organic Oxygen
Compounds in the Carbon Range C-1 to C-4. Part 1. Properties of Condensed Phases. J.
Phys. Chem. Ref. Data 1985, 14, 1-175.
33. Haynes, W. M. Physical Constants of Organic Compounds. In CRC Handbook of
Chemistry and Physics, 92nd Edition (Internet Version 2012) [Online] CRC Press/Taylor
and Francis, Boca Raton, FL.: 2012.
34. Andersson, P. U.; Suter, M. T.; Markovic, N.; Pettersson, J. B. C. Water Condensation on
Graphite Studied by Elastic Helium Scattering and Molecular Dynamics Simulations. J.
Phys. Chem. C 2007, 111, 15258-15266.
35. El-Kashef, H. The Necessary Requirements Imposed on Polar Dielectric Laser Dye
Solvents. Physica B 2000, 279, 295-301.
36. Morishige, K.; Sakamoto, Y. Melting of n-Butanol and n-Pentanol Monolayers Adsorbed
on Graphite – Effect of Molecular Length on Melting. J. Chem. Phys. 1995, 103, 2354-
2360.
37. Suter, M. T.; Bolton, K.; Andersson, P. U.; Pettersson, J. B. C. Argon Collisions with
Amorphous Water Ice Surfaces. Chem. Phys. 2006, 326, 281-288.
38. Markovic´, N.; Andersson, P. U.; Någård, M. B.; Pettersson, J. B. C. Scattering of Water
from Graphite: Simulations and Experiments. Chem. Phys. 1999, 247, 413-430.
39. Andersson, P. U.; Någård, M. B.; Bolton, K.; Svanberg, M.; Pettersson, J. B. C.
Dynamics of Argon Collisions with Water Ice: Molecular Beam Experiments and
Molecular Dynamics Simulations. J. Phys. Chem. A 2000, 104, 2681-2688.
40. Andersson, P. U.; Någård, M. B.; Pettersson, J. B. C. Molecular Beam Studies of HCl
Interactions with Pure and HCl-Covered Ice Surfaces. J. Phys. Chem. B 2000, 104, 1596-
1601.
41. Chen, B.; Siepmann, J. I.; Klein, M. L. Vapor−Liquid Interfacial Properties of Mutually
Saturated Water/1-Butanol Solutions. J. Am. Chem. Soc. 2002, 124, 12232-12237.
42. Abascal, J. L. F.; Vega, C. A General Purpose Model for the Condensed Phases of Water:
TIP4P/2005. J. Chem. Phys. 2005, 123, 234505.
43. Jorgensen, W. L.; Maxwell, D. S.; TiradoRives, J. Development and Testing of the OPLS
All-Atom Force Field on Conformational Energetics and Properties of Organic Liquids.
J. Am. Chem. Soc. 1996, 118, 11225-11236.

21
44. Dash, J. G.; Rempel, A. W.; Wettlaufer, J. S. The Physics of Premelted Ice and its
Geophysical Consequences. Rev. Mod. Phys. 2006, 78, 695-741.
45. Dash, J. G. History of the Search for Continuous Melting. Rev. Mod. Phys. 1999, 71,
1737-1743.
46. Frenken, J. W. M. Vanderveen, J. F. Observation of Surface Melting. Phys. Rev. Lett.
1985, 54, 134-137.
47. Luo, J.; Chiang, Y. M. Wetting and Prewetting on Ceramic Surfaces. In Annual Review of
Materials Research, Annual Reviews: Palo Alto, 2008; Vol. 38, pp 227-249.
48. Mutter, R.; Stille, W.; Strobl, G. Transition Regions and Surface Melting in Partially
Crystalline Polyethylene – a Raman-Spectroscopic Study. J. Polym. Sci. Pol. Phys. 1993,
31, 99-105.
49. Alsayed, A. M.; Islam, M. F.; Zhang, J.; Collings, P. J.; Yodh, A. G. Premelting at
Defects Within Bulk Colloidal Crystals. Science 2005, 309, 1207-1210.
50. Krim, J.; Coulomb, J. P.; Bouzidi, J. Triple-Point Wetting and Surface Melting of
Oxygen Films Adsorbed on Graphite. Phys. Rev. Lett. 1987, 58, 583-586.
51. Bienfait, M.; Gay, J. M.; Blank, H. Surface Premelting of Thin Films of Methane. Surf.
Sci. 1988, 204, 331-344.
52. Chernov, A. A.; Yakovlev, V. A. Thin Boundary-Layers of the Melt of a Biphenyl
Single-Crystal and its Premelting. Langmuir 1987, 3, 635-640.
53. Dejeu, W. H.; Shindler, J. D.; Chandavarkar, S.; Geertman, R. M.; Liang, K. On the
(Absence of) Surface Melting in Biphenyl. Surf. Sci. 1995, 342, 341-344.
54. Chandavarkar, S.; Geertman, R. M.; Dejeu, W. H. Observation of a Prewetting Transition
during Surface Melting of Caprolactam. Phys. Rev. Lett. 1992, 69, 2384-2387.
55. Boutin, A.; Rousseau, B.; Fuchs, A. H. Surface Melting of a Molecular Crystal by
Computer Simulations. Surf. Sci. 1993, 287, 866-870.
56. Gang, O.; Wu, X. Z.; Ocko, B. M.; Sirota, E. B.; Deutsch, M. Surface Freezing in Chain
Molecules. II. Neat and Hydrated Alcohols. Phys. Rev. E 1998, 58, 6086-6100.
57. Ocko, B. M.; Wu, X. Z.; Sirota, E. B.; Sinha, S. K.; Gang, O.; Deutsch, M. Surface
Freezing in Chain Molecules: Normal Alkanes. Phys. Rev. E 1997, 55, 3164-3182.
58. Sloutskin, E.; Bain, C. D.; Ocko, B. M.; Deutsch, M. Surface Freezing of Chain
Molecules at the Liquid-Liquid and Liquid-Air Interfaces. Faraday Discuss. 2005, 129,
339-352.
59. Van Loon, L. L.; Minor, R. N.; Allen, H. C. Structure of Butanol and Hexanol at
Aqueous, Ammonium Bisulfate, and Sulfuric Acid Solution Surfaces Investigated by
22
Vibrational Sum Frequency Generation Spectroscopy. J. Phys. Chem. A 2007, 111, 7338-
7346.
60. Shiraiwa, M.; Ammann, M.; Koop, T.; Poschl, U. Gas Uptake and Chemical Aging of
Semisolid Organic Aerosol Particles. Proc. Natl. Acad. Sci. U. S. A. 2011, 108, 11003-
11008.

23
Figure captions
Fig. 1 Time-of-flight distributions for D2O scattering and desorbing from liquid and solid n-
butanol: experimental data (red points and line) and the total (black line), inelastic
scattering (IS) (blue line) and thermal desorption (TD) (gray line) components of the
non-linear fitting described in the text. The lower-most panel shows the distribution
measured in the incident beam. The experimental data have been normalized to the
incident beam intensity and smoothed with a seven point stepwise average. The
surface temperature is indicated in each panel.
Fig. 2 The absolute thermal desorption (TD) probability and the relative inelastic scattering
(IS) intensity for D2O on n-butanol as a function of temperature. The dashed line
indicates the melting temperature Tm = 184.5 K for n-butanol.
Fig. 3 Arrhenius plot of the desorption rate constant k and the surface residence time τ for
D2O on n-butanol. The solid line in the 160 – 180 K range is a linear least-square fit to
the data with an activation energy Ea = 0.08 ± 0.03 eV and a pre-exponential factor A
= 4.7⋅10(5.0 ± 0.8) s-1. Two additional linear least-square fits to the data are included in
the 180 – 190 K range with apparent activation energies of -0.57 ± 0.13 and -1.35 ±
0.08 eV below and above the melting point, respectively. The dashed line indicates the
melting temperature.
Fig. 4 (a) The desorption rate constant k, and (b) the thermal desorption (TD) probability for
D2O on n-butanol (BuOH) layers produced by different procedures: liquid butanol
deposited at 200 K and cooled to 160 K (green), solid butanol deposited at 160 K and
warmed to 190 K (purple), and new butanol layer deposited at each temperature (red)
with data reproduced from Figures 1-3 without error limits. The dashed line indicates
the melting temperature Tm = 184.5 K for n-butanol.

24
Figure 1
25
Figure 2

26
Figure 3

27
Figure 4

28
Table of contents image
0.0052 0.0055 0.00585
6
7
8
9
Wat
er d
esor
ptio
n, ln
(k)
Liquidbutanol
Solidbutanol
180 K190 K
Tmelting
Phasetransition
1/T (K-1)