surface stress and strain fields on compressed panels of...
TRANSCRIPT
Composite Structures 93 (2011) 2861–2873
Contents lists available at ScienceDirect
Composite Structures
journal homepage: www.elsevier .com/locate /compstruct
Surface stress and strain fields on compressed panels of corrugated board boxes.An experimental analysis by using Digital Image Stereocorrelation
J. Viguié a, P.J.J. Dumont a,⇑, L. Orgéas b, P. Vacher c, I. Desloges a, E. Mauret a
a Laboratoire de Génie des Procédés Papetiers (LGP2), CNRS/Institut polytechnique de Grenoble (Grenoble INP), 461 rue de la Papeterie, BP 65,38402 Saint-Martin-d’Hères cedex, Franceb Laboratoire Sols-Solides-Structures-Risques (3SR), CNRS/Université de Grenoble (Grenoble INP – UJF), BP 53, 38041 Grenoble cedex 9, Francec Laboratoire SYMME, Université de Savoie, Polytech Savoie, Domaine Universitaire, BP 80439, 74994 Annecy-le-Vieux, France
a r t i c l e i n f o
Article history:Available online 25 May 2011
Keywords:Corrugated boardDigital Image CorrelationCompressionBuckling behaviourOrthotropic propertiesResidual stress
0263-8223/$ - see front matter � 2011 Elsevier Ltd. Adoi:10.1016/j.compstruct.2011.05.018
⇑ Corresponding author. Tel.: +33 476826921.E-mail address: [email protected] (P.
a b s t r a c t
The complex behaviour of corrugated board packages under compression loading is investigated in thiswork. Original experimental data are obtained by using a Digital Image Stereocorrelation technique formeasuring the displacement and strain fields of the panels’ outer liner of the tested boxes. The stress fieldis also estimated by accounting for the anisotropic mechanical behaviour of the outer liner, its residualstress state induced by the processing of the corrugated board and the effects of box manufacturing oper-ations and compression. Results show that these fields are extremely heterogeneous on the panels’ sur-face. Most stressed areas are located along the panels’ edges. The elastic limit of the outer liner is reachedquite soon during compression. Box geometry and panel flaps are of primary importance on the observedphenomena. This approach delivers useful information to improve kinematic and constitutive assump-tions for buckling and post-buckling models of boxes or thin-walled sandwich structures.
� 2011 Elsevier Ltd. All rights reserved.
1. Introduction
There is an increasing demand in G-flute corrugated boards(also called nano-flute corrugated boards), which tend to replaceother lightweight packaging materials such as folding boards orplastics. Boxes have to withstand significant compression loadingconditions during carriage and storage. In order to evaluate theirstructural performance, the box compression test is the most cur-rently performed experiment. It consists in compressing an emptycontainer between two parallel plates at a constant velocity. Usu-ally, it is observed that buckling phenomena are localized in thebox panels, which bulge out during compression. At the maximumrecorded compression force, the deformation localises around thebox corners where creases appear and develop. This maximumforce is defined as the quasi-static compression strength of thebox. The prediction of such strength is the main topic of interestof past and current research works. Some authors strengthenedtheir efforts to obtain a description of the buckling and post-buck-ling behaviour of individual board panels [1–3]. Nordstrand [3]used an elastic and orthotropic description of the mechanicalbehaviour up to the failure. The chosen failure criterion was theTsai–Wu criterion for a plane stress case, which accounts for aniso-tropic strengths and different strengths in tension and compres-
ll rights reserved.
J.J. Dumont).
sion loading situations. Besides, the compression behaviour ofboxes was studied by McKee et al. [4] and Urbanik [5], who definedsemi-empirical formula to predict the box compression strength,as well as by Beldie et al. [6] and Biancolini and Brutti [7] by thefinite element method (FEM). But, comparisons of these modelswith experimental results remain somewhat scarce and limited.
Some full-field optical techniques for displacement or strainmeasurements were occasionally used in order to characterisethe mechanical behaviour of papers or paperboards [2,8,9] sub-jected to various loading conditions. In particular, Allansson andSvard [2] used a Digital Speckle Photography technique to measurethe out-of-plane displacement of a panel loaded in compressionusing a specially designed supporting frame. Despite its interest,this technique gave only access to rather limited information onthe displacement field, i.e. a component of the displacement field.Thorpe and Choi [8] made an attempt to measure the strains onsurfaces of box panels loaded in compression in the case of convexand concave buckling by using a classical Digital Image Correlationtechnique. They showed that the in-plane shear strains are signif-icant in the corner regions. However, measurements were onlyperformed in 2D, so that the information they gained on the strainfield was incomplete: e.g. the contribution of the gradients of theout-of-plane displacement to the strain components could not beassessed. This could be particularly inadequate when dealing withbuckling problems.
During the last decade, the DIC techniques have been increas-ingly developed. It is now possible to measure the 3D displacement
2862 J. Viguié et al. / Composite Structures 93 (2011) 2861–2873
field and the surface strain field of any 3D object by the digital im-age stereocorrelation technique (DISC) [10,11]. In this paper, thefirst objective is to describe the full 3D displacement field andthe related strain field of a box panel, during compression usingthis 3D DIC technique. The second objective is to determine the fullstress field in the outer liner, by considering the residual stresseswhich result from the corrugated board manufacturing, the elasticstresses which result from the box manufacturing and the elasticstresses which result from the box compression. The last objectiveis to emphasise the influence of the box geometry on the compres-sion behaviour.
In the first section of this paper, technical aspects related to thebox manufacturing, the measurement of the residual stresses, theevaluation of the parameters of the linear orthotropic elastic modelof the outer liner, the compression test and the 3D imaging tech-nique are given. In the second section, the initial displacement fieldand the associated strain field in the surface of a box panel, whichresult from the box manufacturing, are described. Thereafter, thedisplacement and strain fields during the box compression are pre-sented. Finally, the stress field in the outer liner is assessed and itsevolution is described. In the last section, the influence of the flapsand box dimensions on the buckling and post-buckling behaviourare discussed and some humble optimization routes are proposed.
2. Materials, specimens and experimental procedure
2.1. G-flute corrugated board and box manufacturing
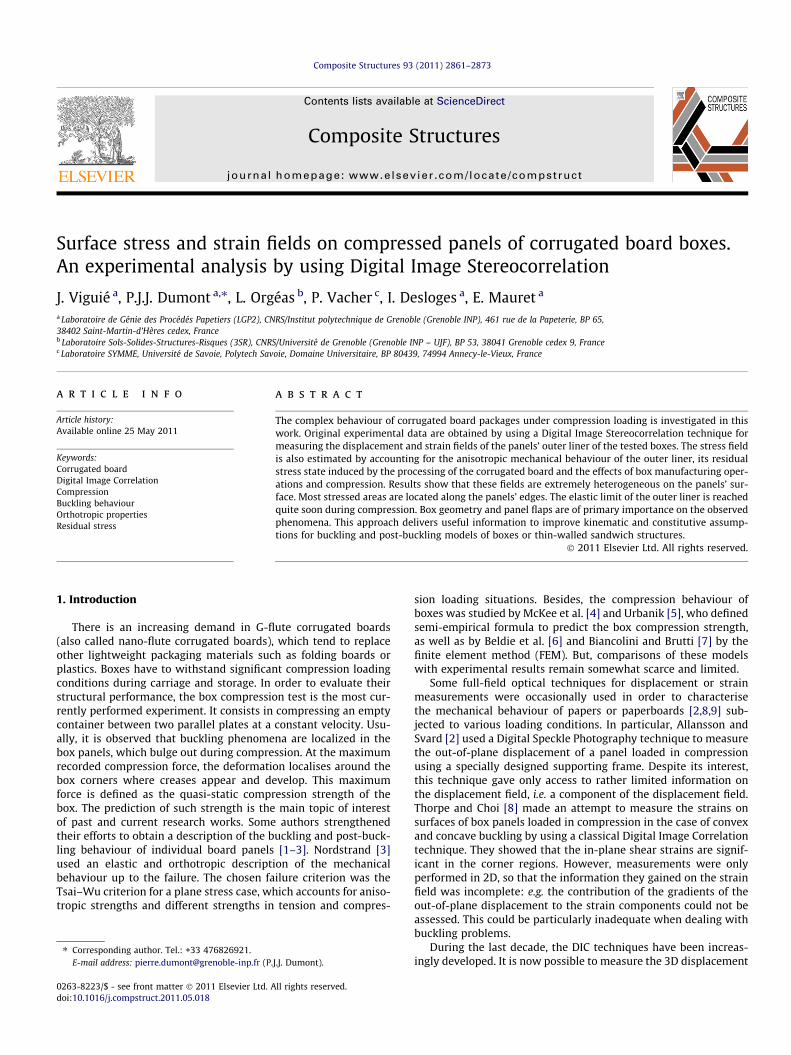
The material used in this study is a double-faced corrugatedboard with a G profile whose typical dimensions are shown inFig. 1a. This material has a nominal thickness e of 0.78 mmand an average basis weight of 450 g/m2. It is composed of aouter liner, a corrugated core and an inner liner which arerespectively a 160 g/m2 kraftliner, a 110 g/m2 corrugating med-ium and a 140 g/m2 testliner. These papers are glued togetherusing a starch-based adhesive. Tested boxes had a square base.The box blanks were drawn using the software ArtiosCad 5.2.They were cut and creased in a Kongsberg XL22 cutting table.
e
Folding line
Side panel
a a
b/2
b + e
Cutting line
b
(b)
0.165 mm
0.158 mm
0.944 mm0.447 mm
(a)
Fig. 1. (a) Picture of the cross-section of a G-flute profile corrugated board: image extrRadiation Facility (ESRF) on beamline ID19. (b) Box blank. (c) Assembled box and dimen
As shown in Fig. 1b and c, the box blank includes panels, flaps,scores and a manufacturer joint. The crease depth was chosenequal to 1 mm. The box dimensions are referred to as a for itsheight and b for its length and depth. Once the box was erectedand glued, the inner and outer flaps covered completely the topand bottom box surfaces. Note that the flutes are vertical in thebox panels: this means that the cross-direction of the corrugatedboard is aligned along the compression axis. Note that the ma-chine direction of the panels is referred to as the ex directionin the following and the cross direction of panels is referred toas the ey direction.
2.2. In-plane elastic constants of the outer liner
In order to estimate the stress field in the outer liner, the in-plane elastic constants of the outer liner were measured. Besides,a Tsai–Wu yield surface was built by identifying the yield pointson the stress–strain curves. As it is not the main subject of this pa-per, the procedures which were used in Viguié [12] are only brieflyexposed here. Two kinds of mechanical tests were carried out onrectangular samples: simple tensile test and plane strain compres-sion test. Simple tensile tests were performed following the Tappi T404 standard. For performing plane strain compression tests, a spe-cial setup prevented the sample buckling. Tested samples had var-ious orientations h = (e1,ex) where ex is, as in the previous section,the machine direction of the outer liner.
The tangent elastic modulus E11 was measured for each sample.By considering classical orthotropic linear elastic stress–strain con-stitutive relations under plane stress assumptions, the experimen-tally measured E11 moduli can be expressed with respect to theelastic constants Ex, Ey, Gxy and myx or mxy [13], which are respec-tively the machine direction elastic modulus, the cross-directionelastic modulus, the in-plane shear modulus, the in-plane Poisson’scoefficient. Using this expression for E11, the values of the elasticconstants were determined by fitting the experimental data. Theobtained values are shown in Table 1. It is worth noting that thedetermined elastic parameters reach values commonly encoun-tered for paper materials [14,15].
0.1bEnd panel
b
Flaps
(c)
Kraftliner 160 g/m²
Testliner 140 g/m²
Corrugated medium 110 g/m²
a
b b
ex (MD)
ey (CD)
acted from a 3D microtomography volume obtained at the European Synchrotronsions.

Table 1In-plane elastic constants of the 160 g/m2 outer kraftliner.
Ex Ey Gxy mxy myx
(N/mm2) (N/mm2) (N/mm2)
6870 2154 2104 0.22 0.07
Table 2Tsai–Wu criterion parameters.
Xt Xc Yt Yc S(N/mm2) (N/mm2) (N/mm2) (N/mm2) (N/mm2)
35.5 �13.0 12.5 �7.0 14.0
J. Viguié et al. / Composite Structures 93 (2011) 2861–2873 2863
To determine the yield point (or the elastic limit) the strategyconsisted in identifying the deviation point where the experi-mental strain energy density deviates from the theoretical elasticstrain energy. Then, the yield surface f was described using theTsai–Wu equation for plane stress conditions to fit the experi-mental points:
f ¼ C1rxx þ C2ryy þ C11r2xx þ C22r2
yy þ C66r2xy þ 2C12rxxryy ¼ 1;
ð1Þ
where
C11 ¼ �1
XtXc; C22 ¼ �
1YtYc
; C12 ¼ �1
2ffiffiffiffiffiffiffiffiffiffiffiffiffiffiffiffiffiffiffiffiXtXcYtYcp ;
C1 ¼1Xtþ 1
Xc; C2 ¼
1Ytþ 1
Yc; C66 ¼
1S2 ;
with rxx, ryy and rxy, the stress tensor components expressed in thematerial reference coordinate system (ex,ey), Xt, Xc, Yt, Yc and S someparameters experimentally determined. These parameters are usu-ally interpreted as follows: Xt is the tensile elastic limit along the ex
direction, Yt is the tensile elastic limit along the ey direction, Xc isthe compressive elastic limit along the ex direction, Yc is the com-pressive elastic limit along the ey direction and S is the shear elasticlimit in the plane (ex,ey). Their numerical values are given in Table 2.As it has been shown in some studies [17,16], the Tsai–Wu criterionis not optimum due to its quadratic form, which does not permit toaccurately describe the complex shape of the actual yield surface ofpapers. Nevertheless, it permits to represent the difference betweenthe tensile and compressive behaviour of paper and was adopted byseveral authors [18,19,3]. Here, it was considered accurate enoughto determine where the outer liner reaches its elastic limit duringthe box compression (see Section 3.3).
2.3. Estimation of the residual stresses in the outer liner
One way to assess the residual stresses resulting from thecorrugated board manufacturing operations is to machine awaythe outer liner [20]. Indeed, as the outer liner is removed, theboard curvatures in both the ex and ey directions change in re-sponse to the unbalanced forces. It should be noted that noappreciable twist of the samples before and after the outer linerremoving could be observed. Then, the residual stresses in theouter liner can be interpreted as the stresses which preventthe board from bending. The radii of curvature in the ex andey directions of five samples of 15 mm wide and 150 mm longwere measured before and after the outer kraftliner was re-moved. The radii of curvature were assessed using a millimetrepaper placed underneath these strips. In order to calculate theresidual stresses, the strip was considered as a elastic beam.Solving the equilibrium of forces and moments of a two layerbeam, the residual stress rri (along the MD i = x and the CDi = y) in the outer liner can be expressed as follows [21]:
rr i ¼1Ri� 1
R0 i
� �h4aE2
ai þ 2EaiEbihahb 3hahb þ 2h2a þ 2h2
b
� �þ h4
bE2bi
6Eaihahbðha þ hbÞ;
ð2Þ
where Eai and Ebi are the elastic moduli along the MD and CD of theboard after the outer layer was removed and of the outer liner,respectively. ha and hb are the thicknesses the board after the outerlayer was removed and of the outer liner, respectively. 1/R0i and 1/Ri
are the curvatures of the board after and before the outer liner wasremoved. As the corrugated board is perfectly flat, note that the cur-vatures 1/Ri were equal to zero in the two directions. Eai was as-sessed in the MD and CD measuring the bending stiffnesses Di ofthe board after the outer liner was removed. A two-point bendingtesting apparatus (Büchel – Van der Korput (Büchel BV, Utrecht,The Netherlands) Bending Tester (max. sensor force 5 N)) was used.Rectangular samples (38.1 � 69.9 mm2) were cut along the machineand cross directions and tested according to the ISO2493 standard.Then, elastic moduli Eai were estimated according to the theory ofthe single layer beam as follows:
Eai ¼12Di
h3a
: ð3Þ
The elastic moduli Ebi is equal to Ex and Ey along the machine direc-tion and the cross-direction, respectively. The outer liner has athickness hb = 0.16 mm (see also Fig. 1). Other values are given inTables 1 and 3.
2.4. Box compression tests
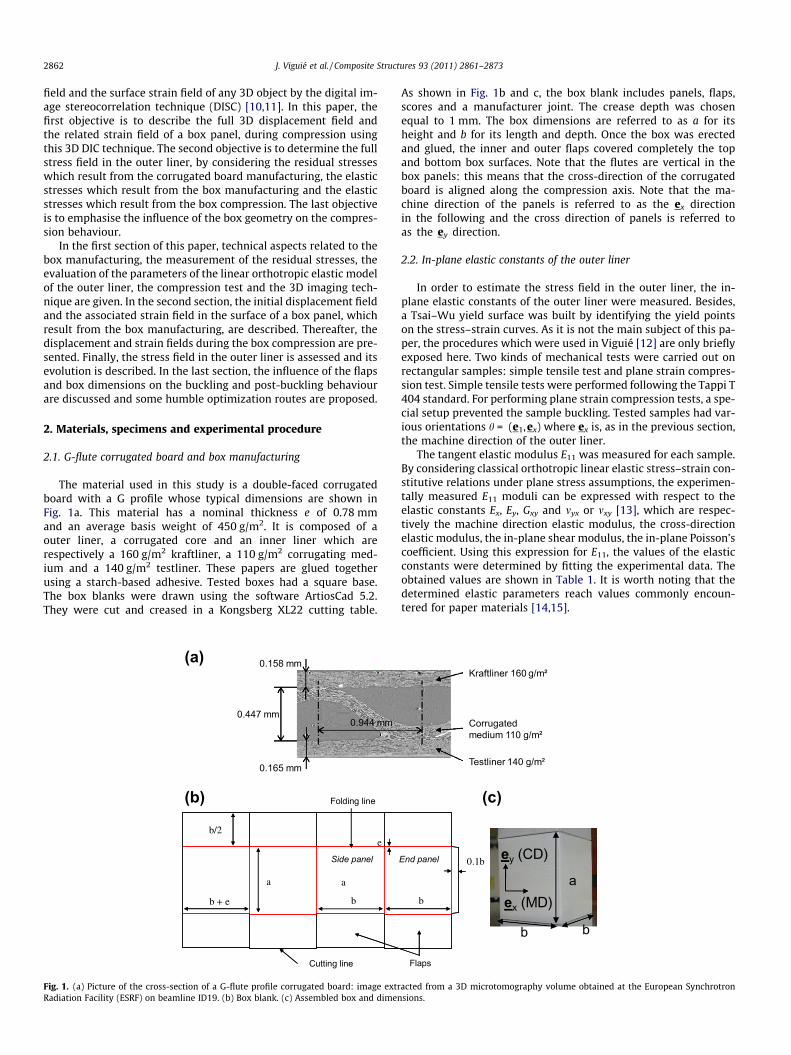
Compression tests were performed with an Instron 5569 pressat a compression velocity of 13 mm/min along the ey0 direction(see Fig. 2a). The compression plates were made up of polished alu-minium. A picture of a box, which was placed between the com-pression plates before the test, is shown in Fig. 2a. During theseexperiments, the compression force F and the axial plate displace-ment d were recorded. This permitted to calculate the followingmacroscopic box axial stress R simply defined as
R ¼ FS0; ð4Þ
where S0 = 4e(b � e) is defined arbitrarily as the surface of the boxcross-section perpendicular to the compression axis ey0 . Similarly,a macroscopic strain e is defined as
e ¼ lnaþ d
a: ð5Þ
A typical stress–strain curve obtained during a test is displayedin Fig. 2b.
2.5. Stereocorrelation technique
Two of the external panel surfaces were coated with a randompattern made of small black ink speckles. In order to estimate the3D displacement field of these two surfaces, the stereocorrelationtechnique was performed using the DIC Software 7D� [22]. Duringthe compression test, two images of the deforming panels and oftheir superimposed speckle patterns were recorded simulta-neously and sequentially by using, for stereovision, two cameras(Nikon 200D, 3872 � 2592 pixels), whose relative position and ori-entation a were known. The setup is presented in Fig. 2c. The anglea was less than 5�. Fig. 2d depicts a typical pair of images taken bythe left and the right cameras. Then, the correspondence betweentwo image points belonging to the pair of simultaneously recordedimages at the initial configuration (at t0) were identified by apply-ing a image correlation technique using square windows of 10 � 10
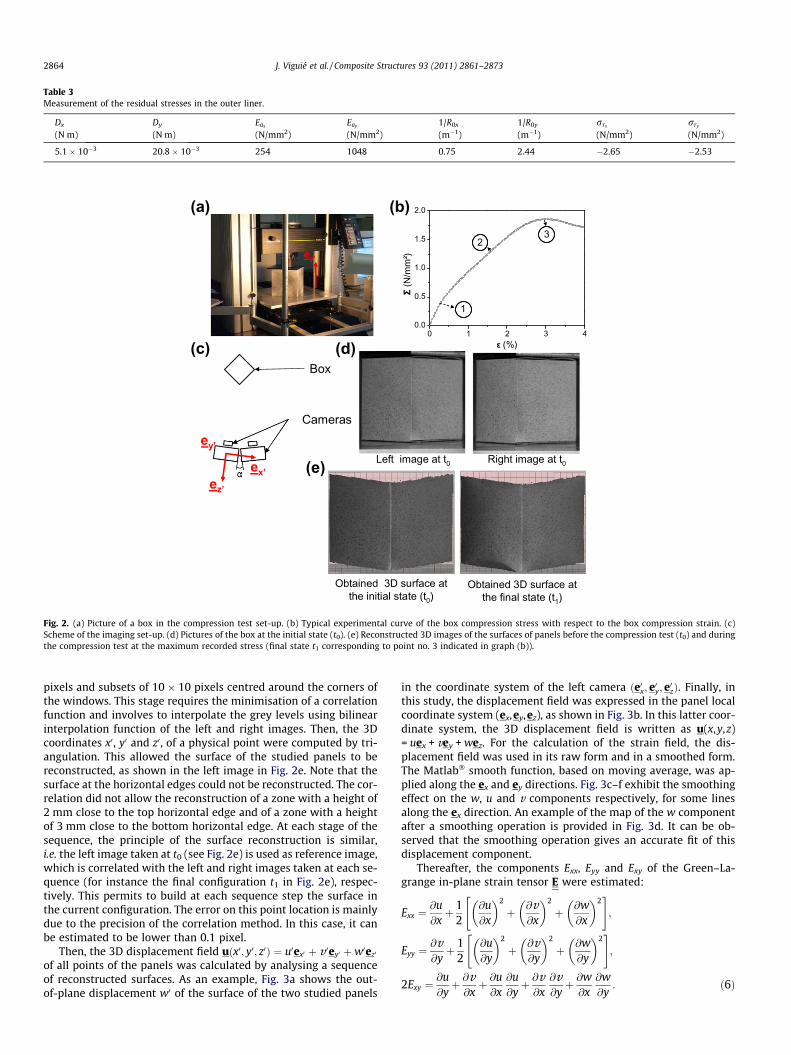
Table 3Measurement of the residual stresses in the outer liner.
Dx Dy Eax Eay 1/R0x 1/R0y rrx rry
(N m) (N m) (N/mm2) (N/mm2) (m�1) (m�1) (N/mm2) (N/mm2)
5.1 � 10�3 20.8 � 10�3 254 1048 0.75 2.44 �2.65 �2.53
(c)
(b)
ey’
(d)Box
Cameras
ez’
ey’ex’
0 1 2 3 40.0
0.5
1.0
1.5
2.0
Σ (N
/mm
²)
ε (%)
1
23
(e)
(a)
Obtained 3D surface atthe initial state (t0)
Left image at t0 Right image at t0
Obtained 3D surface atthe final state (t1)
Fig. 2. (a) Picture of a box in the compression test set-up. (b) Typical experimental curve of the box compression stress with respect to the box compression strain. (c)Scheme of the imaging set-up. (d) Pictures of the box at the initial state (t0). (e) Reconstructed 3D images of the surfaces of panels before the compression test (t0) and duringthe compression test at the maximum recorded stress (final state t1 corresponding to point no. 3 indicated in graph (b)).
2864 J. Viguié et al. / Composite Structures 93 (2011) 2861–2873
pixels and subsets of 10 � 10 pixels centred around the corners ofthe windows. This stage requires the minimisation of a correlationfunction and involves to interpolate the grey levels using bilinearinterpolation function of the left and right images. Then, the 3Dcoordinates x0, y0 and z0, of a physical point were computed by tri-angulation. This allowed the surface of the studied panels to bereconstructed, as shown in the left image in Fig. 2e. Note that thesurface at the horizontal edges could not be reconstructed. The cor-relation did not allow the reconstruction of a zone with a height of2 mm close to the top horizontal edge and of a zone with a heightof 3 mm close to the bottom horizontal edge. At each stage of thesequence, the principle of the surface reconstruction is similar,i.e. the left image taken at t0 (see Fig. 2e) is used as reference image,which is correlated with the left and right images taken at each se-quence (for instance the final configuration t1 in Fig. 2e), respec-tively. This permits to build at each sequence step the surface inthe current configuration. The error on this point location is mainlydue to the precision of the correlation method. In this case, it canbe estimated to be lower than 0.1 pixel.
Then, the 3D displacement field uðx0; y0; z0Þ ¼ u0ex0 þ v 0ey0 þw0ez0
of all points of the panels was calculated by analysing a sequenceof reconstructed surfaces. As an example, Fig. 3a shows the out-of-plane displacement w0 of the surface of the two studied panels
in the coordinate system of the left camera ðe0x; e0y; e0zÞ. Finally, inthis study, the displacement field was expressed in the panel localcoordinate system (ex,ey,ez), as shown in Fig. 3b. In this latter coor-dinate system, the 3D displacement field is written as u(x,y,z)= uex + vey + wez. For the calculation of the strain field, the dis-placement field was used in its raw form and in a smoothed form.The Matlab� smooth function, based on moving average, was ap-plied along the ex and ey directions. Fig. 3c–f exhibit the smoothingeffect on the w, u and v components respectively, for some linesalong the ex direction. An example of the map of the w componentafter a smoothing operation is provided in Fig. 3d. It can be ob-served that the smoothing operation gives an accurate fit of thisdisplacement component.
Thereafter, the components Exx, Eyy and Exy of the Green–La-grange in-plane strain tensor E were estimated:
Exx ¼@u@xþ 1
2@u@x
� �2
þ @v@x
� �2
þ @w@x
� �2" #
;
Eyy ¼@v@yþ 1
2@u@y
� �2
þ @v@y
� �2
þ @w@y
� �2" #
;
2Exy ¼@u@yþ @v@xþ @u@x
@u@yþ @v@x
@v@yþ @w@x
@w@y
: ð6Þ

x
w (mm)
20 40 60
20
40
60
0
0.5
1
1.5
2
x
w (mm)
0 20 40 600
20
40
60
0
0.5
1
1.5
2
y
Exx(%)
20 40 60
20
40
60
-4
-2
0
xx
xx
x
Exx(%)
20 40 60
20
40
60
-4
-2
0
ey
exezex’
ey’
ez’
yy
y
(a) (b)
(c) (d)
(e) (f)
(g) (h)
Fig. 3. (a) Component w0 of the displacement field of the two studied panels in the (x0 ,y0 ,z0) coordinate system. (b) Displacement w of the panel with outer flaps (see thearrow) in the panel coordinate system (x,y,z). (c) Smoothing effect on the displacement component w at y = 17 mm and y = 55 mm. (d) Displacement w after a smoothingoperation (see the arrow). (e) Smoothing effect on the displacement component u at y = 17 mm and y = 55 mm. (f) Smoothing effect on the displacement component v aty = 17 mm, y = 35 mm and y = 55 mm. (g) Component Exx of the strain field (obtained from the raw displacement field). (g) Same component when the displacement field issmoothed. Here, the reference configuration for the field measurements is the configuration of the box after its manufacturing.
20 40 60
20
40
60
0.5
1
1.5
20
x
y
Fig. 4. Map of the initial out-of-plane component w0 due to box manufacturingoperations for a box panel with outer flaps (box dimensions 73 � 73 � 73 mm3).
J. Viguié et al. / Composite Structures 93 (2011) 2861–2873 2865
The above spatial partial derivatives were calculated by using astandard centred finite difference scheme. Fig. 3g reveals that thecomponent Exx obtained using the raw displacement field is largelyheterogeneous. It is worth noting that the smoothed displacementfield allows a less ‘‘noisy’’ strain field to be obtained at the macro-scopic scale. The information contained in the smooth displace-ment field appeared us to be satisfactory for the rest of theanalysis.
3. Results
In this section, the behaviour of a panel with outer flaps of a cu-bic box with dimensions 73 � 73 � 73 mm3 is treated.
3.1. Initial displacement and strain fields resulting from the boxmanufacturing
After the box manufacturing operations, it appeared that thepanels were not perfectly flat. Indeed, an out-of-plane displace-ment w0 could be revealed thanks to the reconstructed 3D surfaceat the initial state t0 obtained by the stereocorrelation technique,
(see Fig. 2e). Fig. 4 reveals this component for the panel with outerflaps which is treated in this section. The w0 component reaches itsmaximum value at the centre of the panel whereas it is zero alongthe vertical edges. As the panel was not totally reconstructed, aslight out-of-plane displacement is noticed close to the bottomand top horizontal edges of the map. The displacementcomponents u0 and v0 resulting from the box manufacturing were

x (mm)
y (m
m)
20 40 60
20
40
60
0.1
0.2
0.3
0.4
x (mm)
y (m
m)
20 40 60
20
40
60
0.05
0.1
0.15
0.2
x (mm)
y (m
m)
20 40 60
20
40
60
-0.3
-0.2
-0.1
0
0.1
Exx (%) Eyy (%) 2Exy (%)(0) (0) (0)
Fig. 5. Maps of the components of the initial strain field E(0) due to box manufacturing operations on the surface of the panel with outer flaps (box dimensions73 � 73 � 73 mm3).
x
yw (mm)
0 20 40 600
20
40
60
00.511.52
x
y
v (mm)
0 20 40 600
20
40
60
-2
-1.5
-1
-0.5
0
x
y
u (mm)
0 20 40 600
20
40
60
-0.2
-0.1
0
0.1
)mm()mm()mm(
x
y
u (mm)
0 20 40 600
20
40
60
-0.2
-0.1
0
0.1
x
y
w (mm)
0 20 40 600
20
40
60
00.511.52
x
y
v (mm)
0 20 40 600
20
40
60
-2
-1.5
-1
-0.5
0
)mm()mm()mm(
x
y
u (mm)
0 20 40 600
20
40
60
-0.2
-0.1
0
0.1
x
yv (mm)
0 20 40 600
20
40
60
-2
-1.5
-1
-0.5
0
x
y
w (mm)
0 20 40 600
20
40
60
00.511.52
(mm) )mm()mm(
(mm
)(m
m)
(mm
)
(mm
)
(mm
)(m
m)
(mm
)
(mm
)
(mm
)
Fig. 6. Maps of the components u, v and w of the displacement field at three compression stages noted 1, 2 and 3 corresponding to macroscopic compression strains e = 0.3%,1.7% and 3%, respectively (see Fig. 2b). Here, the reference configuration for the field measurements is the configuration of the box after its manufacturing as in Fig. 3.
2866 J. Viguié et al. / Composite Structures 93 (2011) 2861–2873
considered insignificant. Then, the three components of the relatedinitial strain field noted E(0) were assessed from Eq. (6). Fig. 5 de-picts these components. The component Eð0Þxx is different from zeroonly along the vertical edges where it reaches a maximum of 0.4%at the middle. The component Eð0Þyy is maximum along the horizon-tal edges and reaches values twice lower. Notice that these compo-nents are positive, which is characteristic of a tensile deformationstate. Finally, the component Eð0Þxy is only significant in the cornerregions (around 0.2%).
3.2. Displacement and strain fields resulting from the box compression
In this section, only the displacement and strain fields, whichresult from the box compression, are studied. The initial or refer-
ence configuration is the configuration of the box after itsmanufacturing.
3.2.1. Evolution of the displacement field during compressionThe stereocorrelation technique was used to describe the dis-
placement field of the panel at three compression stages, corre-sponding to the following box macroscopic strains e = 0.3%, 1.7%and 3%, respectively. The corresponding stress–strain curve is thatgiven in Fig. 2b. As shown in this figure, the last compression straine = 3% corresponds to the box compression critical strain.
The components u, v and w of the displacement field are dis-played in Fig. 6. Firstly, it is worth noting that the displacementcomponents are largely heterogeneous whatever the compressionstrain. The out-of-plane displacement w and the in-plane
x
x
u
∂∂ 2
2
1
∂∂
x
w )%()%((b)
x
y
20 40 60
20
40
60
-2
-1
0
x
y
20 40 60
20
40
60
-2
-1
0
x
y
20 40 60
20
40
60
-2
-1
0
xy(a) (%) (%) 2E (%)
x
y
20 40 60
20
40
60
-6
-4
-2
0
2
x
y
20 40 60
20
40
60
-6
-4
-2
0
2
x
y
20 40 60
20
40
60
-2
-1
0
1
x
y
20 40 60
20
40
60
-2
-1
0
1
(c)y
v
∂∂
2
2
1
∂∂
y
w )%()%(
E Eyyxx
Fig. 7. (a) Components of the Green–Lagrange strain tensor of the panel with outer flaps at the critical strain emax = 3%, box dimensions 73 � 73 � 73 mm3. (b) Maps of thehorizontal in-plane displacement gradient and out-of-plane displacement gradient contributing to the strain component Exx. (c) Same maps for the strain component Eyy.Here, the reference configuration for the field measurements is the configuration of the box after its manufacturing.
J. Viguié et al. / Composite Structures 93 (2011) 2861–2873 2867
displacement v are of the same order of magnitude and these twocomponents are largely higher than the in-plane displacement u.
The out-of-plane displacement component w is never equal tozero, even for the first compression stage, i.e. e = 0.3%. This clearlyindicates that the panel buckling is the predominant phenomenonand that it occurs and develops very early during the box compres-sion. It is also interesting to notice that this field is not symmetricwith respect to the horizontal median line of the panel. The maxi-mum values of this component are obtained for a zone, locatedclose to the top horizontal edge at the beginning of the compres-sion, which is moved towards the bottom edge of the box at thecritical strain, i.e. e = 3%. Besides, the surface of the zone was in-creased during the compression, as the values of w close to thebox edges remained nearly equal to zero or were even slightly neg-ative. Thus, high gradients for this component were found whengoing through the panel from its edges to the previous centralzone, especially along the ey direction.
The component v of this displacement field was found to be ofthe same order as w. But quite astonishingly, it can also be ob-served that this component is nearly homogeneous over the wholepanel surface. This means that the panel exhibits a vertical transla-tory motion during the box compression. Its origin might be re-lated to a motion and a compression of the outer flaps joined tothe panel, and more presumably to the crush of the junction scoresduring the compression experiment. Unfortunately, the scores areoutside the correlation images. This point could be improved in fu-ture works.
The component u of the displacement field was observed to besmall compared to v and w. It is nevertheless interesting to analyseit more precisely, especially for the last compression stage. Itmakes indeed appear that there are zones in the centre of the paneland close to its corners, where this component is very weak. On thecontrary, along the vertical edges of the panel, this component iscompletely heterogeneous and shows a maximum approximatelylocated at the median height of the panel. Thus, during the boxcompression, the vertical edges of the panel do not remain straightand tend to move towards the panel centre as the compressionstrain increases.
3.2.2. Strain field at the critical strain and contributions of thedisplacement components
When calculating the components of the Green–Lagrange straintensor, it appeared that the contribution of some spatial gradientsof u, v and w are insignificant (<0.0015). This permits to write thestrain components Exx, Eyy and 2Exy adopting the following reducedexpressions, which correspond to a von Kármán-type strain field [13]:
Exx �@u@xþ 1
2@w@x
� �2
;
Eyy �@v@yþ 1
2@w@y
� �2
;
2Exy �@u@yþ @v@xþ @w@x
@w@y
: ð7Þ

x (mm)
y (m
m)
20 40 60
20
40
60
-0.8
-0.6
-0.4
-0.2
0
x (mm)
y (m
m)
20 40 60
20
40
60
0
0.2
0.4
0.6
0.8
x (mm)
y (m
m)
20 40 60
20
40
60
-0.8
-0.6
-0.4
-0.2
0
= 0.3%
= 3%
= 1.7%
x (mm)
y (m
m)
20 40 60
20
40
60
0
0.2
0.4
0.6
0.8
x (mm)
y (m
m)
20 40 60
20
40
60
-0.8
-0.6
-0.4
-0.2
0
x (mm)
y (m
m)
20 40 60
20
40
60
0
0.2
0.4
0.6
0.8
Fig. 8. Maps of the invariants of the strain tensor IE and QE , and map showing the magnitude and the orientation of the principal strain components at three compressionstages e = 0.3%, e = 1.7% and e = 3% for the panel with outer flaps of the box with dimensions 73 � 73 � 73 mm3. Here, the reference configuration for the field measurementsis the configuration of the box after its manufacturing.
2868 J. Viguié et al. / Composite Structures 93 (2011) 2861–2873
Fig. 7a exemplifies the components Exx, Eyy and 2Exy of the strainfield at the critical compression strain e = 3%. This stage of the com-pression was chosen because this is a priori the most deformedstrain stage. Fig. 7b and c reveal the contributions of the gradientof the in-plane u and v displacements @u/@ x and @v/@y, and ofthe gradient of the out-of-plane w displacement 1/2(@w/@x)2 and1/2(@w/@y)2 to the strains Exx and Eyy. This latter contribution haspositive values, whereas the in-plane ones are negative. However,the out-of-plane contribution only reaches 50% at the maximum ofthe in-plane contribution. Of course, it cannot be neglected andemphasises the significant influence of the panel buckling on thestrain state. But the in-plane contribution is predominant, and thisexplains why there are rather narrow zones in tension at the sur-face of this panel despite its pronounced bulging due to the boxcompression.
As revealed in Fig. 7a, the values of the strain components arealmost equal to zero in the region of the panel centre. By contrastthe strain variations are more pronounced along the panel edges.Noticeable variations of Exx can be observed along the verticaledges of the box, whereas the variations of Eyy appear mainly alongthe horizontal edges of the panel. The negative values of thesestrain components are characteristic of a compressive deformationstate. The maximum compressive strains are attained at the middleof the edges, and gradually decrease close to the corner regions. Itis also interesting to notice that the highly compressed zones (Exx
or Eyy 6 �1%) are wider along the vertical edges than along the hor-izontal edges, despite these latter edges are perpendicular to thebox compression axis. The relatively limited intensity of the com-ponent Eyy over the whole surface of the outer liner may certainlybe related to strong phenomena of compression of the flaps and
crush of the horizontal scores, which consequently ‘‘reduce’’ thedeformation of the outer liner of the panel in the vertical direction.The high intensity of the component Exx is more surprising. It re-veals the complexity of the deformation mechanisms of the box.It shows also that the deformation of the observed panel is severelyconstrained by its neighbouring panels.
3.2.3. Evolution of the strain field during compressionIn the following,, the principal components EI, EII of the in-plane
strain tensor E and the principal direction angle b measured fromthe principal material coordinate system (ex,ey) to the principalstrain coordinate system (eI,eII) were calculated as
EI ¼Exx þ Eyy
2
� �þ 1
2
ffiffiffiffiffiffiffiffiffiffiffiffiffiffiffiffiffiffiffiffiffiffiffiffiffiffiffiffiffiffiffiffiffiffiffiffiffiffiffiffiffiffiffiffiffiðExx � EyyÞ2 þ ð2ExyÞ2
q; ð8Þ
EII ¼Exx þ Eyy
2
� �� 1
2
ffiffiffiffiffiffiffiffiffiffiffiffiffiffiffiffiffiffiffiffiffiffiffiffiffiffiffiffiffiffiffiffiffiffiffiffiffiffiffiffiffiffiffiffiffiðExx � EyyÞ2 þ ð2ExyÞ2
q; ð9Þ
b ¼ 12
arctan2Exy
Exx � Eyy
� �: ð10Þ
To better describe the strain state and its evolution during thebox compression, the first in-plane strain invariant IE, which ac-counts for the mean compressive or tensile strain, and the in-planestrain invariant Q E, which accounts for the mean shear strain, weredetermined by using the following expressions:
IE ¼12
TrðEÞ ¼ EI þ EII
2;
QE ¼ffiffiffiffiffiffiffiffiffiffiffiffiffiffiffiffiffiffiffiffiffiffiffiffi12
Tr �E � �E� �r
¼ jEI � EIIj2
; ð11Þ

x (mm)
y (m
m)
f
20 40 60
20
40
60
0
0.5
1
x (mm)
y (m
m)
20 40 60
20
40
60
0
10
20
30
40
x (mm)
y (m
m)
20 40 60
20
40
60
-40
-20
0
x (mm)
y (m
m)
f
20 40 60
20
40
60
0
0.5
1
x (mm)
y (m
m)
20 40 60
20
40
60
0
10
20
30
40
x (mm)
y (m
m)
20 40 60
20
40
60
-40
-20
0
x (mm)
y (m
m)
20 40 60
20
40
60
0
10
20
30
40
x (mm)
y (m
m)
20 40 60
20
40
60
-40
-20
0
x (mm)
y (m
m)
20 40 60
20
40
60
0
10
20
30
40
x (mm)
y (m
m)
20 40 60
20
40
60
-40
-20
0
x (mm)
y (m
m)
f
20 40 60
20
40
60
0
0.5
1
x (mm)
y (m
m)
f
20 40 60
20
40
60
0
0.5
1
Fig. 9. Maps of the invariants of the stress tensor Ir and Q �r , and map of the yield criterion before the compression e = 0% and at three compression stages e = 0.3%, e = 1.7% ande = 3% for the panel with outer flaps of the box with dimensions 73 � 73 � 73 mm3.
J. Viguié et al. / Composite Structures 93 (2011) 2861–2873 2869
where E ¼ E� 12 TrðEÞI is the deviatoric part of the strain tensor, I is
the identity tensor and Tr is the trace operator.Fig. 8 depicts the maps of the invariants IE and QE for three com-
pression stages. For each couple of maps, a third map shows themagnitude and the orientation of the principal strains EI and EII
in some points of the panel. Considering the evolution of IE andQ E during box compression, one can notice that the regions alongthe vertical and horizontal edges, which have been identified pre-viously as the most deformed zones, at the last compression stage,behave very differently. The compressive and shear states gradu-ally increase in magnitude along the vertical edges during the com-pression, i.e. from e = 0.3% up to 3%, whereas they increasesuddenly at the last compression stage along the horizontal edges.At this stage, along the vertical edges, the mean compressive strainis twice greater than the mean shear strain, whereas, along thehorizontal edges, values are equivalent. This phenomenon is wellillustrated in the maps showing the magnitude of the principalstrains. In addition, there is a large zone around the panel centre,
where the strain state does not evolve significantly duringcompression.
Finally, the compression leads to different variations of thestrain state at the panel scale. On the one hand, the bucklingphenomenon results in a regular increase of the strain statealong the vertical edges. On the other hand, it leads to a suddenincrease of the strain state along the horizontal edges at the crit-ical box compression strain. The last phenomenon can be relatedto the occurrence of a crease close to the bottom edge, revealedin Fig. 2e.
3.3. Stress field in the outer liner
It was assumed that the full stress field r in the outer liner wasdecomposed into three contributions: one resulting from the resid-ual stress field induced by the board manufacturing operation rr,one other resulting from the box manufacturing operation r0 andone other resulting from the box compression re:
0,0 0,5 1,0 1,5 2,00
1
2
3
4
wm
ax (m
m)
Σ (N/mm2)
73 x 73 x 73 mm3
135 x 135 x 135
135 x 135 x 68
135 x 135 x 34
x
y
v (mm)
20 40 60 80 100120
20406080
100
-2
-1.5
-1
-0.5
0
x
y
u (mm)
20 40 60 80 100120
20406080
100
-0.2
0
0.2
x
y
w (mm)
20 40 60 80 100120
20406080
100
0
1
2
3
x
y
w (mm)
20 40 60 80 100120102030
0123
x
y
v (mm)
20 40 60 80 100120102030
-2-10
x
y
u (mm)
20 40 60 80 100120102030
-0.200.2
x
y
u (mm)
20 40 60 80 100120
20
40
60
-0.2
0
0.2
x
y
v (mm)
20 40 60 80 100120
20
40
60
-2
-1
0
x
y
w (mm)
20 40 60 80 100120
20
40
60
0123
(d)
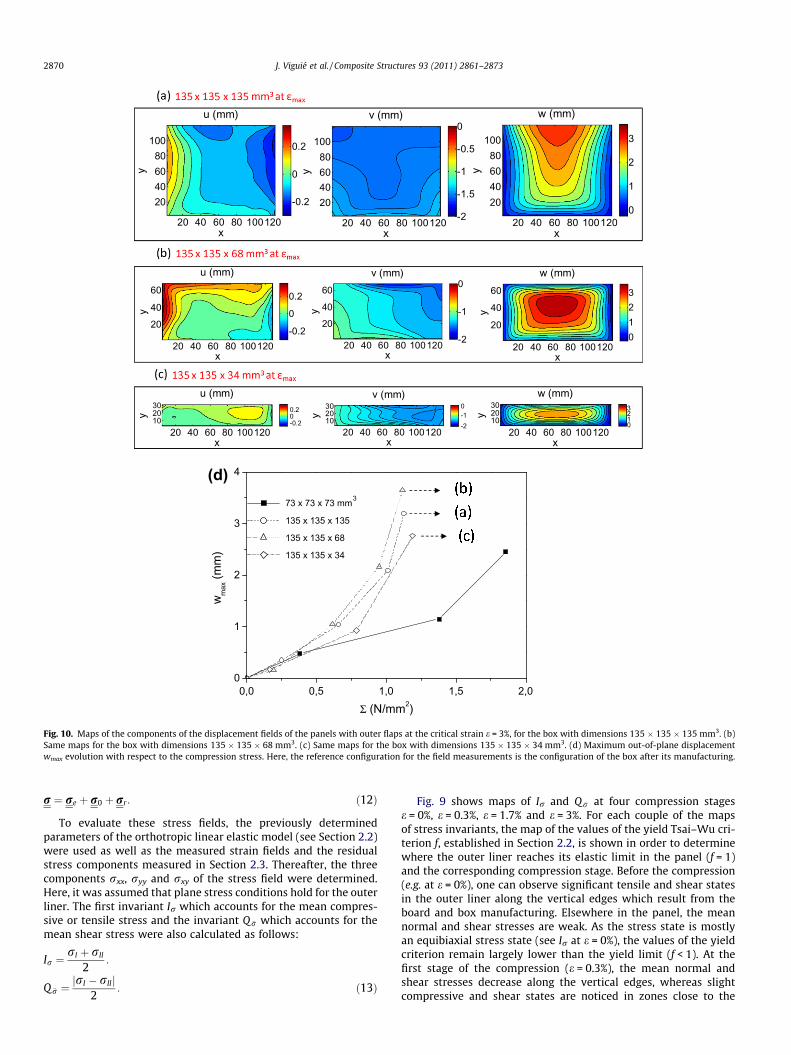
Fig. 10. Maps of the components of the displacement fields of the panels with outer flaps at the critical strain e = 3%, for the box with dimensions 135 � 135 � 135 mm3. (b)Same maps for the box with dimensions 135 � 135 � 68 mm3. (c) Same maps for the box with dimensions 135 � 135 � 34 mm3. (d) Maximum out-of-plane displacementwmax evolution with respect to the compression stress. Here, the reference configuration for the field measurements is the configuration of the box after its manufacturing.
2870 J. Viguié et al. / Composite Structures 93 (2011) 2861–2873
r ¼ re þ r0 þ rr: ð12Þ
To evaluate these stress fields, the previously determinedparameters of the orthotropic linear elastic model (see Section 2.2)were used as well as the measured strain fields and the residualstress components measured in Section 2.3. Thereafter, the threecomponents rxx, ryy and rxy of the stress field were determined.Here, it was assumed that plane stress conditions hold for the outerliner. The first invariant Ir which accounts for the mean compres-sive or tensile stress and the invariant Q �r which accounts for themean shear stress were also calculated as follows:
Ir ¼rI þ rII
2:
Q �r ¼jrI � rIIj
2: ð13Þ
Fig. 9 shows maps of Ir and Q �r at four compression stagese = 0%, e = 0.3%, e = 1.7% and e = 3%. For each couple of the mapsof stress invariants, the map of the values of the yield Tsai–Wu cri-terion f, established in Section 2.2, is shown in order to determinewhere the outer liner reaches its elastic limit in the panel (f = 1)and the corresponding compression stage. Before the compression(e.g. at e = 0%), one can observe significant tensile and shear statesin the outer liner along the vertical edges which result from theboard and box manufacturing. Elsewhere in the panel, the meannormal and shear stresses are weak. As the stress state is mostlyan equibiaxial stress state (see Ir at e = 0%), the values of the yieldcriterion remain largely lower than the yield limit (f < 1). At thefirst stage of the compression (e = 0.3%), the mean normal andshear stresses decrease along the vertical edges, whereas slightcompressive and shear states are noticed in zones close to the
(a)
(b)
(c)
0
1
2
3
wm
ax (m
m)
Σ (N/mm2)
Panel A Panel B
x
y
w (mm)
0 20 40 600
20
40
60
00.511.52
0.0
0.1
0.2
0.3
0.4
Σ (N/mm2)
-2
-1.5
-1
-0.5
0
0.0 0.5 1.0 1.5 2.0
0.0 0.5 1.0 1.5 2.0
Panel A Panel B
x
yv (mm)
0 20 40 600
20
40
60
Δv(m
m)
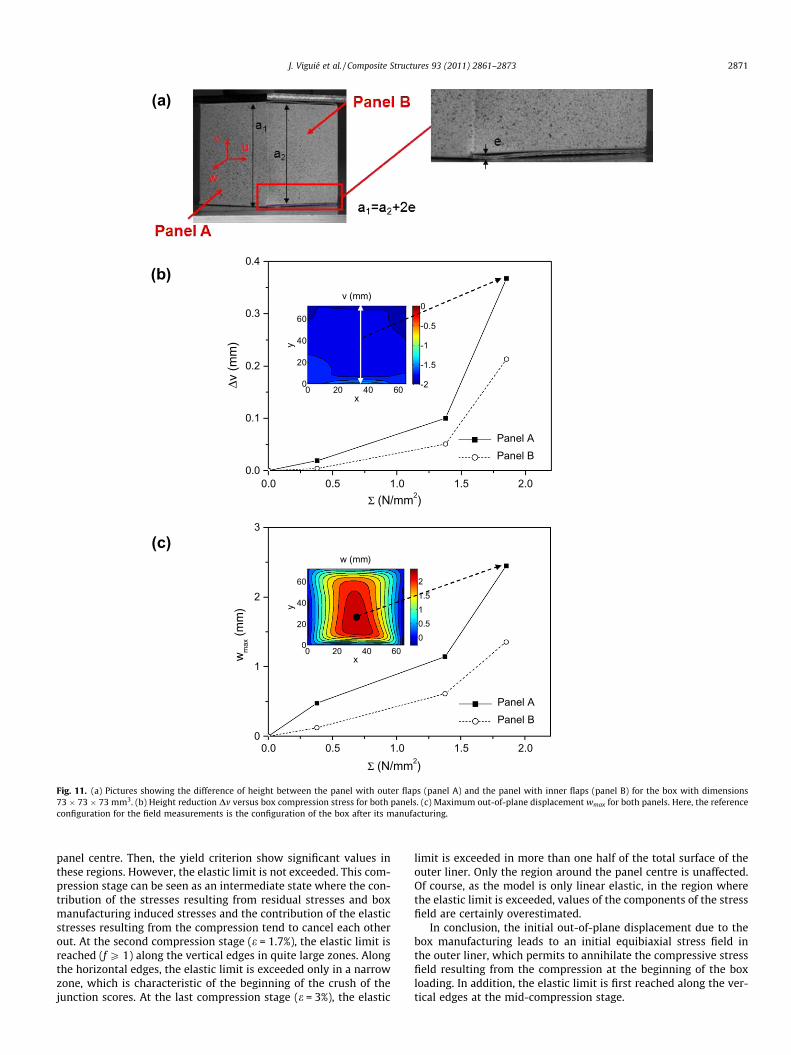
Fig. 11. (a) Pictures showing the difference of height between the panel with outer flaps (panel A) and the panel with inner flaps (panel B) for the box with dimensions73 � 73 � 73 mm3. (b) Height reduction Dv versus box compression stress for both panels. (c) Maximum out-of-plane displacement wmax for both panels. Here, the referenceconfiguration for the field measurements is the configuration of the box after its manufacturing.
J. Viguié et al. / Composite Structures 93 (2011) 2861–2873 2871
panel centre. Then, the yield criterion show significant values inthese regions. However, the elastic limit is not exceeded. This com-pression stage can be seen as an intermediate state where the con-tribution of the stresses resulting from residual stresses and boxmanufacturing induced stresses and the contribution of the elasticstresses resulting from the compression tend to cancel each otherout. At the second compression stage (e = 1.7%), the elastic limit isreached (f P 1) along the vertical edges in quite large zones. Alongthe horizontal edges, the elastic limit is exceeded only in a narrowzone, which is characteristic of the beginning of the crush of thejunction scores. At the last compression stage (e = 3%), the elastic
limit is exceeded in more than one half of the total surface of theouter liner. Only the region around the panel centre is unaffected.Of course, as the model is only linear elastic, in the region wherethe elastic limit is exceeded, values of the components of the stressfield are certainly overestimated.
In conclusion, the initial out-of-plane displacement due to thebox manufacturing leads to an initial equibiaxial stress field inthe outer liner, which permits to annihilate the compressive stressfield resulting from the compression at the beginning of the boxloading. In addition, the elastic limit is first reached along the ver-tical edges at the mid-compression stage.

2872 J. Viguié et al. / Composite Structures 93 (2011) 2861–2873
4. Discussion
4.1. Influence of the box geometry
In order to study accurately the influences of the aspect ratio a/bon the one hand and panel dimensions on the other hand, threemore boxes with different dimensions were tested. Boxes hadbases of 135 � 135 mm2 and heights a = 135, 68 and 34 mm (i.e.aspect ratios of panels a/b = 1, 0.5 and 0.25, respectively). For eachbox, the displacement field is described for one panel with outerflaps at the critical compression strain. The components u, v andw of the displacement fields are displayed in Fig. 10 for the threepanels.
Comparing Figs. 10a–c and 6, the maps of the components ofthe displacement field differ essentially in magnitude. The maxi-mum of the u component in the panel with a height of 135 mmis twice lower than the maximum recorded value in the panel witha height of 68 mm, which is in the same order of magnitude as inthe panel previously described of 73 � 73 mm2. On the contrary,the component u of the panel with a height of 34 mm remainsclose to zero along the vertical edges. The maximum of the w com-ponent is the highest in the panel with a height of 68 mm. It is onlyslightly lower for the panel with a height of 135 mm and signifi-cantly lower for the two other panels. As a result, the magnitudesof the displacement components seem to be clearly dependent onthe aspect ratio and dimensions of the panel.
In order to better study this dependence, the evolution of themaximum recorded out-of-plane displacement wmax for the fourtypes of panels with respect to the compression stress R up toits critical value is depicted in Fig. 10d. For panels with a lengthb = 135 mm, curves show a quite similar evolution. The gradientof wmax is becoming higher as the critical stress is being reached.The highest values of the out-of-plane component w are reachedfor the rectangular panel with an aspect ratio a/b � 0.5 and corre-spond to the lowest compression stresses. For the panel of73 � 73 mm2, the out-of-plane maximum values are largely lowerand the related compression stresses are largely greater. Some ofthese observations (e.g. the highest load reached during compres-sion for the panels with a length b of 73 mm compared with thosehaving a length of 135 mm) can be explained by the very simplifiedassumptions based on elastic buckling theory adopted by McKeeet al. [4] or Urbanik [5] to predict the compression strength of cor-rugated board boxes. Nonetheless, the slight differences observedbetween the behaviour of the various panels with a lengthb = 135 mm cannot be explained by these simplified theories. Thisshows that some improvement of these modelling approachesshould be undertaken, as previously discussed by Viguié et al.[23]. This should be done for panels with outer flaps as well asfor panels with inner flaps as shown in the next section.
4.2. Influence of panels’ flaps
Fig. 11 allows a comparison between the behaviour of the panelwith outer flaps and the panel with inner flaps (box with dimen-sions 73 � 73 � 73 mm3). Their geometry can be compared inFig. 11a. Fig. 11b and c give the change of v noted Dv, defined asthe positive difference between the vertical v displacements ofthe bottom and top horizontal edges, and the maximum recordedout-of-plane displacement wmax, with respect to the compressionstress R up to its critical value. For the two kinds of panels, theseparameters exhibit a smooth increase with the stress, followedby a sharp increase. However, the values of Dv and wmax obtainedfor the panel with inner flaps are systematically 30% or 40%,respectively, lower than those of the panel with outer flaps. Thisreveals that the buckling phenomenon of panels is heterogeneous
at the box scale. The origin of this different behaviour betweenboth types of panels can be attributed to their differences in geom-etry. The panel with inner flaps is indeed a little bit shorter thanthe panel with outer flaps (see Fig. 11a). As a consequence, it canbe assumed that the panels with inner and outer flaps are not sub-jected to the same load at the same compression stage. Indeed, asthe outer flaps have a low resistance in compression in the thick-ness direction, one can assume that the compression of the panelwith inner flaps begins after the outer flaps have been compressed.This assumption can be confirmed by the value of Dv, at the firstcompression stage, which is almost zero for the panel with innerflaps. In numerous empirical and numerical models used for pre-dicting the box compression behaviour, the compression load isconsidered equally distributed on the four panels. In the case ofboxes with flaps, this assumption might lead to erroneous results.It can be assumed that the distribution of the load on the panels isconstantly changing during the compression. In order to verify thisassumption, the resulting forces and moments could be calculatedin all panel sections. But this necessitates to know the full mechan-ical behaviour of all the components of the corrugated board.
4.3. Optimization of the mechanical behaviour of the outer liner
The stereocorrelation method gives interesting information onthe heterogeneity of the strain and stress fields. There are zoneswhich are more stressed in compression than others. During thebeginning stages of the box compression, these zones are locatedin the vicinity of the vertical edges of the panels where the elasticlimit can be exceeded quite soon. Thus, they could be reinforced inorder to delay the buckling development. Later during box com-pression, it can be observed that the outer liner collapses in narrowzones close to the horizontal edges. Here again these zones couldbe reinforced. Besides, this observation suggests to reconsider thefact that the cross-direction of the corrugated board is systemati-cally aligned along the direction of the compression loading.
One can also notice that the residual stresses in the outer linerinduce a loss of mechanical performance of the outer liner in buck-ling situation. It could be interesting to adjust the residual stressesin the outer liner during the corrugated board manufacturing.
Optimized flap geometries or optimized folding line geometriescould permit to get box panels with the same height, and thusmore homogeneous and efficient distribution of the load on thefour panels of the box.
5. Conclusion
A 3D DIC method was used and tailored to analyse the bucklingbehaviour of panels of corrugated board boxes during their com-pression. This technique is highly efficient to provide relevant dataon the 3D displacement and strain fields in the outer liner of thebox panels. Using a linear orthotropic constitutive law as well asa residual stress state analysis for the outer liner, the stress fieldcould be also estimated. Highly compressed zones are first seenalong the vertical edges where the elastic limit of the outer lineris exceeded quite soon during the box compression. Zones with asimilar compressive strain state appear later along the horizontaledges. The critical measured stress for the box during compressionis related to the collapse of these zones. The stereocorrelation tech-nique gives some interesting information for modelling ap-proaches. Firstly, von Kármán kinematic assumptions appear tobe reasonably well suited. Secondly, as the elastic limit of the outerliner is exceeded early, numerical models aiming at describing thecrush of boxes should preferably account for the elastic plasticbehaviour or damage behaviour of the paper constituents of corru-gated board. This approach gives also the real boundary conditions

J. Viguié et al. / Composite Structures 93 (2011) 2861–2873 2873
the outer liner of the panels is subjected to. Depending on the ob-served panel, boundary conditions can change drastically. In futurework, these data could be used to improve buckling and post-buckling prediction models of board panels made up of corrugatedboard. Real measured boundary conditions could also be used innumerical simulation aiming at describing these deformationphenomena.
Acknowledgements
Papeterie de Gondardennes (Gondardennes, France) are grate-fully acknowledged for supplying G-flute corrugated boards. Theauthors acknowledge the European Synchrotron Radiation Facility(ESRF, Grenoble, France) long-term project ‘‘Heterogeneous Fi-brous Materials’’ for giving them the opportunity to work on theID19 beamline.
References
[1] Patel P, Nordstrand T, Carlsson LA. Local buckling and collapse of corrugatedboard under biaxial stress. Compos Struct 1997;39(1–2):93–110.
[2] Allansson A, Svard B. Stability and collapse of corrugated board; numerical andexperimental analysis. Master’s Thesis. Division of Structural Mechanics, LTH,Lund University, Lund, Sweden; 2001.
[3] Nordstrand T. Analysis and testing of corrugated board panels into the post-buckling regime. Compos Struct 2004;63:189–99.
[4] McKee RC, Gander JW, Wachuta JR. Compression strength formula forcorrugated board. Paperboard Packag 1963;48(8):149–59.
[5] Urbanik TJ. Review of buckling mode and geometry effects on postbucklingstrength of corrugated containers. Develop Validat Appl Inelastic MethodStruct Anal Des 1996;343:85–94.
[6] Beldie L, Sandberg G, Sandberg L. Paperboard packages exposed to static loads– finite element modelling and experiments. Packag Technol Sci 2001;15:1–8.
[7] Biancolini ME, Brutti C. Numerical and experimental investigation of thestrength of corrugated board packages. Packag Technol Sci 2003;16:47–60.
[8] Thorpe JL, Choi D. Corrugated container failure part 2 – strain measurements inlaboratory compression tests. Tappi J 1992;75(7):155–61.
[9] Considine JM, Scott CT, Gleisner R, Zhu JY. Use of digital image correlationto study the local deformation field of paper and paperboard. In: 13thFundamental research symposium, Cambridge; 2005.
[10] Meunier L, Chagnon G, Favier D, Orgéas L, Vacher P. Mechanical experimentalcharacterisation and numerical modelling of an unfilled silicone rubber. PolymTest 2008;27:765–77.
[11] Orteu JJ. 3-D computer vision in experimental mechanics. Opt Laser Eng2009;47:282–91.
[12] Viguié J. Comportements mécanique et hygroexpansif des matériaux ligno-cellulosiques pour l’emballage rigide – mechanical and hygroexpansivebehaviour of lignocellulosic materials for rigid packaging. PhD thesis. Institutpolytechnique de Grenoble (Grenoble INP), Grenoble, France; 2010.
[13] Reddy J. Mechanics of laminated composite plates and shells theory andanalysis. second ed. Boca Raton (FL, USA): CRC Press LCC Publishing; 2000.
[14] Niskanen K, Kärenlampi P. In-plane tensile properties. Papermaking scienceand technology, Book 16, Paper Physics, Fapet Oy, Helsinki, Finland; 1998.
[15] Alava M, Niskanen K. The physics of paper. Rep Prog Phys 2006;69:669–723.[16] Bronkhorst CA, Bennett KA. Deformation and failure behavior of paper. In:
Mark RE, Habeger Jr CC, Borch J, Bruce Lyne M, editors. Handbook of physicaltesting of paper. Revised and expanded, vol. 1. New York: Marcel Dekker Inc.;2002. p. 313–427.
[17] Gunderson D, Bendtsen L, Rowlands R. A mechanistic perspective of the biaxialstrength of paperboard. J Eng Mater – T ASME 1986;108:135–40.
[18] Rowland R, Gunderson D, Suhling J, Johnson M. Biaxial strength of paperboardpredicted by Hill-type theories. J Strain Anal Eng 1985;20(2):121–7.
[19] Suhling J, Rowlands R, Johnson M, Gunderson D. Tensorial strength analysis ofpaperboard. Exp Mech 1985;25:75–84.
[20] Sunderland P. Measurement and prediction techniques for internal stresses inpolymers and composites. PhD thesis. École Polytechnique Fédérale deLausanne (EPFL), Lausanne, Switzerland; 1997.
[21] Röll K. Analysis of stress and strain distribution in thin films and substrates. JAppl Phys 1976;47:3224–9.
[22] Vacher P, Dumoulin S, Morestin F, Mguil-Touchal S. Bidimensional strainmeasurement using digital images. Inst Mech Eng Part C ImechE1999;213:811–7.
[23] Viguié J, Dumont PJJ, Desloges I, Mauret E. Some experimental aspects of thecompression behaviour of boxes made up of G-flute corrugated boards. PackagTechnol Sci 2010;23:69–89.