surface phosphate and silicate distributions in the northeastern pacific ocean
TRANSCRIPT
Surface Phosphate and Silicate Distributions in theNortheastern Pacific Ocean
I)uring the oceanographic and geophysical cruisc of USC and GSSStt.raeyor, April- lIa1' 1968, rve corrtinuousl.v nronitored tl.re surface phosphatcand sil icate concentrations itr t l 're northeastern l 'acif ic Ocean bv nreitns of: r ' lec l rn icon@ Autoanalyzer .@
Sea urater was continuously pumped into a chemistry laboratory zrbourdthe Surveyor through a submerged intake in tl 're bou. of the ship. l)etailedlaboratory procedure is sirnilar to that of Arnrstrong et ai. (1967).
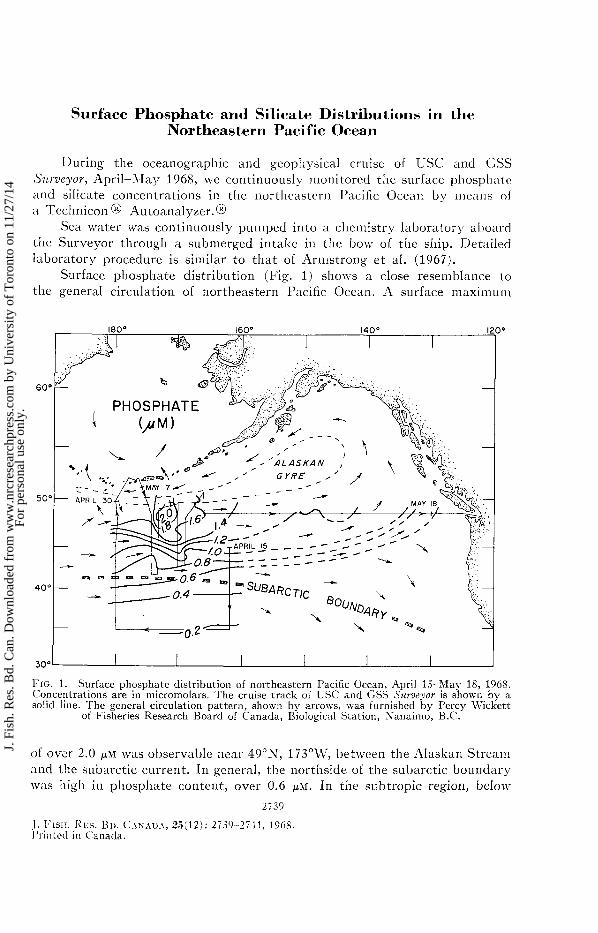
Surface phosphate distribution (F-ig. 1) shorvs a close resenrblance tothe general circulation of northeastern Pacific Ocean, A surface maxirnur.n
Frc. 1. Surface phosphate distribution of northeastern Pacific Ocean, April 1S-X,Iay 18, 1968.Concentrations are in-micromolars, The cruise track of USC and GSS Suraetor is siown bv asolid line. The general circulation pattern, shown by arro\\'s, rvas furnished by Percy \\'ickett
of Fisheries Research Board of Canada, Biological Station, Nanaimo, B.C.
of over 2.0 pu was observable near 49"N, 173"W, betrveen the Alaskan Strcamlnd the subarctic current. In gcneral, the northside of the subarctic boundaryrvas high in phosphate content, over 0.6,prrr. In the subtropic region, belolr.
2 i 39
J. l i rsr r . I {L is . l lu . C.rx . rn. r , 2 i r (12) : 2739-27f1, 196r .I ) r in icc l in ( lauacla.
J. F
ish.
Res
. Bd.
Can
. Dow
nloa
ded
from
ww
w.n
rcre
sear
chpr
ess.
com
by
Uni
vers
ity o
f T
oron
to o
n 11
/27/
14Fo
r pe
rson
al u
se o
nly.
27+0 Jr)URNr\r , F-rsHl , ) l { r } ts I {ESE,\ t {cH iJoIRD ot- cr \Nr\Dl , vot- .25, NO. 12, 1968
40oN, t l re phosphate concelr t rat ion drops cont inously; . l t 35 'N i t u 'as about0.2 prl{.
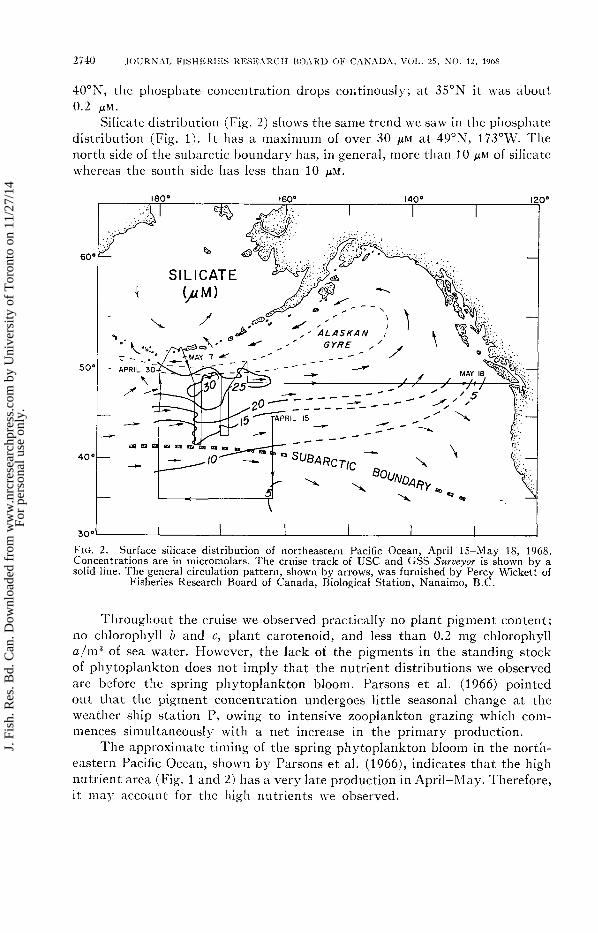
Sil icate distribution (Fig. 2) sholr's the same trend n-e sau'in the phosphatedistribution (Fig. 1). It has a maxinrum of over 30 ptr.l at 49oN, 173'W. Thenorth side of the subzrrctic boundary has, in gencral, r 'nore than 10 pu of sil icatelvhereas tl 're south side has less than 10 su.
Frc. 2. Surface silicate distribution of northeastern Pacific Ocean. Aoril 15-Mav 18. 1968.Concentrat ions are in micromolars. The cruise t rack of USC and GSS Suraeyor is ihown bv asolid line. The general circulation pattern, shown by arrows, was furnished by Percy Wicketi of
Fisheries Research Board of Canada, Biological Station, Nanaimo, B.C.
Throughout the cruise we observed practically no plant pignrent content;no chlorophyll b and c, plant carotenoid, and less than 0.2 mg chlorophyllaf mt of sea water. However, the lack of the pigments in the standing stockof phytoplankton does not imply that the nutrient distributions we observedare before the spring phytoplankton bloom. Parsons et al. (1966) pointedout that the pigment concentration unclergoes l itt le seasonal change at theweather ship station P, orving to intensive zooplankton grazing which corn-lnences sirnultaneously with a net increase in the primary production.
The approximate tirnir:rg of the spring phytoplankton bloorn in the north-eastern Pacil ic Ocean, shorvn by Parsons et al. (1956), indicates that the highnutrient area (Fig. 1 and 2) has a very late production in April-\ '{ay. Therefore,it na1. account for the high nutrients $ie observed.
J. F
ish.
Res
. Bd.
Can
. Dow
nloa
ded
from
ww
w.n
rcre
sear
chpr
ess.
com
by
Uni
vers
ity o
f T
oron
to o
n 11
/27/
14Fo
r pe
rson
al u
se o
nly.

l 'A l {K c t a l . : NE P, \C 0OD; \N PUOSPI{ . \ ' l ' l t & S t l , l c / \ 27.+l
At the sanle ti lne we cannot rule out the possibil i ty that the occurrenceof phosphzrte ernd sil icerte rnaxima near the Aleutian
'I 'rencl.r rnalr bs a product
of the upward divergence of the subsurferce water. lhe maximunr surfacevalues of 2.1 pru for phosphate and 33 plr for sil icate correspond to approx-inrately 100 m concentrations that n'ere observed in June 1966 (Park, 1967).Possibie u'inter turu-over of n'ater layers in the upper 100 m could cause it.
F-elix F-avorite of the Bureau of Conrmerical Fisheries in Seattle. \\/aslr..suggested to us that the phosphate distribution (Ii ig. 1) rnay indicate thata significant allrourlt of rvater in the Alaskan Strearn rvas blocked from furtherrvestn'ard florv near 172"W long and turned southr'r'ard and eastward in thesubarctic current at this longitude. His observation of a tongue of dilute rvater(approxirnagely 32.50/6 S) in this area rvould tend to confirm his suggestion.
Various biological and physical processes obviously interplay to presentus lvith the nutrient data u'e observed. Further studies are needed to assesseach process. For such a purpose \ve propose that continuous surface nutrientrneasurerrents be carried out, through nulnerous ship of opportunit-v pro-grams, to gatl.rer data indicative of the important ferti l i ty index of the oceans.'f lre
Technicon Autoanalyzer@ is suited for such endeavours, requiring arr-rinimum of manporver and incorporating l itt le operator error.
This work \\ras supported by the U.S. National Science Foundation grant( ;A-1281, Ol f ice of Naval Researc l r contract Nonr 1286 (10) , and U.S. Bureauof corlnrercial Fisheries. \ 've thank H. c. curl, Jr., T. v. Ryarn, and captainlI. Nygren for technical assistance, and T. R. I ' :rrsons and F. I izrvorite forthcir valuablc crit icisnrs of t ire rranuscriut.
l)epartnrent of OceanographyOregon State University, Corvall is, Ore, 97331
Received Jor publication Attgust 23, 1968.
l). Krr,Ho PenxSrripnnN \[r. FlacpnJecquos E. PrnsoN
D,rvlo S. Barl
I{EF-ERENCES
Annsrnon<;, I r .A.J. , C. R. Srn. lnNs,, rNo J. D. H. Smrcxr.eNn. 1967. The measurementof upwelling and subsequent biological processes by means of the Technicon Autoanalyzerand associated equipment. Deep-Sea Res. , l4(3) : 381-389.
P, lnr , K. 1967. Chemical features of the subarct ic boundary near 170oW. J. Fish. Res.Bd. Canada, 24(5): 899-908.
PAnsoNs, '1. . R. , L. F. Crov-tNoo,, rs l I { . J . Leer,rsseur. 1966. The advent of the spr ingbloorn in the eastern subarctic Pacific 6cean. Ibid., 23(4): 539-546.
J. F
ish.
Res
. Bd.
Can
. Dow
nloa
ded
from
ww
w.n
rcre
sear
chpr
ess.
com
by
Uni
vers
ity o
f T
oron
to o
n 11
/27/
14Fo
r pe
rson
al u
se o
nly.