surface energy balance on lake superior (and huron)€¦ · direct measurements of the surface...
TRANSCRIPT
Direct Measurements of theSurface Energy Balance
on Lake Superior (and Huron)
Peter Blanken, University of Colorado, Boulder
Christopher Spence, Environment Canada, Saskatoon
Newell Hedstrom, Environment Canada, Saskatoon

Introduction Background Site Methods Results Summary
Why measure the surface energy balance?• Help understand impacts of climate change (e.g. ice conditions)• Help calibrate/validate models to improve forecasts• Connections to the hydrologic cycle: evaporation-lake water levels• Ecological connections: water temperature cycles and thermal structure
Objective?To make continuous, multi-year direct measurements of the surface energy balance on Lake Superior to improve our understanding of key physical processes

• fluctuating water levels (e.g. Marquette)
Introduction Background Site Methods Results Summary

Introduction Background Site Methods Results Summary
Stannard Rock:39 km nearest shore

Air temperature and humidity
Rain: total & rate
Wind speed & direction
Latent, sensible,CO2, momentumfluxes; atm pressure, [H2O], [CO2 ]
Water surface temperature
Incident short- & long-wave radiation
Radio communication
• instrumentation
Introduction Background Site Methods Results Summary
32.4 m above mean water surface
0.5-hr means June 2008-March 2011

80% Turbulent Flux within 5.7 km
Greatest Sensitivity at
632 m
Not to Scale
• Turbulent Flux Footprint
Introduction Background Site Methods Results Summary

Short-wave Long-wave Radiation
NetRadiation
Turbulent Fluxes of Latent and Sensible
Heat
HeatStorage/Release
• radiation & energy balance
Introduction Background Site Methods Results Summary
SN JHLERLLSS

• eddy covariance
High-frequency vertical wind speed (w), & H2O / CO2 density (scalar s).
Covariance of deviation (′) from 30-min means (-).
Std. corrections.
swFluxs
Introduction Background Site Methods Results Summary

• wind rose
Introduction Background Site Methods Results Summary
2008-09
6%
4%
2%
WEST EAST
SOUTH
NORTH
5 - 10
10 - 15
15 - 20
20 - 25
25 - 30
30 - 35
35 - 40
40 - 45
2009-10
6%
4%
2%
WEST EAST
SOUTH
NORTH
5 - 10
10 - 15
15 - 20
20 - 25
25 - 30
30 - 35
Water Year Water Year

• wind direction and the energy balance
Introduction Background Site Methods Results Summary
20 40 60 80 100
30
210
60
240
90270
120
300
150
330
180
02008-09 Water Year
LE
H
20 40 60 80 100
30
210
60
240
90270
120
300
150
330
180
02009-10 Water Year
Rings : MeansW m-2

-15
0
15
30T
a (
oC
) Max 28.87
Min -16.31
0
1
2
3
ea (
kP
a)
Max 2.679
J J A S O N D J F M A M J J A S O N D J F M A M J J A S O N D J F M0
20
40
U (
m s
-1)
Max 42.73
Month
• 0.5-hr basic meteorology with 10-day running mean
Introduction Background Site Methods Results Summary
2009 2010 2011

0
500
1000
RN (
W m
-2)
-200
0
300
600
LE
(W
m-2
)
-200
0
300
600
H (
W m
-2)
J J A S O N D J F M A M J J A S O N D J F M A M J J A S O N D J F M
-750
0
750
J S (
W m
-2)
Month
• 0.5-hr energy balance with 10-day running mean
Introduction Background Site Methods Results Summary
2009 2010 2011

0
200
400
Measured
LE=mU+k
0
200
400
LE
(W
m-2
)
Measured
LE=U(m*ea+k)
Dec 29 Dec 31 Jan 2 Jan 4 Jan 6 Jan 8 Jan 10 Jan 12 Jan 140
200
400
Measured
LE=m*U/ea+k
• LE calculations
Introduction Background Site Methods Results Summary
2010 2011

• cumulative heat losses
Introduction Background Site Methods Results Summary
0
400
800
2008-09: 464 mm
2009-10: 645 mm
O N D J F M A M J J A S0
200
400
Month
Cum
ula
tive T
ota
l (m
m e
quiv
ale
nt)
2008-09: 374 mm
2009-10: 345 mm
Sensible Heat
Evaporation

• ice conditions
Introduction Background Site Methods Results Summary
March 3, 2009: 92% max
March 5, 2010:28% max

• Lake Huron: Spectacle Reef
Introduction Background Site Methods Results Summary

Introduction Background Site Methods Results Summary
Stannard Rock:
Spectacle Reef:17 km nearest shore

• basic meteorology: 24-hr means Superior vs Huron
Introduction Background Site Methods Results Summary
-15
0
15
30
Ta (
oC
)
0
1
2
3
ea (
kP
a)
Superior
Huron
O N D J F M A M J J A S0
5
10
15
U (
m s
-1)
Month
Time Lag for Maximum Correlation (Huron after Superior) :
Ta: 21 hrsea: 17 hrsU: 19 hrs

• energy balance: 24-hr means Superior vs Huron
Introduction Background Site Methods Results Summary
0
200
400
Rn (
W m
-2)
0
200
400
LE
(W
m-2
)
0
200
400
H (
W m
-2)
O N D J F M A M J J A S-800
-400
0
400
Js (
W m
-2)
Month
Superior
HuronTime Lag for Maximum Correlation (Huron after Superior) :
LE: 19 hrsH: 17 hrs

0
400
800
Superior: 586 mm
Huron: 584 mm
O N D J F M A M J J A S0
400
800
Month (2009-2010)
Cum
ula
tive (
mm
equiv
ale
nt)
Superior: 347 mm
Huron: 367 mm
• cumulative heat loss
Introduction Background Site Methods Results Summary
90 mm (15%)
Evaporation
Sensible Heat
Introduction Background Site Methods Results Summary
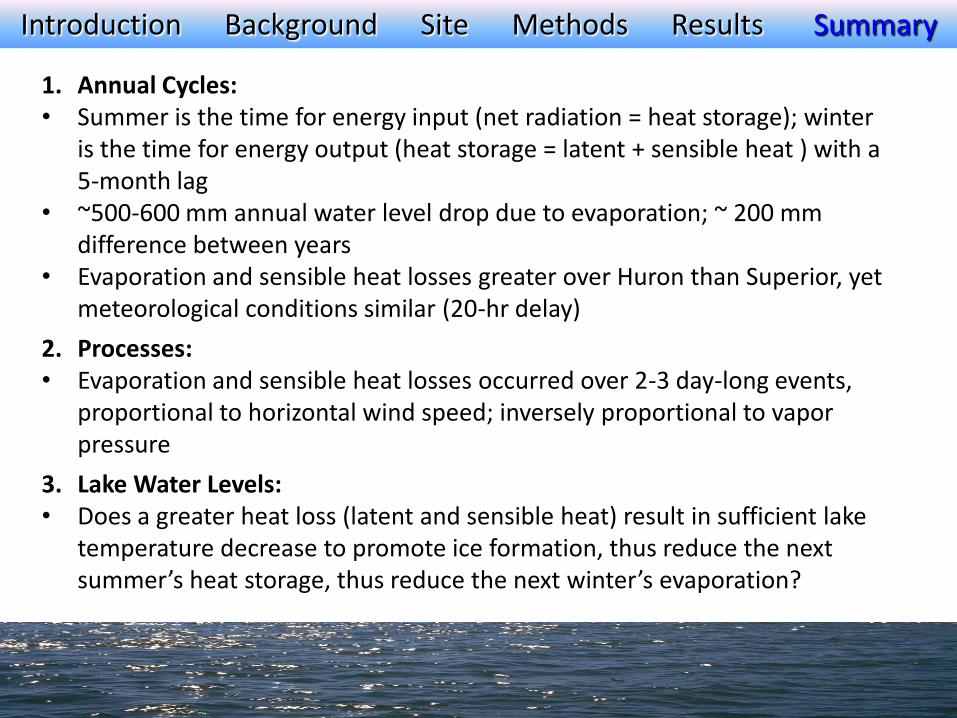
1. Annual Cycles:• Summer is the time for energy input (net radiation = heat storage); winter
is the time for energy output (heat storage = latent + sensible heat ) with a 5-month lag
• ~500-600 mm annual water level drop due to evaporation; ~ 200 mm difference between years
• Evaporation and sensible heat losses greater over Huron than Superior, yet meteorological conditions similar (20-hr delay)
2. Processes: • Evaporation and sensible heat losses occurred over 2-3 day-long events,
proportional to horizontal wind speed; inversely proportional to vapor pressure
3. Lake Water Levels: • Does a greater heat loss (latent and sensible heat) result in sufficient lake
temperature decrease to promote ice formation, thus reduce the next summer’s heat storage, thus reduce the next winter’s evaporation?

Direct Measurements of theSurface Energy Balance
on Lake SuperiorPeter Blanken, University of Colorado, Boulder
Christopher Spence, Environment Canada, Saskatoon
Newell Hedstrom, Environment Canada, Saskatoon
GLLKA
