surface energetics to assess influence of biomass-type and
TRANSCRIPT

Yelemane et al. Bioresour. Bioprocess. (2021) 8:29 https://doi.org/10.1186/s40643-021-00382-6
RESEARCH
Surface energetics to assess influence of biomass-type and biomass–adsorbent interactions in expanded bedsVikas Yelemane, Martin Kangwa , Roy N. Dsouza and Marcelo Fernández‑Lahore*
Abstract
In integrated bioprocessing applications, expanded bed adsorption (EBA) chromatography presents an opportunity to harvest biomolecules directly from the crude feedstock. However, unfavorable biomass interactions with adsorbent usually leads to fouling, which reduces its protein binding capacity as it alters column hydrodynamics and binding site availability. In this work, a detailed study on biomass adhesion behavior of four different industrially relevant micro‑organisms on 26 different, most commonly occurring adsorbent surfaces with varying degrees of surface energy and surface charge has been conducted. The results showed the derivation of a relative “stickiness” factor for every microorganism, which further classifies each organism based on their general degree of adhesion to surfaces with respect to one another. The obtained results can help to better understand the effect of biomass homogenization on biomass–adsorbent interactions in EBA. The data of surface energy and charge for the surfaces investigated in this work can be used to calculate the stickiness factor of other microorganisms of interest and may assist in the develop‑ment of novel adsorbent materials for EBA chromatography.
Keywords: Biofouling, Cell adhesion, Surface properties, XDLVO theory
© The Author(s) 2021. This article is licensed under a Creative Commons Attribution 4.0 International License, which permits use, sharing, adaptation, distribution and reproduction in any medium or format, as long as you give appropriate credit to the original author(s) and the source, provide a link to the Creative Commons licence, and indicate if changes were made. The images or other third party material in this article are included in the article’s Creative Commons licence, unless indicated otherwise in a credit line to the material. If material is not included in the article’s Creative Commons licence and your intended use is not permitted by statutory regulation or exceeds the permitted use, you will need to obtain permission directly from the copyright holder. To view a copy of this licence, visit http://crea‑tivecommons.org/licenses/by/4.0/.
IntroductionInterfacial interaction of a microorganism with its sur-rounding can happen in various ways. It can either be reversible or non-reversible, and the process usually advances in multiple stages. In 1674, Antonie van Leu-wenhoek reported on the biofilm he observed in a primi-tive microscope from samples scraped from his tooth surface, and called them “animalcules” (little animals) (Costerton 1999), presenting the first known study of oral biofilms. In general, a biofilm micro-cluster consist of approximately 10–15% of cells and up to 75–90% of extracellular polymeric substrate matrix, where numbers may vary depending on the species involved (Costerton 1987). The development and accumulation of biofilm on surfaces may bring undesirable consequences in process
environment such as in chromatography where it may lead to adsorbent fouling.
Fouling is one of the main challenges faced by indus-trial bioprocesses, which still needs to be solved despite significant efforts made towards its prevention. Fouling can be defined as the adhesion of unwanted material on functional surfaces that can alter their function. The most common foulants are microorganisms, biological parti-cles, biofilms, or extracellular polymeric substrates. For decades, microbiologists and biomedical, environmen-tal, and chemical engineers have invested a lot of effort in understanding and devising a mechanism to control microbial adhesion. Fouling results in the deterioration of equipment and increased maintenance cost (Sanders and Sturman 2005; Lappin-Scott and Costerton 1989), par-ticularly in expanded bed chromatography (EBA) opera-tions where biomass interactions with the stationary phase result in poor hydrodynamics of the expanded bed column (Fernández Lahore, et al. 2009). In membrane
Open Access
*Correspondence: m.fernandez‑lahore@jacobs‑university.deDownstream Bioprocessing Laboratory, School of Engineering and Science, Jacobs University, Campus Ring 1, 28759 Bremen, Germany

Page 2 of 12Yelemane et al. Bioresour. Bioprocess. (2021) 8:29
separation processes, fouling blocks the membrane irre-versibly and reduces process efficiency (Kujundzic 2010), while in paper industries, these unwanted interactions of fouling agents can cause serious and costly damages to instruments (Simões et al. 2010). On the contrary, in some cases adhesion of microorganism is crucially desired, for example, in wastewater treatment plants, as well as in bio-implantable devices, where biomass inter-actions are required to be maximized (Melo and Bott 1997). A summary of the effects of cell adhesion/biofilms on industrial processes is listed in Table 1.
The interactions between microorganisms and surfaces are very complex in nature and are dependent on the various physico-chemical properties of the microorgan-ism and the surface. In early stages, the adhesive inter-actions are reversible, however, they slowly transform into an irreversible anchorage (Fletcher 1996). In later stages, a matrix of polymeric material secreted by cells protect and stabilize their colonies. Therefore, a quanti-tative understanding and mechanistic interpretation of such interactions is essential to mitigate or achieve cell adhesion.
Interfacial surface properties, such as surface hydro-phobicity, hydrophilicity, charge, and roughness play a very important role in the initial stages of cell adhesion to surfaces (Fletcher 1996), and can directly influence attractive or repulsive interactions and their magni-tude. A previously reported model for microbial adhe-sion suggests that in the early stages of attachment, relatively weak non-specific and reversible interactions dominate, which eventually advance to strong irrevers-ible states governed by both non-specific and specific interactions (Hermansson 1999). Non-specific interac-tion energies are generally categorized as Lifshitz–van der Waals (LW) interactions, which are always attrac-tive and depend upon relative surface hydrophobicity, and electrostatic (EL) interactions, which can either be attractive or repulsive depending on the surface charge. These interaction energies are described in the classical
DLVO (Derjaguin, Landau, Verwey, Overbeek) theory of colloid stability (Derjaguin and Landau 1941; Verwey and Overbeek 1948). In the classical DLVO approach, both interacting surfaces are assumed to be chemically inert. In case of biomass adhesion, this is not entirely true, since non-covalent interactions, such as hydrogen bonds, are also involved in the microbial adhesion mechanism. To correct this, Van Oss et al. introduced a short-range Lewis acid–base (AB) interaction term to account for such effects when considering proximity of microbial and adsorbent surfaces. This modified theory is termed as extended DLVO (xDLVO) theory (Oss et al. 1986, 1995; Bayoudh 2009), where surface energetic calcula-tions of biomass and adsorbent surfaces could be used to identify conditions that are favorable or unfavorable for adhesion. The net interaction energy between cell–sub-strate as a function of their mutual separation (l) is cal-culated as the cumulative sum of Lifshitz–van der Waals (LW), acid–base (AB), as well as electrostatic (EL) ener-gies (Eq. 1) (Bayoudh 2009; Meinders et al. 1995; Trues-dail 1998; Vennapusa 2008a). These calculations rest upon several physico-chemical parameters which can be experimentally determined for all interacting surfaces as well as their interstitial media. Firstly, contact angles of at least three diagnostic liquids made with each sur-face can be used to obtain LW and AB interactions terms using the Young–Dupré equation in combination with the respective energy relations of xDLVO theory (Oss 1995; Absolom 1983). Secondly, the electrostatic behav-ior of each surface can be approximated via their meas-ured zeta potentials in the medium where interactions would take place, yielding the EL interaction term in the xDLVO model (Vanoss 1993; Chen 2011). The additional AB interaction term appending classical DLVO theory has been shown to explain some of the inconsistencies between classical DLVO predictions and experimental observations (Oss et al. 1988; Oss 2006). Extended DLVO calculations have been validated in a wide variety of col-loidal applications (Fernández Lahore et al. 2009; Oss
Table 1 A literature survey on effect of cell adhesion in various process applications
Application area Effects of cell adhesion References
Water systems Contamination of purified water. Blockage of valves and entrapment of particles in waste water pipeline
Melo and Bott (1997)
Food related Processing equipment are prone to contamination leads to germ‑infested products Simões et al. (2010), Verran (2002)
Maritime Reduce the speed, increase fuel consumption and maintenance cost and ultimately mechanical failure
Callow and Callow (2002)
Oil Damage of underwater cable and piping, platform wreckage Sanders and Sturman (2005)
Paper Operation failure and in a loss of product quality Flemming et al. (2013)
Health Dental plaque, infection with contact lens Saini et al. 2011)
Industrial bioprocessing Fouling of filtration membranes, fouling of EBA adsorbents, increase process cost Thommes (1998), Naz (2015)

Page 3 of 12Yelemane et al. Bioresour. Bioprocess. (2021) 8:29
2006; Vilinska and Rao 2011; Fu et al. 2015; Kakarla 2016; Vennapusa 2008b), and has helped in the understanding of cell–substrate or cell–cell interactions.
The aim of this work was to create a “fingerprinting” method to assess cell adhesion to a variety of surfaces and to provide a general argument on cell-type-depend-ent adhesion. In this study, the interaction of more than 26 different surfaces with four different cells types has been investigated. Furthermore, the interactions of cell debris with the surfaces were studied. Consequently, a “stickiness” factor, which qualitatively indicates the adhe-sive nature of a cell type, was determined.
Materials and methodsChemicals and reagentsThe following polymeric beads were purchased and used in this study: cellulose from Perloza S.r.o (Czech Republic); Sepharose agarose, sephacryl, dextran from GE Healthcare (Germany); Fastline agarose from DSM biologics (The Netherlands); polyacrylamide, ceramic hydroxyapatite I and II, ceramic flouroapatite I and II from Bio-Rad (Germany); polyvinylpyrrolidone, Supelite™ DAX-8, poly(styrene-co-divinylbenzene) from Sigma-Aldrich (Germany); poly(phenol–formaldehyde), poly(ethyl methacrylate) from Polysciences (Germany); Toyopearl HW 65 from TOSOH Bioscience (Germany); and geniaLab (Germany) provided beads of agar, alginate and chitosan. Carrageenan was obtained from Carl Roth (Germany). α-Bromonaphthalene (99% purity) and for-mamide (99.5% purity) were obtained from Fluka, Buchs, Switzerland. Water was ultrapure quality. All other chemicals used in the buffer preparation were of analyti-cal grade and obtained from Applichem (Germany). The goniometric system (OCA 20) was obtained from Data- Physics Instruments (Germany). Zeta potential measure-ments were measured using a ZetaSizer Nano ZS from Malvern Instruments (UK). A weighing balance CPA423S connected to computer via RS-232 serial connector and Sartocollect 1.0 was used to control and record the data was obtained from Sartorius AG (Germany).
Types of biomass useFour different types of cells with different physico-chemical characteristics were selected for the study: (a) Escherichia coli, (b) Bacillus subtilis, (c) Saccharomyces cerevisiae, and (d) Chinese hamster ovary (CHO) cells.
Contact angle measurementsFor the contact angle measurement, capillary method was used for bead material while sessile drop method was used for flat surfaces. Beads were incubated overnight, and cells were washed in 20 mM phosphate buffer at pH 7.4. For the sessile drop experiments, the diagnostic
liquids: α-bromo naphthalene, formamide, and water were used to measure the contact angle using a gonio-metric system (OCA 20); the SCA 20 software was used for data acquisition and is from Data-Physics Instruments (Filderstadt, Germany). All the measurements were per-formed in triplicate and at least 20 contact angles per sample were measured. A comprehensive description of the methodologies used is published elsewhere (Sharma and Hanumantha Rao 2002; Vennapusa 2008c; Kakarla 2015).
Zeta potential measurementsZeta potential values were measured using Zetasizer Nano ZS. Beads were incubated in respective buffers for 2 h before the experiment. Zeta potential was calculated from the electrophoretic mobility data according to the Smoluchowski’s equation and all the measurements were done in triplicates. Details of methodology published elsewhere (Fernández Lahore et al. 2009; Kakarla 2015; Vennapusa and Fernandez-Lahore 2010).
Total interaction energy calculationThe values of xDLVO free energy of interaction were cal-culated as the sum of LW, AB and EL components at the minimum separation distance (Oss 2006). The total inter-action energy between a colloidal particle and a solid sur-face can be expressed according to the xDLVO approach using Eq. 1, where UxDLVO is the total interaction energy in aqueous media, ULW is the LW interaction term, UAB is the AB interaction term, and UEL is the EL interaction term:
The subscript m is utilized for the chromatographic matrix, w refers to the watery environment, and c to the colloidal (cell) particle. In this work, we calculated the overall area of the interaction curve between 4 and 20 nm instead of the pocket depth as a measure of inter-action. This gives a more accurate approximation of the net effect of interaction. When the interaction is attrac-tive, the net area will be in negative range as opposed to when interactions are repulsive. A detailed explanation of underlying xDLVO calculations has been reported in our previous publications (Fernández Lahore et al. 2009; Naz 2015; Vennapusa 2008c).
Results and discussionBiofilm formation progresses mainly in four stages: (a) initial attachment, (b) reversible attachment, (c) matu-ration, (d) growth (Petrova and Sauer 2009; Svensäter and Bergenholtz 2004). These interactions are normally multimodal in nature, involving specific interactions
(1)UxDLVOmwc (l) = U
LWmwc(l)+U
ELmwc(l)+ U
ABmwc(l).

Page 4 of 12Yelemane et al. Bioresour. Bioprocess. (2021) 8:29
(ligand–receptor) and non-specific interactions (hydro-gen bonding, hydrophobic, van der Walls, electrostatic and other supramolecular forces). Our main objective was to derive a factor representing “stickiness” of the biomass that is qualitatively proportional to experimen-tal results and which can only be achieved by evaluating the interaction of different types of microbes with a wide range of substrate materials and control substance.
Selection of the representative biomass typesIn this study, it was important to consider a pool of microorganisms that are commonly used in industrial biomolecule productions and that represents wider diversity in terms of surface properties. Four different cell types with distinguishable physico-chemical charac-teristics were selected for the study: (a) Escherichia coli, a Gram-negative rod-shaped bacterium with the length of approximately 1–1.5 µm; (b) Bacillus subtilis, a Gram-positive rod-shaped bacterium approximately 2–3 µm length; (c) Saccharomyces cerevisiae, a yeast, most stud-ied eukaryotic model ovoid in shape and up to 10 µm in diameter, and (d) Chinese hamster ovary (CHO) cells, which is the most common mammalian host and is approximately 14–15 µm in diameter. The above-men-tioned cell types represent the most common microbial flora encountered in cell–substrate interaction in bio-process industry. The differential properties between these microorganisms include cell wall structure, compo-sition, and extracellular appendages.
Selection of the polymeric beads made of different materialsTwenty-six common polymeric materials encoun-tered in manufacturing and bioprocess industries were physico-chemically characterized. Polysaccharides such as alginate, agar, cellulose, agarose, carrageenan, dextran, and chitosan are the most common raw materials utilized as beads in process engineering. Chemical polymers such as polyacrylamide, sephacryl, polyvinylpyrrolidone, polyphenolformaldehyde beads, Supelite™ DAX-8, poly(styrene-co-divinylbenzene), poly(ethyl methacrylate), polystyrene, Toyopearl HW-65, silica, ceramic hydroxyapatite type I and II, and ceramic fluoroapatite type I and II are widely used in various adsorption processes. Additionally, construction mate-rials such as glass, stainless steel, hexamethyldisilazane, and polydimethylsiloxane have been included in this study. This collection of materials involves a wide range of hydrophilic, hydrophobic, and surface charge proper-ties. For calculations, the diameter of the interacting bead made from these materials is assumed to be 200 µm.
Additionally, 4 agarose-based bead materials as bench-marks for the comparison of calculated interactions were
employed. Sepharose DEAE and Q, anion exchangers which harbor positive surface charge and are known to interact strongly with microbial cells. Sepharose SP a cation exchanger harboring negative surface charge, and generally exhibits the least interaction with biomass, and phenyl-Sepharose, which possesses hydrophobic ligands, allows for the comparison of relative hydrophobicity involved in adhesive interactions.
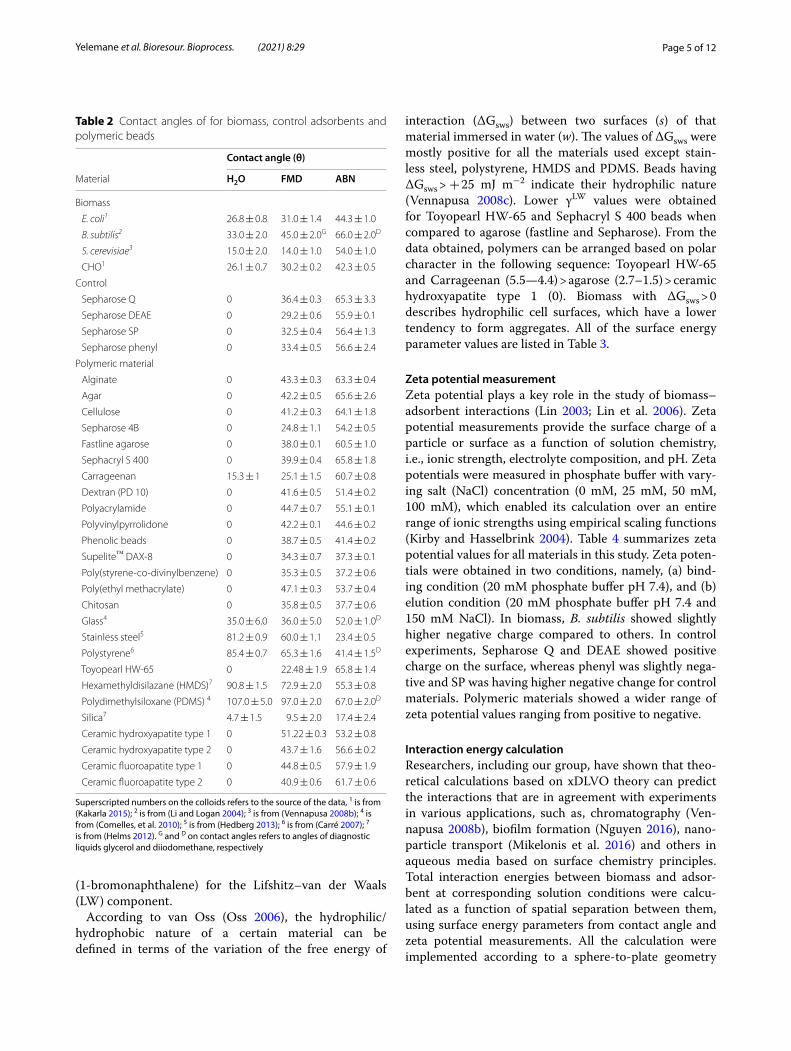
Contact angle measurementsContact angles of diagnostic liquids, namely, water, for-mamide, and 1-bromonaphthalene with several materials were used to estimate their surface energy parameters. Nonpolar 1-bromonaphthalene solely determines the Lif-shitz–van der Waals (LW) component, and polar liquids, water and formamide, determine the acid–base (AB) nature of the surfaces. Angles were calculated using the capillary rise method (Kakarla 2015) for beads and the sessile drop method (Vennapusa 2008b) for flat surfaces. Most of the chromatographic adsorbents used in pro-tein purification are highly hydrophilic in nature, thereby making them heavily hydrated during chromatographic operations. Due to their hydrated state, it was assumed that these materials have a zero contact angle with water, which is supported by previous reports (Sharma and Hanumantha Rao 2002; Kakarla 2015; Aasim 2014). This assumption enabled us to use water as the completely wetting liquid for contact angle estimation using the Washburn equation (Washburn 1921). This method has been applied to various chromatographic adsorbents and its applicability has been validated in our previous publi-cation (Kakarla 2015). Contact angles for 23 beads were calculated from their respective wetting kinetic slopes with water, formamide, and 1-bromonaphthalene. All the beads were equilibrated in 20 mM phosphate buffer at pH 7.4 before the measurements, which resembles a chemical environment similar to that found in process conditions. All experiments were done in triplicates and their standard deviations are reported in Table 2. Con-tact angle values for commercial chromatographic adsor-bents Sepharose Q, DEAE, SP and phenyl, along with polymeric beads made of polysaccharides, polymers, and biomass are tabulated. The surface properties of carra-geen were measured with carrageen hydrogels prepared using powder and were measured using the sessile drop method. Contact angles and zeta potential data for bio-mass, glass, stainless steel, polystyrene, hexamethyldisila-zane, polydimethylsiloxane and silica were obtained from published literature (Comelles et al. 2010; Hedberg 2013; Carré 2007; Helms 2012). Using the Young–Dupre equa-tion, surface energy parameters of polar liquids (water and formamide) were used to determine acid–base (AB) nature of the surfaces, whereas the apolar liquid
Page 5 of 12Yelemane et al. Bioresour. Bioprocess. (2021) 8:29
(1-bromonaphthalene) for the Lifshitz–van der Waals (LW) component.
According to van Oss (Oss 2006), the hydrophilic/hydrophobic nature of a certain material can be defined in terms of the variation of the free energy of
interaction (ΔGsws) between two surfaces (s) of that material immersed in water (w). The values of ΔGsws were mostly positive for all the materials used except stain-less steel, polystyrene, HMDS and PDMS. Beads having ΔGsws > + 25 mJ m−2 indicate their hydrophilic nature (Vennapusa 2008c). Lower γLW values were obtained for Toyopearl HW-65 and Sephacryl S 400 beads when compared to agarose (fastline and Sepharose). From the data obtained, polymers can be arranged based on polar character in the following sequence: Toyopearl HW-65 and Carrageenan (5.5—4.4) > agarose (2.7–1.5) > ceramic hydroxyapatite type 1 (0). Biomass with ΔGsws > 0 describes hydrophilic cell surfaces, which have a lower tendency to form aggregates. All of the surface energy parameter values are listed in Table 3.
Zeta potential measurementZeta potential plays a key role in the study of biomass–adsorbent interactions (Lin 2003; Lin et al. 2006). Zeta potential measurements provide the surface charge of a particle or surface as a function of solution chemistry, i.e., ionic strength, electrolyte composition, and pH. Zeta potentials were measured in phosphate buffer with vary-ing salt (NaCl) concentration (0 mM, 25 mM, 50 mM, 100 mM), which enabled its calculation over an entire range of ionic strengths using empirical scaling functions (Kirby and Hasselbrink 2004). Table 4 summarizes zeta potential values for all materials in this study. Zeta poten-tials were obtained in two conditions, namely, (a) bind-ing condition (20 mM phosphate buffer pH 7.4), and (b) elution condition (20 mM phosphate buffer pH 7.4 and 150 mM NaCl). In biomass, B. subtilis showed slightly higher negative charge compared to others. In control experiments, Sepharose Q and DEAE showed positive charge on the surface, whereas phenyl was slightly nega-tive and SP was having higher negative change for control materials. Polymeric materials showed a wider range of zeta potential values ranging from positive to negative.
Interaction energy calculationResearchers, including our group, have shown that theo-retical calculations based on xDLVO theory can predict the interactions that are in agreement with experiments in various applications, such as, chromatography (Ven-napusa 2008b), biofilm formation (Nguyen 2016), nano-particle transport (Mikelonis et al. 2016) and others in aqueous media based on surface chemistry principles. Total interaction energies between biomass and adsor-bent at corresponding solution conditions were calcu-lated as a function of spatial separation between them, using surface energy parameters from contact angle and zeta potential measurements. All the calculation were implemented according to a sphere-to-plate geometry
Table 2 Contact angles of for biomass, control adsorbents and polymeric beads
Superscripted numbers on the colloids refers to the source of the data, 1 is from (Kakarla 2015); 2 is from (Li and Logan 2004); 3 is from (Vennapusa 2008b); 4 is from (Comelles, et al. 2010); 5 is from (Hedberg 2013); 6 is from (Carré 2007); 7 is from (Helms 2012). G and D on contact angles refers to angles of diagnostic liquids glycerol and diiodomethane, respectively
Contact angle (θ)
Material H2O FMD ABN
Biomass
E. coli1 26.8 ± 0.8 31.0 ± 1.4 44.3 ± 1.0
B. subtilis2 33.0 ± 2.0 45.0 ± 2.0G 66.0 ± 2.0D
S. cerevisiae3 15.0 ± 2.0 14.0 ± 1.0 54.0 ± 1.0
CHO1 26.1 ± 0.7 30.2 ± 0.2 42.3 ± 0.5
Control
Sepharose Q 0 36.4 ± 0.3 65.3 ± 3.3
Sepharose DEAE 0 29.2 ± 0.6 55.9 ± 0.1
Sepharose SP 0 32.5 ± 0.4 56.4 ± 1.3
Sepharose phenyl 0 33.4 ± 0.5 56.6 ± 2.4
Polymeric material
Alginate 0 43.3 ± 0.3 63.3 ± 0.4
Agar 0 42.2 ± 0.5 65.6 ± 2.6
Cellulose 0 41.2 ± 0.3 64.1 ± 1.8
Sepharose 4B 0 24.8 ± 1.1 54.2 ± 0.5
Fastline agarose 0 38.0 ± 0.1 60.5 ± 1.0
Sephacryl S 400 0 39.9 ± 0.4 65.8 ± 1.8
Carrageenan 15.3 ± 1 25.1 ± 1.5 60.7 ± 0.8
Dextran (PD 10) 0 41.6 ± 0.5 51.4 ± 0.2
Polyacrylamide 0 44.7 ± 0.7 55.1 ± 0.1
Polyvinylpyrrolidone 0 42.2 ± 0.1 44.6 ± 0.2
Phenolic beads 0 38.7 ± 0.5 41.4 ± 0.2
Supelite™ DAX‑8 0 34.3 ± 0.7 37.3 ± 0.1
Poly(styrene‑co‑divinylbenzene) 0 35.3 ± 0.5 37.2 ± 0.6
Poly(ethyl methacrylate) 0 47.1 ± 0.3 53.7 ± 0.4
Chitosan 0 35.8 ± 0.5 37.7 ± 0.6
Glass4 35.0 ± 6.0 36.0 ± 5.0 52.0 ± 1.0D
Stainless steel5 81.2 ± 0.9 60.0 ± 1.1 23.4 ± 0.5
Polystyrene6 85.4 ± 0.7 65.3 ± 1.6 41.4 ± 1.5D
Toyopearl HW‑65 0 22.48 ± 1.9 65.8 ± 1.4
Hexamethyldisilazane (HMDS)7 90.8 ± 1.5 72.9 ± 2.0 55.3 ± 0.8
Polydimethylsiloxane (PDMS) 4 107.0 ± 5.0 97.0 ± 2.0 67.0 ± 2.0D
Silica7 4.7 ± 1.5 9.5 ± 2.0 17.4 ± 2.4
Ceramic hydroxyapatite type 1 0 51.22 ± 0.3 53.2 ± 0.8
Ceramic hydroxyapatite type 2 0 43.7 ± 1.6 56.6 ± 0.2
Ceramic fluoroapatite type 1 0 44.8 ± 0.5 57.9 ± 1.9
Ceramic fluoroapatite type 2 0 40.9 ± 0.6 61.7 ± 0.6

Page 6 of 12Yelemane et al. Bioresour. Bioprocess. (2021) 8:29
(Vennapusa 2008c). This is because in comparison with the size of the cell, the size of the adsorbent is very large (Vennapusa 2008b). These calculations will generate interaction energy vs. distance profiles, which will deter-mine whether the nature of the interaction is positive or negative.
When organisms approach the surface of an adsor-bent, the physical interaction forces that are believed to provide the stimulus in initial adhesion of the organisms
are: (a) hydrophobic interactions from 0.5 to 2 nm, where attached water on the surface poses a potential barrier for specific interaction; (b) repulsive and attrac-tive electrostatic interactions from 2–10 nm, which are generally repulsive beyond 10 nm, and finally (c) long-range Lifshitz–van der Waals interactions, which com-monly occur at less than 50 nm of separation (Fletcher 1996). Another very important class of interactions are ligand–receptor interactions, which are very specific
Table 3 Surface energy parameters for biomass, control adsorbents and polymeric beads
Surface energy parameters (mJ m‑2)
Material γLW γ+ γ− γAB γSTotal ΔGsws
Biomass
E. coli 32.70 1.40 51.80 17.03 49.73 31.01
B. subtilis 44.00 0.10 59.20 4.87 48.87 42.35
S. cerevisiae 27.90 4.40 51.50 30.11 58.01 24.36
CHO 33.60 1.20 52.10 15.81 49.41 30.92
Control
Sepharose Q 22.30 2.56 71.39 27.06 49.36 46.90
Sepharose DEAE 27.02 2.36 65.20 24.81 51.82 41.95
Sepharose SP 26.80 1.90 68.11 22.75 49.55 46.52
Sepharose Phenyl 26.69 1.63 69.96 21.34 48.03 49.53
Polymeric material
Alginate 23.32 1.05 79.69 18.30 41.61 62.37
Agar 22.18 1.50 78.09 21.65 43.83 57.94
Cellulose 22.93 1.48 76.97 21.33 44.26 57.08
Sepharose 4B 27.88 2.78 61.92 26.22 54.10 37.41
Fastline Agarose 24.69 1.57 73.46 21.45 46.14 53.32
Sephacryl S 400 22.06 1.96 75.21 24.30 46.37 52.89
Carrageenan 24.64 4.21 56.55 30.84 55.48 29.45
Dextran (PD 10) 29.23 0.31 78.45 9.92 39.16 67.29
Polyacrylamide 27.50 0.25 82.18 9.12 36.62 72.37
Polyvinylpyrrolidone 32.55 0.05 79.54 3.98 36.53 72.55
Phenolic beads 33.99 0.11 75.55 5.81 39.80 66.01
Supelite™ DAX‑8 35.75 0.21 71.06 7.73 43.48 58.63
Poly(styrene‑co‑divinylbenzene) 35.79 0.15 72.10 6.68 42.47 60.65
Poly(ethyl methacrylate) 28.13 0.07 85.64 4.78 32.91 79.78
Chitosan 35.61 0.14 72.57 6.47 42.08 61.43
Glass 33.15 0.98 46.20 13.49 46.64 25.98
Stainless steel 40.94 0.00 5.53 0.32 41.26 − 59.75
Polystyrene 38.90 0.00 2.83 0.00 38.90 − 72.94
Toyopearl HW‑65 22.02 5.56 59.59 36.41 58.43 28.74
Hexamethyldisilazane (HMDS) 27.34 0.09 3.89 1.19 28.53 − 59.09
Polydimethylsiloxane (PDMS) 24.56 0.00 0.03 0.00 24.56 − 98.58
Silica 42.39 0.81 55.84 13.45 55.84 33.43
Ceramic Hydroxyapatite Type 1 28.34 0.00 89.71 0.00 28.34 88.46
Ceramic Hydroxyapatite Type 2 26.65 0.44 80.69 11.87 38.52 68.56
Ceramic Fluoroapatite Type 1 26.04 0.41 82.10 11.55 37.59 70.42
Ceramic Fluoroapatite Type 2 24.12 1.24 76.75 19.53 43.65 58.30

Page 7 of 12Yelemane et al. Bioresour. Bioprocess. (2021) 8:29
physico-chemical forces between biological molecules and surfaces. Ligand–receptor interactions are strong and act within a short-range of distances less than
1 nm (Helm et al. 1991). These interactions cannot be accounted for within xDLVO theory. In current experi-ment, instead of the pocket depth as a measure of inter-action, we calculated the overall area of the interaction curve between 4 and 20 nm. When the interaction is attractive the net area will be negative, whereas when interaction is repulsive, the resulting area will be positive (Fig. 1). While the area of the interaction energy curve provides a net estimation of the total interaction between the biomass and adsorbent, it was careful to consider the distance at which secondary minima occurs, as it is a measure of the intensity of interaction. By plotting these two values for each adsorbent with a particular cell type, it was possible to obtain from the slope of such a scatter diagram a general tendency for the cell to adhere upon different surfaces (Fig. 2). We term these slope values as the “stickiness” factor of the cell type. Interestingly, the “stickiness” factor of a cell increases qualitatively with its complexity, where E. coli exhibits a relatively lower sticki-ness as compared to CHO cells.
“Stickiness” factor plots for different types of the cells are presented in Fig. 2. E. coli cells showed the least inter-action with the polymers, followed by B. subtilis then S. cerevisiae and CHO cells, which showed larger interac-tions, both for repulsive as well as attractive. “Stickiness” factor values were 2.21 × 10–08, 6.33 × 10–08, 1.06 × 10–07 and 2.54 × 10–07, for E. coli, B. subtilis, S. cerevisiae and CHO cells, respectively. This interaction trend is in direct agreement with biomass interaction problems encoun-tered in process conditions and researchers have already reported that E. coli generally exhibited lower interac-tion when compared to yeast cell (Anand, et al. 2007; Balasundaram and Harrison 2005,2008; Balasundaram 2008). Moreover, Fig. 2 clearly exemplifies and confirms the intuitive notion that as the cell complexity of the bio-mass increases (E. coli to CHO), the intensity of the inter-action also increases.
The effect of the salt concentration was on biomass interactions was also investigated by conducting the calculations in 20 mM phosphate buffer at pH 7.4 with 150 mM NaCl. High salt conditions are known to sup-press electrostatic interactions due to screening, thereby shifting the mode of interaction to mainly LW interac-tions, which act on at much shorter distances. As a result, the secondary minima of the interaction energy curves are shifted to much smaller distances for all biomass/polymer pairs. Furthermore, since LW interactions are always attractive, repulsive interactions that originated due to electrostatic effects are severely curtailed in these conditions, we expect to observe an apparent increase in biomass “stickiness” factors. Confirming this effect, the “stickiness” factor values for E. coli, B. subtilis, S. cerevisiae and CHO cells were 2.4 × 10–08, 9.54 × 10–08,
Table 4 Zeta potential values for biomass, control adsorbents and polymeric beads
Superscripted numbers on the colloids refers to the source of the data, 1 is from (Kakarla 2015); 2 is from (Li and Logan 2004); 3 is from (Vennapusa 2008b); 4 is from (Comelles, et al. 2010); 5 is from (Hedberg 2013); 6 is from (Carré 2007); 7 is from (Helms 2012). Rest are own measurements. The binding buffer is 20 mM phosphate buffer with 7.4. Elution condition is 20 mM phosphate buffer with 7.4 + 150 mM NaCl
Zeta potential mV
Binding condition
Elution condition
Biomass
E. coli1 − 29 − 23
B. subtilis2 − 40 − 24
S. cerevisiae3 − 20 − 11
CHO1 − 18 − 11
Control
Sepharose Q 27 13
Sepharose DEAE 19 10
Sepharose SP − 23 − 12
Sepharose phenyl − 2 − 1
Polymeric material
Alginate − 21 − 14
Agar − 26 − 16
Cellulose − 5 − 2
Sepharose 4B − 2 0
Fastline agarose − 7 − 3
Sephacryl S 400 − 1 − 1
Carrageenan − 26 − 14
Dextran (PD 10) 0 1
Polyacrylamide − 2 2
Polyvinylpyrrolidone − 1 0
Phenolic beads − 29 − 17
Supelite™ DAX‑8 − 8 − 3
Poly(styrene‑co‑divinylbenzene) − 15 − 7
Poly(ethyl methacrylate) − 27 − 15
Chitosan 2 1
Glass4 − 24 − 7
Stainless steel5 − 38 − 15
Polystyrene6 − 24 − 13
Toyopearl HW‑65 − 7 0
Hexamethyldisilazane (HMDS)7 0 0
Polydimethylsiloxane (PDMS)4 − 64 11
Silica7 − 26 − 16
Ceramic hydroxyapatite type 1 − 37 − 17
Ceramic hydroxyapatite type 2 − 50 − 19
Ceramic fluoroapatite type 1 − 46 − 18
Ceramic fluoroapatite type 2 − 46 − 20

Page 8 of 12Yelemane et al. Bioresour. Bioprocess. (2021) 8:29
1.29 × 10–07 and 4.75 × 10–07, respectively, which are slightly higher than those measured in low salt conditions (Fig. 3). Consequently, the interactions of polymers with E. coli appears to be relatively independent of the nature
of the polymer, which is represented by the formation of a cluster in the graph. A similar trend is observed for B. subtilis and S. cerevisiae. However, CHO interactions were quite dominant even in the presence of salt. It was
Fig. 1 Calculating area of the interaction energy curve a for attractive surfaces, b for repulsive surfaces
Fig. 2 The interaction energy Vs distance profiles of biomass as function of distance for a E. Coli, b B. subtilis, c S. cerevisiae and d CHO cells interaction with various polymeric beads in 20 mM phosphate buffer at pH 7.4, trend line on the graph is for representation of the trend

Page 9 of 12Yelemane et al. Bioresour. Bioprocess. (2021) 8:29
observed that most of the polysaccharide-based poly-mers were repellant in nature except for chitosan. Hydro-phobic polymers showed less interaction with E. coli and the complexity increased as they showed increase in
interaction and also their interaction increased in pres-ence of salt.
Figure 4 presents a compiled version of the above dis-cussed results plotted for easy one-to-one comparison
Fig. 3 The interaction energy Vs distance profiles of biomass as function of distance for a E. Coli, b B. subtilis, c S. cerevisiae and d CHO cells interaction with various polymeric beads in 20 mM phosphate buffer at pH 7.4 with 150 mM NaCl
Fig. 4 a A combined interaction energy Vs distance plot for E. coli, B. subtilis, S. cerevisiae and CHO cells as function of distance in 20 mM phosphate buffer at pH 7.4; b absolute values of “Stickiness” factor compared with normalized one

Page 10 of 12Yelemane et al. Bioresour. Bioprocess. (2021) 8:29
where E. coli shows the least interaction with the poly-mers forming the lowest stickiness factor and keep on increasing till CHO cells. To evaluate how stickier one type of cells compared to another, normalized “Sticki-ness” factor was calculated. To calculate the normalized “Stickiness” factor E. coli is considered as the reference point, its normalized “Stickiness” factor values are con-sidered to be one and the ratios calculated with other cell types. The main rationale to choose E. coli as reference point is from the previous published literature where it was known that they are compatible with most type of EBA adsorbents and show least interaction compared to other cell types. For interaction in 20 mM phosphate buffer at pH 7.4, normalized “Stickiness” factor values showed B. subtilis are 2.86 times, S. cerevisiae are 4.77 times and CHO cells are 11.49 times stickier in com-parison with E. coli cells. Interaction in 20 mM phos-phate buffer at pH 7.4 with 150 mM NaCl, normalized “Stickiness” factor values showed trends similar to buffer
condition without salt, however absolute values were different. B. subtilis are 3.98 times, S. cerevisiae are 5.38 times and CHO cells are 19.79 times stickier in compari-son to E. coli cells.
Effect of size on interaction and in terms of “Stickiness” factorThe effect of particle size on interaction has been inves-tigated using model biomass and its effect on biomass interaction can be explained using the “stickiness” fac-tor (Fig. 5). The reduction of biomass interaction prob-lem in expanded bed systems upon cell lysis has been well documented in the literature (Anand et al. 2007; Balasundaram and Harrison 2005,2008; Balasundaram 2008). In this study, we used data from one such report (Balasundaram and Harrison 2005), where homogenized feedstock, typical for E. coli applications in the indus-try, used in an EBA experiment and compare it with our calculations. Balasundaram et al. studied the extent of
Fig. 5 Effect of particle size on interaction surface a with E. coli, b with yeast interaction is presented; c comparison of “Stickiness” factor change with particle size and cell type

Page 11 of 12Yelemane et al. Bioresour. Bioprocess. (2021) 8:29
disruption of E. coli over a wide range and its effect on the bed expansion and adsorption (Anand, et al. 2007; Balasundaram and Harrison 2005). For our calculations, we assumed that after several passes of a cell suspen-sion through a high-pressure homogenizer, cell particle diameters are reduced to between 0.2 and 0.5 µm com-pared to a whole-cell diameter of 1.2 µm. After perform-ing xDLVO calculations, the “stickiness” factor dropped from 2.21 × 10–08 to 5.15 × 10–09 at 0.5 µm then further to 1.91 × 10–09 at 0.2 µm particle diameters. The normalized “stickiness” factor dropped almost ten times for a con-comitant sixfold reduction in particle size. These findings demonstrate that E. coli particle sizes indeed influence the interaction with adsorbents significantly.
The influence of the extent of disruption of baker’s yeast on protein adsorption in expanded beds has also been conducted by Balasundaram et al. (Balasundaram and Harrison 2008). They reported that an increase in the intensity of disruption resulted in an increase in the dynamic binding capacity of both the total soluble pro-tein and α-glucosidase in expanded bed adsorption chromatography (Balasundaram 2008; Balasundaram and Harrison 2008). In this case, the “stickiness” factor for whole cells with 10 µm diameters was found to be 1.06 × 10–07, after a tenfold reduction in particle size it dropped to 1.04 × 10–08, and finally with a 0.1-µm diam-eter it dropped to 8.95 × 10⁻¹⁰. Normalized “Stickiness” factors were 4.77, 0.47 and 0.04, respectively, for 10, 1 and 0.1 µm, and were in direct proportion to each other. These results demonstrate the degree of biomass–adsor-bent interactions is in direct proportion to the size of the biomass particle as well as its “stickiness” factor and that these experimental observations can be logically explained using xDLVO theory.
ConclusionIn this work, a “stickiness” factor was derived based on the interactions of several types of cells with a library of adsorbents having diverse surface properties, which can help in the calculation of the stickiness level of any physico-chemically characterized microorganism. This “stickiness” factor has been shown to approximate the tendency of a microorganism to interact with surfaces in general. It was also found that interactions were stronger at lower salt concentrations and decreases as salt concen-trations are increased. Cell particle sizes also were shown to play an important role in determining the intensity of interaction. We validated the universal applicability of “Stickiness” factors within a single cell type having differ-ent cell particle size and these results corroborated ear-lier published experimental findings. In summary, this work could help compare the biomass–adsorbent inter-actions for different biomass types as well as different
biomass particle sizes. Furthermore, the data acquired in this work could potentially aid the development of next-generation EBA adsorbents having lesser biomass interaction.
AbbreviationsB. subtilis: Bacillus subtilis; CHO: Chinese hamster ovary; DEAE: Diethylaminoe‑thyl; DLVO: Derjaguin, Landau, Verwey, and Overbeek theory; DSP: Down‑stream processing; E. coli: Escherichia coli, (B); EBA: Expanded bed adsorption; EL: Electrostatic; LW: Lifshitz–Van der Waals; Saccharomyces cerevisiae: S. cerevisiae; xDLVO: Extended Derjaguin, Landau, Verwey, Overbeek.
AcknowledgementSupport for this study was provided from Intenso project by European Union Seventh Framework Programme, CODOBIO project. Project NANOFACIL, NANOFACIL, BMBF and Jacobs University Bremen
Authors’ contributionsVY, MK, RND MFL designed the work. MK, VY carried out the experiment. VY, MK, RND, and MFL analyzed the data and contributed to the statistical analysis. VY, MK, RND and MFL wrote the manuscript and reviewed the manuscript critically. All authors read and approved the final manuscript.
FundingPartial support for this study was provided from INTENSO PROJECT, European Union Seventh Framework Programme (FP7/2013–2017) under Grant agree‑ment no. 312004, CODOBIO PROJECT European Commission Research & Inno‑vation and Project NANOZYME, BMBF—EuroTransBio‑9 (ETB‑9) no. 031B0017C, Project NANOFACIL, BMBF under Grant No. ZF4337203AJ8, and Jacobs Univer‑sity Bremen. This study was funded by H2020 European Institute of Innovation and Technology, H2020 Marie Skłodowska‑Curie Actions, Bundesministerium für Bildung und Forschung.
Availability of data and materialsAll data are fully available without restriction.
Declarations
Ethics approval and consent to participateNo animal or human subjects were used in this work.
Consent for publicationThis manuscript does not contain any individual person’s data.
Competing interestsThe authors declare that they have no competing interests.
Received: 25 December 2020 Accepted: 9 April 2021
ReferencesAasim M et al (2014) The role of ligands on protein retention in adsorption
chromatography: a surface energetics approach. J Sep Sci 37(6):618–624Absolom DR et al (1983) Surface thermodynamics of bacterial adhesion. Appl
Environ Microbiol 46(1):90–97Anand H et al (2007) The effect of chemical pretreatment combined with
mechanical disruption on the extent of disruption and release of intracel‑lular protein from E. coli. Biochem Eng J 35(2):166–173
Balasundaram B, Harrison STL (2005) Influence of the extent of disruption of E. coli on the adsorption of beta‑galactosidase in expanded bed adsorption chromatography. J Biotechnol 118:S54–S55
Balasundaram B, Harrison STL (2008) Influence of the extent of disruption of Bakers’ yeast on protein adsorption in expanded beds. J Biotechnol 133(3):360–369
Page 12 of 12Yelemane et al. Bioresour. Bioprocess. (2021) 8:29
Balasundaram B et al (2008) A study of the influence of yeast cell debris on protein and alpha‑glucosidase adsorption at various zones within the expanded bed using in‑bed sampling. Biotechnol Bioeng 99(3):614–624
Bayoudh S et al (2009) Assessing bacterial adhesion using DLVO and XDLVO theories and the jet impingement technique. Colloids Surf B Biointer‑faces 73(1):1–9
Callow ME, Callow JA (2002) Marine biofouling: a sticky problem. Biologist 49(1):1–5
Carré A (2007) Polar interactions at liquid/polymer interfaces. J Adhes Sci Technol 21(10):961–981
Chen Y et al (2011) Statistical analysis of long‑ and short‑range forces involved in bacterial adhesion to substratum surfaces as measured using atomic force microscopy. Appl Environ Microbiol 77(15):5065–5070
Comelles J et al (2010) The role of surface energy of technical polymers in serum protein adsorption and MG‑63 cells adhesion. Nanomedicine 6(1):44–51
Costerton JW (1999) Introduction to biofilm. Int J Antimicrob Agents 11(3–4):217–221
Costerton JW et al (1987) Bacterial biofilms in nature and disease. Annu Rev Microbiol 41(1):435–464
Derjaguin BV, Landau L (1941) Theory of the stability of strongly charged lyo‑phobic sols and of the adhesion of strongly charged particles in solutions of electrolytes. Acta Phys Chim URSS 14:633–662
Fernández Lahore M et al (2009) Expanded bed chromatography, surface energetics of biomass deposition, in encyclopedia of industrial biotech‑nology. Wiley, New York
Flemming HC, Meier M, Schild T (2013) Mini‑review: microbial problems in paper production. Biofouling 29(6):683–696
Fletcher M (1996) Bacterial adhesion: molecular and ecological diversity. Wiley, New York
Fu KB et al (2015) Comparison of adhesion of A. ferrooxidans on different cop‑per sulfides: Surface thermodynamics and extended DLVO theory. Miner Metallurg Process 32(2):121–128
Hedberg Y et al (2013) Surface‑protein interactions on different stainless steel grades: effects of protein adsorption, surface changes and metal release. J Mater Sci 24(4):1015–1033
Helm CA, Knoll W, Israelachvili JN (1991) Measurement of ligand receptor interactions. Proc Natl Acad Sci USA 88(18):8169–8173
Helms G. Probing biomass‑chromatographic bead interactions by AFM force spectroscopy. 2012.
Hermansson M (1999) The DLVO theory in microbial adhesion. Colloids Surf B Biointerfaces 14(1–4):105–119
Kakarla PB. Radical optimization of expanded bed chromatography by the implementation of an interaction energy predictive framework. 2016.
Kakarla PB et al (2015) Interactions of Chinese Hamster Ovary (CHO) cell cultures with second generation expanded bed adsorbents. Sep Purif Technol 144:23–30
Kirby BJ, Hasselbrink EF Jr (2004) Zeta potential of microfluidic substrates: 1. Theory, experimental techniques, and effects on separations. Electropho‑resis 25(2):187–202
Kujundzic E et al (2010) Biofouling potential of industrial fermentation broth components during microfiltration. J Membr Sci 349(1–2):44–55
Lappin‑Scott HM, Costerton JW (1989) Bacterial biofilms and surface fouling. Biofouling 1(4):323–342
Li B, Logan BE (2004) Bacterial adhesion to glass and metal‑oxide surfaces. Colloids Surf, B 36(2):81–90
Lin DQ et al (2003) Biomass/Adsorbent electrostatic interactions in expanded bed adsorption: a zeta potential study. Biotechnol Bioeng 83(2):149–157
Lin D‑Q, Zhong L‑N, Yao S‑J (2006) Zeta potential as a diagnostic tool to evalu‑ate the biomass electrostatic adhesion during ion‑exchange expanded bed application. Biotechnol Bioeng 95(1):185–191
Meinders JM, vander Mei HC, Busscher HJ. (1995) Deposition efficiency and reversibility of bacterial adhesion under flow. J Coll Interface Sci 176(2):329–341
Melo LF, Bott TR (1997) Biofouling in water systems. Exp Thermal Fluid Sci 14(4):375–381
Mikelonis AM, Youn S, Lawler DF (2016) DLVO approximation methods for predicting the attachment of silver nanoparticles to ceramic membranes. Langmuir 32(7):1723–1731
Naz N et al (2015) Growth‑dependent surface characteristics of Hansenula Polymorpha: implications for expanded bed adsorption chromatography. Biotechnol Bioprocess Eng 20(3):576–584
Nguyen V et al (2016) Physicochemical analysis of initial adhesion and biofilm formation of Methanosarcina barkeri on polymer support material. Col‑loids Surf B 143:518–525
Petrova OE, Sauer K (2009) A novel signaling network essential for regu‑lating Pseudomonas aeruginosa biofilm development. PLoS Pathog 5(11):e1000668
Saini R, Saini S, Sharma S (2011) Biofilm: a dental microbial infection. J Nat Sci Biol Med 2(1):71–75
Sanders PF, Sturman PJ (2005) Biofouling in the oil industry. Petrol Microbiol 465:171–198
Sharma PK, Hanumantha RK (2002) Analysis of different approaches for evalu‑ation of surface energy of microbial cells by contact angle goniometry. Adv Coll Interf Sci 98(3):341–463
Simões M, Simões LC, Vieira MJ (2010) A review of current and emergent biofilm control strategies. LWT Food Sci Technol 43(4):573–583
Svensäter G, Bergenholtz G (2004) Biofilms in endodontic infections. Endod Top 9(1):27–36
Thommes J et al (1998) The influence of cell adsorbent interactions on protein adsorption in fluidised beds. Abstr Pap Am Chem Soc 216:U246–U246
Truesdail SE et al (1998) Analysis of bacterial deposition on metal (hydr)oxide‑coated sand filter media. J Colloid Interface Sci 203(2):369–378
Van Oss CJ, Good RJ, Chaudhury MK (1986) The role of van der Waals forces and hydrogen bonds in “hydrophobic interactions” between biopolymers and low energy surfaces. J Colloid Interface Sci 111(2):378–390
Van Oss CJ, Chaudhury MK, Good RJ (1988) Interfacial Lifshitz‑van der Waals and polar interactions in macroscopic systems. Chem Rev 88(6):927–941
van Oss CJ (1995) Hydrophobicity of biosurfaces — Origin, quantitative deter‑mination and interaction energies. Colloids Surf B 5(3–4):91–110
van Oss CJ (2006) Interfacial Forces in Aqueous Media, 2nd edn. CRC Press, Boca Raton
Vanoss CJ (1993) Acid‑base interfacial interactions in aqueous‑media. Coll Surf 78:1–49
Vennapusa RR. Surface energetics of adsorbent‑biomass interactions during expanded bed chromatography: implications for process performance. 2008.
Vennapusa RR, Fernandez‑Lahore M (2010) Effect of chemical additives on bio‑mass deposition onto beaded adsorbents. J Biosci Bioeng 110(5):564–571
Vennapusa R et al (2008) Assessing adsorbent–biomass interactions during expanded bed adsorption onto ion exchangers utilizing surface energet‑ics. J Chromatogr A 1181(1–2):9–20
Vennapusa RR et al (2008a) Surface energetics to assess microbial adhesion onto fluidized chromatography adsorbents. Eng Life Sci 8(5):530–539
Verran J (2002) Biofouling in food processing: biofilm or biotransfer potential? Food Bioprod Process 80(4):292–298
Verwey EJW, Overbeek JTG (1948) Theory of the stability of lyophobic colloids. Elsevier, Amsterdam
Vilinska A, Rao KH (2011) Surface thermodynamics and extended DLVO theory of Leptospirillum ferrooxidans cells’ adhesion on sulfide minerals. Miner Metall Process 28(3):151–158
Washburn EW (1921) The dynamics of capillary flow. Phys Rev 17(3):273–283
Publisher’s NoteSpringer Nature remains neutral with regard to jurisdictional claims in pub‑lished maps and institutional affiliations.