surface and porous structure of pigment coatings664449/fulltext01.pdf · surface and porous...
TRANSCRIPT
Surface and porous structure of pigment coatingsInteractions with flexographic ink and effects on print quality
Erik Bohlin
DISSERTATION | Karlstad University Studies | 2013:49
Chemical Engineering
Faculty of Health, Science and Technology
DISSERTATION | Karlstad University Studies | 2013:49
Surface and porous structure of pigment coatingsInteractions with flexographic ink and effects on print quality
Erik Bohlin
urn:nbn:se:kau:diva-30030
Distribution:Karlstad University Faculty of Health, Science and TechnologyDepartment of Engineering and Chemical SciencesSE-651 88 Karlstad, Sweden+46 54 700 10 00
© The author
ISBN 978-91-7063-528-1
Print: Universitetstryckeriet, Karlstad 2013
ISSN 1403-8099
Karlstad University Studies | 2013:49
DISSERTATION
Erik Bohlin
Surface and porous structure of pigment coatings - Interactions with flexographic ink and effects on print quality
WWW.KAU.SE

i
It has always fascinated me that a crate of grapefruit is just as full as a crate of peas, but you can get a lot of peas into a crate of grapefruit, whereas you cannot get a grapefruit into a crate of peas.
- Anthony Bristow
ii
Abstract
Pigment coating is widely used to enhance the optical properties and product properties such as gloss and print quality of paper and paperboard. The aim of the work described in this thesis is to characterize the structure of coatings and prints, and to validate models for the optical response and interaction of ink and coating based on optical measurements of physical samples. It is the interaction between the printing ink and the porous structure of the coating which is subject to investigation, and model experiments have been employed to relate the physical conditions in a flexographic printing nip to the ink setting, affected by the physical and chemical properties of the coating, to the resulting optical response of the printed paperboard.
This thesis contain two parts, one focusing on the effect of calendering on the optical response of coated paperboard and one focusing on the interaction of flexographic ink with coated and calendered paperboard.
Calendering of coated paper often leads to a decrease in brightness. The mechanism for this is not altogether clear. One common explanation is that the porosity of the coating layer decreases and hence that the light scattering power decreases. By comparing simulated and measured results, it was shown that modifications of the surface properties account for the brightness decrease when substrates coated with ground calcium carbonate are calendered. Monte Carlo light scattering simulations, taking into account the measured decrease in surface micro-roughness and the increase in the effective refractive index, showed that surface modifications accounted for most of the observed brightness decrease, whereas the bulk light scattering and light absorption coefficients were not affected by calendering. It was also shown that the scattering coefficient is significantly dependent on the coat weight whereas the physical absorption coefficient is not.
The penetration of ink in the z-direction of a substrate influences the quality of the print. The ink penetration affects the print density, mottling and dot gain, which are print effects that influence the achievable print quality and visual appearance. Both the pressure in the printing nip and the porosity of the substrate affect the amount of ink that is pressed into the porous structure of a coating layer during printing. By printing pilot-coated paperboard with different coating porosities and measuring the resulting optical properties of the prints, a basis for simulation of the different layers, i.e. the coating, the print and the intermediate mixed layer, was
iii
created. Results show that ink distribution is strongly affected by the roughness of the substrate. Fibres and fibre flocs beneath the two coating layers created an unevenly distributed coating thickness that affected the print quality. Differences in pore size and pore size distribution also affected the behaviour of the ink. A coating layer of broad pigment particle size distribution resulted in a relatively low print density, in contrast to coatings with narrowly distributed particle sizes. The coating layer with a narrow particle size distribution showed a smaller dot gain than the other pigment size distributions used. In this work, these results are explained by the differences in ink distribution on and in the coating layers.
Results with samples having different latex amounts and different latex particle sizes showed that an increase in latex particle size increased the porosity, and that this in turn increased the ink penetration due to mechanical forces in the printing nip. A higher print force did not increase the depth of penetrated ink to any great extent, but rather allowed the wetting to act more efficiently with a more evenly distributed ink film, a higher print density and fewer uncovered areas as a result. Uncovered areas could be linked both to local roughness variations and to local wettability variations on the surface. Roughness-related un-covered areas decreased more than wettability-related uncovered areas when the printing force was increased. The fraction of latex-covered area on the coating surfaces was estimated, and the rate of ink penetration into the coating layers could be linked to the fraction of latex-free area on the coating surface.
For samples with different ratios of kaolin/calcium carbonate clay pigment, scanning electron microscope images clearly showed structural differences when the amount of disc-shaped kaolin particles among the more sphere-shaped calcium carbonate particles was increased. The surface became smoother, and the gloss increased with increased amount of kaolin. Mercury porosimetry measurements showed that the porosity increased with increasing amount of kaolin in the coating layer. Full-tone prints on the samples showed an increase in print density with an increase in printing force, and also an increase in print density with increasing amount of kaolin. Result suggested that there is a connection between penetrated ink and the print gloss that decreased with increased ink penetration depth.
iv
Sammanfattning
Pigmentbestrykning är en teknik som ofta används för att förbättra optiska och strukturella egenskaper så som glans och tryckkvalitet på papper och kartong. Syftet med arbetet som beskrivs i denna avhandling är att karaktärisera strukturen hos bestrukna och tryckta ytor samt att utvärdera modeller för optisk respons och interaktion mellan tryckfärg och bestruket substrat, baserat på optiska mätningar av fysiskt framtagna prover. Växelverkan mellan tryckfärg och den porösa strukturen hos bestrykningslager ligger i fokus för undersökningen, och modellering har använts för att relatera de fysiska förhållandena i ett flexografiskt trycknyp till färgsättningen, som påverkas av de strukturella och kemiska egenskaperna hos bestrykningen, till den resulterande optiska responsen för den tryckta kartongen.
Denna avhandling innehåller två delar, en som behandlar kalandreringseffekten på optisk respons hos bestruken kartong, och en som fokuserar på interaktionen mellan flexografisk tryckfärg och bestruken kartong.
Kalandrering av bestruket papper leder ofta till en minskning av ljushet. Mekanismen för denna effekt är inte helt klarlagd. En vanligt förekommande förklaring är att bestrykningslagrets porositet minskar, och därmed också ljusspridningen i materialet. Genom att jämföra simulerade och uppmätta resultat kunde det visas att förändringar av ytans struktur kan förklara ljushetsminskningar när substrat bestrukna med kalciumkarbonat kalandreras. Monte Carlo-simuleringar av ljusspridning, där förändringar av brytningsindex och mikroytråhet kan behandlas, visade att ytförändringar kan förklara stora delar av den observerade minskningen av ljushet även om bulkmaterialets ljusspridning och ljusabsorption förmodas vara opåverkad av kalandreringen. Det visade sig också att ljusspridningskoefficienten, men inte ljusabsorptionskoefficienten, signifikant påverkades av bestrykningens påläggsvikt.
Inträngning av tryckfärg i ett substrat har inverkan på den slutliga tryckkvaliteten. Tryckfärgsinträngning påverkar bland annat tryckdensitet, flammighet och punktförstoring, vilket alla är effekter som inverkar på det visuella intrycket. Både trycket i trycknypet och porositeten hos substratet påverkar graden av tryckfärgsinträngning. Genom att trycka pilotbestruken kartong med varierad porstruktur och mäta de optiska egenskaperna hos den tryckta ytan skapades en grund för simulering av olika lager, det vill säga trycklager, bestrykningsskiktet och det blandade lagret av tryckfärg och bestrykning däremellan. Resultatet visade att distributionen av tryckfärg starkt påverkades av substratets ytråhet. Fibrer och
v
fiberflockar under två bestrykningslager gav upphov till en ojämn bestrykningstjocklek som i sin tur påverkade tryckkvaliteten. Variationer i porstorlek och porstorleksfördelning påverkade också tryckfärgsfördelningen. Ett bestrykningslager med bred partikelstorleksfördelning hos pigmentet resulterade i låg tryckdensitet och större punktförstoring jämfört med ett pigment med smal partikelstorleksfördelning. Resultaten förklaras med skillnader i tryckfärgsfördelning på och i de olika materialen.
Resultat från mätningar av bestrykningsprover med varierad latexmängd och latexpartikelstorlek visade att en ökning av partikelstorleken ökar bestrykningens porstorlek, vilket i sin tur ökar mängden mekaniskt inträngd tryckfärg i trycknypet. En ökning av tryckkraften i nypet ökade inte inträngningsdjupet i någon större grad, men ökade däremot vätningseffekten, vilket resulterade i en jämnare fördelad tryckfärg, en högre tryckdensitet och färre otryckta ytor. Otryckta ytor kunde kopplas till både lokala ytråhetsvariationer och lokala vätningsvariationer på ytan. Antalet otryckta ytor relaterade till ytråhet minskade mer än de otryckta ytor som kunde kopplas till vätning när tryckkraften i nyptrycket ökades. Fraktionen av latextäckning på bestrykningsytorna uppskattades och graden av tryckfärgsinträngning kunde kopplas till graden av latexfria områden på ytan.
Svepelektronmikroskopibilder av prover innehållande varierade proportioner av kaolinlera och kalciumkarbonat visade tydliga strukturella skillnader när mängden av diskformade kaolinpartiklar ökade bland de mer sfäriska karbonatpartiklarna. Ytråheten minskade och glansen ökade med ökad mängd kaolinlera. Mätningar med kvicksilverporosimetri visade att bestrykningslagrets porositet ökade med ökad mängd kaolin. Fulltonstryck av proverna uppvisade en högre tryckdensitet med både ökat nyptryck och ökad mängd kaolinlera. Resultat antyder också att tryckfärgsinträngning påverkar tryckglansen, som visade sig minska med ökat inträngningsdjup.
vi
Papers included in this thesis
I. Bohlin, E., Coppel, L., Andersson, C., Edström, P. (2009): Characterization and Modelling of the Effect of Calendering on Coated Polyester Film. Advances in Printing and Media Technology, In N. Enlund and M. Lovreček (ed)., Advances in Printing and Media Technology, Vol. XXXVI, Proceedings of the 36th International Research Conference of iarigai, Stockholm, Sweden, September 2009, Darmstadt, Germany, ISBN 987-3-9812704-1-0, p. 301-308.
II. Bohlin, E., Coppel, L., Johansson, C. and Edström, P. (2010): Modelling of Brightness Decrease in Coated Cartonboard as an Effect of Calendering – Micro-roughness and Effective Refractive Index Aspects. TAPPI 11th Advanced Coating Fundamentals Symposium, Munich, Germany, October 11-13, 2010. Symposium Proceedings, TAPPI Press, Norcross, GA, USA, ISBN 1-59510-203-5, p. 51-65.
III. Bohlin, E., Lestelius, M. and Johansson, C. (2013): Flexographic Ink-Coating Interactions - Effects of Porous Structure Variations of Coated Paperboard. Nordic Pulp and Paper Research Journal, 28 (4), xx-yy.
IV. Bohlin, E., Johansson, C. and Lestelius, M. (2013): Flexographic ink-coating interactions - Effects of latex variations in coating layers. Manuscript in preparation.
V. Bohlin, E., Johansson, C. and Lestelius, M. (2013): Flexographic ink-coating interactions - Effects of kaolin clay/GCC blends in coating layers. Manuscript in preparation.
Reprints of Paper I-III have been made with permission from the publishers.
Erik Bohlin’s contribution to the papers
Erik Bohlin performed all the experimental work with the exception of the Monte-Carlo simulations and the reflectometry measurements in Paper I and Paper II, and the mercury porosity measurements in Paper III, Paper IV and Paper V. Cross-section images, SEM images and red wipe image analysis has also been performed elsewhere.
Erik Bohlin is the main author of these five papers.
vii
Related publications and presentations by the same author
Bohlin, E., Andersson, C. Surface characterization and model verification. (poster presentation), ROND 2009 Paper Optics with new eyes – tools for product development, Örnsköldsvik, Sweden, 4 February 2009.
Bohlin, E., Coppel, L., Andersson, C. and Edström, P. Calendering of coated polyester film - characterization and modelling. (poster presentation), ROND 2010 Innovative Packaging /The New Forest Industry, Örnsköldsvik, Sweden, 16-17 March 2010.
Bohlin, E. , Coppel, L., Johansson, C. and Edström, P. Modelling of coating brightness – Impact of micro-roughness and effective refractive index. (poster presentation), ROND 2011 Digital Printing – Inkjet for Industrial Applications, Örnsköldsvik, Sweden, 1 March 2011.
Bohlin, E., Johansson, C. and Lestelius, M. Flexographic ink-coating interactions – Effects of latex variations in coating layers, 8th International Paper and Coating Chemistry Symposium, Stockholm, Sweden, June 10-14, 2012, Book of Abstracts, p. 189-192.
Bohlin, E., Johansson, C. and Lestelius, M. Evaluation of ink penetration in porous coatings. 8th International Paper and Coating Chemistry Symposium, (poster presentation), Stockholm, Sweden, June 10-14, 2012, Book of Abstracts, p. 321-324.
viii
List of abbreviations and symbols
A Calculated surface area
b Amount of ink that can be immobilized
c Speed of light in vacuum
cm Speed of light in a material
d Distance
DR Print density, half tone
DS Print density, solid (full) tone
E Elasticity modulus
f Areal fraction of component n
fp Proportion of area in contact with liquid
fi Fraction of ink transferred to the substrate
F Applied force
FD Effective coverage of print
Fnom Nominal tone value of printing plate
g Asymmetry parameter
G Gloss
Gpa Gloss of the substrate used for printing
Gpr Gloss of printed surface
GCC Ground calcium carbonate
h* Total ink penetration
hm Theoretical ink penetration
ik Absorption loss (imaginary part)
ix
I Intensity of radiation
IR Infrared
k Light absorption coefficient
K Calculated permeability
KM Kubelka-Munk
L Cylinder length
n Refractive index
nc Complex refractive index
p Pressure in calender nip
pph parts per hundred parts
P Printing nip pressure
PCC Precipitated calcium carbonate
Pr Probability
PSD Particle size distribution
q Smoothness constant
r Typical pore radius
RT Radiative transfer
R Reflectance factor
R0 Reflectance factor, single sheet
R∞ Reflectance factor, opaque pad of papers
Reff Effective radius
Rgs Reflectance factor of black background
Rgw Reflectance factor of white background
x
RS Reflectance factor of printed solid tone
Rs Reflectance factor measured against black background
Rw Reflectance factor measured against white background
Quotient real surface / projected surface
f Ratio of roughness for wet area
s Light scattering coefficient
SEM Scanning electron microscopy
t Time
T Light transmittance
Tg Glass transition temperature
UCA Un-covered areas
w Grammage of paper
x Amount of ink on the printing plate
yi Amount of ink transferred per unit area
Shear rate
γ Surface energy
γl - Electron donor component
γl+ Electron acceptor component
γab Acid-base component
γLW Lifshitz – van der Waals component
γTOT Total surface energy
ΔG Gloss contrast

xi
ε Porosity
η Viscosity
θ Contact angle
θ* Apparent contact angle
θc Resulting contact angle
θi Angle of incident light
θr Angle of surface reflected light
θt Angle of transmission
σ Shear stress
σa Light absorption, physical quantity
σe Extinction coefficient
σs Light scattering, physical quantity
σs´ Reduced scattering coefficient
τ Tortuosity
xii
Table of contents Abstract ................................................................................................................... ii Sammanfattning ...............................................................................................................................................iv Papers included in this thesis ............................................................................... vi Related publications and presentations by the same author ........................................ vii List of abbreviations and symbols .................................................................... viii
1 Introduction .............................................................................................................. 1 1.1 Optical properties of paper products ................................................................ 1 1.2 Objective and content ....................................................................................... 3
2 Pigment coating of paperboard ........................................................................... 6 2.1 Pigments ........................................................................................................... 6 2.2 Binders ............................................................................................................. 8 2.3 Thickeners ...................................................................................................... 11 2.4 Coating techniques ......................................................................................... 12 2.5 Calendering of coated substrates .................................................................... 14 2.6 Surface structure and topography................................................................... 15 2.7 Surface chemistry and surface energy............................................................ 16 2.8 Coating porosity ............................................................................................. 18
3 Printing .................................................................................................................... 20 3.1 Flexography ................................................................................................... 20 3.2 Printing plates ................................................................................................ 21 3.3 Anilox rolls .................................................................................................... 22 3.4 Flexographic ink............................................................................................. 23 3.5 Viscosity of printing inks ............................................................................... 24
3.5.1 Ink transfer and ink setting ..................................................................... 27 3.6 Print quality .................................................................................................... 30
3.6.1 Print density ............................................................................................ 30 3.6.2 Mottling .................................................................................................. 32 3.6.3 Dot gain .................................................................................................. 32 3.6.4 Print gloss ............................................................................................... 33
4 Optical properties of coatings and printed surfaces ...................................... 36 4.1 Overview of optical properties ....................................................................... 36
4.1.1 Gloss ....................................................................................................... 37 4.1.2 Brightness ............................................................................................... 38 4.1.3 Refractive index ...................................................................................... 40
4.2 Theoretical models of optical properties ........................................................ 42 4.2.1 The Kubelka-Munk theory ..................................................................... 42
4.3 The radiative transfer theory .......................................................................... 44 4.4 Monte Carlo simulations ................................................................................ 46
xiii
5 Materials and methods ........................................................................................ 49 5.1 Laboratory-scale coating ................................................................................ 49
5.1.1 Objective ................................................................................................. 49 5.1.2 Coating substrate .................................................................................... 49 5.1.3 Coating recipes ....................................................................................... 49 5.1.4 Coating .................................................................................................... 50 5.1.5 Calendering ............................................................................................. 50 5.1.6 Measurement of optical and structural properties................................... 50 5.1.7 Modeling of optical properties ................................................................ 51
5.2 Pilot coating of paperboard ............................................................................ 51 5.2.1 Coating formulations .............................................................................. 51 5.2.2 Coating and calendering ......................................................................... 52 5.2.3 Analysis of coated paperboard ................................................................ 53
5.3 Printing ........................................................................................................... 54 5.4 Microscopic analysis of coated surfaces and prints ....................................... 55
6 Summary of papers ............................................................................................... 57 6.1 Paper I ............................................................................................................ 57 6.2 Paper II ........................................................................................................... 59 6.3 Paper III .......................................................................................................... 61 6.4 Paper IV ......................................................................................................... 63 6.5 Paper V ........................................................................................................... 65
7 Conclusions ............................................................................................................ 67 8 Future work ............................................................................................................ 69 9 Acknowledgements .............................................................................................. 70 10 References ............................................................................................................... 71
1
1 Introduction
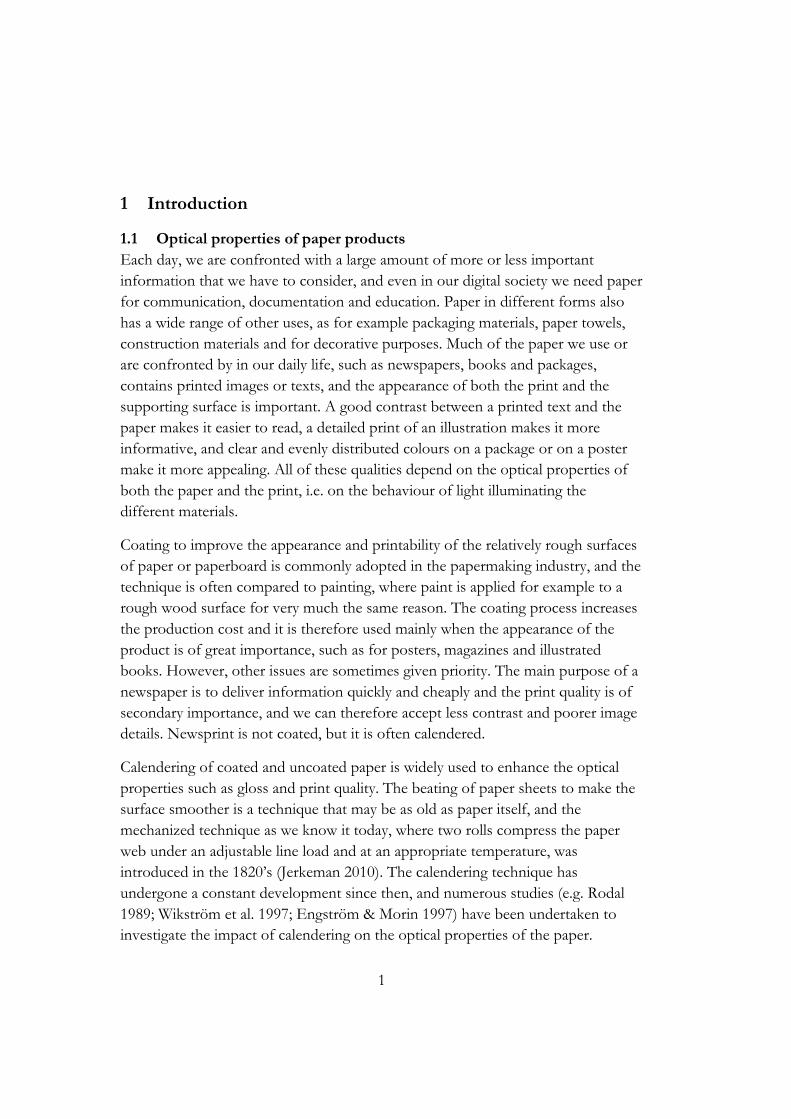
1.1 Optical properties of paper products Each day, we are confronted with a large amount of more or less important information that we have to consider, and even in our digital society we need paper for communication, documentation and education. Paper in different forms also has a wide range of other uses, as for example packaging materials, paper towels, construction materials and for decorative purposes. Much of the paper we use or are confronted by in our daily life, such as newspapers, books and packages, contains printed images or texts, and the appearance of both the print and the supporting surface is important. A good contrast between a printed text and the paper makes it easier to read, a detailed print of an illustration makes it more informative, and clear and evenly distributed colours on a package or on a poster make it more appealing. All of these qualities depend on the optical properties of both the paper and the print, i.e. on the behaviour of light illuminating the different materials.
Coating to improve the appearance and printability of the relatively rough surfaces of paper or paperboard is commonly adopted in the papermaking industry, and the technique is often compared to painting, where paint is applied for example to a rough wood surface for very much the same reason. The coating process increases the production cost and it is therefore used mainly when the appearance of the product is of great importance, such as for posters, magazines and illustrated books. However, other issues are sometimes given priority. The main purpose of a newspaper is to deliver information quickly and cheaply and the print quality is of secondary importance, and we can therefore accept less contrast and poorer image details. Newsprint is not coated, but it is often calendered.
Calendering of coated and uncoated paper is widely used to enhance the optical properties such as gloss and print quality. The beating of paper sheets to make the surface smoother is a technique that may be as old as paper itself, and the mechanized technique as we know it today, where two rolls compress the paper web under an adjustable line load and at an appropriate temperature, was introduced in the 1820’s (Jerkeman 2010). The calendering technique has undergone a constant development since then, and numerous studies (e.g. Rodal 1989; Wikström et al. 1997; Engström & Morin 1997) have been undertaken to investigate the impact of calendering on the optical properties of the paper.
2
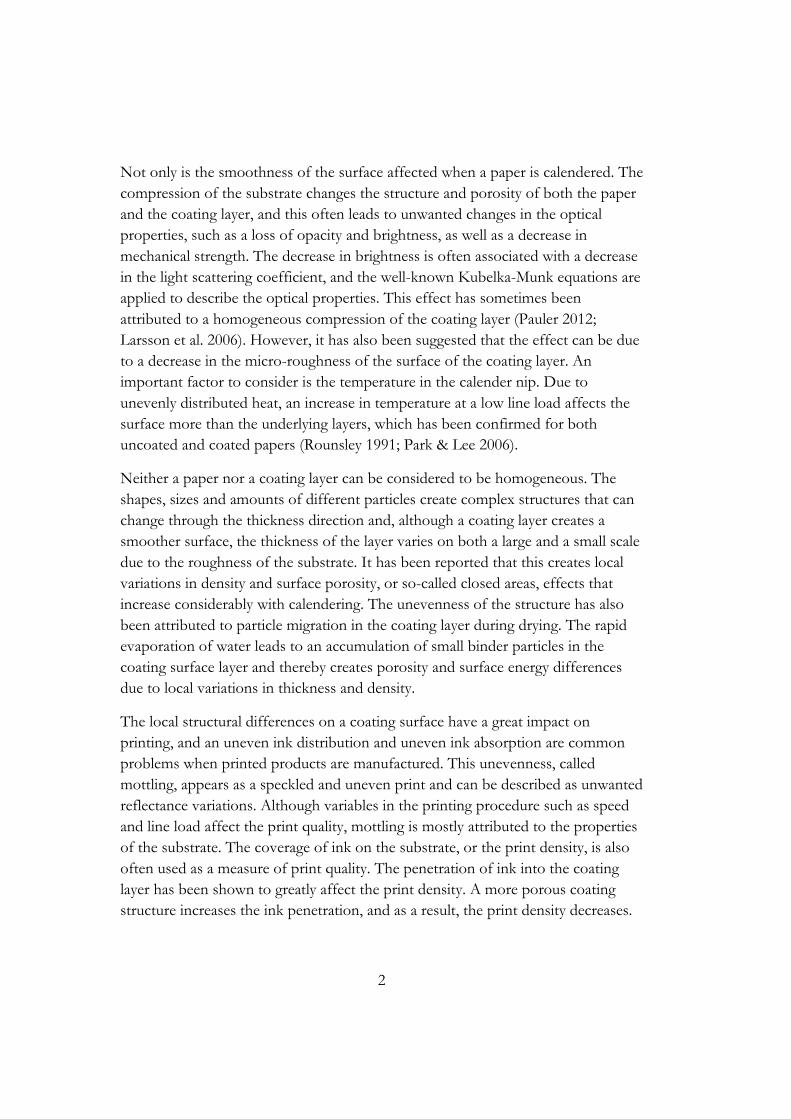
Not only is the smoothness of the surface affected when a paper is calendered. The compression of the substrate changes the structure and porosity of both the paper and the coating layer, and this often leads to unwanted changes in the optical properties, such as a loss of opacity and brightness, as well as a decrease in mechanical strength. The decrease in brightness is often associated with a decrease in the light scattering coefficient, and the well-known Kubelka-Munk equations are applied to describe the optical properties. This effect has sometimes been attributed to a homogeneous compression of the coating layer (Pauler 2012; Larsson et al. 2006). However, it has also been suggested that the effect can be due to a decrease in the micro-roughness of the surface of the coating layer. An important factor to consider is the temperature in the calender nip. Due to unevenly distributed heat, an increase in temperature at a low line load affects the surface more than the underlying layers, which has been confirmed for both uncoated and coated papers (Rounsley 1991; Park & Lee 2006).
Neither a paper nor a coating layer can be considered to be homogeneous. The shapes, sizes and amounts of different particles create complex structures that can change through the thickness direction and, although a coating layer creates a smoother surface, the thickness of the layer varies on both a large and a small scale due to the roughness of the substrate. It has been reported that this creates local variations in density and surface porosity, or so-called closed areas, effects that increase considerably with calendering. The unevenness of the structure has also been attributed to particle migration in the coating layer during drying. The rapid evaporation of water leads to an accumulation of small binder particles in the coating surface layer and thereby creates porosity and surface energy differences due to local variations in thickness and density.
The local structural differences on a coating surface have a great impact on printing, and an uneven ink distribution and uneven ink absorption are common problems when printed products are manufactured. This unevenness, called mottling, appears as a speckled and uneven print and can be described as unwanted reflectance variations. Although variables in the printing procedure such as speed and line load affect the print quality, mottling is mostly attributed to the properties of the substrate. The coverage of ink on the substrate, or the print density, is also often used as a measure of print quality. The penetration of ink into the coating layer has been shown to greatly affect the print density. A more porous coating structure increases the ink penetration, and as a result, the print density decreases.
3
The occurrence of uncovered areas (UCA) in full tone prints is another problem that can arise during printing. UCA are regions of varying size which are not intended to be free from ink. This can occur due to high surface roughness that prevents the ink from reaching deeper regions on the surface, or due to local variations in wettability. In other words, both structural and chemical variations in a coating layer can give rise to UCA in full-tone prints.
The PaperOpt project aims at modelling the paper optical system as a whole, including the optical influence of all paper components and surface treatments, from printing methods and inks to measurement and evaluation, in order to facilitate efficient product development and production methods for papermaking and printing, as well as to improve print quality and colour reproduction with a lower ink consumption. The Open PaperOpt model is a simulation program that has been designed to calculate light scattering and light absorption in paper and paper coatings (Coppel & Edström 2009). It uses a probability approach that takes into account structures both inside the layer and on the surface of the simulated sample. One of the major goals of the PaperOpt project is to suggest principles for achieving a more correct interpretation of reflectance factor measurements in order to facilitate efficient and correct data exchange between the paper and printing industries. Another goal is to develop simulation tools for the prediction of optical properties and print quality from paper properties and process parameters.
1.2 Objective and content The aim of the work described in this thesis is to characterize coatings and prints, and to test models against experimental results from optical measurements on physical samples. The results in five papers are summarized. The first two papers relate to the brightness decrease of calendered coating layers of different compositions, applied on both absorbent and non-absorbent substrates, and the three subsequent papers focus on ink penetration and the resulting variations in print quality on coating layers with different porosities and different chemical compositions.
The purpose of the work reported in Paper I was to simulate the decrease in brightness of coating layers after calendering. Results of optical measurements of laboratory-coated samples were compared with simulated values. In order to eliminate the effect of the substrate and to determine the optical properties of the coating colour alone, a non-absorbing plastic film was used as substrate. A decrease in brightness was detected in all the samples, and the results of the
4
simulations indicated that this could be attributed to a decrease in surface micro-roughness and to a decrease in the effective refractive index. This result was supported by the finding that the thickness of the coated substrate was unaffected by the calendering.
In Paper II, the investigations were extended to a coated paper substrate. Plastic films were also coated for comparative purposes. It was shown that the brightness decrease of the cartonboard substrate due to calendering had a negligible contribution to the total brightness decrease of the coated cartonboard. Although the total brightness decrease was lower for the coated cartonboard than for the coating on the non-absorbing substrate studied in Paper I, the decrease in this case could also be attributed to a decrease in surface micro-roughness and to a decrease in the effective refractive index.
In the interphase between a coating layer and a layer of applied ink, there will be a mixing of coating material and ink. The depth of this mixed ink/coating layer region depends on the porosity of the coating layer and on the degree of ink penetration. The amount of water-based flexographic ink penetrating into coating layers of three different porosities and its effect on print quality was studied in Paper III. The samples were printed on a lab-scaled IGT flexographic printer. A coating layer containing a pigment with a broad particle size distribution showed the lowest print density with a given amount of applied ink, while coating layers containing either pigments of narrow particle size distribution or pigments of small particle size showed equal and higher print density values. The print density for a given amount of transferred ink increased and the dot gain decreased as the coating pore structure became more open. The results indicate that a relatively large pore diameter and a large pore volume were beneficial for print quality with a water-based flexographic ink. A structure characterized by a larger pore volume and larger dominant pore radius showed a greater z-directional ink penetration, which was supported by estimating the penetration using a physical model taking into account both capillary and pressure driven penetration.
The amount of uncovered areas, caused by varying amounts of latex on the coating surfaces, was studied in Paper IV on four different coated samples. Two different amounts of latex, and latices of two different particle sizes, were added to the coating colours for pilot coating of cartonboard. Scanning electron microscope (SEM) images showed a clear increase in surface latex when the amount of latex was increased. At low print force, the samples containing a higher amount of latex
5
showed a greater degree of UCA in a full-tone print than the other samples with less surface latex. The results also showed an increasing degree of UCA with increasing latex particle size. However, when the print force was increased, the UCA almost vanished from the samples with a higher amount of surface latex. The UCA could be explained by both structural and local chemical variations in the coating surfaces, and it could to some extent be linked to areal fractions of surface latex.
In Paper V, different amounts of kaolin clay were added to the ground-calcium-carbonate (GCC)-based top coatings of pilot coated cartonboard. Mercury porosimetry measurements showed an increase in porosity, or void fraction, with increasing amount of kaolin, but the typical pore diameter was the same for all three samples. SEM images clearly showed structural changes in the coated surfaces when the amount of disc-shaped kaolin particles among the sphere-shaped GCC particles was increased. The surface became smoother and the gloss increased with increasing amount of kaolin. Full-tone prints on the three samples showed an increase in print density with increasing print force, and also an increase in print density with increasing amount of kaolin.
The work presented in this thesis can be used to study structure and properties of coating layers and the effects of porosity due to variations in chemical composition and calendering conditions. It can be used to develop methods to evaluate the penetration of water-based flexographic ink into different coating layers, and to verify newly developed simulation models by comparison of measured results with results from traditional optical models. The work also gives a deeper understanding of properties and structure of coating layers, effect of calendering, ink behaviour and print appearance.
6
2 Pigment coating of paperboard To achieve a smoother and a more printable surface, paper and paperboard grades are often coated. The coating layer is applied to the substrate as a wet coating colour by several techniques, which will be discussed in section 2.4. The coating colour consists of pigment, binder, thickener and water. Additives are also sometimes used to improve certain properties. The solids content of a coating colour can vary between 50 and 70 % depending on the properties of the substrate, the required rheological properties of the coating colour, the coating technique, the coating speed and other parameters. In industrial coating, it is desirable to keep the solids content as high as possible, partly for environmental reasons, partly to save energy in the drying stage which has a large impact on the process economics. Under laboratory conditions, however, where the coating speed is considerably lower and unconventional substrates are sometimes used, a coating colour of low solids content is often easier to handle.
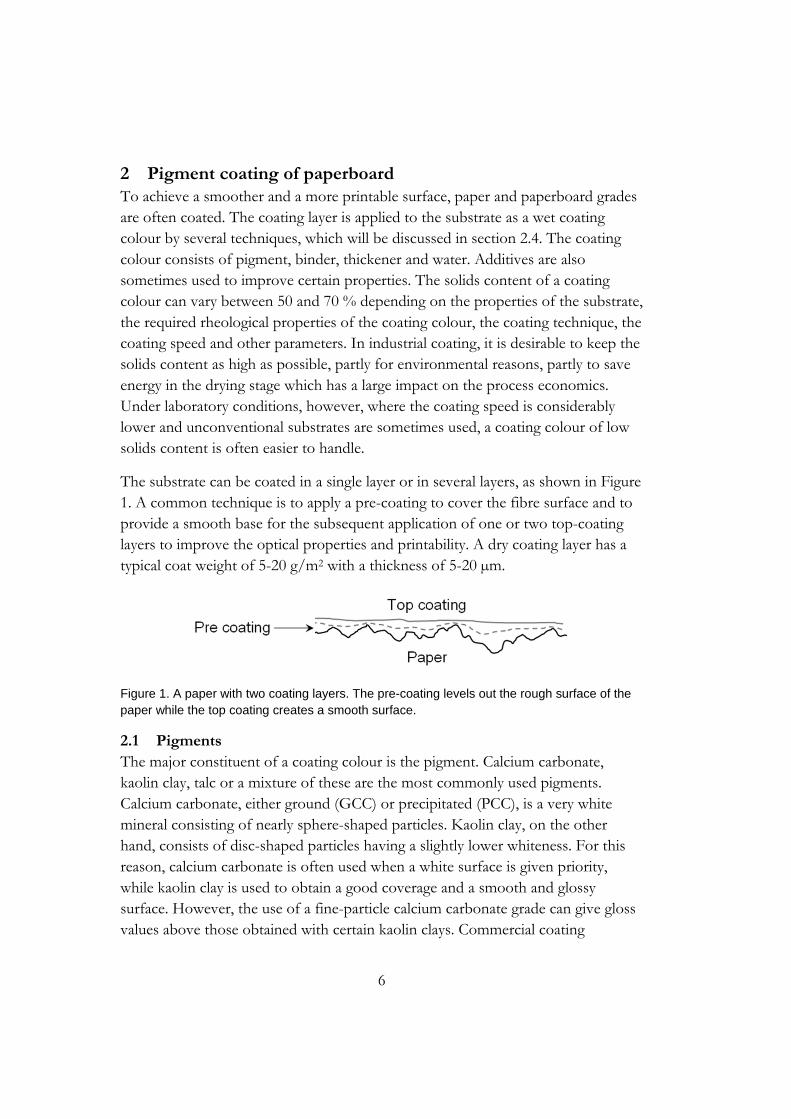
The substrate can be coated in a single layer or in several layers, as shown in Figure 1. A common technique is to apply a pre-coating to cover the fibre surface and to provide a smooth base for the subsequent application of one or two top-coating layers to improve the optical properties and printability. A dry coating layer has a typical coat weight of 5-20 g/m2 with a thickness of 5-20 µm.
Figure 1. A paper with two coating layers. The pre-coating levels out the rough surface of the paper while the top coating creates a smooth surface.
2.1 Pigments The major constituent of a coating colour is the pigment. Calcium carbonate, kaolin clay, talc or a mixture of these are the most commonly used pigments. Calcium carbonate, either ground (GCC) or precipitated (PCC), is a very white mineral consisting of nearly sphere-shaped particles. Kaolin clay, on the other hand, consists of disc-shaped particles having a slightly lower whiteness. For this reason, calcium carbonate is often used when a white surface is given priority, while kaolin clay is used to obtain a good coverage and a smooth and glossy surface. However, the use of a fine-particle calcium carbonate grade can give gloss values above those obtained with certain kaolin clays. Commercial coating
7
pigments are available in a wide range of particle sizes, particle shapes and particle size distributions (PSD). By mixing different pigments, coating layers with broad variations in porosity, structure and surface properties can be created.
Clay particles have negatively charged surfaces and positively charged edges and clay particles tend therefore to attract each other and form aggregates, so-called house-of-cards structures. The adsorption of a dispersing agent added under alkaline conditions renders the edges more negatively charged, and the dispersion stability can thus be increased. However, alignment of the plate-like particles in a loose house-of-cards structure yields an open and porous dry coating layer. Compared to the more closely packed structure formed by spherical GCC pigments, clay particles are more able to reorient themselves and clay coatings are thus considered to be more compressible upon calendering (Larsson et al. 2006; Dean 1997).
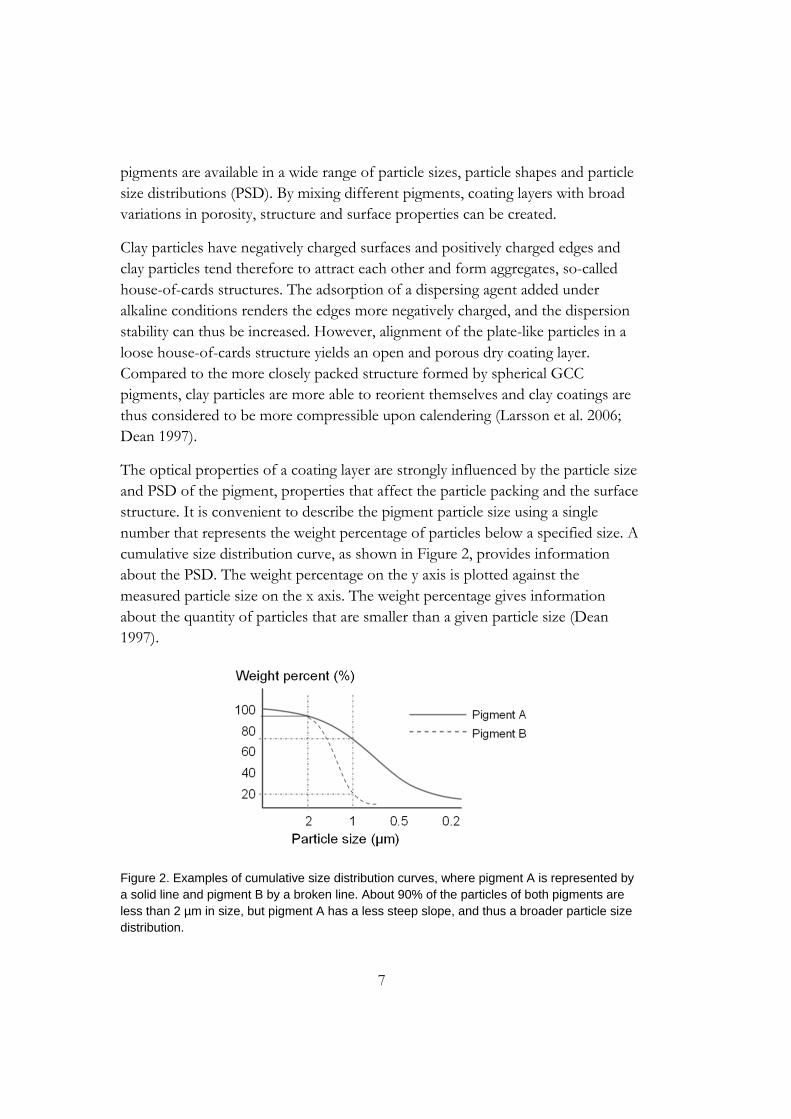
The optical properties of a coating layer are strongly influenced by the particle size and PSD of the pigment, properties that affect the particle packing and the surface structure. It is convenient to describe the pigment particle size using a single number that represents the weight percentage of particles below a specified size. A cumulative size distribution curve, as shown in Figure 2, provides information about the PSD. The weight percentage on the y axis is plotted against the measured particle size on the x axis. The weight percentage gives information about the quantity of particles that are smaller than a given particle size (Dean 1997).
Figure 2. Examples of cumulative size distribution curves, where pigment A is represented by a solid line and pigment B by a broken line. About 90% of the particles of both pigments are less than 2 µm in size, but pigment A has a less steep slope, and thus a broader particle size distribution.
8
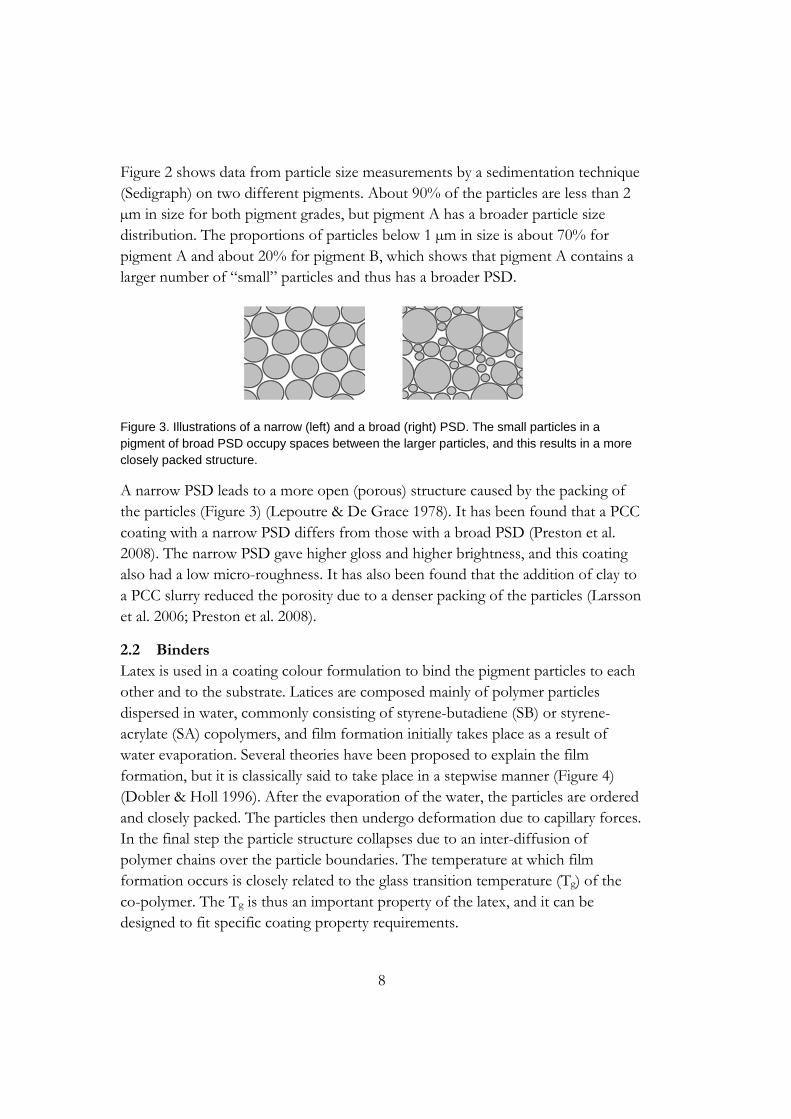
Figure 2 shows data from particle size measurements by a sedimentation technique (Sedigraph) on two different pigments. About 90% of the particles are less than 2 µm in size for both pigment grades, but pigment A has a broader particle size distribution. The proportions of particles below 1 µm in size is about 70% for pigment A and about 20% for pigment B, which shows that pigment A contains a larger number of “small” particles and thus has a broader PSD.
Figure 3. Illustrations of a narrow (left) and a broad (right) PSD. The small particles in a pigment of broad PSD occupy spaces between the larger particles, and this results in a more closely packed structure.
A narrow PSD leads to a more open (porous) structure caused by the packing of the particles (Figure 3) (Lepoutre & De Grace 1978). It has been found that a PCC coating with a narrow PSD differs from those with a broad PSD (Preston et al. 2008). The narrow PSD gave higher gloss and higher brightness, and this coating also had a low micro-roughness. It has also been found that the addition of clay to a PCC slurry reduced the porosity due to a denser packing of the particles (Larsson et al. 2006; Preston et al. 2008).
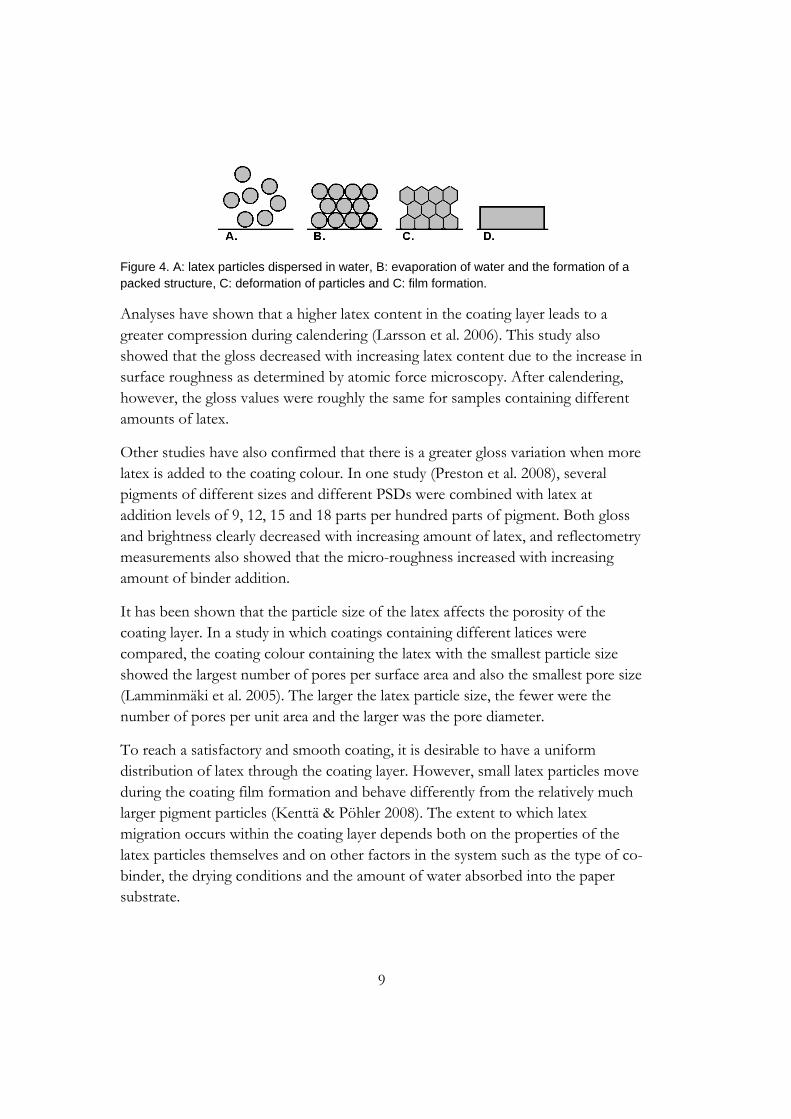
2.2 Binders Latex is used in a coating colour formulation to bind the pigment particles to each other and to the substrate. Latices are composed mainly of polymer particles dispersed in water, commonly consisting of styrene-butadiene (SB) or styrene-acrylate (SA) copolymers, and film formation initially takes place as a result of water evaporation. Several theories have been proposed to explain the film formation, but it is classically said to take place in a stepwise manner (Figure 4) (Dobler & Holl 1996). After the evaporation of the water, the particles are ordered and closely packed. The particles then undergo deformation due to capillary forces. In the final step the particle structure collapses due to an inter-diffusion of polymer chains over the particle boundaries. The temperature at which film formation occurs is closely related to the glass transition temperature (Tg) of the co-polymer. The Tg is thus an important property of the latex, and it can be designed to fit specific coating property requirements.
9
Figure 4. A: latex particles dispersed in water, B: evaporation of water and the formation of a packed structure, C: deformation of particles and C: film formation.
Analyses have shown that a higher latex content in the coating layer leads to a greater compression during calendering (Larsson et al. 2006). This study also showed that the gloss decreased with increasing latex content due to the increase in surface roughness as determined by atomic force microscopy. After calendering, however, the gloss values were roughly the same for samples containing different amounts of latex.
Other studies have also confirmed that there is a greater gloss variation when more latex is added to the coating colour. In one study (Preston et al. 2008), several pigments of different sizes and different PSDs were combined with latex at addition levels of 9, 12, 15 and 18 parts per hundred parts of pigment. Both gloss and brightness clearly decreased with increasing amount of latex, and reflectometry measurements also showed that the micro-roughness increased with increasing amount of binder addition.
It has been shown that the particle size of the latex affects the porosity of the coating layer. In a study in which coatings containing different latices were compared, the coating colour containing the latex with the smallest particle size showed the largest number of pores per surface area and also the smallest pore size (Lamminmäki et al. 2005). The larger the latex particle size, the fewer were the number of pores per unit area and the larger was the pore diameter.
To reach a satisfactory and smooth coating, it is desirable to have a uniform distribution of latex through the coating layer. However, small latex particles move during the coating film formation and behave differently from the relatively much larger pigment particles (Kenttä & Pöhler 2008). The extent to which latex migration occurs within the coating layer depends both on the properties of the latex particles themselves and on other factors in the system such as the type of co-binder, the drying conditions and the amount of water absorbed into the paper substrate.
10
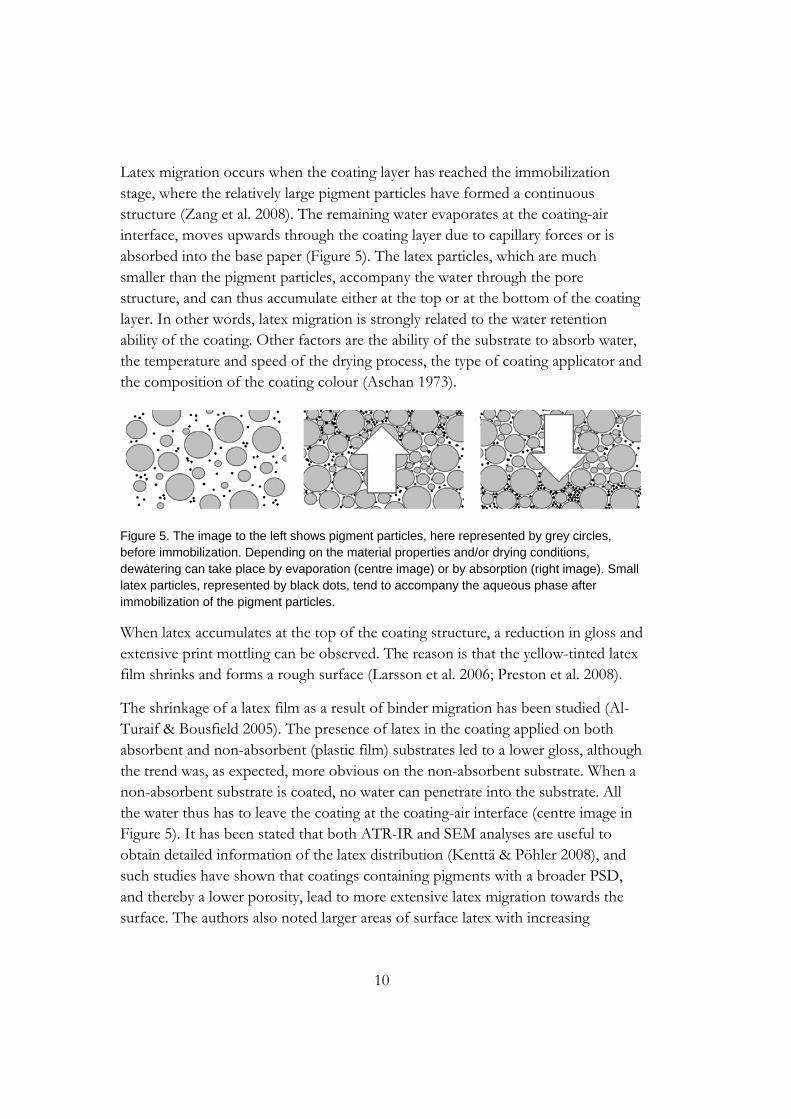
Latex migration occurs when the coating layer has reached the immobilization stage, where the relatively large pigment particles have formed a continuous structure (Zang et al. 2008). The remaining water evaporates at the coating-air interface, moves upwards through the coating layer due to capillary forces or is absorbed into the base paper (Figure 5). The latex particles, which are much smaller than the pigment particles, accompany the water through the pore structure, and can thus accumulate either at the top or at the bottom of the coating layer. In other words, latex migration is strongly related to the water retention ability of the coating. Other factors are the ability of the substrate to absorb water, the temperature and speed of the drying process, the type of coating applicator and the composition of the coating colour (Aschan 1973).
Figure 5. The image to the left shows pigment particles, here represented by grey circles, before immobilization. Depending on the material properties and/or drying conditions, dewatering can take place by evaporation (centre image) or by absorption (right image). Small latex particles, represented by black dots, tend to accompany the aqueous phase after immobilization of the pigment particles.
When latex accumulates at the top of the coating structure, a reduction in gloss and extensive print mottling can be observed. The reason is that the yellow-tinted latex film shrinks and forms a rough surface (Larsson et al. 2006; Preston et al. 2008).
The shrinkage of a latex film as a result of binder migration has been studied (Al-Turaif & Bousfield 2005). The presence of latex in the coating applied on both absorbent and non-absorbent (plastic film) substrates led to a lower gloss, although the trend was, as expected, more obvious on the non-absorbent substrate. When a non-absorbent substrate is coated, no water can penetrate into the substrate. All the water thus has to leave the coating at the coating-air interface (centre image in Figure 5). It has been stated that both ATR-IR and SEM analyses are useful to obtain detailed information of the latex distribution (Kenttä & Pöhler 2008), and such studies have shown that coatings containing pigments with a broader PSD, and thereby a lower porosity, lead to more extensive latex migration towards the surface. The authors also noted larger areas of surface latex with increasing

11
calendering temperature, but this was, as they explained, an effect of spreading of the latex already present at the surface rather than an effect of extended migration from the interior of the coating layer, since the total amount on the surface remained the same.
In the case of thick coating layers, the latex migration is independent of coat weight due to filter cake formation (Zang et al. 2008). At low coat weights, a coating film may be immobilized mainly through water absorption by the base paper, and only a small amount of latex can then migrate to the surface. A heavier coat weight, on the other hand, contains more water ant this allows more extensive migration towards the surface. When a certain amount of latex has migrated to the surface, the filter cake will hinder further particle movement, and a further increase in coat weight will not increase the amount of latex accumulated at the surface.
The amount of latex in a coating recipe, the shape and size of the pigment particles and the properties of the latex itself all affect the amount and the spreading of latex on the coating surface. A high Tg latex has been reported to more effectively fill the spaces between pigment particles and to migrate more freely to the surface than a latex of lower Tg (Kugge 2004; Järnström 2010). A larger amount of latex in the coating colour will generally increase the latex content throughout the z-direction of the coating layer, including the surface, and will thereby affect both the surface energy and the porosity. This will in the end affect the wettability of the coating layer, and thereby the ink behaviour when the surface is printed. A larger amount of latex in a coating layer has been reported to decrease the wettability of the surface (Ström et al. 2008; Aspler et al. 1987).
2.3 Thickeners Thickeners are added to coating colours to adjust the viscosity, but thickeners also act as co-binders and are often added together with latex to achieve both optimal viscosity and binding efficiency. Different amounts or different kinds of thickener can also affect the properties and the appearance of the coated surface, such as its oil resistance and gloss (Dean 1997).
The most commonly used thickeners are either synthetic such as polyvinyl alcohol (PVOH) or organic, such as starch or carboxy methyl cellulose (CMC). The amount and type of thickener are important factors affecting the latex migration (Kugge 2004). Water-soluble thickeners form a gel-like structure in which the small particles are distributed, while synthetic thickeners accumulate around the pigment particles and thus permit latex migration to a greater extent. PVOH has the ability
12
to bind only the water in the region closest to the pigment particles, leaving the rest of the water more or less unchanged. CMC, on the other hand, binds the water more homogeneously and thus enhances the water retention of the coating colour. To obtain a highly concentrated aqueous dispersion, synthetic acrylate ester copolymers are also often used as a thickener in industrial applications.
Some studies, e.g. those of El-Sherbiny & Xiao (2005), have shown that thickener adsorption onto pigments results in a more viscous coating colour. Up to a certain point, this leads to greater fibre coverage and a smoother and more uniform surface. If the viscosity of the slurry is further increased, the application of the coating is more difficult, and as a result the surface structure becomes uneven. El-Sherbiny & Xiao (2005) also concluded that, compared with clay, GCC pigments appear to be less sensitive to the type of thickener due to their limited interaction with the other components.
2.4 Coating techniques Several techniques are used in the industrial coating of paper and board, and the demands for higher quality and faster production speeds mean that both old and new techniques are constantly being developed (Bohnenkamp et al. 2005; Emilsson & Veyre 2009; Kramm & Mair 2010). The coating process can be broken down into three operations: application, metering and drying. Applicator rolls and jet applicators are the two application techniques that are the most common within the paper industry today.
The applicator roll transfers the coating colour from a trough to the substrate. Because of the direct contact with the coating colour, the system is also called a dip coater. A larger backing roll supports the substrate, and the amount of coating colour transferred depends on the distance to the applicator roll. The amount of coating transferred to the substrate is also determined by the viscosity of the coating colour and by the speed of the applicator roll.
A jet applicator, applies the coating colour through a nozzle. The amount of coating colour is in this case controlled by the width of the slot, the jet pressure and the angle of the applicator to the moving paper web.
In both cases, a metering device located after the applicator removes excess coating colour and transfers it back to the re-circulating system. The two most commonly used technologies are blade metering or rod metering. A blade can be either stiff or bent and is typically made of steel or ceramic. A stiff blade is static

13
and does not adapt to the roughness of the paper, whereas a bent blade follows the structure of the substrate and hence creates a smoother surface. However, a bent blade is more likely to cause defects, such as blade scratches, due to wear of the softer blade material. Rod metering has been used for a long time in the paper coating industry. Instead of a blade, a wire-wound rod is used that either is stationary or rotates in the opposite direction to the moving paper web. As with the bent blade, the rod metering produces a smooth coating surface that follows the unevenness of the paper surface. A rod is also less likely to cause a web break when a thin and fragile paper substrate is coated (Dean 1997).
The coated paper is dried by means of air or infrared (IR) dryers, placed near the coating station. However, the coating colour starts to dry immediately after it comes into contact with the substrate, mainly because of water absorption into the paper but also due to evaporation from the surface. To maintain the dimensional and strength properties of the paper, the time for water absorption must be kept as short as possible. IR dryers are more commonly used than air dryers because they remove water more rapidly with greater efficiency. IR radiation heats the water throughout the coating layer and can therefore be used to control the properties of the final coating layer (Fujiwara et al. 1989).
For laboratory purposes, a bench coater is normally used. The coating speed for a bench coater is considerably lower than that used in industrial applications, but the equipment is easy to handle and very suitable for laboratory trials. The bench coater uses a wire-wound rod (Figure 6), much like the rod metering principle described above, which is placed on top of the substrate. The rod is attached to a holder that moves the rod over the substrate at a given speed. The coating colour, which is applied manually in front of the rod, is transferred to the substrate through the gap between the wire and the surface, while the excess coating colour is pushed forwards by the moving rod. To achieve different coat weights, rods with wires of different diameters are available. A broader wire diameter gives a wider gap for the coating colour to pass through, and this result in a thicker layer or a higher coat weight. After the application, the coated substrate can be dried freely under ambient laboratory conditions, by means of an infrared dryer or in an oven for a suitable time.

14
Figure 6. The principle of a bench coater with a wire-wound coating rod. Coating colour is applied in front of the rod, and when the rod moves over the substrate, a well-defined amount of coating colour is applied through the gaps. The thickness of the coating layer is controlled by the diameter of the wire.
2.5 Calendering of coated substrates To increase the gloss and to improve the printability even further, coated materials are often calendered. During calendering, the substrate is compressed between two rolls and this reduces the roughness of the surface. One or both of the rolls can be heated, and a higher temperature or a higher line load increases the compression (Browne et al. 1995; Rättö 2002; Larsson et al. 2007). A negative consequence of this treatment is that the opacity and brightness of the coating layer decrease. The bulk and mechanical properties such as the bending stiffness of the substrate also decrease (Endres & Engström 2005) and for this reason, the calendering is often performed at a lower line load when stiffness is critical, as in the case of paperboard. Studies have shown that the effects of calendering, such as an increase in gloss and a decrease in roughness, are influenced more by the temperature than by the line load (Rounsley 1991; Park & Lee 2006). A certain deformation can be reached at a lower line load if a higher calendering temperature is used (Rättö & Rigdahl 2001). Raising the temperature from 56 to 200 °C led to an increase in gloss and a decrease in roughness.
The contact in the calender nip, i.e. the contact between two cylinders with parallel axes, can be described using Hertz contact theory:
2/1
effLR
FEp
[1]
where p is the maximum pressure, E is the elasticity modulus of the cylinders, F is the applied force, L is the cylinder length and Reff is the effective radius, which is a relationship between the radii of the two cylinders.
Calendering is usually performed using either a soft nip or a hard nip. A soft nip uses one steel roll and one polymer-coated roll. The polymer roll adapts to the
15
local thickness variations of the paper, such as fibre flocs, and the pressure then becomes more evenly distributed. A hard nip uses two steel rolls which not only increases the total compression but also deforms the paper unevenly because of local thickness and bulk density variations.
The calendering speed also affects the result. A study using calendering speeds from 500 to 2200 m/min showed that, when the calender speed was increased, the roughness increased and the gloss decreased (Lamminmäki et al. 2005).
2.6 Surface structure and topography A surface is a well-defined two-dimensional boundary between two media, for example a solid material and air. When a paper surface is observed it appears to have a very smooth and flat surface, but in close up it is rough with numerous “peaks” and “valleys”. The surface roughness can be divided into three categories according to size: optical roughness on a length scale < 1 µm, macro-roughness on a length scale > 0.1 mm and micro-roughness at 1 – 100 µm (Niskanen 1998). In the case of coated papers, pigment surfaces form the optical roughness while the pigment shape creates the micro-roughness. In general, roughness on a scale close to or less than the wavelength of light is often regarded as micro-roughness. Macro-roughness is mostly associated with the fibre structure in the paper substrate. This range of structures describes an almost fractal pattern, and on a small scale the surface of a coating layer can be regarded as being infinitely large. However, in the paper and coating industry, the optical roughness and sometimes also the micro-roughness are on too small a scale when the surface roughness is to be determined.
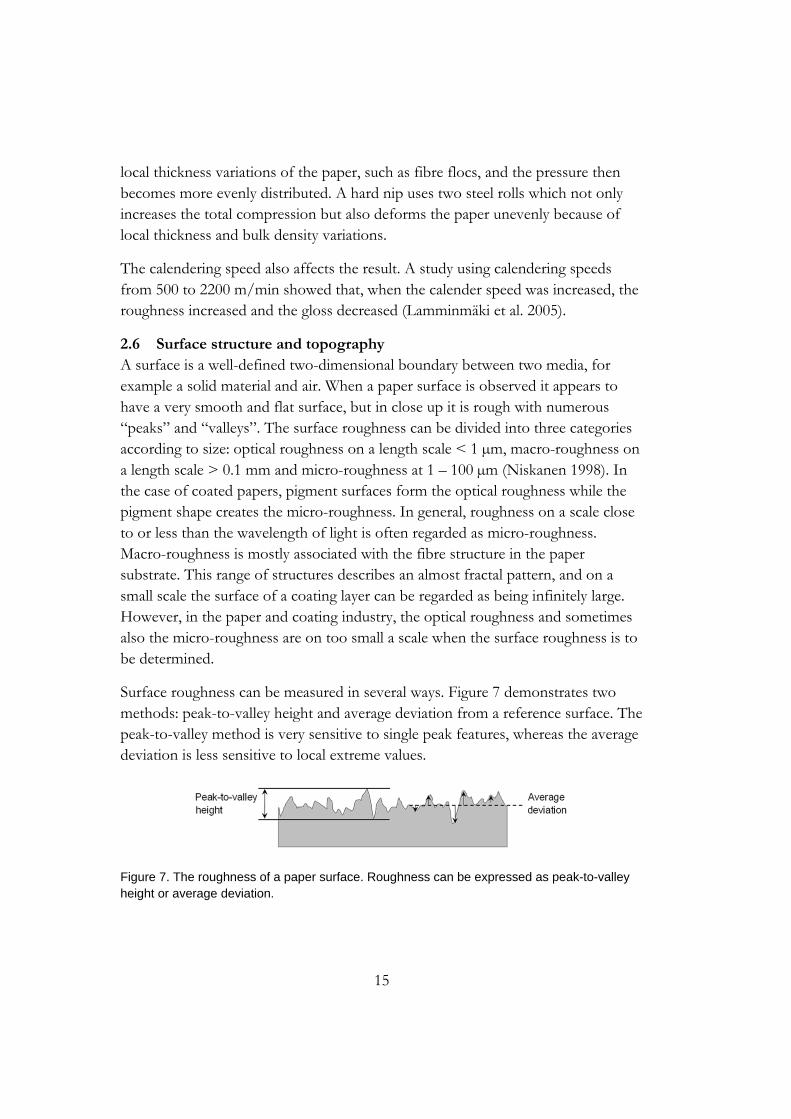
Surface roughness can be measured in several ways. Figure 7 demonstrates two methods: peak-to-valley height and average deviation from a reference surface. The peak-to-valley method is very sensitive to single peak features, whereas the average deviation is less sensitive to local extreme values.
Figure 7. The roughness of a paper surface. Roughness can be expressed as peak-to-valley height or average deviation.
16
A quick and common way to measure the surface roughness is by an indirect air- leak method such as the Parker Print Surf (PPS) method. A measuring head is pressed against the paper sample, and the rate of flow of air that is forced through the space between the sample and the measuring head is recorded. This means that the air flow decreases with decreasing roughness. The PPS method recalculates the air flow to an average roughness value expressed in µm.
2.7 Surface chemistry and surface energy The surface chemistry of a paper is an important but complex issue that affects strength, optical properties and printability. A coating colour, with its blend of minerals, dissolved polymers and other particles, requires ideal flow properties when it is applied to the paper. The amounts of the various ingredients must therefore be adapted to give the coating colour optimum rheological properties. At the same time these ingredients also determine the surface chemistry of the dry coating layer, and it is therefore important to find a suitable balance between the coating rheology during application and the surface chemistry of the resulting product.
The surface chemistry of each of the coating components, and their proportions on the top of the coating layer, determine the surface energy of the coating. An ideal coating layer should be chemically homogeneous so that the ink behaves in the same manner regardless of the surface area on which it is applied. However, due to inhomogeneous spreading of for example a latex binder in a GCC-based coating layer, local variations in surface energy have often been reported (Aspler et al. 1987; Kenttä et al. 2006; Ström et al. 2008).
The surface energy, defined from a material physics point of view as the energy required to bring one atom from the bulk of the material to the surface, in vacuum, strongly affects the degree of wetting (wettability) of a surface. A drop of liquid placed on a surface can ether stay roughly sphere-shaped when the wettability is low, or spread out over and into the surface if the wettability is high (Young 1805). The contact angle of a liquid is therefore often used to determine the wettability, and thereby the surface energy, of a solid surface. The contact angle is defined as the angle formed between the plane of the solid surface and the tangent to the droplet at the point of contact, and is generally taken from the inside of the droplet. A high contact angle indicates low wettability, and a low contact angle is obtained when the droplet spreads on the surface and the wettability is high.
17
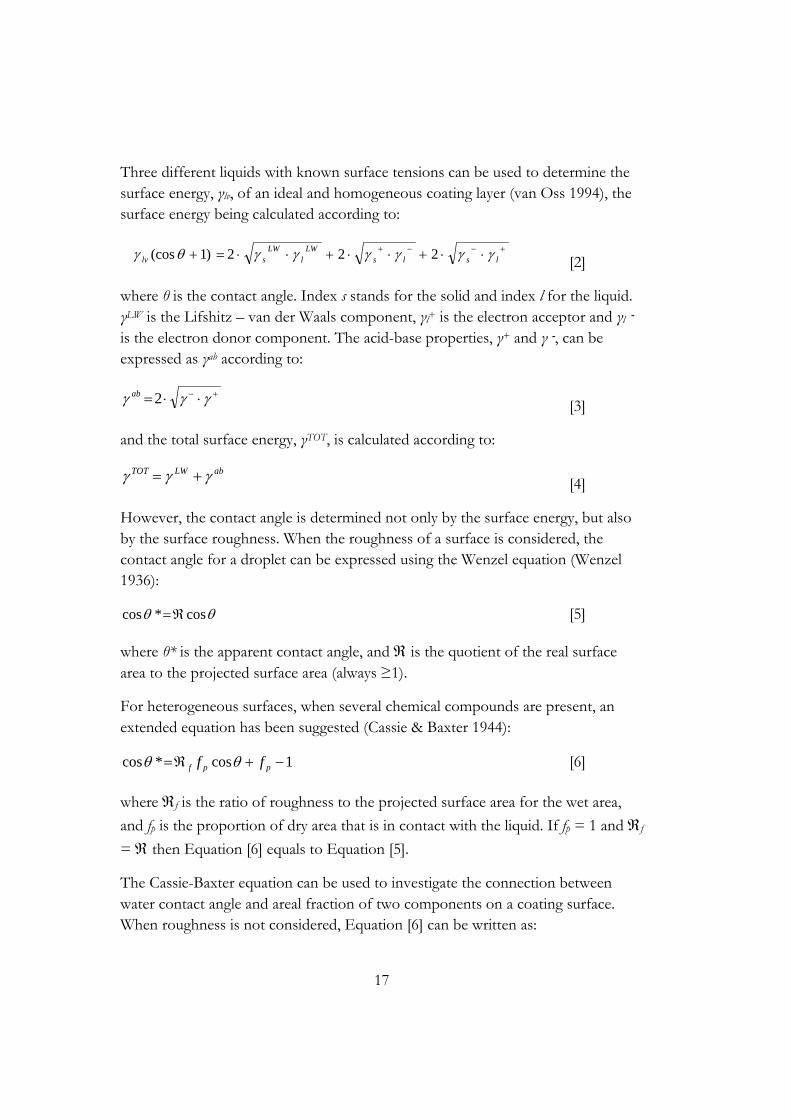
Three different liquids with known surface tensions can be used to determine the surface energy, γlv, of an ideal and homogeneous coating layer (van Oss 1994), the surface energy being calculated according to:
lslsLW
lLW
slv 222)1(cos [2]
where θ is the contact angle. Index s stands for the solid and index l for the liquid. γLW is the Lifshitz – van der Waals component, γl+ is the electron acceptor and γl - is the electron donor component. The acid-base properties, γ+ and γ -, can be expressed as γab according to:
2ab
[3]
and the total surface energy, γTOT, is calculated according to:
abLWTOT [4]
However, the contact angle is determined not only by the surface energy, but also by the surface roughness. When the roughness of a surface is considered, the contact angle for a droplet can be expressed using the Wenzel equation (Wenzel 1936):
cos*cos [5]
where θ* is the apparent contact angle, and is the quotient of the real surface area to the projected surface area (always ≥1).
For heterogeneous surfaces, when several chemical compounds are present, an extended equation has been suggested (Cassie & Baxter 1944):
1cos*cos ppf ff [6]
where f is the ratio of roughness to the projected surface area for the wet area,
and fp is the proportion of dry area that is in contact with the liquid. If fp = 1 and f
= then Equation [6] equals to Equation [5].
The Cassie-Baxter equation can be used to investigate the connection between water contact angle and areal fraction of two components on a coating surface. When roughness is not considered, Equation [6] can be written as:
18
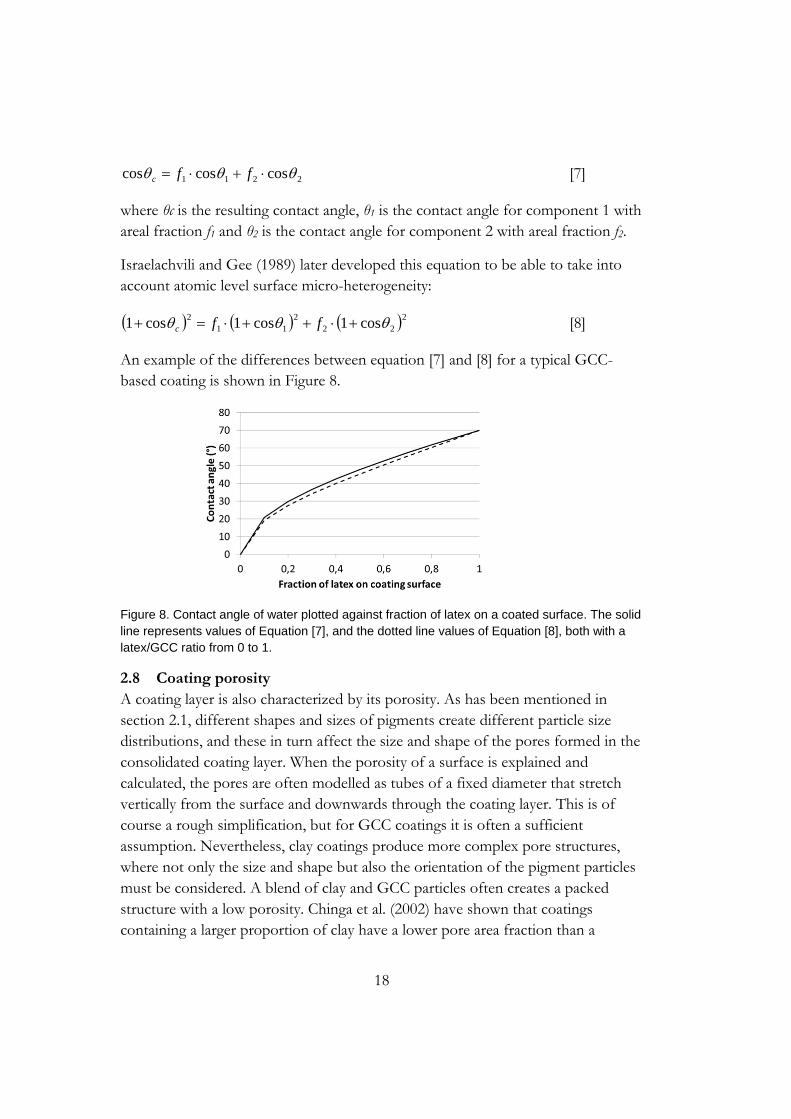
2211 coscoscos ffc [7]
where θc is the resulting contact angle, θ1 is the contact angle for component 1 with areal fraction f1 and θ2 is the contact angle for component 2 with areal fraction f2.
Israelachvili and Gee (1989) later developed this equation to be able to take into account atomic level surface micro-heterogeneity:
222
211
2 cos1cos1cos1 ffc [8]
An example of the differences between equation [7] and [8] for a typical GCC-based coating is shown in Figure 8.
Figure 8. Contact angle of water plotted against fraction of latex on a coated surface. The solid line represents values of Equation [7], and the dotted line values of Equation [8], both with a latex/GCC ratio from 0 to 1.
2.8 Coating porosity A coating layer is also characterized by its porosity. As has been mentioned in section 2.1, different shapes and sizes of pigments create different particle size distributions, and these in turn affect the size and shape of the pores formed in the consolidated coating layer. When the porosity of a surface is explained and calculated, the pores are often modelled as tubes of a fixed diameter that stretch vertically from the surface and downwards through the coating layer. This is of course a rough simplification, but for GCC coatings it is often a sufficient assumption. Nevertheless, clay coatings produce more complex pore structures, where not only the size and shape but also the orientation of the pigment particles must be considered. A blend of clay and GCC particles often creates a packed structure with a low porosity. Chinga et al. (2002) have shown that coatings containing a larger proportion of clay have a lower pore area fraction than a
19
coating containing less clay. It was also shown that a coating layer containing either a high or a low proportion of clay had a more compressed structure at the surface than inside the coating.
It has been shown that calendering can lead to smaller pore openings, or so-called closed areas, on the surface of coated paper (Chinga & Helle 2003). The lack of these closed areas on uncalendered surfaces indicates that they were not caused by drying or any other treatment. These areas have been found in low coat weight regions and are characterized by local variations in smoothness and gloss (Xiang et al. 2000). It has been suggested that the local variations may be caused by a higher binder content, but other studies have found no such differences (Xiang et al. 2000). A correlation between the size of the closed areas and print mottle has been suggested (Chinga & Helle 2003).
Polarized light reflectometry and its application in the study of paper coating structure and optical properties have been described in detail by Elton & Preston (2006b). It is a fast measurement process that produces a large amount of data including micro-roughness, macro-roughness, surface porosity, refractive index and gloss. All the information is obtained from a single, non-destructive, measurement taking about 0.5 seconds.
Elton & Preston (2006a) presented results from measurements using polarized light reflectometry. They found the analysis of the effective refractive index to be an indirect method for determining pore size within a coating layer, although the data for pore volume was more scattered than for pore diameter. They also found a good correlation between the micro-roughness of a GCC coating and the effective refractive index, indicating the importance of pigment packing at the surface. Measurements were made on calendered paper sheets to probe the changes in surface topography, and it was found that the first few nips decreased the macro-roughness due to smoothing of the base paper. Further nips did not affect the base paper, but the gloss increased due to a decrease in micro-roughness in the pigment coating.
20
3 Printing Printing is a process for the mass reproduction of text or images by means of a printing press. Several printing techniques are in use. The oldest is the letterpress technique, from which all modern printing processes have developed. Letterpress uses a relief pattern, a mirror image of the intended image where ink is positioned. When the pattern is pressed against a paper sheet, an image is produced and this can be repeated numerous times. Although Johann Gutenberg is said in western society to have invented the letter press in the middle of the 15th century, simple printing techniques were used in Asia already about 1000 years earlier.
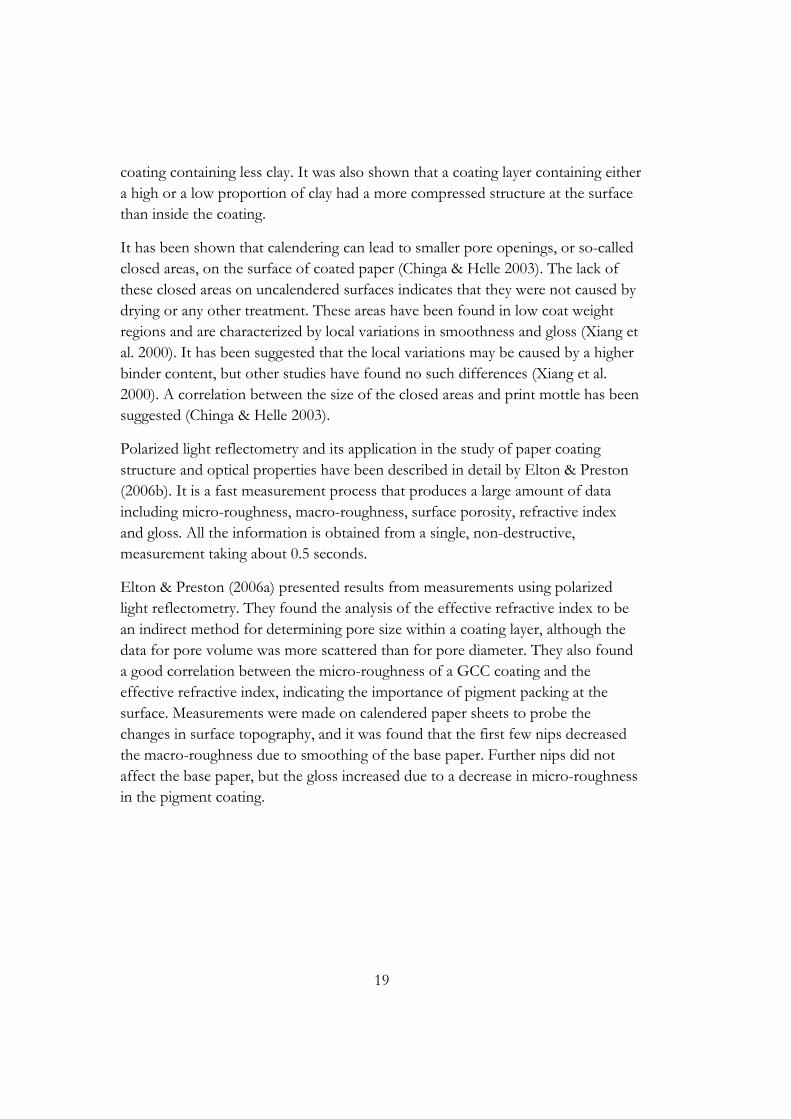
As in the case of paper surfaces and coating layers, printed areas both absorb and scatter light. However, compared to white surfaces, the light scattering is low due to a more homogeneous refractive index, and the light absorption is high. The function of a printed surface is to absorb light of certain wavelengths and to reflect only the desired colour. The absorbed energy may however cause chemical reactions leading to colour changes and fading.
Figure 9. Behaviour of light in and around a printed area.
Because of the low amount of scattering in the printed areas, the light travels relatively un-scattered through the ink and is scattered when it hits the substrate below. Light that is reflected from layers in the print or from the substrate underneath will consist only of the wavelengths that are not absorbed and hence the printed area is perceived to have the desired colour (Figure 9). However, light scattering occurs in all directions, and light that is scattered sideways, beneath the print is lost and this creates a “shadow”, making even the finest printed dot look out of focus. The effect is called optical dot gain, a phenomenon further discussed in section 3.5.3 (Laden 1997; Oittinen & Saarelma 1998; Kippham 2001).
3.1 Flexography Letterpress was the dominating printing technique for centuries until other methods, mainly lithographic offset printing, were developed. Like the old

21
movable type, the letterpress uses relief printing elements, but the image that is to be printed is nowadays made out of a single metal plate. The plate is attached to a cylinder in the printing press, the ink is distributed to the printing plate via a system of rollers, and the substrate is printed when it passes between the printing plate and an impression cylinder. Letterpress using hard printing plates is still in use today, but mainly for products that do not require a high print quality, as for example paperback books and telephone catalogues.
Like letterpress, flexography is a relief process, but the plate is made of photopolymer or rubber to give a flexible contact with the substrate, which makes it possible to print rough and uneven surfaces. The principle of the flexographic printing process is shown in Figure 10. From the ink reservoir, the ink is picked up by the anilox roll which is engraved with a pattern of cells that controls the amount of ink needed for a certain plate or print quality. A doctor blade scrapes off the surplus, and the remaining ink is then transferred to the plate cylinder.
Figure 10. The principle of flexography. The ink is picked up by the anilox roller where a doctor blade removes the surplus. The ink is then evenly distributed to the raised region on the plate and finally to the paper.
Apart from rough surfaces, such as corrugated paperboard, flexography can be used to print on a broad spectrum of substrates such as plastic, metallic films and paper, and the technique is often used in the packaging industry. One of the weaknesses of flexography is the increasing cost for the production of plates as the technique evolves.
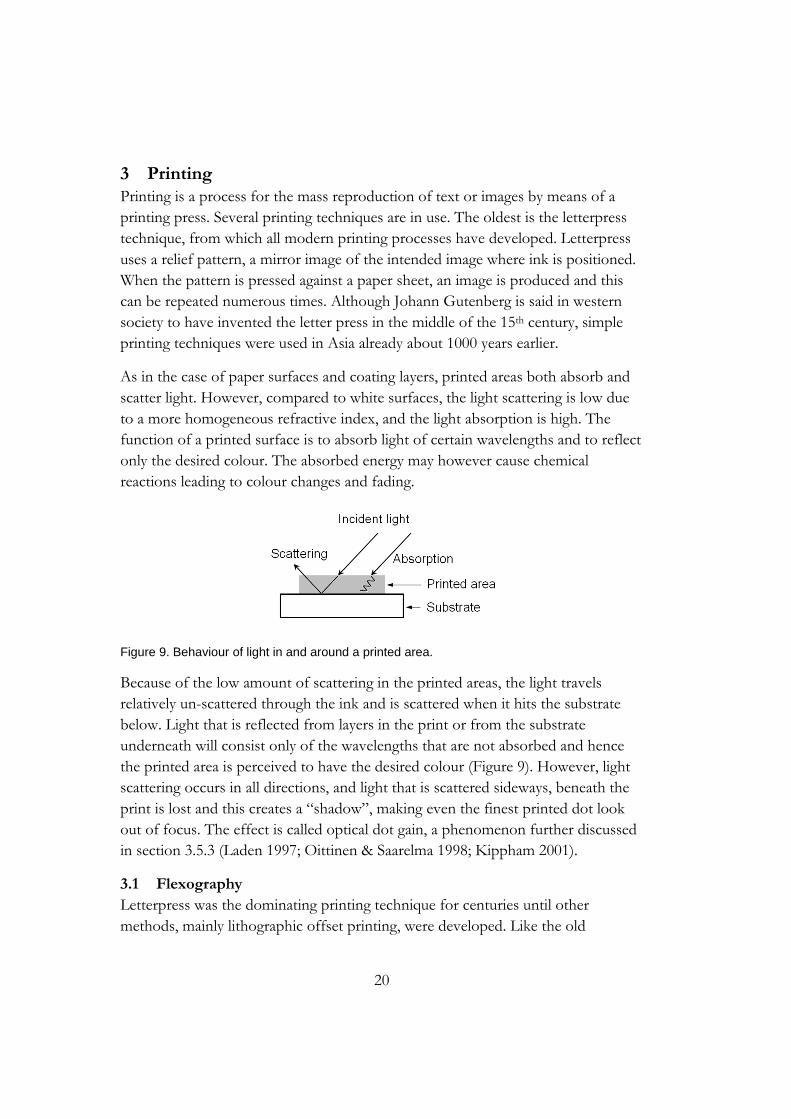
3.2 Printing plates The first flexographic printing plates were made of rubber. Even though some rubber plates are still in use, the most common plates these days are made of photopolymer. Figure 11 shows a flexographic printing plate viewed from the side. The jagged surface represents the relief pattern, and the raised parts, the face,
22
forms the image area. The relief depth varies between plates, but is typically about 0.4 mm. The total plate thickness is usually 3 – 6 mm, but the trend is towards thinner plates.
Figure 11. The parts of a flexographic printing plate.
As the name implies, photopolymer plates are made of light-sensitive polymers. The polymers are soluble in organic solvents, but on exposure to ultra violet (UV) radiation, a cross-linking of the polymers takes place and makes the exposed areas insoluble.
The hardness of a printing plate can be varied depending on the substrate properties. This parameter is commonly measured by means of a Shore hardness tester. A needle is pressed against the printing plate and the deformation of the material is measured. The unit for hardness is expressed as ° Shore A, and the value increases with increasing plate hardness (Kipphan 2001). It has been shown that a soft printing plate of 64° Shore A transferred more ink to the substrate and produced prints of higher print density and less dot gain than a harder printing plate of 75° Shore A (Bohan et al. 2000; Johnson et al. 2003; Bould et al. 2011).
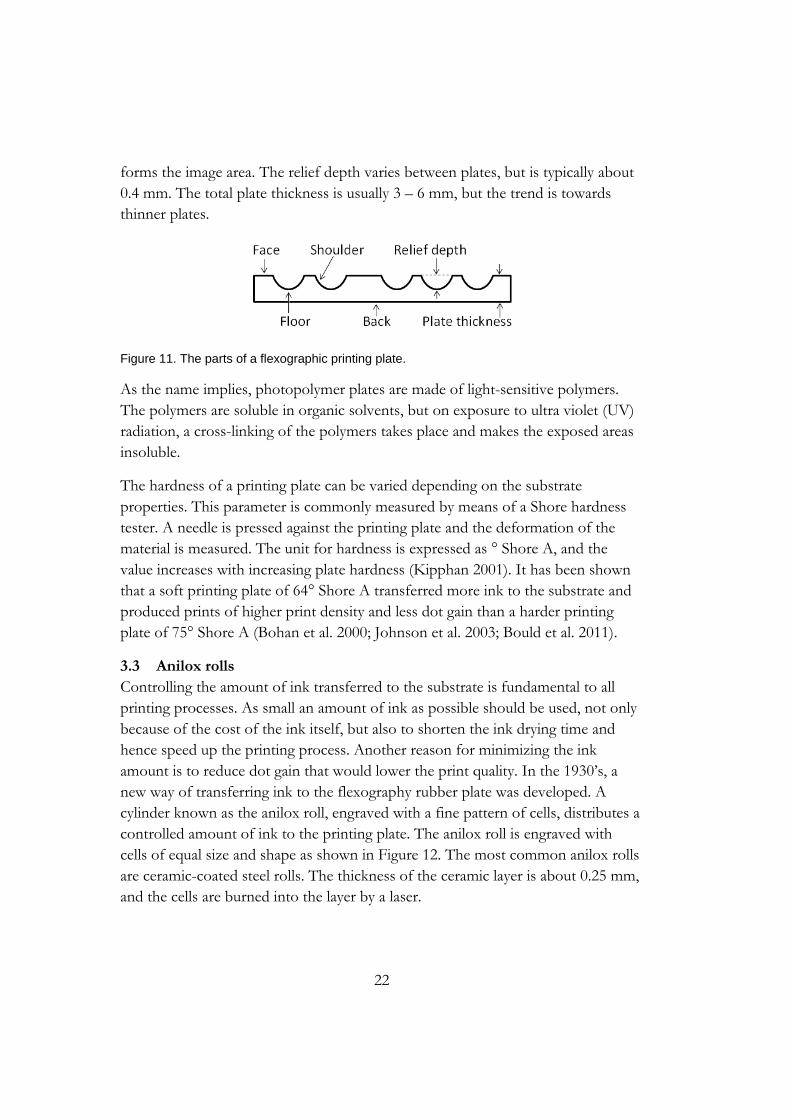
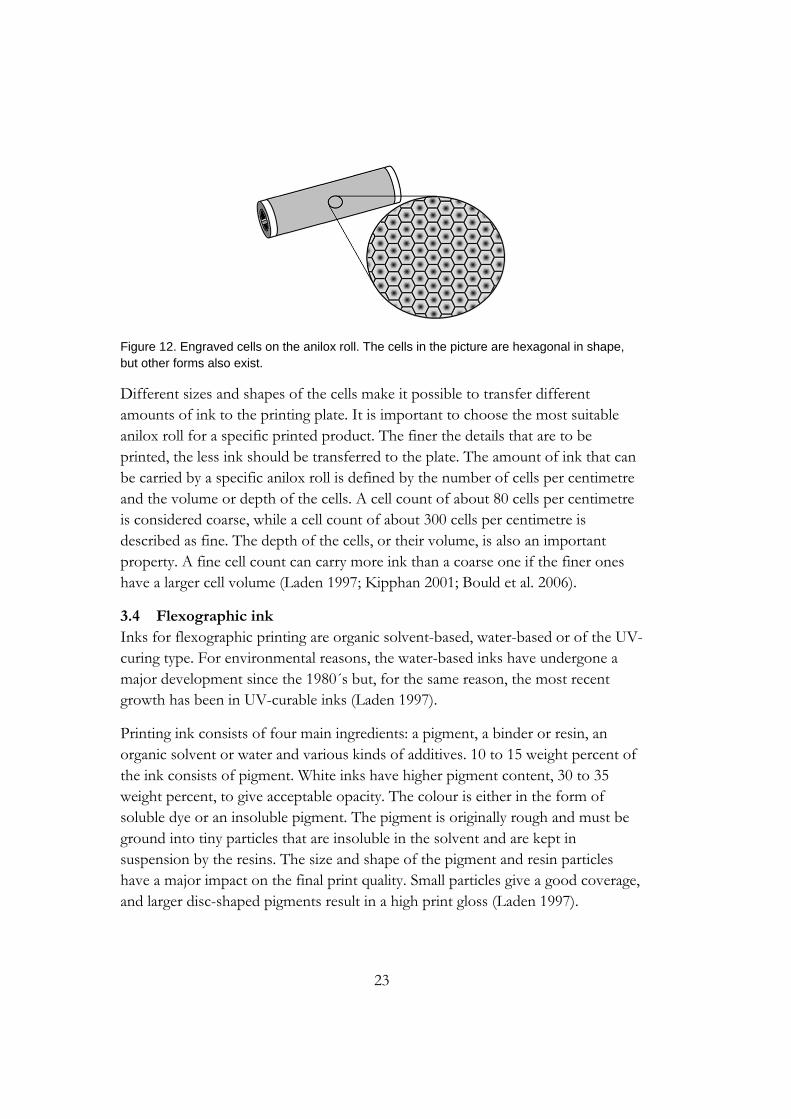
3.3 Anilox rolls Controlling the amount of ink transferred to the substrate is fundamental to all printing processes. As small an amount of ink as possible should be used, not only because of the cost of the ink itself, but also to shorten the ink drying time and hence speed up the printing process. Another reason for minimizing the ink amount is to reduce dot gain that would lower the print quality. In the 1930’s, a new way of transferring ink to the flexography rubber plate was developed. A cylinder known as the anilox roll, engraved with a fine pattern of cells, distributes a controlled amount of ink to the printing plate. The anilox roll is engraved with cells of equal size and shape as shown in Figure 12. The most common anilox rolls are ceramic-coated steel rolls. The thickness of the ceramic layer is about 0.25 mm, and the cells are burned into the layer by a laser.
23
Figure 12. Engraved cells on the anilox roll. The cells in the picture are hexagonal in shape, but other forms also exist.
Different sizes and shapes of the cells make it possible to transfer different amounts of ink to the printing plate. It is important to choose the most suitable anilox roll for a specific printed product. The finer the details that are to be printed, the less ink should be transferred to the plate. The amount of ink that can be carried by a specific anilox roll is defined by the number of cells per centimetre and the volume or depth of the cells. A cell count of about 80 cells per centimetre is considered coarse, while a cell count of about 300 cells per centimetre is described as fine. The depth of the cells, or their volume, is also an important property. A fine cell count can carry more ink than a coarse one if the finer ones have a larger cell volume (Laden 1997; Kipphan 2001; Bould et al. 2006).
3.4 Flexographic ink Inks for flexographic printing are organic solvent-based, water-based or of the UV-curing type. For environmental reasons, the water-based inks have undergone a major development since the 1980´s but, for the same reason, the most recent growth has been in UV-curable inks (Laden 1997).
Printing ink consists of four main ingredients: a pigment, a binder or resin, an organic solvent or water and various kinds of additives. 10 to 15 weight percent of the ink consists of pigment. White inks have higher pigment content, 30 to 35 weight percent, to give acceptable opacity. The colour is either in the form of soluble dye or an insoluble pigment. The pigment is originally rough and must be ground into tiny particles that are insoluble in the solvent and are kept in suspension by the resins. The size and shape of the pigment and resin particles have a major impact on the final print quality. Small particles give a good coverage, and larger disc-shaped pigments result in a high print gloss (Laden 1997).
24
As mentioned above, one of the functions of the resin is to keep the pigment suspended in the solvent, but the resin is also important for the solvent retention, and thus the final optical properties, of the print. The resin attaches the pigment to the substrate and represents 10 to 20 weight percent of the ink. The resins must be soluble in the solvent, and are therefore selected on the basis of their solubility in the solvent in question. In water-based inks, the resin is typically acrylic solution polymer and acrylic emulsion. The resins must totally cover the pigment particles to suspend them in the fluid. When the ink is transferred to the substrate, the solvent evaporates or is absorbed by the substrate, and the resins starts to create inter-molecular chains and finally form a cross-linked network (Laden 1997; Kipphan 2001).
About 60 to 70 weight percent of the ink consists of solvent. Alcohols are conventionally used as solvents in solvent-based inks. A small amount of an alcohol is sometimes added to a water-based ink to speed up the drying. To control the drying rate, propylene glycol is used in both water-based and solvent based inks. The drying rate of the ink strongly affects the ink setting and the print quality, and it is therefore important to optimize the inks with respect to the substrate to be printed on. The ink viscosity is controlled by the amount and nature of the solvent. The viscosity affects the ink transfer from the anilox roll to the printing plate and to the substrate, as well as the flow through the chamber system.
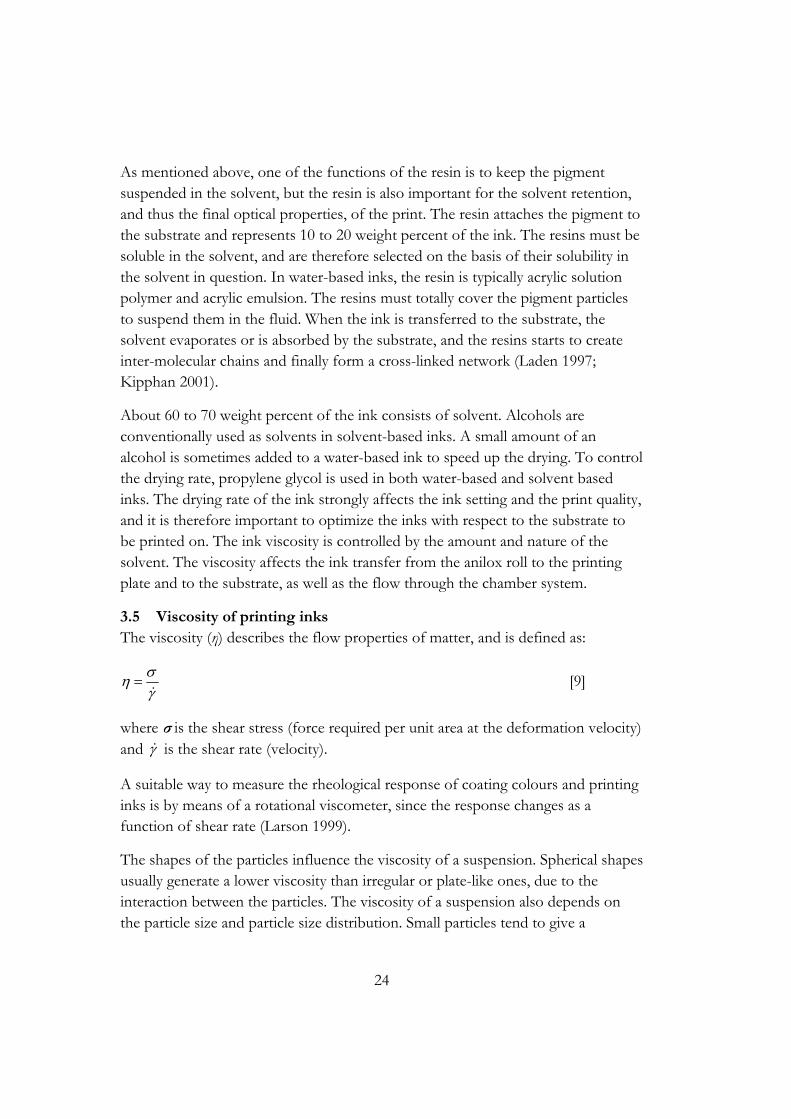
3.5 Viscosity of printing inks The viscosity (η) describes the flow properties of matter, and is defined as:
[9]
where σ is the shear stress (force required per unit area at the deformation velocity) and is the shear rate (velocity).
A suitable way to measure the rheological response of coating colours and printing inks is by means of a rotational viscometer, since the response changes as a function of shear rate (Larson 1999).
The shapes of the particles influence the viscosity of a suspension. Spherical shapes usually generate a lower viscosity than irregular or plate-like ones, due to the interaction between the particles. The viscosity of a suspension also depends on the particle size and particle size distribution. Small particles tend to give a
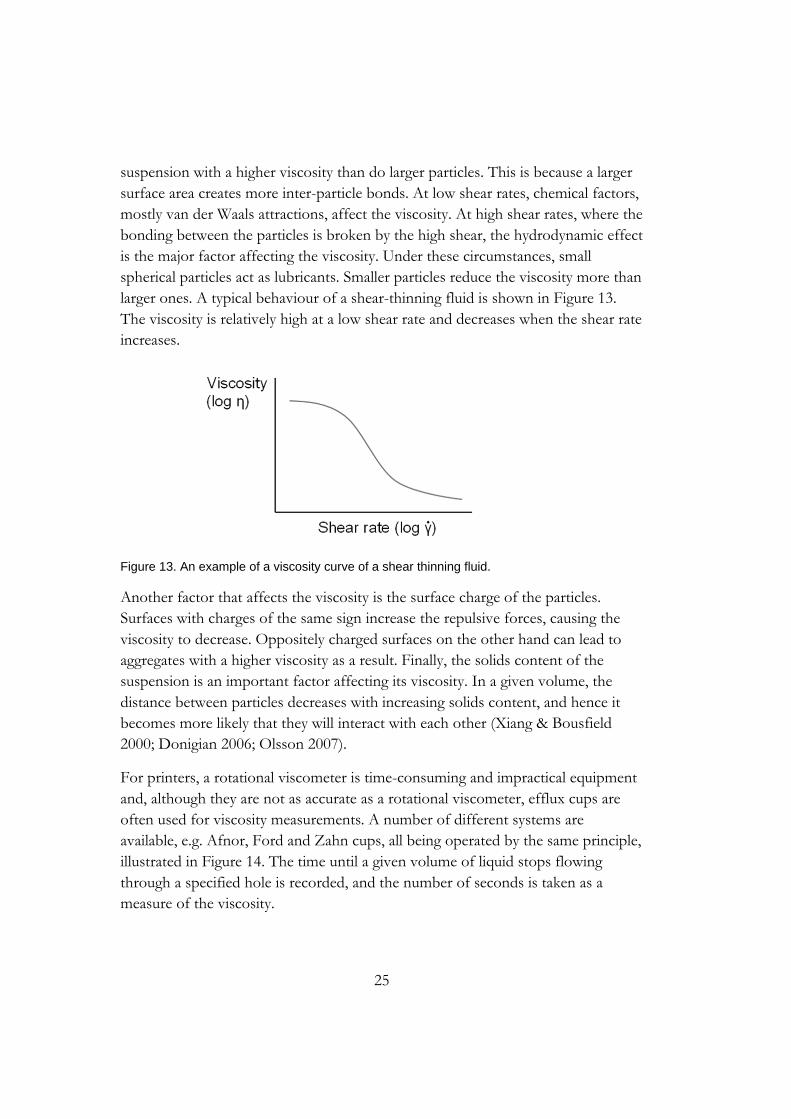
25
suspension with a higher viscosity than do larger particles. This is because a larger surface area creates more inter-particle bonds. At low shear rates, chemical factors, mostly van der Waals attractions, affect the viscosity. At high shear rates, where the bonding between the particles is broken by the high shear, the hydrodynamic effect is the major factor affecting the viscosity. Under these circumstances, small spherical particles act as lubricants. Smaller particles reduce the viscosity more than larger ones. A typical behaviour of a shear-thinning fluid is shown in Figure 13. The viscosity is relatively high at a low shear rate and decreases when the shear rate increases.
Figure 13. An example of a viscosity curve of a shear thinning fluid.
Another factor that affects the viscosity is the surface charge of the particles. Surfaces with charges of the same sign increase the repulsive forces, causing the viscosity to decrease. Oppositely charged surfaces on the other hand can lead to aggregates with a higher viscosity as a result. Finally, the solids content of the suspension is an important factor affecting its viscosity. In a given volume, the distance between particles decreases with increasing solids content, and hence it becomes more likely that they will interact with each other (Xiang & Bousfield 2000; Donigian 2006; Olsson 2007).
For printers, a rotational viscometer is time-consuming and impractical equipment and, although they are not as accurate as a rotational viscometer, efflux cups are often used for viscosity measurements. A number of different systems are available, e.g. Afnor, Ford and Zahn cups, all being operated by the same principle, illustrated in Figure 14. The time until a given volume of liquid stops flowing through a specified hole is recorded, and the number of seconds is taken as a measure of the viscosity.
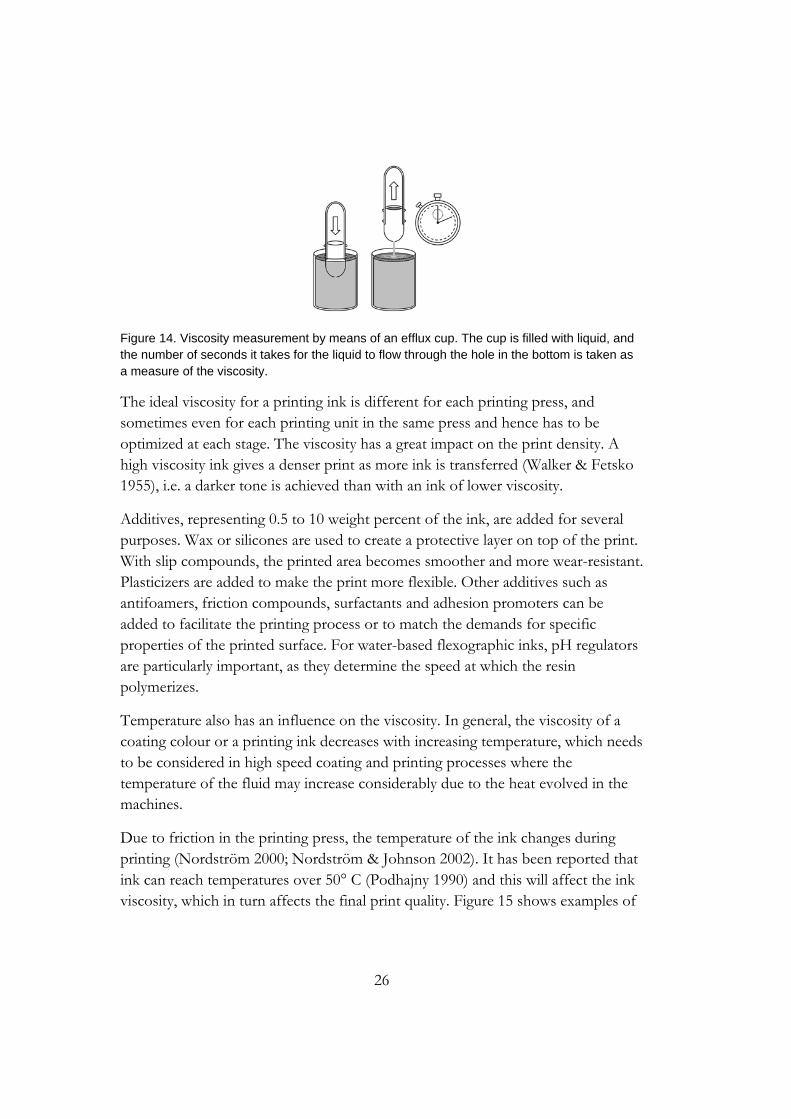
26
Figure 14. Viscosity measurement by means of an efflux cup. The cup is filled with liquid, and the number of seconds it takes for the liquid to flow through the hole in the bottom is taken as a measure of the viscosity.
The ideal viscosity for a printing ink is different for each printing press, and sometimes even for each printing unit in the same press and hence has to be optimized at each stage. The viscosity has a great impact on the print density. A high viscosity ink gives a denser print as more ink is transferred (Walker & Fetsko 1955), i.e. a darker tone is achieved than with an ink of lower viscosity.
Additives, representing 0.5 to 10 weight percent of the ink, are added for several purposes. Wax or silicones are used to create a protective layer on top of the print. With slip compounds, the printed area becomes smoother and more wear-resistant. Plasticizers are added to make the print more flexible. Other additives such as antifoamers, friction compounds, surfactants and adhesion promoters can be added to facilitate the printing process or to match the demands for specific properties of the printed surface. For water-based flexographic inks, pH regulators are particularly important, as they determine the speed at which the resin polymerizes.
Temperature also has an influence on the viscosity. In general, the viscosity of a coating colour or a printing ink decreases with increasing temperature, which needs to be considered in high speed coating and printing processes where the temperature of the fluid may increase considerably due to the heat evolved in the machines.
Due to friction in the printing press, the temperature of the ink changes during printing (Nordström 2000; Nordström & Johnson 2002). It has been reported that ink can reach temperatures over 50° C (Podhajny 1990) and this will affect the ink viscosity, which in turn affects the final print quality. Figure 15 shows examples of
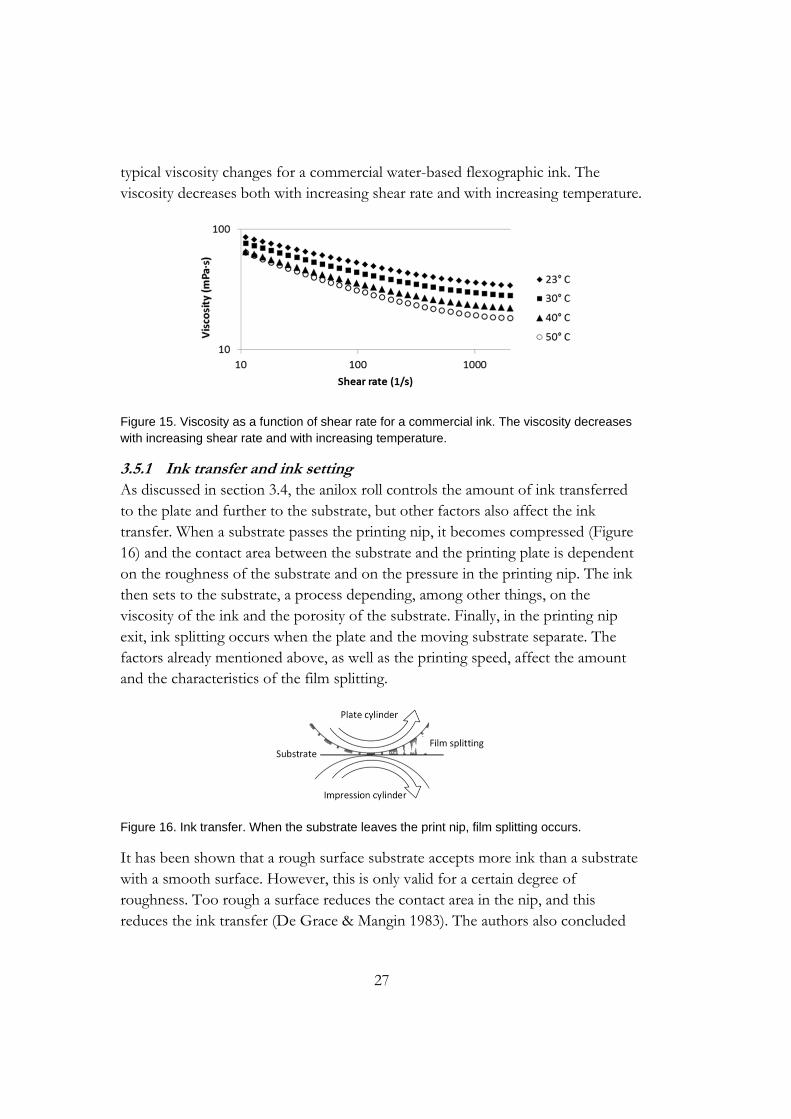
27
typical viscosity changes for a commercial water-based flexographic ink. The viscosity decreases both with increasing shear rate and with increasing temperature.
Figure 15. Viscosity as a function of shear rate for a commercial ink. The viscosity decreases with increasing shear rate and with increasing temperature.
3.5.1 Ink transfer and ink setting As discussed in section 3.4, the anilox roll controls the amount of ink transferred to the plate and further to the substrate, but other factors also affect the ink transfer. When a substrate passes the printing nip, it becomes compressed (Figure 16) and the contact area between the substrate and the printing plate is dependent on the roughness of the substrate and on the pressure in the printing nip. The ink then sets to the substrate, a process depending, among other things, on the viscosity of the ink and the porosity of the substrate. Finally, in the printing nip exit, ink splitting occurs when the plate and the moving substrate separate. The factors already mentioned above, as well as the printing speed, affect the amount and the characteristics of the film splitting.
Figure 16. Ink transfer. When the substrate leaves the print nip, film splitting occurs.
It has been shown that a rough surface substrate accepts more ink than a substrate with a smooth surface. However, this is only valid for a certain degree of roughness. Too rough a surface reduces the contact area in the nip, and this reduces the ink transfer (De Grace & Mangin 1983). The authors also concluded
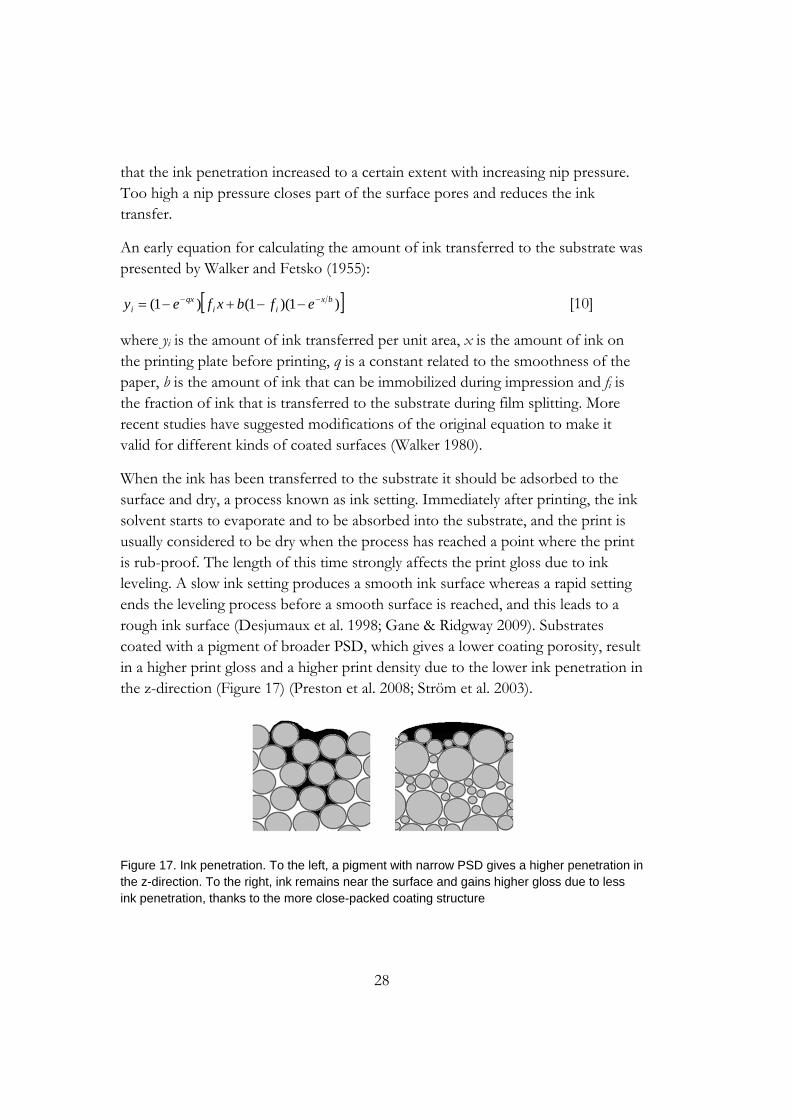
28
that the ink penetration increased to a certain extent with increasing nip pressure. Too high a nip pressure closes part of the surface pores and reduces the ink transfer.
An early equation for calculating the amount of ink transferred to the substrate was presented by Walker and Fetsko (1955):
)1)(1()1( bxii
qxi efbxfey [10]
where yi is the amount of ink transferred per unit area, x is the amount of ink on the printing plate before printing, q is a constant related to the smoothness of the paper, b is the amount of ink that can be immobilized during impression and fi is the fraction of ink that is transferred to the substrate during film splitting. More recent studies have suggested modifications of the original equation to make it valid for different kinds of coated surfaces (Walker 1980).
When the ink has been transferred to the substrate it should be adsorbed to the surface and dry, a process known as ink setting. Immediately after printing, the ink solvent starts to evaporate and to be absorbed into the substrate, and the print is usually considered to be dry when the process has reached a point where the print is rub-proof. The length of this time strongly affects the print gloss due to ink leveling. A slow ink setting produces a smooth ink surface whereas a rapid setting ends the leveling process before a smooth surface is reached, and this leads to a rough ink surface (Desjumaux et al. 1998; Gane & Ridgway 2009). Substrates coated with a pigment of broader PSD, which gives a lower coating porosity, result in a higher print gloss and a higher print density due to the lower ink penetration in the z-direction (Figure 17) (Preston et al. 2008; Ström et al. 2003).
Figure 17. Ink penetration. To the left, a pigment with narrow PSD gives a higher penetration in the z-direction. To the right, ink remains near the surface and gains higher gloss due to less ink penetration, thanks to the more close-packed coating structure
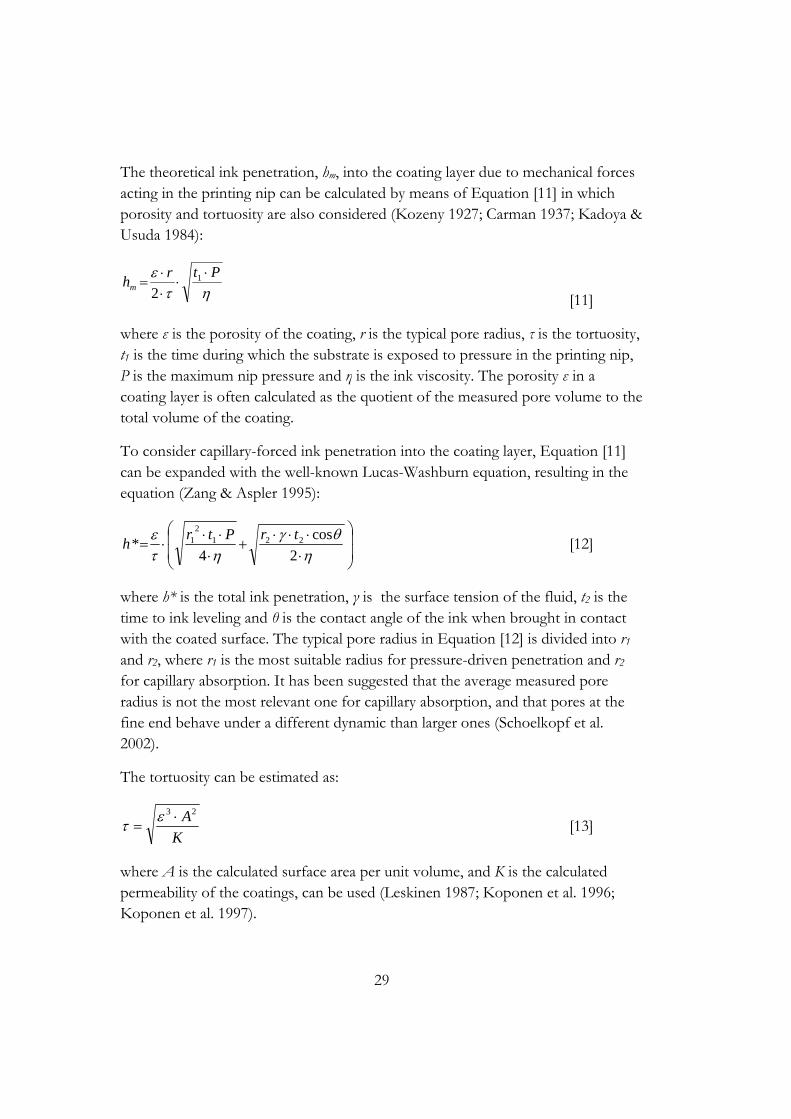
29
The theoretical ink penetration, hm, into the coating layer due to mechanical forces acting in the printing nip can be calculated by means of Equation [11] in which porosity and tortuosity are also considered (Kozeny 1927; Carman 1937; Kadoya & Usuda 1984):
Ptr
hm
1
2 [11]
where ε is the porosity of the coating, r is the typical pore radius, τ is the tortuosity, t1 is the time during which the substrate is exposed to pressure in the printing nip, P is the maximum nip pressure and η is the ink viscosity. The porosity ε in a coating layer is often calculated as the quotient of the measured pore volume to the total volume of the coating.
To consider capillary-forced ink penetration into the coating layer, Equation [11] can be expanded with the well-known Lucas-Washburn equation, resulting in the equation (Zang & Aspler 1995):
2
cos
4* 221
21 trPtr
h [12]
where h* is the total ink penetration, γ is the surface tension of the fluid, t2 is the time to ink leveling and θ is the contact angle of the ink when brought in contact with the coated surface. The typical pore radius in Equation [12] is divided into r1 and r2, where r1 is the most suitable radius for pressure-driven penetration and r2 for capillary absorption. It has been suggested that the average measured pore radius is not the most relevant one for capillary absorption, and that pores at the fine end behave under a different dynamic than larger ones (Schoelkopf et al. 2002).
The tortuosity can be estimated as:
K
A23
[13]
where A is the calculated surface area per unit volume, and K is the calculated permeability of the coatings, can be used (Leskinen 1987; Koponen et al. 1996; Koponen et al. 1997).
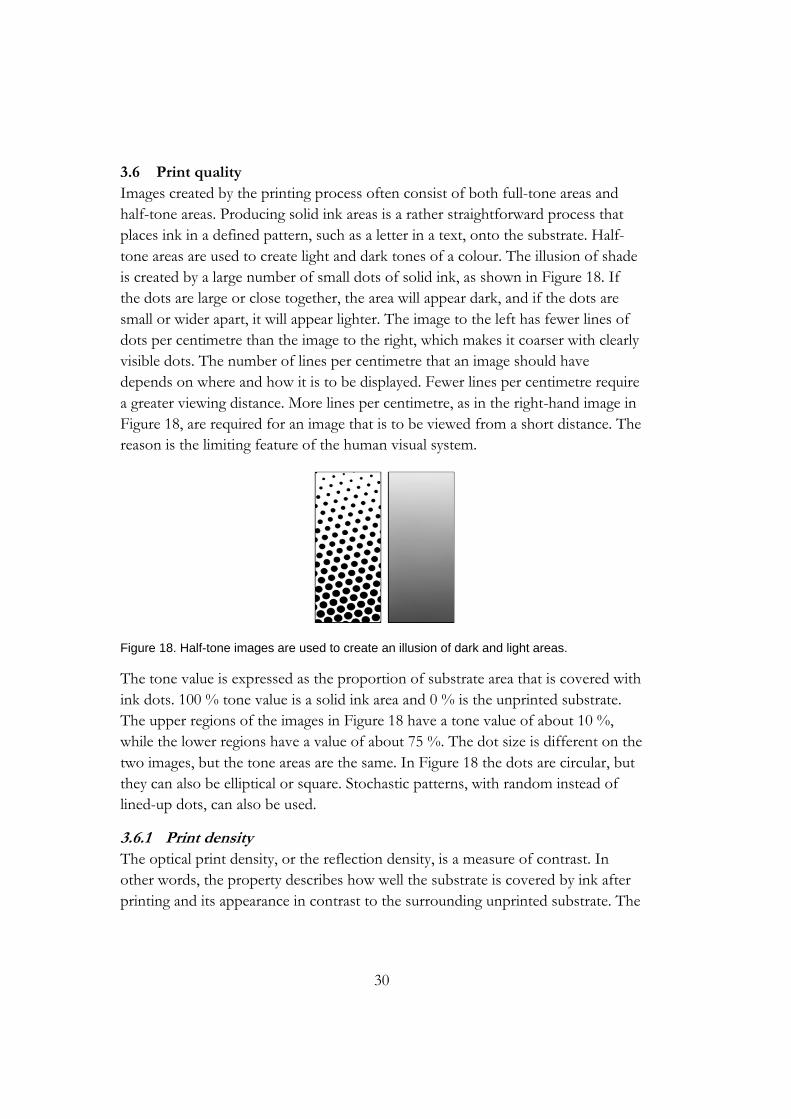
30
3.6 Print quality Images created by the printing process often consist of both full-tone areas and half-tone areas. Producing solid ink areas is a rather straightforward process that places ink in a defined pattern, such as a letter in a text, onto the substrate. Half-tone areas are used to create light and dark tones of a colour. The illusion of shade is created by a large number of small dots of solid ink, as shown in Figure 18. If the dots are large or close together, the area will appear dark, and if the dots are small or wider apart, it will appear lighter. The image to the left has fewer lines of dots per centimetre than the image to the right, which makes it coarser with clearly visible dots. The number of lines per centimetre that an image should have depends on where and how it is to be displayed. Fewer lines per centimetre require a greater viewing distance. More lines per centimetre, as in the right-hand image in Figure 18, are required for an image that is to be viewed from a short distance. The reason is the limiting feature of the human visual system.
Figure 18. Half-tone images are used to create an illusion of dark and light areas.
The tone value is expressed as the proportion of substrate area that is covered with ink dots. 100 % tone value is a solid ink area and 0 % is the unprinted substrate. The upper regions of the images in Figure 18 have a tone value of about 10 %, while the lower regions have a value of about 75 %. The dot size is different on the two images, but the tone areas are the same. In Figure 18 the dots are circular, but they can also be elliptical or square. Stochastic patterns, with random instead of lined-up dots, can also be used.
3.6.1 Print density The optical print density, or the reflection density, is a measure of contrast. In other words, the property describes how well the substrate is covered by ink after printing and its appearance in contrast to the surrounding unprinted substrate. The
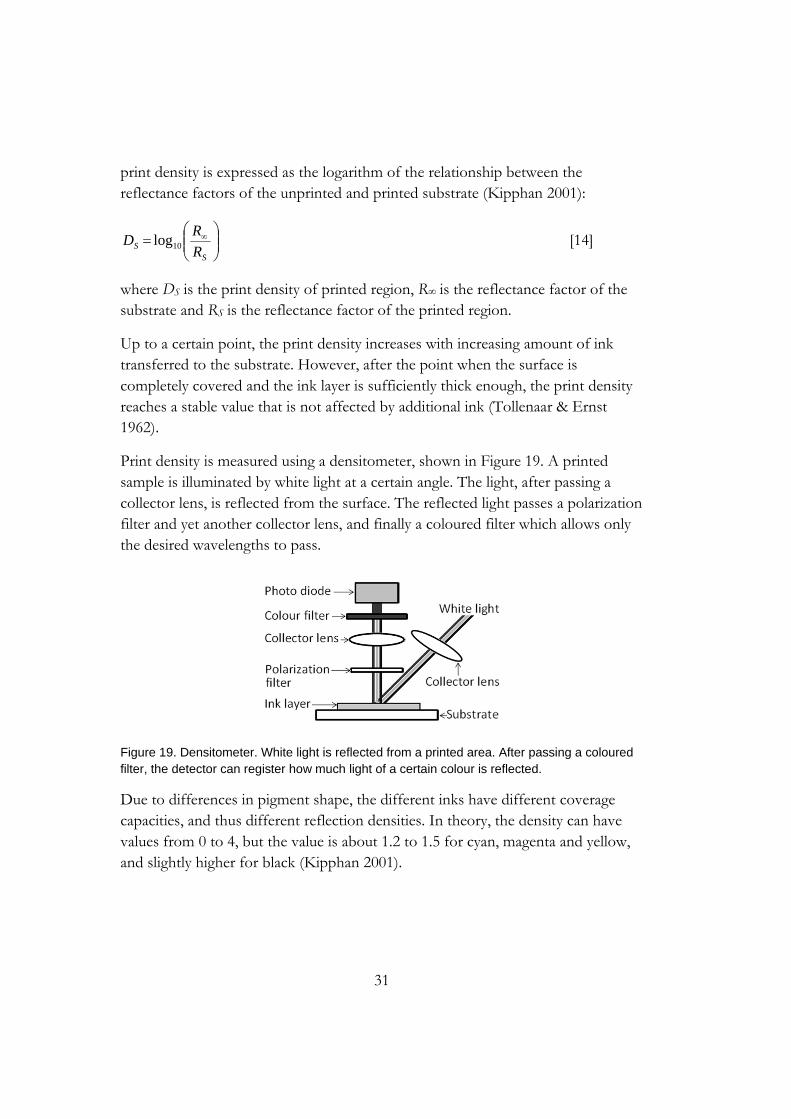
31
print density is expressed as the logarithm of the relationship between the reflectance factors of the unprinted and printed substrate (Kipphan 2001):
SS R
RD 10log [14]
where DS is the print density of printed region, R∞ is the reflectance factor of the substrate and RS is the reflectance factor of the printed region.
Up to a certain point, the print density increases with increasing amount of ink transferred to the substrate. However, after the point when the surface is completely covered and the ink layer is sufficiently thick enough, the print density reaches a stable value that is not affected by additional ink (Tollenaar & Ernst 1962).
Print density is measured using a densitometer, shown in Figure 19. A printed sample is illuminated by white light at a certain angle. The light, after passing a collector lens, is reflected from the surface. The reflected light passes a polarization filter and yet another collector lens, and finally a coloured filter which allows only the desired wavelengths to pass.
Figure 19. Densitometer. White light is reflected from a printed area. After passing a coloured filter, the detector can register how much light of a certain colour is reflected.
Due to differences in pigment shape, the different inks have different coverage capacities, and thus different reflection densities. In theory, the density can have values from 0 to 4, but the value is about 1.2 to 1.5 for cyan, magenta and yellow, and slightly higher for black (Kipphan 2001).
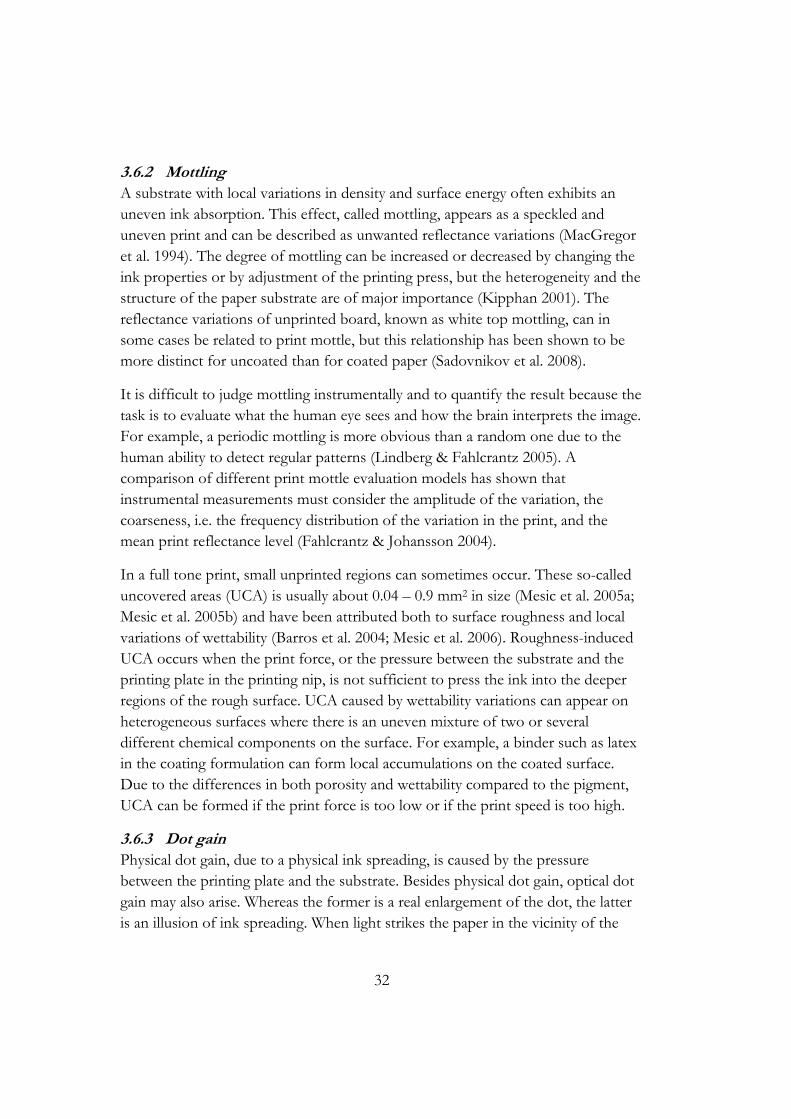
32
3.6.2 Mottling A substrate with local variations in density and surface energy often exhibits an uneven ink absorption. This effect, called mottling, appears as a speckled and uneven print and can be described as unwanted reflectance variations (MacGregor et al. 1994). The degree of mottling can be increased or decreased by changing the ink properties or by adjustment of the printing press, but the heterogeneity and the structure of the paper substrate are of major importance (Kipphan 2001). The reflectance variations of unprinted board, known as white top mottling, can in some cases be related to print mottle, but this relationship has been shown to be more distinct for uncoated than for coated paper (Sadovnikov et al. 2008).
It is difficult to judge mottling instrumentally and to quantify the result because the task is to evaluate what the human eye sees and how the brain interprets the image. For example, a periodic mottling is more obvious than a random one due to the human ability to detect regular patterns (Lindberg & Fahlcrantz 2005). A comparison of different print mottle evaluation models has shown that instrumental measurements must consider the amplitude of the variation, the coarseness, i.e. the frequency distribution of the variation in the print, and the mean print reflectance level (Fahlcrantz & Johansson 2004).
In a full tone print, small unprinted regions can sometimes occur. These so-called uncovered areas (UCA) is usually about 0.04 – 0.9 mm2 in size (Mesic et al. 2005a; Mesic et al. 2005b) and have been attributed both to surface roughness and local variations of wettability (Barros et al. 2004; Mesic et al. 2006). Roughness-induced UCA occurs when the print force, or the pressure between the substrate and the printing plate in the printing nip, is not sufficient to press the ink into the deeper regions of the rough surface. UCA caused by wettability variations can appear on heterogeneous surfaces where there is an uneven mixture of two or several different chemical components on the surface. For example, a binder such as latex in the coating formulation can form local accumulations on the coated surface. Due to the differences in both porosity and wettability compared to the pigment, UCA can be formed if the print force is too low or if the print speed is too high.
3.6.3 Dot gain Physical dot gain, due to a physical ink spreading, is caused by the pressure between the printing plate and the substrate. Besides physical dot gain, optical dot gain may also arise. Whereas the former is a real enlargement of the dot, the latter is an illusion of ink spreading. When light strikes the paper in the vicinity of the
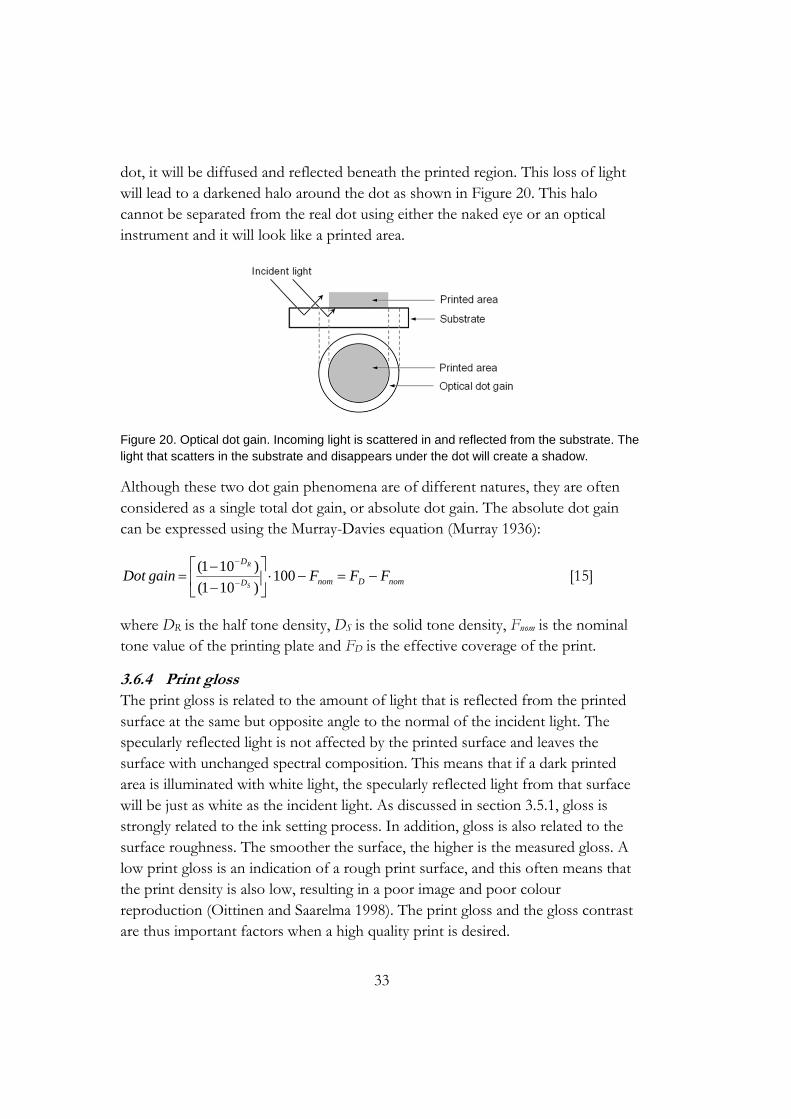
33
dot, it will be diffused and reflected beneath the printed region. This loss of light will lead to a darkened halo around the dot as shown in Figure 20. This halo cannot be separated from the real dot using either the naked eye or an optical instrument and it will look like a printed area.
Figure 20. Optical dot gain. Incoming light is scattered in and reflected from the substrate. The light that scatters in the substrate and disappears under the dot will create a shadow.
Although these two dot gain phenomena are of different natures, they are often considered as a single total dot gain, or absolute dot gain. The absolute dot gain can be expressed using the Murray-Davies equation (Murray 1936):
nomDnomD
D
FFFgainDotS
R
100)101(
)101( [15]
where DR is the half tone density, DS is the solid tone density, Fnom is the nominal tone value of the printing plate and FD is the effective coverage of the print.
3.6.4 Print gloss The print gloss is related to the amount of light that is reflected from the printed surface at the same but opposite angle to the normal of the incident light. The specularly reflected light is not affected by the printed surface and leaves the surface with unchanged spectral composition. This means that if a dark printed area is illuminated with white light, the specularly reflected light from that surface will be just as white as the incident light. As discussed in section 3.5.1, gloss is strongly related to the ink setting process. In addition, gloss is also related to the surface roughness. The smoother the surface, the higher is the measured gloss. A low print gloss is an indication of a rough print surface, and this often means that the print density is also low, resulting in a poor image and poor colour reproduction (Oittinen and Saarelma 1998). The print gloss and the gloss contrast are thus important factors when a high quality print is desired.
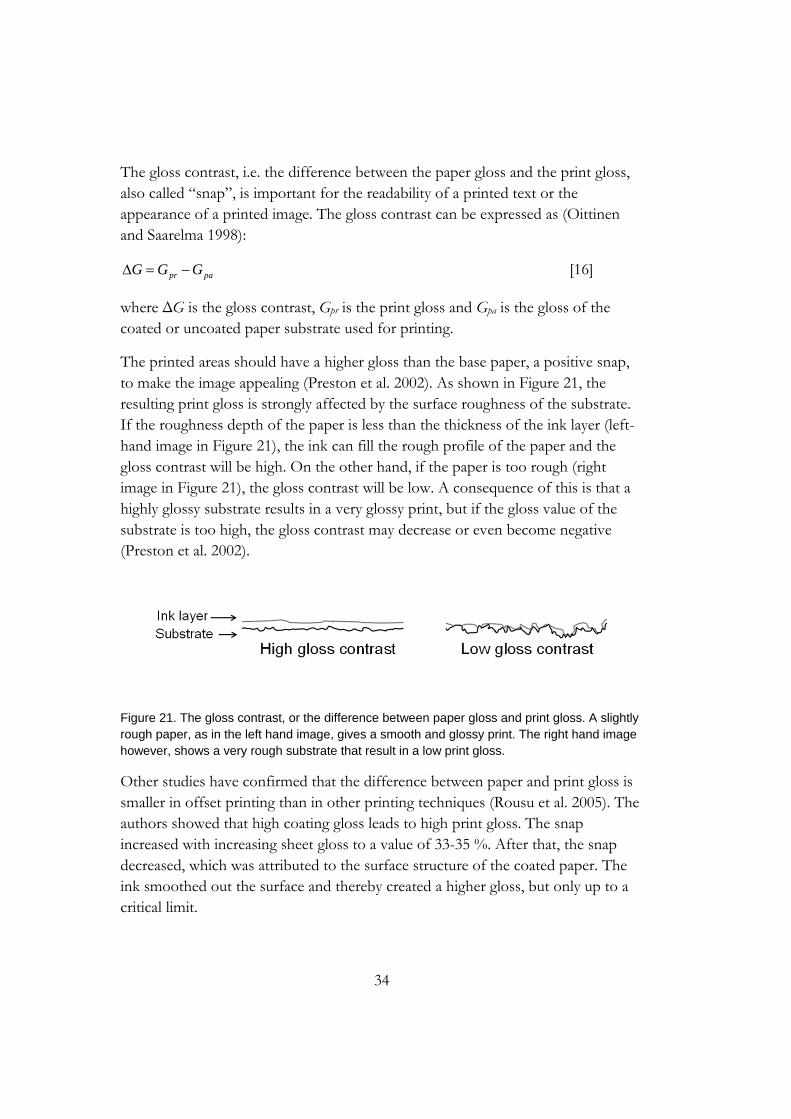
34
The gloss contrast, i.e. the difference between the paper gloss and the print gloss, also called “snap”, is important for the readability of a printed text or the appearance of a printed image. The gloss contrast can be expressed as (Oittinen and Saarelma 1998):
papr GGG [16]
where ΔG is the gloss contrast, Gpr is the print gloss and Gpa is the gloss of the coated or uncoated paper substrate used for printing.
The printed areas should have a higher gloss than the base paper, a positive snap, to make the image appealing (Preston et al. 2002). As shown in Figure 21, the resulting print gloss is strongly affected by the surface roughness of the substrate. If the roughness depth of the paper is less than the thickness of the ink layer (left-hand image in Figure 21), the ink can fill the rough profile of the paper and the gloss contrast will be high. On the other hand, if the paper is too rough (right image in Figure 21), the gloss contrast will be low. A consequence of this is that a highly glossy substrate results in a very glossy print, but if the gloss value of the substrate is too high, the gloss contrast may decrease or even become negative (Preston et al. 2002).
Figure 21. The gloss contrast, or the difference between paper gloss and print gloss. A slightly rough paper, as in the left hand image, gives a smooth and glossy print. The right hand image however, shows a very rough substrate that result in a low print gloss.
Other studies have confirmed that the difference between paper and print gloss is smaller in offset printing than in other printing techniques (Rousu et al. 2005). The authors showed that high coating gloss leads to high print gloss. The snap increased with increasing sheet gloss to a value of 33-35 %. After that, the snap decreased, which was attributed to the surface structure of the coated paper. The ink smoothed out the surface and thereby created a higher gloss, but only up to a critical limit.
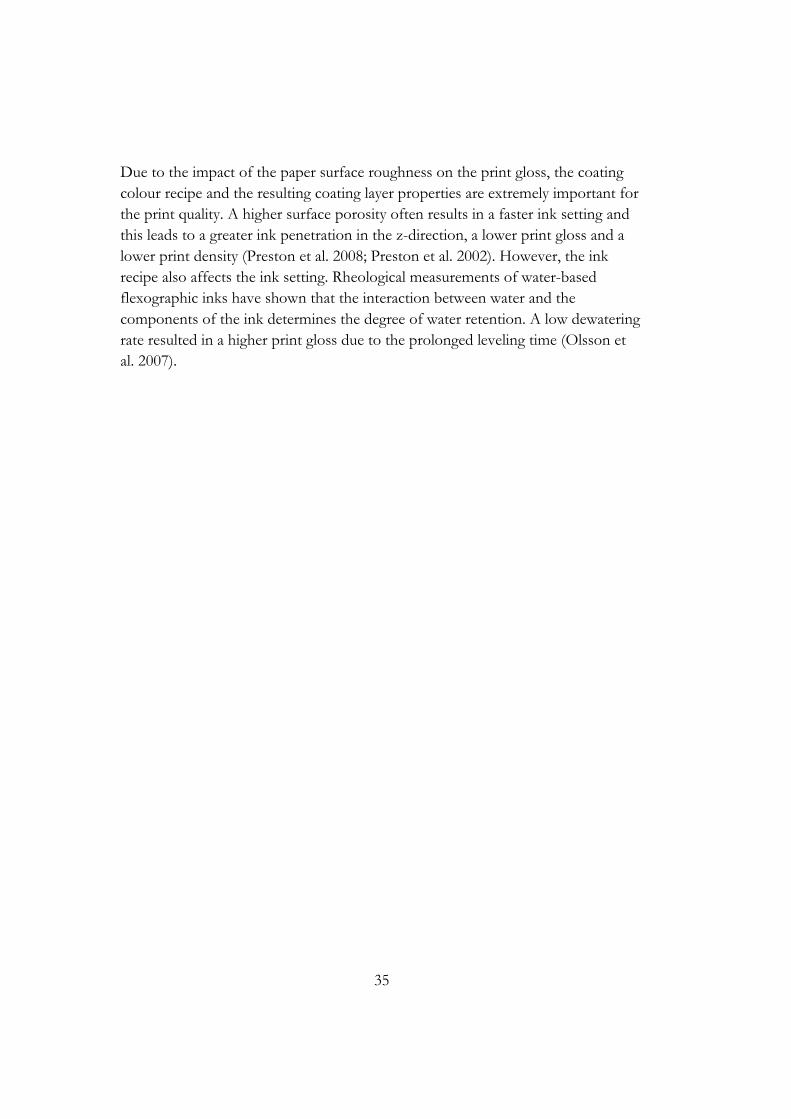
35
Due to the impact of the paper surface roughness on the print gloss, the coating colour recipe and the resulting coating layer properties are extremely important for the print quality. A higher surface porosity often results in a faster ink setting and this leads to a greater ink penetration in the z-direction, a lower print gloss and a lower print density (Preston et al. 2008; Preston et al. 2002). However, the ink recipe also affects the ink setting. Rheological measurements of water-based flexographic inks have shown that the interaction between water and the components of the ink determines the degree of water retention. A low dewatering rate resulted in a higher print gloss due to the prolonged leveling time (Olsson et al. 2007).
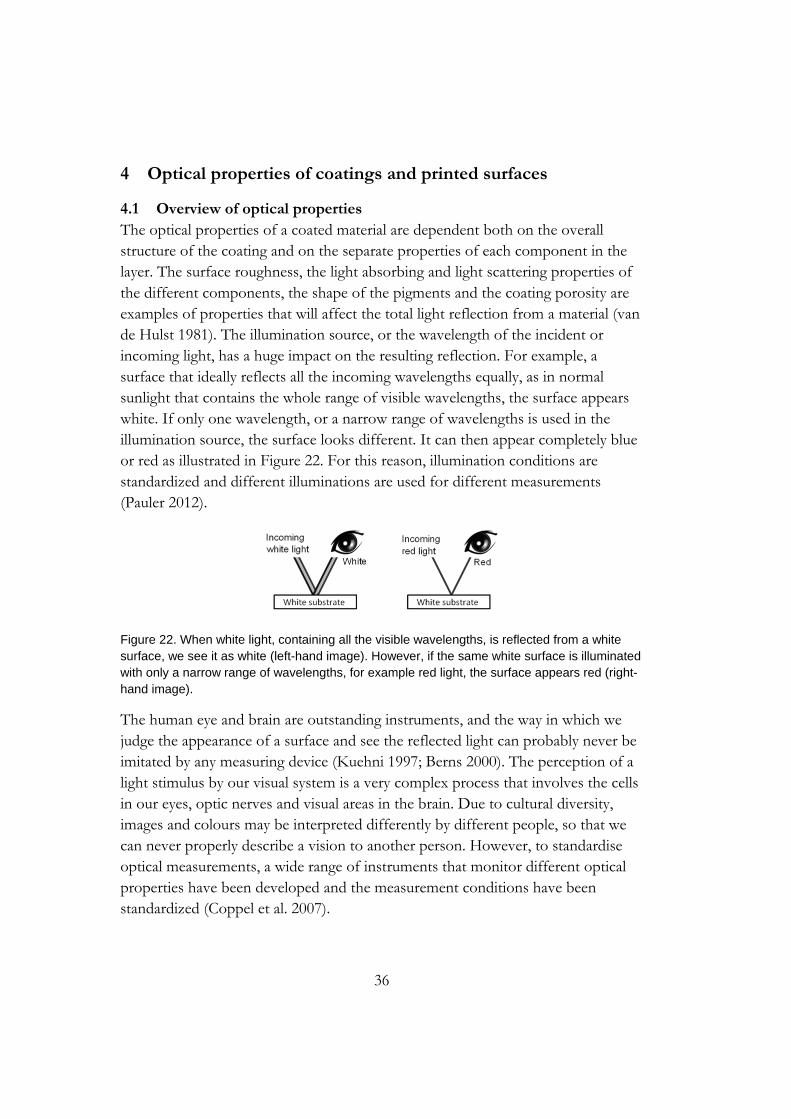
36
4 Optical properties of coatings and printed surfaces
4.1 Overview of optical properties The optical properties of a coated material are dependent both on the overall structure of the coating and on the separate properties of each component in the layer. The surface roughness, the light absorbing and light scattering properties of the different components, the shape of the pigments and the coating porosity are examples of properties that will affect the total light reflection from a material (van de Hulst 1981). The illumination source, or the wavelength of the incident or incoming light, has a huge impact on the resulting reflection. For example, a surface that ideally reflects all the incoming wavelengths equally, as in normal sunlight that contains the whole range of visible wavelengths, the surface appears white. If only one wavelength, or a narrow range of wavelengths is used in the illumination source, the surface looks different. It can then appear completely blue or red as illustrated in Figure 22. For this reason, illumination conditions are standardized and different illuminations are used for different measurements (Pauler 2012).
Figure 22. When white light, containing all the visible wavelengths, is reflected from a white surface, we see it as white (left-hand image). However, if the same white surface is illuminated with only a narrow range of wavelengths, for example red light, the surface appears red (right-hand image).
The human eye and brain are outstanding instruments, and the way in which we judge the appearance of a surface and see the reflected light can probably never be imitated by any measuring device (Kuehni 1997; Berns 2000). The perception of a light stimulus by our visual system is a very complex process that involves the cells in our eyes, optic nerves and visual areas in the brain. Due to cultural diversity, images and colours may be interpreted differently by different people, so that we can never properly describe a vision to another person. However, to standardise optical measurements, a wide range of instruments that monitor different optical properties have been developed and the measurement conditions have been standardized (Coppel et al. 2007).

37
4.1.1 Gloss Light can be reflected from a surface either diffusely or directionally. The light reflection giving rise to the perception of gloss is directed reflection, also called specular or mirror reflection, and a high gloss is often desired when a paper product, printed or unprinted, is produced. A high gloss makes the product, for example a packaging, look more elegant and expensive. In some cases, more effort and resources are actually concentrated to the manufacture of the package than to the contents themselves. The gloss is closely related to the surface roughness, and for coated paper it has been shown that gloss is predominantly governed by the surface texture of the paper (Caner et al. 2008).
The gloss is expressed as gloss units where a surface reflecting 100 gloss units is a black surface with specified properties. The gloss of a paperboard surface is therefore defined as light reflected from a surface at the same but opposite angle to the normal of the incident light (ISO 8254-1) in relation to the black gloss standard. The most commonly used incidence and viewing angles within the paper industry are 75, 60 and 20°, where smaller angles are most suitable for high-gloss samples. The equipment for measuring gloss is very user-friendly and the measurements can be made quickly, and for this reason the gloss is usually measured at a single angle, even though the number of viewing angles in reality is infinite when a person looks at a surface. To obtain a wide range of reflections at different angles, goniophotometers have been developed, where not only the viewing angle but also the angle of incidence can be altered. The results obtained from such equipment give much more detailed information about the optical properties of the surface, but because of high costs and more time-consuming measurements, the technique has not become widely used in the industry. However, a simple equipment called a micro-goniophotometer, based on an inexpensive video camera and simple optics, has been investigated (Arney et al. 2006). It has been shown to produce significantly more information than that given by a standard gloss measurement. The authors presented plots of a bidirectional reflectance factor distribution function (BRDF) that were related quantitatively and directly to Fresnels law of specular reflection (outlined e.g. Nordling & Österman 2004), to surface roughness and, in some cases, to subsurface effects. A standard gloss measurement does not distinguish between these effects.
Figure 23 illustrates the gloss of three different surfaces. The image to the left represents almost zero gloss. The surface in this case is very rough and porous, and
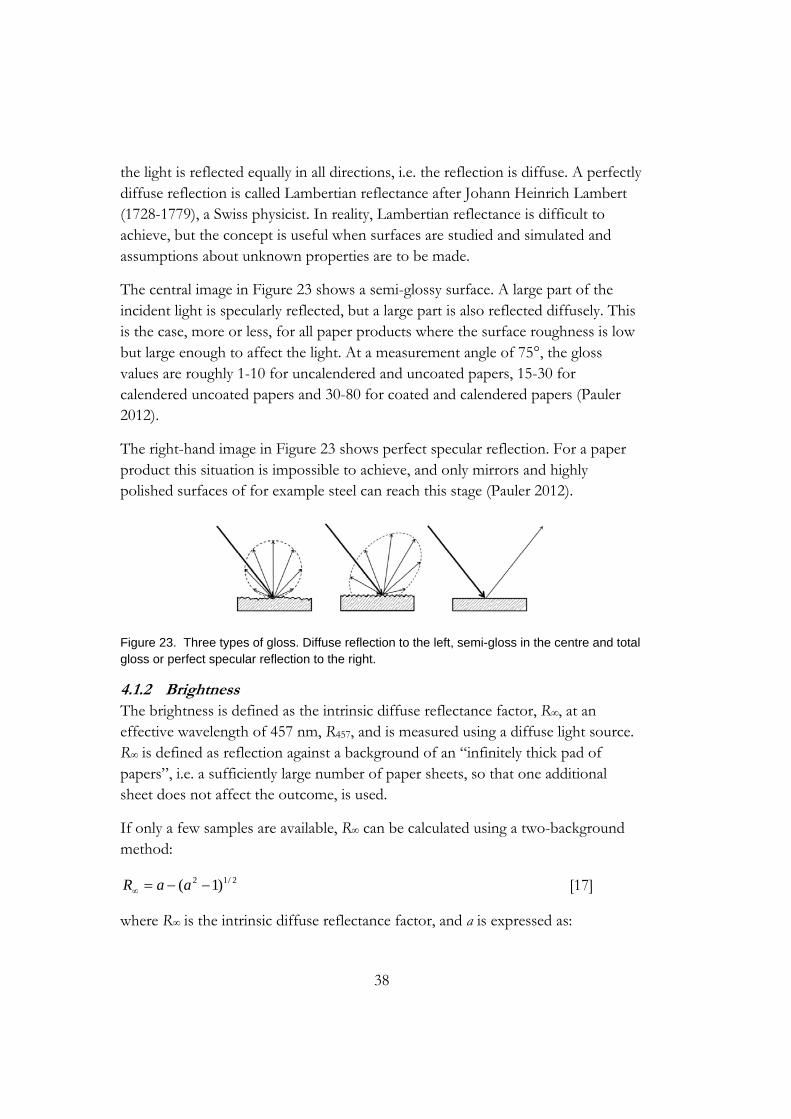
38
the light is reflected equally in all directions, i.e. the reflection is diffuse. A perfectly diffuse reflection is called Lambertian reflectance after Johann Heinrich Lambert (1728-1779), a Swiss physicist. In reality, Lambertian reflectance is difficult to achieve, but the concept is useful when surfaces are studied and simulated and assumptions about unknown properties are to be made.
The central image in Figure 23 shows a semi-glossy surface. A large part of the incident light is specularly reflected, but a large part is also reflected diffusely. This is the case, more or less, for all paper products where the surface roughness is low but large enough to affect the light. At a measurement angle of 75°, the gloss values are roughly 1-10 for uncalendered and uncoated papers, 15-30 for calendered uncoated papers and 30-80 for coated and calendered papers (Pauler 2012).
The right-hand image in Figure 23 shows perfect specular reflection. For a paper product this situation is impossible to achieve, and only mirrors and highly polished surfaces of for example steel can reach this stage (Pauler 2012).
Figure 23. Three types of gloss. Diffuse reflection to the left, semi-gloss in the centre and total gloss or perfect specular reflection to the right.
4.1.2 Brightness The brightness is defined as the intrinsic diffuse reflectance factor, R∞, at an effective wavelength of 457 nm, R457, and is measured using a diffuse light source. R∞ is defined as reflection against a background of an “infinitely thick pad of papers”, i.e. a sufficiently large number of paper sheets, so that one additional sheet does not affect the outcome, is used.
If only a few samples are available, R∞ can be calculated using a two-background method:
2/12 )1( aaR [17]
where R∞ is the intrinsic diffuse reflectance factor, and a is expressed as:
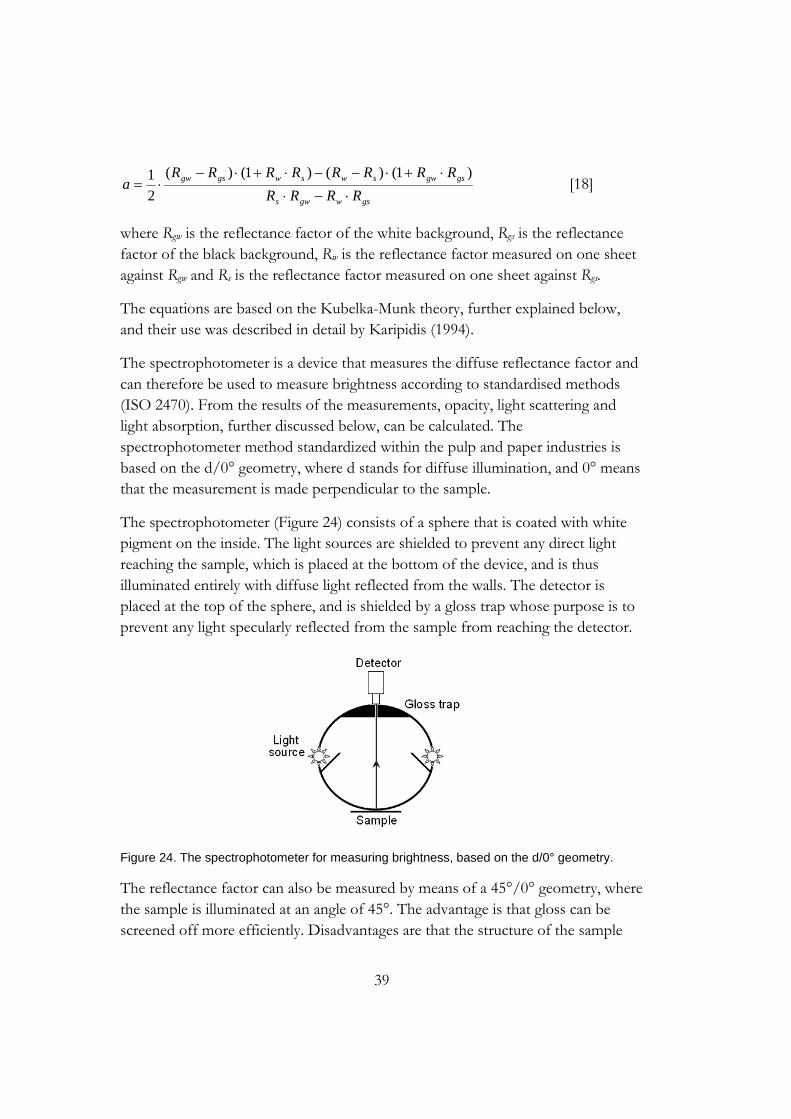
39
gswgws
gsgwswswgsgw
RRRR
RRRRRRRRa
)1()()1()(
2
1 [18]
where Rgw is the reflectance factor of the white background, Rgs is the reflectance factor of the black background, Rw is the reflectance factor measured on one sheet against Rgw and Rs is the reflectance factor measured on one sheet against Rgs.
The equations are based on the Kubelka-Munk theory, further explained below, and their use was described in detail by Karipidis (1994).
The spectrophotometer is a device that measures the diffuse reflectance factor and can therefore be used to measure brightness according to standardised methods (ISO 2470). From the results of the measurements, opacity, light scattering and light absorption, further discussed below, can be calculated. The spectrophotometer method standardized within the pulp and paper industries is based on the d/0° geometry, where d stands for diffuse illumination, and 0° means that the measurement is made perpendicular to the sample.
The spectrophotometer (Figure 24) consists of a sphere that is coated with white pigment on the inside. The light sources are shielded to prevent any direct light reaching the sample, which is placed at the bottom of the device, and is thus illuminated entirely with diffuse light reflected from the walls. The detector is placed at the top of the sphere, and is shielded by a gloss trap whose purpose is to prevent any light specularly reflected from the sample from reaching the detector.
Figure 24. The spectrophotometer for measuring brightness, based on the d/0° geometry.
The reflectance factor can also be measured by means of a 45°/0° geometry, where the sample is illuminated at an angle of 45°. The advantage is that gloss can be screened off more efficiently. Disadvantages are that the structure of the sample
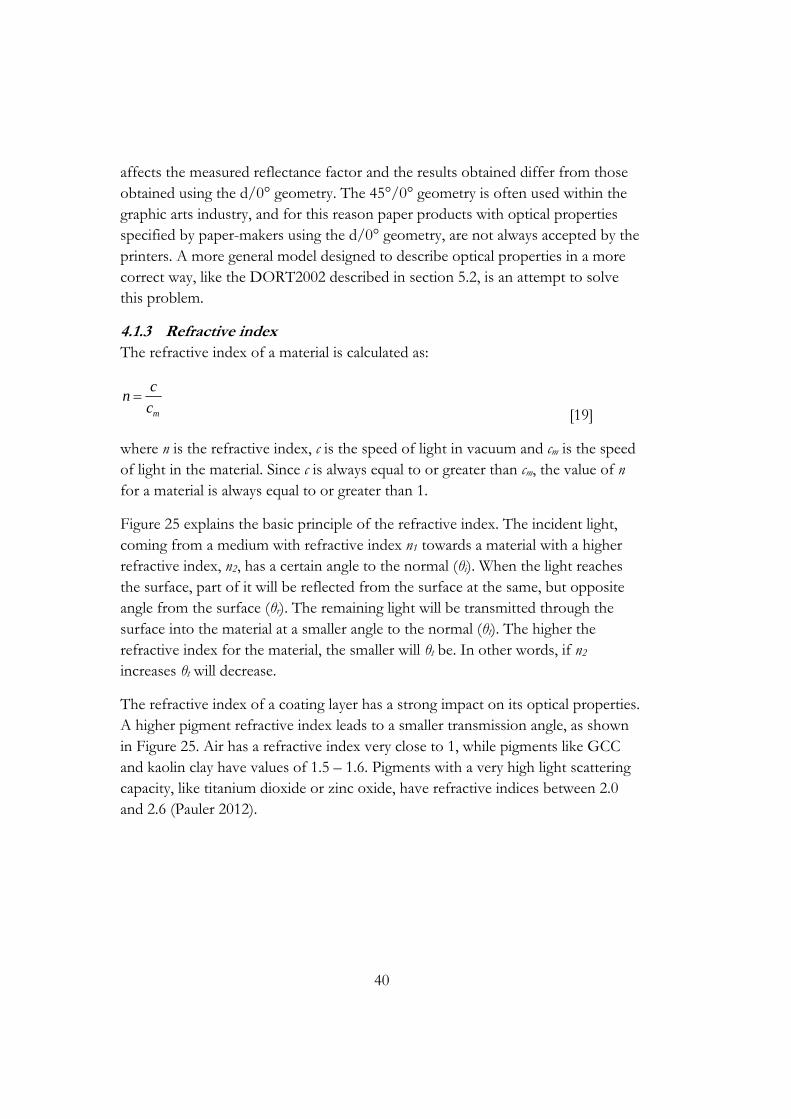
40
affects the measured reflectance factor and the results obtained differ from those obtained using the d/0° geometry. The 45°/0° geometry is often used within the graphic arts industry, and for this reason paper products with optical properties specified by paper-makers using the d/0° geometry, are not always accepted by the printers. A more general model designed to describe optical properties in a more correct way, like the DORT2002 described in section 5.2, is an attempt to solve this problem.
4.1.3 Refractive index The refractive index of a material is calculated as:
mc
cn
[19]
where n is the refractive index, c is the speed of light in vacuum and cm is the speed of light in the material. Since c is always equal to or greater than cm, the value of n for a material is always equal to or greater than 1.
Figure 25 explains the basic principle of the refractive index. The incident light, coming from a medium with refractive index n1 towards a material with a higher refractive index, n2, has a certain angle to the normal (θi). When the light reaches the surface, part of it will be reflected from the surface at the same, but opposite angle from the surface (θr). The remaining light will be transmitted through the surface into the material at a smaller angle to the normal (θt). The higher the refractive index for the material, the smaller will θt be. In other words, if n2
increases θt will decrease.
The refractive index of a coating layer has a strong impact on its optical properties. A higher pigment refractive index leads to a smaller transmission angle, as shown in Figure 25. Air has a refractive index very close to 1, while pigments like GCC and kaolin clay have values of 1.5 – 1.6. Pigments with a very high light scattering capacity, like titanium dioxide or zinc oxide, have refractive indices between 2.0 and 2.6 (Pauler 2012).
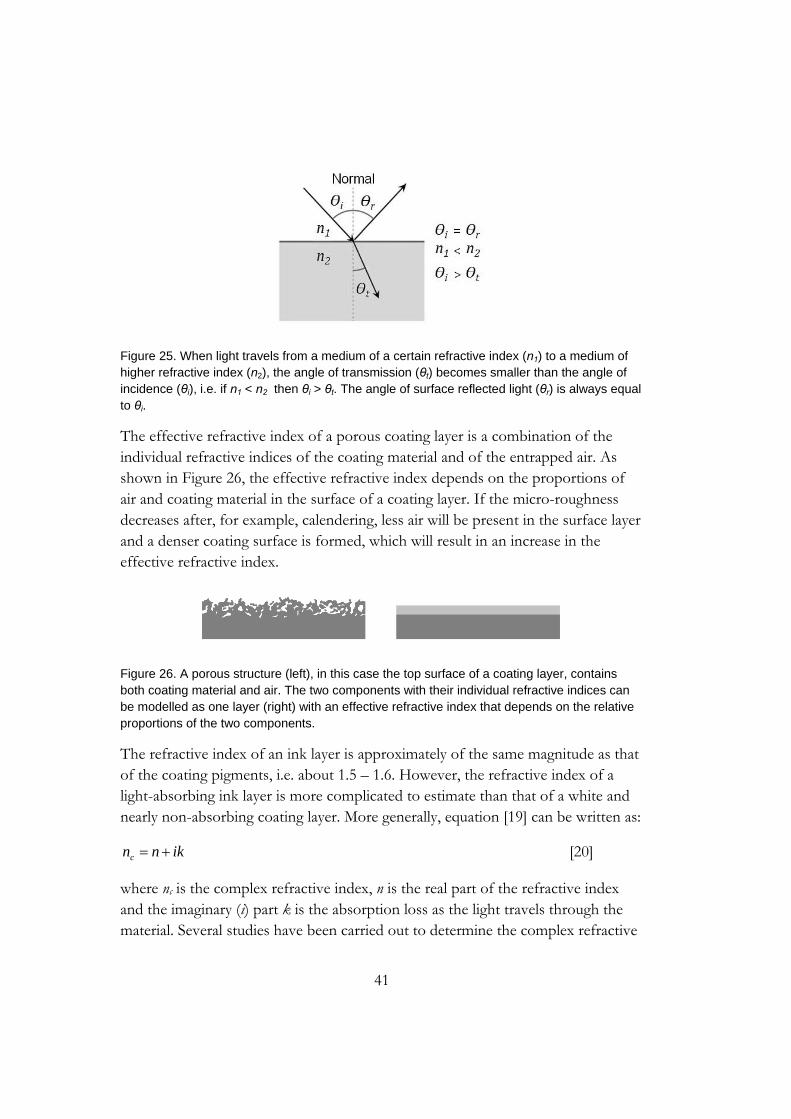
41
Figure 25. When light travels from a medium of a certain refractive index (n1) to a medium of higher refractive index (n2), the angle of transmission (θt) becomes smaller than the angle of incidence (θi), i.e. if n1 < n2 then θi > θt. The angle of surface reflected light (θr) is always equal to θi.
The effective refractive index of a porous coating layer is a combination of the individual refractive indices of the coating material and of the entrapped air. As shown in Figure 26, the effective refractive index depends on the proportions of air and coating material in the surface of a coating layer. If the micro-roughness decreases after, for example, calendering, less air will be present in the surface layer and a denser coating surface is formed, which will result in an increase in the effective refractive index.
Figure 26. A porous structure (left), in this case the top surface of a coating layer, contains both coating material and air. The two components with their individual refractive indices can be modelled as one layer (right) with an effective refractive index that depends on the relative proportions of the two components.
The refractive index of an ink layer is approximately of the same magnitude as that of the coating pigments, i.e. about 1.5 – 1.6. However, the refractive index of a light-absorbing ink layer is more complicated to estimate than that of a white and nearly non-absorbing coating layer. More generally, equation [19] can be written as:
iknnc [20]
where nc is the complex refractive index, n is the real part of the refractive index and the imaginary (i) part k is the absorption loss as the light travels through the material. Several studies have been carried out to determine the complex refractive

42
index for printed layers (Bakker et al. 2004; Preston & Gate 2005; Niskanen et al. 2007; Peiponen et al. 2008). For practical reasons, smooth samples applied on flat materials without roughness or porosity are often used in such studies, and the impact of the roughness of a real printed substrate on the complex refractive index is often discussed. However, it has been indicated that the scale of roughness only marginally influences the measured refractive index of a printed surface (Preston & Gate 2005).
4.2 Theoretical models of optical properties
4.2.1 The Kubelka-Munk theory For a long time, the Kubelka-Munk equations have constituted the major model for the simulation of optical properties in the paper industry. Due to their simplicity, their use is still widespread even though their limitations are well known and have been discussed in several scientific articles. However, despite the assumptions, such as for example a flat surface, a homogeneous layer and a two-flux system, the Kubelka-Munk model is often sufficient when certain optical properties are investigated. In other cases, when information regarding refractive index, multi-flux or surface structures is treated, alternative methods are needed. More recently, theories based on radiative transfer theory have been developed to calculate the optical response given almost any illumination and detection geometry. These theories also handle heavily dyed papers, full-tone prints, gloss and the effects of optical brightening agents.
The Kubelka-Munk (KM) theory was originally developed for paint films (Kubelka & Munk 1931) but it has for a long time been used for modelling the optical properties of paper and paper coatings. Limiting assumptions are a flat surface, a material through which both absorbing and scattering substances are evenly distributed, and that any particles present must be much smaller than the total thickness of the coating layer. The theory works best when the illumination source is diffuse monochromatic light and the light absorption of the material is low. An ideal situation is when more than 50 % of the light is reflected and less than 20 % is transmitted. The KM model (Figure 27) is not therefore suitable for dyed or very dark materials (Yang 2002).
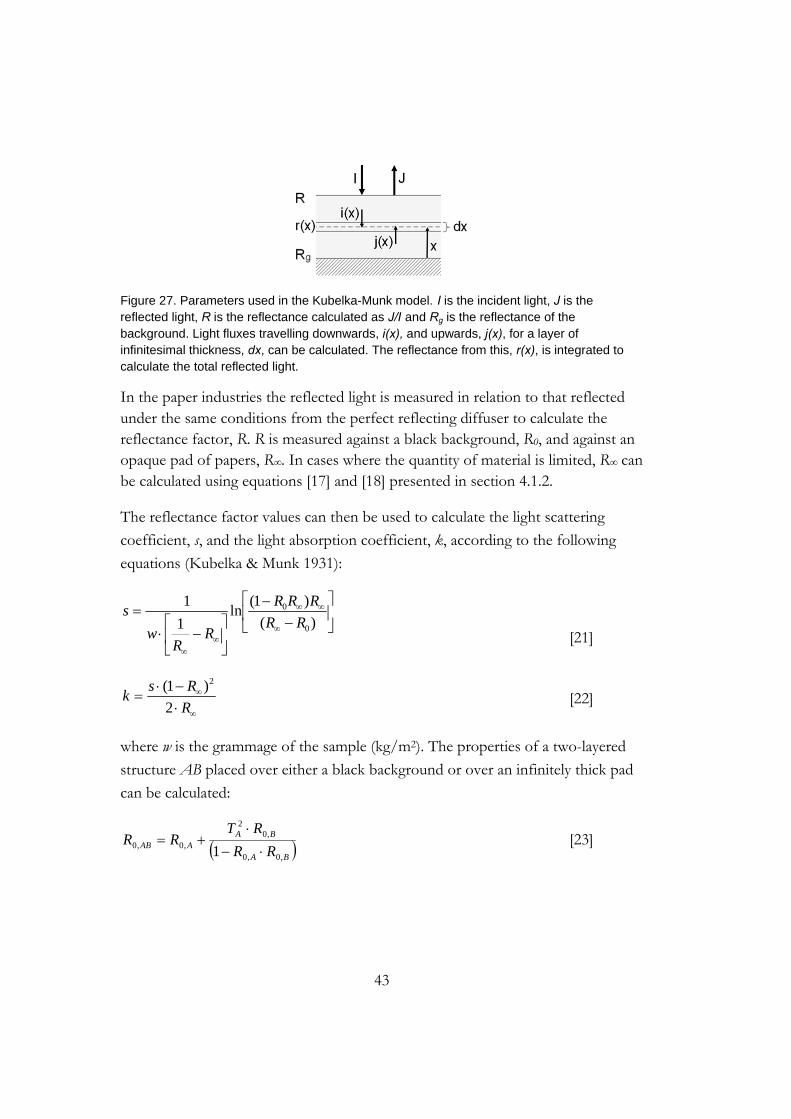
43
Figure 27. Parameters used in the Kubelka-Munk model. I is the incident light, J is the reflected light, R is the reflectance calculated as J/I and Rg is the reflectance of the background. Light fluxes travelling downwards, i(x), and upwards, j(x), for a layer of infinitesimal thickness, dx, can be calculated. The reflectance from this, r(x), is integrated to calculate the total reflected light.
In the paper industries the reflected light is measured in relation to that reflected under the same conditions from the perfect reflecting diffuser to calculate the reflectance factor, R. R is measured against a black background, R0, and against an opaque pad of papers, R∞. In cases where the quantity of material is limited, R∞ can be calculated using equations [17] and [18] presented in section 4.1.2.
The reflectance factor values can then be used to calculate the light scattering
coefficient, s, and the light absorption coefficient, k, according to the following
equations (Kubelka & Munk 1931):
)(
)1(ln
1
1
0
0
RR
RRR
RR
w
s
[21]
R
Rsk
2
)1( 2
[22]
where w is the grammage of the sample (kg/m2). The properties of a two-layered
structure AB placed over either a black background or over an infinitely thick pad
can be calculated:
BA
BAAAB RR
RTRR
,0,0
,02
,0,0 1
[23]
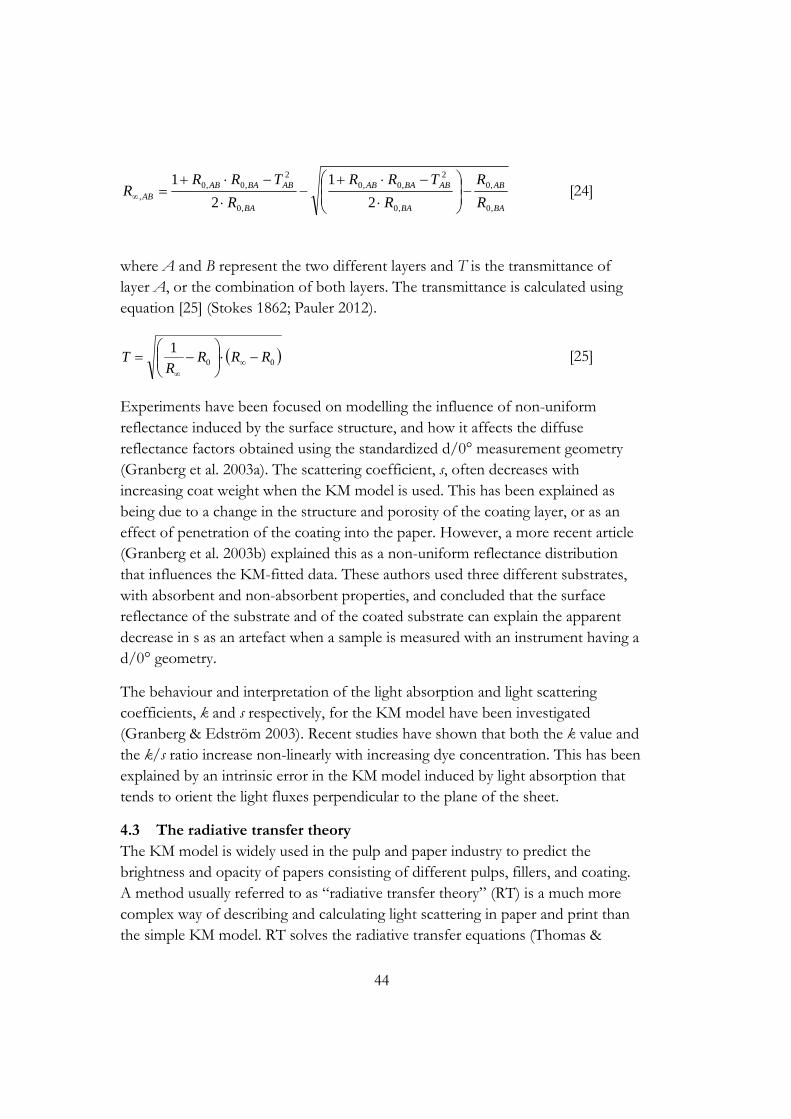
44
BA
AB
BA
ABBAAB
BA
ABBAABAB R
R
R
TRR
R
TRRR
,0
,0
,0
2,0,0
,0
2,0,0
, 2
1
2
1
[24]
where A and B represent the two different layers and T is the transmittance of layer A, or the combination of both layers. The transmittance is calculated using equation [25] (Stokes 1862; Pauler 2012).
00
1RRR
RT
[25]
Experiments have been focused on modelling the influence of non-uniform reflectance induced by the surface structure, and how it affects the diffuse reflectance factors obtained using the standardized d/0° measurement geometry (Granberg et al. 2003a). The scattering coefficient, s, often decreases with increasing coat weight when the KM model is used. This has been explained as being due to a change in the structure and porosity of the coating layer, or as an effect of penetration of the coating into the paper. However, a more recent article (Granberg et al. 2003b) explained this as a non-uniform reflectance distribution that influences the KM-fitted data. These authors used three different substrates, with absorbent and non-absorbent properties, and concluded that the surface reflectance of the substrate and of the coated substrate can explain the apparent decrease in s as an artefact when a sample is measured with an instrument having a d/0° geometry.
The behaviour and interpretation of the light absorption and light scattering coefficients, k and s respectively, for the KM model have been investigated (Granberg & Edström 2003). Recent studies have shown that both the k value and the k/s ratio increase non-linearly with increasing dye concentration. This has been explained by an intrinsic error in the KM model induced by light absorption that tends to orient the light fluxes perpendicular to the plane of the sheet.
4.3 The radiative transfer theory The KM model is widely used in the pulp and paper industry to predict the brightness and opacity of papers consisting of different pulps, fillers, and coating. A method usually referred to as “radiative transfer theory” (RT) is a much more complex way of describing and calculating light scattering in paper and print than the simple KM model. RT solves the radiative transfer equations (Thomas &

45
Stamners 2002) and is a general model that divides the light fluxes into a number of channels (Figure 28). The number of channels can be adjusted to fit a specific calculation, but 20 channels are sufficient in most cases. Several layers having different optical properties can be placed upon each other during a simulation.
Figure 28. Illustrations of the 2-channel KM model (left) and a multi-channel model such as DORT (right).
The KM model uses incoming and reflected light at a specific wavelength, for a given thickness or coat weight, to calculate light scattering, s, and light absorption, k. RT models on the other hand use light absorption, σa, and light scattering, σs, coefficients that are physical quantities.
In the RT model, the intensity of the radiation, I, and the loss of radiation due to scattering and absorption, dI, in thickness ds, are used to define the extinction coefficient, σe.
Ids
dIe [26]
The extinction coefficient can then be separated into the light absorption and light scattering coefficients.
sae [27]
To be able to consider the direction of scattering, an asymmetry parameter g is introduced. This parameter has a value between -1 and 1, where 0 represents uniform scattering and other values represents peaked scattering in the forward or backward directions. The light scattering coefficient and the asymmetry parameter are sometimes combined to a reduced scattering coefficient, σs´, in order to increase the calculation speed.
)1( gss [28]
46
Expressions that approximately describe the relation between the KM scattering and absorption coefficients, s and k, and the reduced scattering coefficient, σs´, and the absorption coefficient, σa, can be written (Mudgett & Richards 1971) as:
ass 4
1
4
3 [29]
ak 2 [30]
A specific RT implementation called DORT2002 (discrete ordinate radiative transfer) has been developed to calculate the optical response given almost any illumination and detection geometry (Edström 2005), and it also handles heavily dyed papers, full-tone prints, gloss and the effects of optical brightening agents. The KM model is a simple special case of DORT2002, when the light is perfectly diffuse, the scattering is perfectly isotropic and only two channels are used (Figure 27). Under these circumstances the scattering and absorption coefficients for the two models are the same.
When the DORT2002 model was used, and scattering and absorption coefficients calculated from equations [21] and [22] were compared with those calculated from equations [29] and [30], errors of up to 20 % were found in the reflectance factor calculations of the KM model (Edström 2004). In fact, Edström noted that the KM model may fail to provide correct results even under ideal conditions. This means that previous knowledge gained from using the KM model can be used as a foundation for future work with the DORT2002 model. Both the number of channels and the number of layers of the studied material can be adjusted to fit a specific calculation. However, as with the KM model, the DORT2002 model assumes a flat surface and cannot be used for simulations of surface roughness.
4.4 Monte Carlo simulations Instead of solving the radiative transfer equations numerically as the DORT2002 model does, a Monte Carlo method can be used to approach the calculations. Monte Carlo methods use repeated random sampling to compute results and are often used for simulations of physical and mathematical systems over a wide range from gambling and finance to chemical and aerodynamic systems. The method has also been used to describe light behaviour in different materials, such as paper products (Wang et al. 1995).
47
Open PaperOpt is a Monte Carlo simulation program that has been designed for the calculation of light scattering and light absorption in paper and paper coatings. Using this program, the layer structure of a substrate such as a paper or a coated paper can be described as a geometrical distribution or as a fibre network. This results in a three-dimensional model of the inner paper structure and, unlike the DORT2002 model, Open PaperOpt can also simulate the surface roughness (Coppel & Edström 2009). When a structure has been created, the components within the simulated layer are modelled to interact with the light. Three parameters control the process: σa, σs and g. The probability, Pr, for a light particle to travel a certain distance, d, before a scattering or absorption event occurs is then given by:
das
asetrP )()()( [31]
As with the DORT2002 model, g can be used to set a new direction for the wave packet or, if g is equal to zero, to create uniform scattering. Surface scattering is treated as a combination of two effects. The long-range topographic structure, called the surface waviness, is the part that deflects incident wave packets according to Snell's law and the Fresnel equations (outlined e.g. in Nordling & Österman 2004). In addition, the short-range topographic structure, the micro-roughness, scatters the light diffusely. The scattering by the micro-roughness is introduced by allowing a fraction of the reflected and refracted light to be distributed in a Lambertian manner. Within a layer, the scattering process is controlled by the scattering and absorption coefficients.
The average light behaviour is calculated by following the path of a large number of light particles, or wave packets, through the model, as indicated in Figure 29. The light can be absorbed (1), transmitted (2), reflected away from the system (3) or reach the registration point, or the “detector”, that can be placed at any location or angle with respect to the surface that is subject to the simulation (4). The large number of wave packets needed for a simulation makes the Open PaperOpt model very time-consuming compared to either DORT2002 or the KM model.

48
Figure 29. Image that represents the Open PaperOpt simulation model. One or several layers are considered and assigned with roughness and optical properties. The paths of a large number of light particles are followed, and their average behaviour can be calculated.
49
5 Materials and methods
5.1 Laboratory-scale coating
5.1.1 Objective The purpose of Paper I was to simulate the decrease in brightness after calendering of coating layers applied on plastic sheets, by using the Open PaperOpt model. By simulating a decrease in surface micro-roughness and an increase in the effective refractive index, the decrease in brightness of the samples could be explained without any change in the coating thickness or any decrease in light scattering. In order to minimise the effect of the substrate and to determine the optical properties of the coating colour alone, a non-absorbent plastic film was used as substrate. In Paper II the investigations were extended to coated paper substrates.
5.1.2 Coating substrate The non-absorbent plastic film used in both Paper I and Paper II (Lumirror 54.41, Toray Plastics Europe SA, Miribel, France), had a thickness of 75 µm and a refractive index of 1.6. In Paper II, the substrate was also a four-ply cartonboard, 244 g/m2, with a bleached top layer, two unbleached centre layers and an unbleached bottom layer (supplied by Korsnäs AB, Sweden).
5.1.3 Coating recipes A single coating recipe was used for the investigations in Paper I. The coating recipe was 100 parts per hundred parts of pigment (pph) calcium carbonate, a narrow particle size distribution pigment (Covercarb 75, Omya AB, Malmö, Sweden), and 12 pph SB latex with a particle size of 120 nm, and a Tg of 24 °C (Eka Polymer Latex Oy, Oulu, Finland).
For Paper II, four different coating colours were prepared. Two different GCC pigments were used, one with a relatively broad particle size distribution, 90%<2 µm/64%<1µm, and one with a narrow particle size distribution, 95%<2µm/75%<1 µm (Hydrocarb 90 and Covercarb 75, both supplied by Omya AB, Malmö, Sweden), to study the impact of particle packing on the brightness properties. Two styrene-butadiene latices with particle diameters of 120 and 160 nm respectively, both with a Tg of 24 °C (Eka Polymer Latex Oy, Oulu, Finland) were used at 12 pph. The purpose was to investigate the effect of latex particle diameter on the coating structure while keeping all other parameters constant.
50
As thickener, 0.5 pph carboxymethyl cellulose (Finnfix 10, CP Kelco Oy, Äänekoski, Finland) was used in the recipes for all the coatings prepared in both Paper I and Paper II.
5.1.4 Coating The coatings were applied by means of a bench coater, K202 Control Coater (RK Print Ltd., Royston, UK) using a series of wire-wound rods. The coatings investigated in Paper I were applied using four different rods, Nos. 3, 4, 6 and 8. This resulted in coat weights of 16, 26, 43 and 71 g/m2. Three rods, Nos. 3, 4 and 6 were used in Paper II, resulting in coat weights of approximately 18, 33 and 48 g/m2 for all types of coating colours. The coated substrates were dried at 105°C for two minutes in a laboratory oven to ensure sufficient time for film formation of the latex.
5.1.5 Calendering A soft-nip laboratory calender (Oy Gradek AB, Kauniainen, Finland) was used, fitted with a heated steel roll and a soft polymer roll. The samples used in Paper I were subjected to 1-10, 15 and 20 nips at a line load of 300 kN/m. Before calendering, and after each of the first ten nips and after the fifteenth and the twentieth nip, the gloss and brightness were measured. For Paper II, the samples were exposed to two calendering conditions: one nip at 100 kN/m and three nips at 100 kN/m. Both uncalendered and calendered samples were investigated. All the trials were performed at a calender speed of 34 m/min, and a calendering temperature of 50°C in a controlled climate room of 23°C and 50 % RH.
5.1.6 Measurement of optical and structural properties Gloss measurements were made using a gloss meter (Zehntner glossmeter, 20°-75°, Shropshire, UK) at 75° according to ISO 8254-1. For the brightness (R457) measurements, a Minolta 3630 Brightness tester (Basildon Essex, UK) was used. The reflectance factors were measured using a black background (R0), a plastic plate that is a part of the equipment, and a white background (Rw) consisting of a pile of coated samples. A STFI Thickness tester (M201, Innventia, Stockholm, Sweden) was used for the thickness measurements. Reflectometry (Surftopic imaging reflectometer, Surfoptic Ltd, Hereford, UK) was used to measure the refractive index and the micro-roughness. All these measurements were carried out at 23°C and 50 % RH.
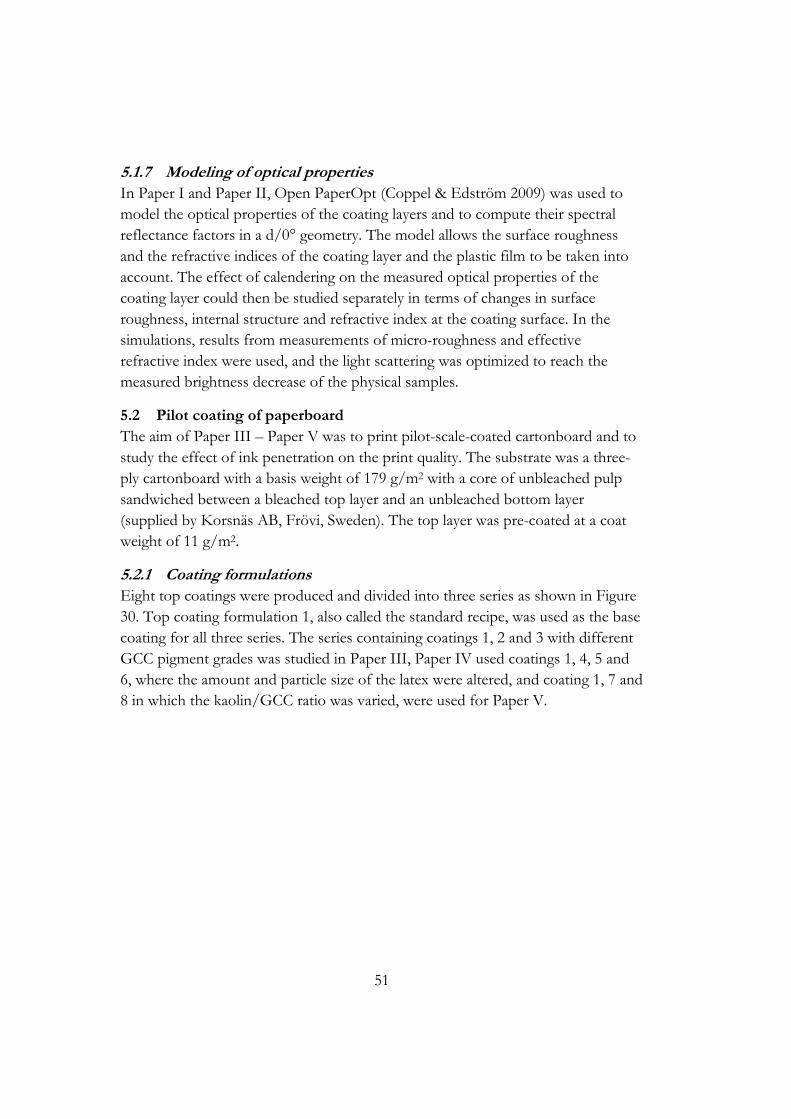
51
5.1.7 Modeling of optical properties In Paper I and Paper II, Open PaperOpt (Coppel & Edström 2009) was used to model the optical properties of the coating layers and to compute their spectral reflectance factors in a d/0° geometry. The model allows the surface roughness and the refractive indices of the coating layer and the plastic film to be taken into account. The effect of calendering on the measured optical properties of the coating layer could then be studied separately in terms of changes in surface roughness, internal structure and refractive index at the coating surface. In the simulations, results from measurements of micro-roughness and effective refractive index were used, and the light scattering was optimized to reach the measured brightness decrease of the physical samples.
5.2 Pilot coating of paperboard The aim of Paper III – Paper V was to print pilot-scale-coated cartonboard and to study the effect of ink penetration on the print quality. The substrate was a three-ply cartonboard with a basis weight of 179 g/m2 with a core of unbleached pulp sandwiched between a bleached top layer and an unbleached bottom layer (supplied by Korsnäs AB, Frövi, Sweden). The top layer was pre-coated at a coat weight of 11 g/m2.
5.2.1 Coating formulations Eight top coatings were produced and divided into three series as shown in Figure 30. Top coating formulation 1, also called the standard recipe, was used as the base coating for all three series. The series containing coatings 1, 2 and 3 with different GCC pigment grades was studied in Paper III, Paper IV used coatings 1, 4, 5 and 6, where the amount and particle size of the latex were altered, and coating 1, 7 and 8 in which the kaolin/GCC ratio was varied, were used for Paper V.
52
Figure 30. Three series of samples with different variations in coating formulation were produced on a pilot scale. Formulation 1 was the base for all three series. Coatings 1, 2 and 3 varied in GCC pigment grade, coatings 1, 4, 5 and 6 varied in latex content and latex particle size, and coatings 1, 7 and 8 differed in the ratio of kaolin clay/GCC.
5.2.2 Coating and calendering The coating for Papers III-V was performed on the pilot machine at Korsnäs AB, Frövi, Sweden at a speed of 500 m/min using a bent ceramic blade held at a blade angle of 19°. The coated cartonboard was dried by means of four separate IR dryers operated at a power of 20% each, followed by a hot air dryer at a temperature of 160°C. The resulting coat weight was 12 g/m2 for all the top coatings. Calendering was done on-line in a soft nip with a rubber roll of hardness 65° Shore D and a steel roll held at a temperature of 100°C. The line load was set to 100 kN/m.
In Paper III, top coating was carried out with three different coating colours containing 100 parts of ground calcium carbonate (GCC) of various particle size distributions (PSD), all supplied by Omya AB, Malmö, Sweden. The standard recipe (Figure 30) consisted of broad PSD (Hydrocarb 90, denoted Broad PSD - 64), narrow PSD (Covercarb 75, denoted Narrow PSD - 75) and broad PSD with a small particle size (Setacarb HG, denoted Broad PSD - 90). The figures in the

53
sample denotations refer to the percentage of particles below 1 µm in size (Table 1).
Table 1. Particle size data (supplier information).
The binder was a SB-latex with a Tg of 24°C and a particle size of 120 nm (supplied by Eka Polymer Latex Oy, Oulu, Finland), added at 12 parts per hundred parts of pigment. Sterocoll FD (BASF Paper Chemicals, Ludwigshafen, Germany) was added as thickener at 0.3 parts per hundred parts of pigment. The coating colours were diluted to a target Brookfield viscosity of 1000 mPas (spindle No. 4, 100 rpm), resulting in solids content values of 67% for Broad PSD – 64 and Broad PSD - 90, and 63% for Narrow PSD - 75.
The purpose of Paper IV was to relate print quality aspects to ink penetration of water-based flexographic ink into coatings with differently engineered properties caused by varied latex amount and latex particle size. Four different coating colours, numbered 1, 4, 5 and 6 as shown in Figure 30, each containing 100 pph GCC (Hydrocarb 90, Omya AB, Malmö, Sweden) was used. Two SB-latices with Tg 24°C and a particle size of 120 nm and 160 nm respectively (Eka Synthomer Oy, Oulu, Finland) were added at either 12 or 18 pph. The samples were denoted 120-12, 120-18, 160-12 and 160-18, with numbers indicating particle size and amount, respectively.
Top coatings 1, 7 and 8 (Figure 30), was studied in Paper V. Different amounts of kaolin clay (Capim DG, Imerys, Great Britain) were added to coating colours 7 and 8, and the ratios of kaolin/GCC for the three coatings were 0/100, 20/80 and 50/50.
5.2.3 Analysis of coated paperboard The surface roughness in µm of coated surfaces was determined by a Parker Print Surf (PPS) device operated at a clamping pressure of 1.0 MPa (Testing Machines Inc., New York, USA). Gloss and brightness were measured as described above (5.1.6).
Pigment Specific surface Particles Particles Particles Name
area (m²/g) < 2 µm (%) < 1 µm (%) < 0.2 µm (%)
Broad PSD 12.5 90 64 17 Broad PSD ‐ 64
Narrow PSD 10.0 95 75 12 Narrow PSD ‐ 75
Small particles, broad PSD 19.2 98 90 30 Broad PSD ‐ 90
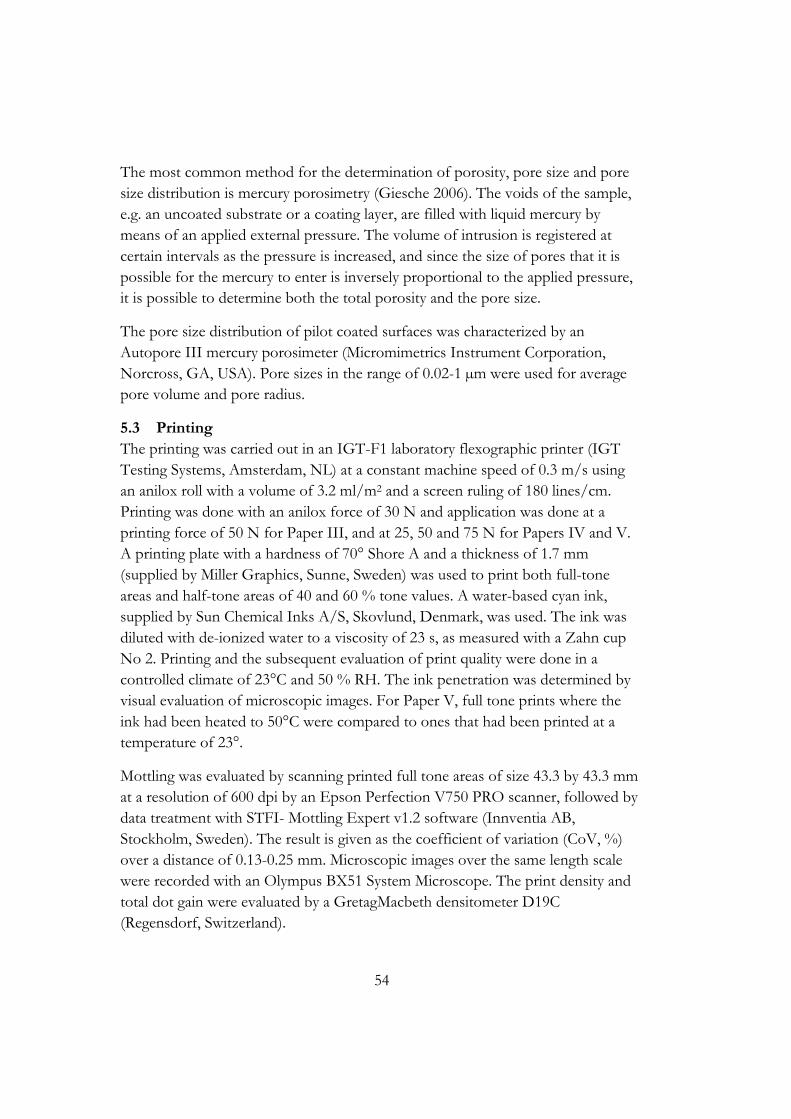
54
The most common method for the determination of porosity, pore size and pore size distribution is mercury porosimetry (Giesche 2006). The voids of the sample, e.g. an uncoated substrate or a coating layer, are filled with liquid mercury by means of an applied external pressure. The volume of intrusion is registered at certain intervals as the pressure is increased, and since the size of pores that it is possible for the mercury to enter is inversely proportional to the applied pressure, it is possible to determine both the total porosity and the pore size.
The pore size distribution of pilot coated surfaces was characterized by an Autopore III mercury porosimeter (Micromimetrics Instrument Corporation, Norcross, GA, USA). Pore sizes in the range of 0.02-1 µm were used for average pore volume and pore radius.
5.3 Printing The printing was carried out in an IGT-F1 laboratory flexographic printer (IGT Testing Systems, Amsterdam, NL) at a constant machine speed of 0.3 m/s using an anilox roll with a volume of 3.2 ml/m2 and a screen ruling of 180 lines/cm. Printing was done with an anilox force of 30 N and application was done at a printing force of 50 N for Paper III, and at 25, 50 and 75 N for Papers IV and V. A printing plate with a hardness of 70° Shore A and a thickness of 1.7 mm (supplied by Miller Graphics, Sunne, Sweden) was used to print both full-tone areas and half-tone areas of 40 and 60 % tone values. A water-based cyan ink, supplied by Sun Chemical Inks A/S, Skovlund, Denmark, was used. The ink was diluted with de-ionized water to a viscosity of 23 s, as measured with a Zahn cup No 2. Printing and the subsequent evaluation of print quality were done in a controlled climate of 23°C and 50 % RH. The ink penetration was determined by visual evaluation of microscopic images. For Paper V, full tone prints where the ink had been heated to 50°C were compared to ones that had been printed at a temperature of 23°.
Mottling was evaluated by scanning printed full tone areas of size 43.3 by 43.3 mm at a resolution of 600 dpi by an Epson Perfection V750 PRO scanner, followed by data treatment with STFI- Mottling Expert v1.2 software (Innventia AB, Stockholm, Sweden). The result is given as the coefficient of variation (CoV, %) over a distance of 0.13-0.25 mm. Microscopic images over the same length scale were recorded with an Olympus BX51 System Microscope. The print density and total dot gain were evaluated by a GretagMacbeth densitometer D19C (Regensdorf, Switzerland).
55
5.4 Microscopic analysis of coated surfaces and prints The microscopic techniques used in this thesis were optical microscopy and scanning electron microscopy (Figure 31). Optical microscopy uses visible light and produces images that can be directly observed by the human eye. It is therefore useful when details that we can normally see are being studied, such as differences in shade or colour. For this reason optical microscopy was used to study ink behaviour, such as ink spreading on surfaces and ink penetration into coating layers. When a light absorbing ink is used, it can clearly be distinguished from the surrounding coating and paper materials. However, there are limitations in the size of details an optical microscope can register. Beyond this limit, it is impossible to reveal and separate points of different colour variations. The limit is dependent on the wavelength of light (about 380 to 740 nm), but is also affected by the light source, microscopic lenses and the properties of the studied sample.
A microscopic technique which does not use visible light is scanning electron microscopy (SEM), where the sample is scanned with a focused beam of electrons that interact with atoms on the surface. The signals from these interactions are registered and used to make a topographical image of the sample. The result is a black-and-white image that reveals the structure and composition of the sample, but often the images are coloured afterwards to clarify certain details. The SEM technique can achieve a resolution of 1 nm.
Figure 31. Examples of photomicrograph (left) and SEM micrograph (right). The left-hand image shows a coated surface printed with half tone dots (appearing as dark circles), and the right-hand image is a coated unprinted surface. Note the different sizes of the scale bars. The magnification is 20 x (left) and 8500 x (right).
The penetration of printing ink was evaluated by investigating photomicrographs of cross-sections of printed material. To achieve a more distinct contrast, the brightest layers were excluded from the images by software processing. The thicknesses of layers and mixed layers of ink and coating material were evaluated
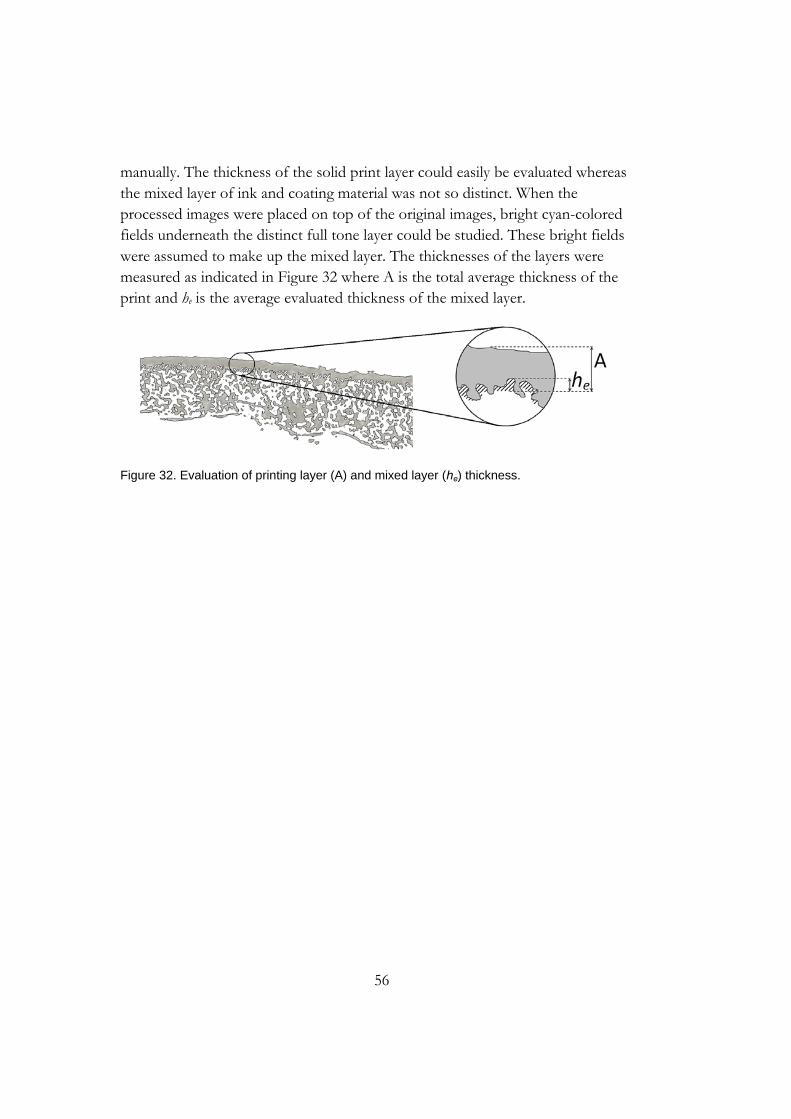
56
manually. The thickness of the solid print layer could easily be evaluated whereas the mixed layer of ink and coating material was not so distinct. When the processed images were placed on top of the original images, bright cyan-colored fields underneath the distinct full tone layer could be studied. These bright fields were assumed to make up the mixed layer. The thicknesses of the layers were measured as indicated in Figure 32 where A is the total average thickness of the print and he is the average evaluated thickness of the mixed layer.
Figure 32. Evaluation of printing layer (A) and mixed layer (he) thickness.
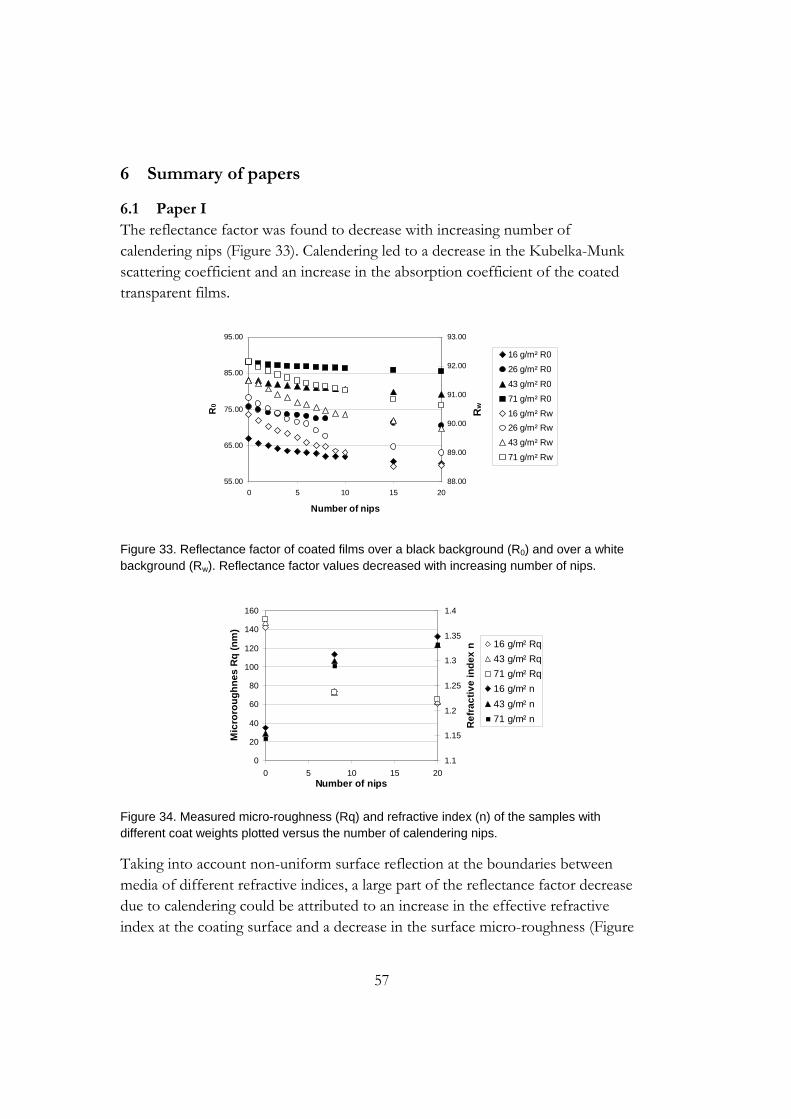
57
6 Summary of papers
6.1 Paper I The reflectance factor was found to decrease with increasing number of calendering nips (Figure 33). Calendering led to a decrease in the Kubelka-Munk scattering coefficient and an increase in the absorption coefficient of the coated transparent films.
Figure 33. Reflectance factor of coated films over a black background (R0) and over a white background (Rw). Reflectance factor values decreased with increasing number of nips.
Figure 34. Measured micro-roughness (Rq) and refractive index (n) of the samples with different coat weights plotted versus the number of calendering nips.
Taking into account non-uniform surface reflection at the boundaries between media of different refractive indices, a large part of the reflectance factor decrease due to calendering could be attributed to an increase in the effective refractive index at the coating surface and a decrease in the surface micro-roughness (Figure
55.00
65.00
75.00
85.00
95.00
0 5 10 15 20
Number of nips
R0
88.00
89.00
90.00
91.00
92.00
93.00
Rw
16 g/m² R0
26 g/m² R0
43 g/m² R0
71 g/m² R0
16 g/m² Rw
26 g/m² Rw
43 g/m² Rw
71 g/m² Rw
0
20
40
60
80
100
120
140
160
0 5 10 15 20Number of nips
Mic
roro
ug
hn
es
Rq
(n
m)
1.1
1.15
1.2
1.25
1.3
1.35
1.4
Re
fra
cti
ve
in
de
x n 16 g/m² Rq
43 g/m² Rq
71 g/m² Rq
16 g/m² n
43 g/m² n
71 g/m² n
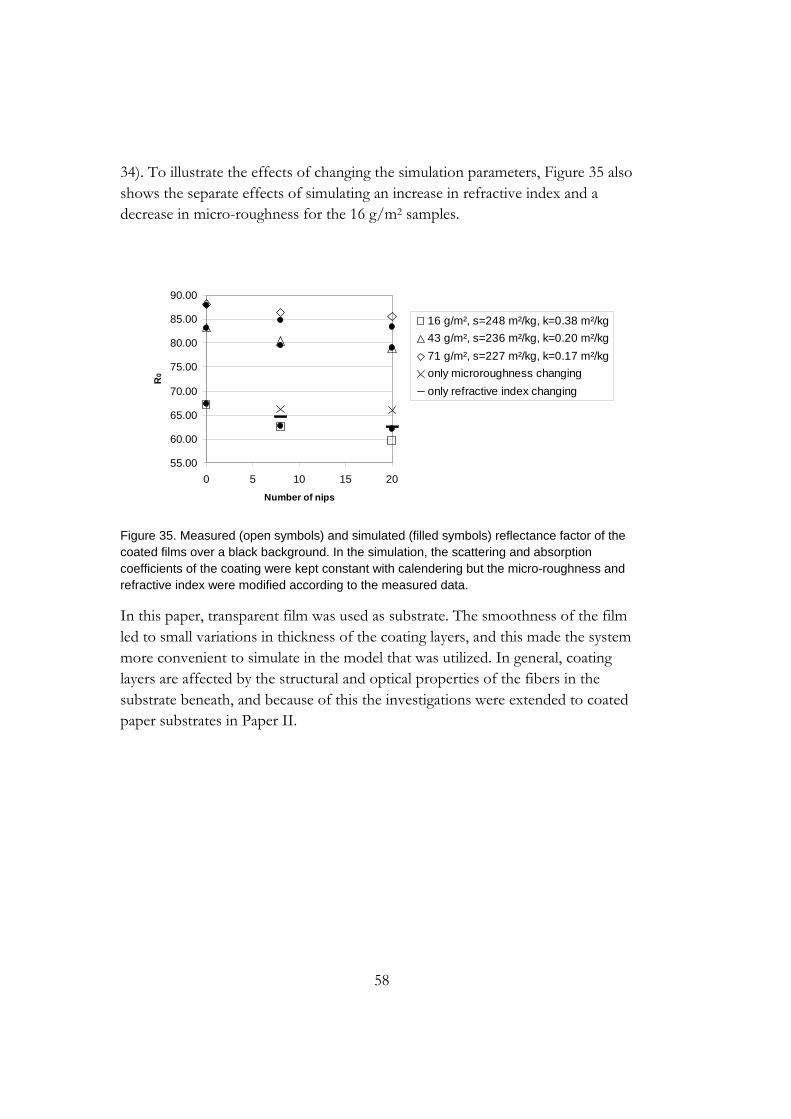
58
34). To illustrate the effects of changing the simulation parameters, Figure 35 also shows the separate effects of simulating an increase in refractive index and a decrease in micro-roughness for the 16 g/m2 samples.
Figure 35. Measured (open symbols) and simulated (filled symbols) reflectance factor of the coated films over a black background. In the simulation, the scattering and absorption coefficients of the coating were kept constant with calendering but the micro-roughness and refractive index were modified according to the measured data.
In this paper, transparent film was used as substrate. The smoothness of the film led to small variations in thickness of the coating layers, and this made the system more convenient to simulate in the model that was utilized. In general, coating layers are affected by the structural and optical properties of the fibers in the substrate beneath, and because of this the investigations were extended to coated paper substrates in Paper II.
55.00
60.00
65.00
70.00
75.00
80.00
85.00
90.00
0 5 10 15 20
Number of nips
R0
16 g/m², s=248 m²/kg, k=0.38 m²/kg
43 g/m², s=236 m²/kg, k=0.20 m²/kg
71 g/m², s=227 m²/kg, k=0.17 m²/kg
only microroughness changing
only refractive index changing
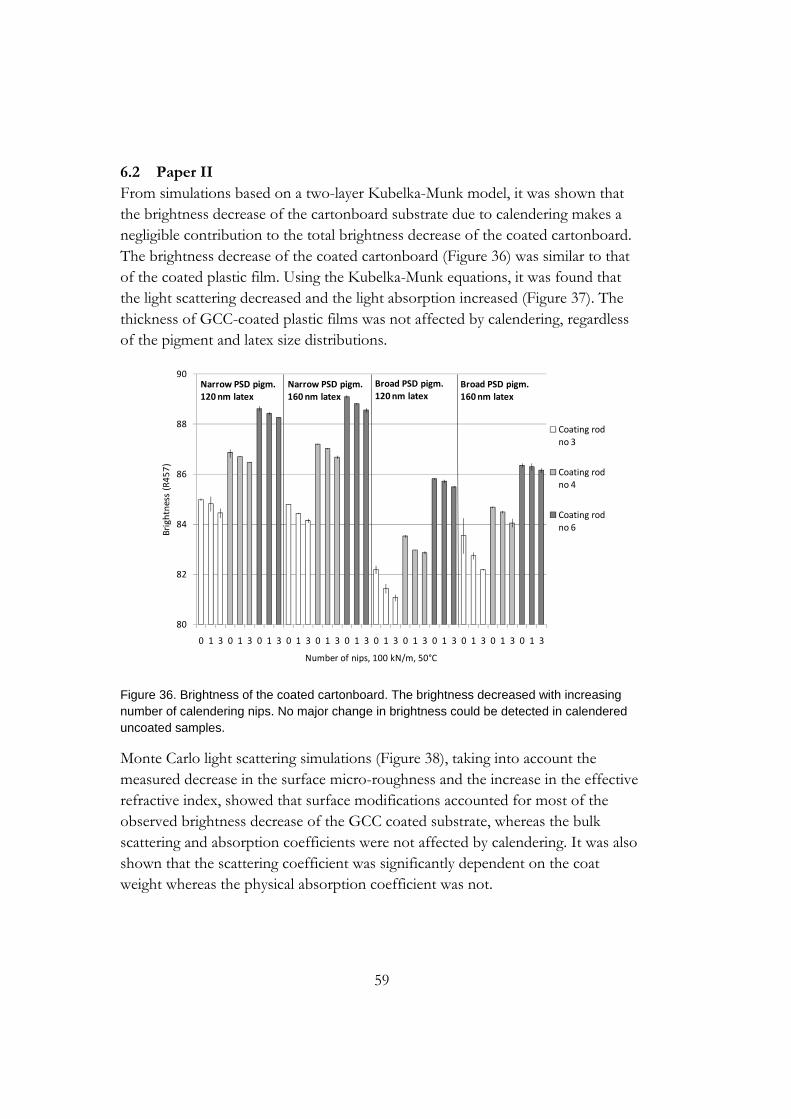
59
6.2 Paper II From simulations based on a two-layer Kubelka-Munk model, it was shown that the brightness decrease of the cartonboard substrate due to calendering makes a negligible contribution to the total brightness decrease of the coated cartonboard. The brightness decrease of the coated cartonboard (Figure 36) was similar to that of the coated plastic film. Using the Kubelka-Munk equations, it was found that the light scattering decreased and the light absorption increased (Figure 37). The thickness of GCC-coated plastic films was not affected by calendering, regardless of the pigment and latex size distributions.
Figure 36. Brightness of the coated cartonboard. The brightness decreased with increasing number of calendering nips. No major change in brightness could be detected in calendered uncoated samples.
Monte Carlo light scattering simulations (Figure 38), taking into account the measured decrease in the surface micro-roughness and the increase in the effective refractive index, showed that surface modifications accounted for most of the observed brightness decrease of the GCC coated substrate, whereas the bulk scattering and absorption coefficients were not affected by calendering. It was also shown that the scattering coefficient was significantly dependent on the coat weight whereas the physical absorption coefficient was not.
80
82
84
86
88
90
0 1 3 0 1 3 0 1 3 0 1 3 0 1 3 0 1 3 0 1 3 0 1 3 0 1 3 0 1 3 0 1 3 0 1 3
Brightness (R457)
Number of nips, 100 kN/m, 50°C
Coating rod no 3
Coating rod no 4
Coating rod no 6
Narrow PSD pigm.120 nm latex
Narrow PSD pigm.160 nm latex
Broad PSD pigm.120 nm latex
Broad PSD pigm.160 nm latex

60
Figure 37. Calculated Kubelka-Munk light scattering (above) and absorption (below) coefficients for both cartonboard and plastic film coated with a narrow particle size distribution and 120 nm latex particle size. S decreased and K increased with increasing number of nips. Both increased with increasing coat weight.
Figure 38. Measured (filled symbols) and simulated (open symbols) reflectance factor for coated cartonboard. The scattering and light absorption coefficients were determined from coated transparent films. Neglecting any modification of the cartonboard substrate, the brightness decrease of these GCC coatings due to calendering can be fully predicted by an increase in the effective refractive index and a decrease in the micro-roughness.
109110111112113114115116117118
0 1 2 3
Light scattering, S (m
2 /kg)
Number of nips, 100 kN/m, 50°C
S, coated plastic film 32 g/m²
S, coated plastic film 45 g/m²
S, coated cartonboard 33 g/m²
S, coated cartonboard 48 g/m²
00.020.040.060.080.1
0.120.140.16
0 1 2 3Light absorption, K (m
2/kg)
Number of nips, 100 kN/m, 50°C
K, coated plastic film 32 g/m²
K, coated plastic film 45 g/m²
K, coated cartonboard 33 g/m²
K, coated cartonboard 48 g/m²
78
80
82
84
86
88
90
92
0 1 3 0 1 3 0 1 3 0 1 3 0 1 3 0 1 3 0 1 3 0 1 3 0 1 3 0 1 3 0 1 3 0 1 3
18 g/m² 33 g/m² 48 g/m² 19 g/m² 32 g/m² 44 g/m² 11 g/m² 21 g/m² 46 g/m² 19 g/m² 27 g/m² 46 g/m²
R0
(%)
Number of nips, 100 kN/m, 50°C and coatweight (g/m2)
Measured
Simulated
Narrow PSD pigm.120 nm latex
Narrow PSD pigm.160 nm latex
Broad PSD pigm.120 nm latex
Broad PSD pigm.160 nm latex
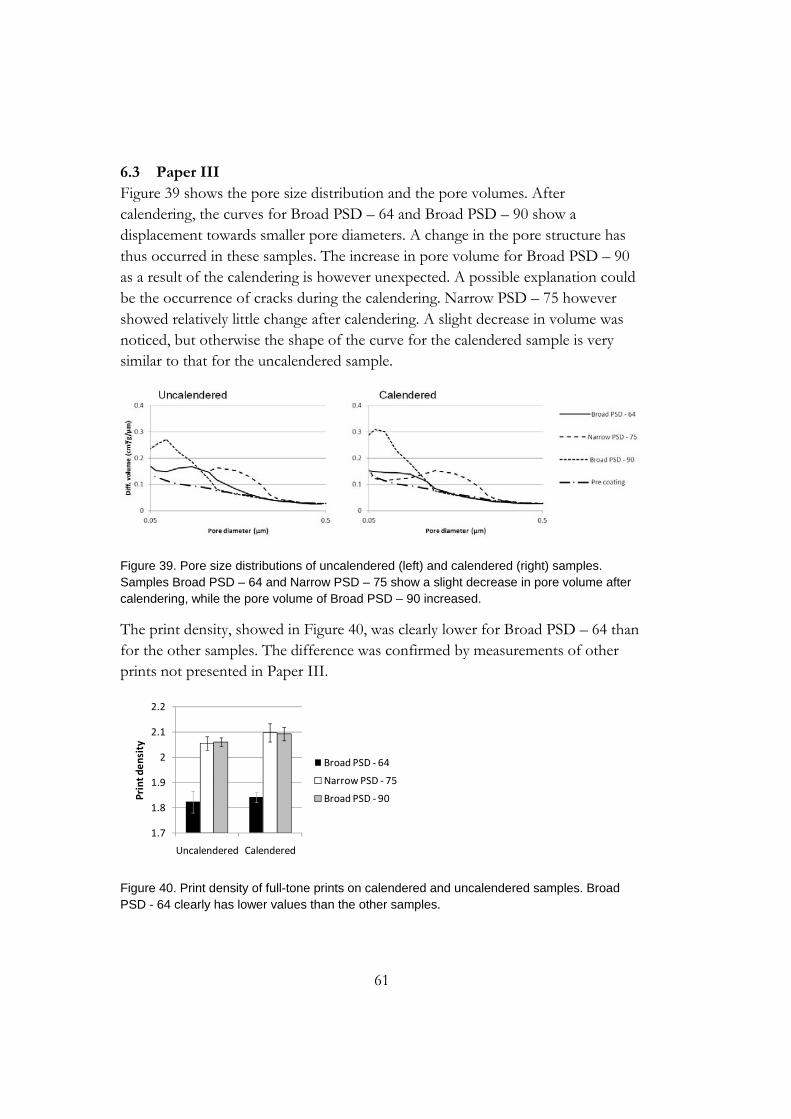
61
6.3 Paper III Figure 39 shows the pore size distribution and the pore volumes. After calendering, the curves for Broad PSD – 64 and Broad PSD – 90 show a displacement towards smaller pore diameters. A change in the pore structure has thus occurred in these samples. The increase in pore volume for Broad PSD – 90 as a result of the calendering is however unexpected. A possible explanation could be the occurrence of cracks during the calendering. Narrow PSD – 75 however showed relatively little change after calendering. A slight decrease in volume was noticed, but otherwise the shape of the curve for the calendered sample is very similar to that for the uncalendered sample.
Figure 39. Pore size distributions of uncalendered (left) and calendered (right) samples. Samples Broad PSD – 64 and Narrow PSD – 75 show a slight decrease in pore volume after calendering, while the pore volume of Broad PSD – 90 increased.
The print density, showed in Figure 40, was clearly lower for Broad PSD – 64 than for the other samples. The difference was confirmed by measurements of other prints not presented in Paper III.
Figure 40. Print density of full-tone prints on calendered and uncalendered samples. Broad PSD - 64 clearly has lower values than the other samples.
1.7
1.8
1.9
2
2.1
2.2
Uncalendered Calendered
Print density
Broad PSD ‐ 64
Narrow PSD ‐ 75
Broad PSD ‐ 90
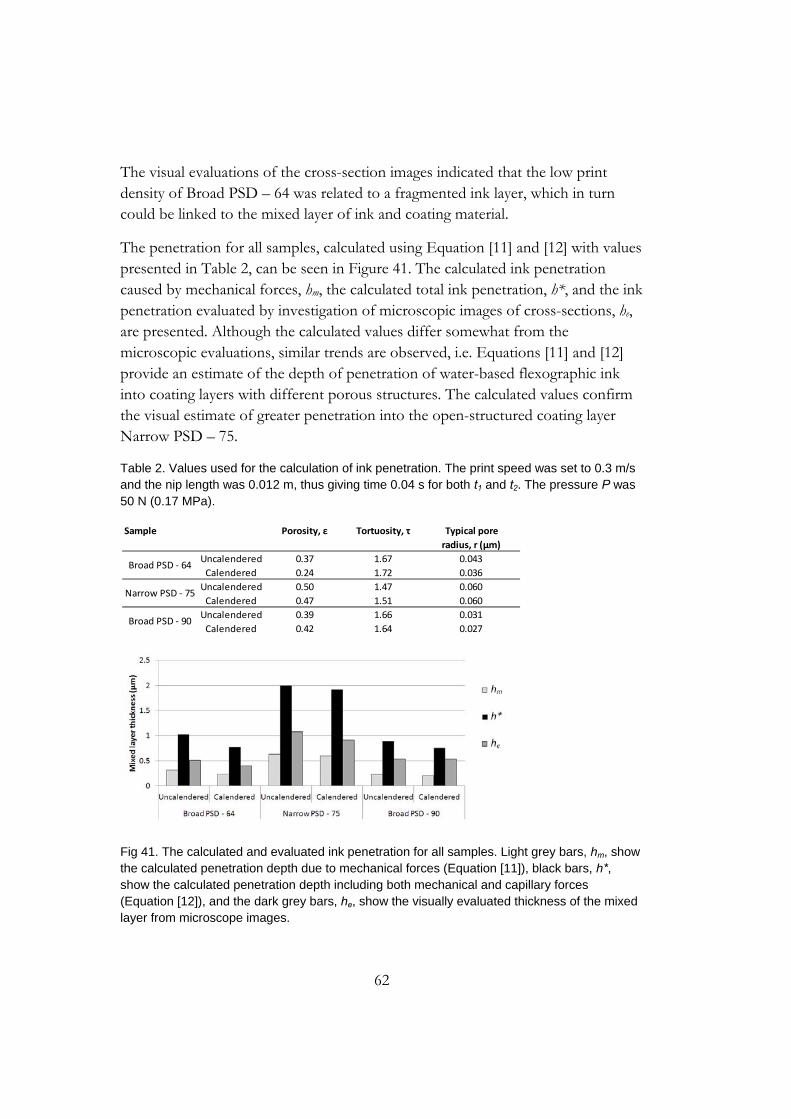
62
The visual evaluations of the cross-section images indicated that the low print density of Broad PSD – 64 was related to a fragmented ink layer, which in turn could be linked to the mixed layer of ink and coating material.
The penetration for all samples, calculated using Equation [11] and [12] with values presented in Table 2, can be seen in Figure 41. The calculated ink penetration caused by mechanical forces, hm, the calculated total ink penetration, h*, and the ink penetration evaluated by investigation of microscopic images of cross-sections, he, are presented. Although the calculated values differ somewhat from the microscopic evaluations, similar trends are observed, i.e. Equations [11] and [12] provide an estimate of the depth of penetration of water-based flexographic ink into coating layers with different porous structures. The calculated values confirm the visual estimate of greater penetration into the open-structured coating layer Narrow PSD – 75.
Table 2. Values used for the calculation of ink penetration. The print speed was set to 0.3 m/s and the nip length was 0.012 m, thus giving time 0.04 s for both t1 and t2. The pressure P was 50 N (0.17 MPa).
Fig 41. The calculated and evaluated ink penetration for all samples. Light grey bars, hm, show the calculated penetration depth due to mechanical forces (Equation [11]), black bars, h*, show the calculated penetration depth including both mechanical and capillary forces (Equation [12]), and the dark grey bars, he, show the visually evaluated thickness of the mixed layer from microscope images.
Sample Porosity, ε Tortuosity, τ Typical pore
radius, r (µm)
Uncalendered 0.37 1.67 0.043
Calendered 0.24 1.72 0.036
Uncalendered 0.50 1.47 0.060
Calendered 0.47 1.51 0.060
Uncalendered 0.39 1.66 0.031
Calendered 0.42 1.64 0.027
Broad PSD ‐ 64
Narrow PSD ‐ 75
Broad PSD ‐ 90
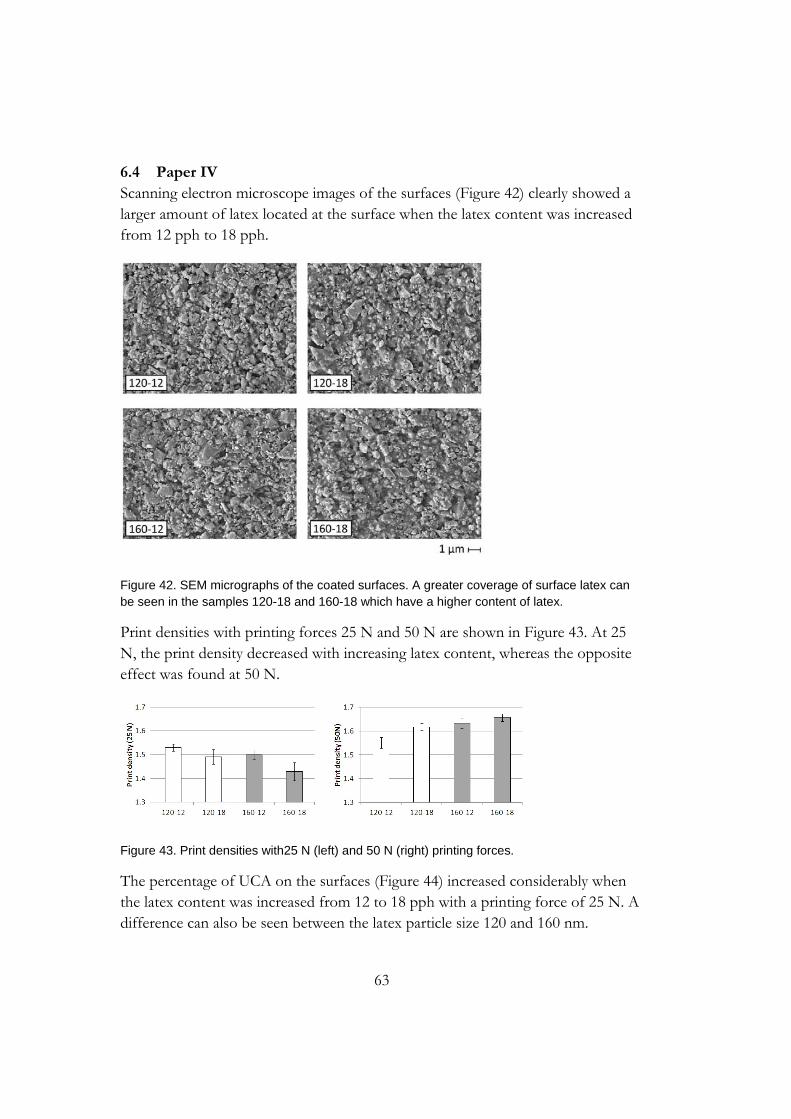
63
6.4 Paper IV Scanning electron microscope images of the surfaces (Figure 42) clearly showed a larger amount of latex located at the surface when the latex content was increased from 12 pph to 18 pph.
Figure 42. SEM micrographs of the coated surfaces. A greater coverage of surface latex can be seen in the samples 120-18 and 160-18 which have a higher content of latex.
Print densities with printing forces 25 N and 50 N are shown in Figure 43. At 25 N, the print density decreased with increasing latex content, whereas the opposite effect was found at 50 N.
Figure 43. Print densities with25 N (left) and 50 N (right) printing forces.
The percentage of UCA on the surfaces (Figure 44) increased considerably when the latex content was increased from 12 to 18 pph with a printing force of 25 N. A difference can also be seen between the latex particle size 120 and 160 nm.

64
Figure 44. Percentage of UCA for the four samples with a printing force of 25 N.
Figure 45 shows the calculated ink penetration at a printing force of 25 N compared to the estimated fraction of latex-free surface on the samples. The similar trend that is also seen in the estimated ink penetration suggests that the more closed surface due to a larger amount of latex, prevents the ink from penetrating.
Figure 45. Calculated ink penetration with a printing force of 25 N, and estimated fraction of surface area free from latex.
This study showed that local areas of latex-covered and latex-free regions have different effects on the ink transfer, the subsequent ink setting and the print quality. The results also suggested that an increase in latex particle size led to an increase in porosity, which in turn increased the ink penetration. An increase in surface roughness and a local variation in wettability increased the presence of UCAs. With increasing printing force, the print density increased and the presence of UCAs decreased to almost zero.
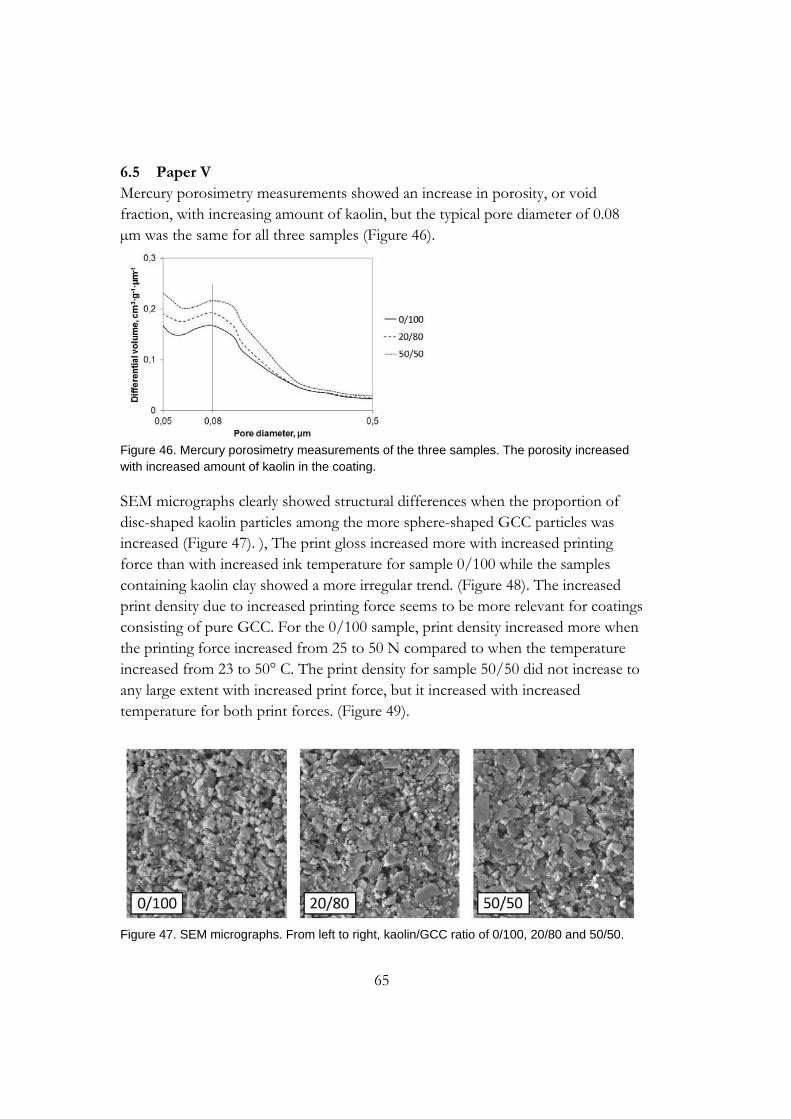
65
6.5 Paper V Mercury porosimetry measurements showed an increase in porosity, or void fraction, with increasing amount of kaolin, but the typical pore diameter of 0.08 µm was the same for all three samples (Figure 46).
Figure 46. Mercury porosimetry measurements of the three samples. The porosity increased with increased amount of kaolin in the coating.
SEM micrographs clearly showed structural differences when the proportion of disc-shaped kaolin particles among the more sphere-shaped GCC particles was increased (Figure 47). ), The print gloss increased more with increased printing force than with increased ink temperature for sample 0/100 while the samples containing kaolin clay showed a more irregular trend. (Figure 48). The increased print density due to increased printing force seems to be more relevant for coatings consisting of pure GCC. For the 0/100 sample, print density increased more when the printing force increased from 25 to 50 N compared to when the temperature increased from 23 to 50° C. The print density for sample 50/50 did not increase to any large extent with increased print force, but it increased with increased temperature for both print forces. (Figure 49).
Figure 47. SEM micrographs. From left to right, kaolin/GCC ratio of 0/100, 20/80 and 50/50.

66
Figure 48. Print gloss as a function of kaolin/GCC ratio, ink temperature and printing force.
Figure 49. Print density as a function of kaolin/GCC ratio, ink temperature and printing force.
The result described in this work suggests that there is a connection between penetrated ink and the print gloss. The black dots in Figure 50 represent all the twelve printed samples used in this work. The print gloss decreased with increased ink penetration depth.
Figure 50. Print gloss as a function of ink penetration. The print gloss decreased with increased ink penetration depth.
67
7 Conclusions Calendering of coated plastic film led to a decrease in the Kubelka-Munk light scattering coefficient and an increase in the absorption coefficient. This could be attributed to a change in the coating structure and porosity, but this was not supported by other results where, for example, the thickness remained constant after calendering. Taking into account non-uniform surface reflection at the boundaries between media of different refractive indices, the decrease in the reflectance factors could instead be attributed to a change in the refractive index and micro-roughness at the coating surface. Even though results of previous studies have shown a compression of coating layers containing pure GCC pigments after calendering, the results of this work, using GCC pigments with a broad PSD, showed no such thickness decrease.
When subjected to the same calendering conditions, the brightness decrease of both the coated transparent films and the coated cartonboard was of a similar magnitude. The substrate thus had a negligible influence and the observed brightness decrease should therefore be attributed to changes in the coating layer. Given that the thickness of the coated non-deformable plastic films remained constant, it is reasonable to believe that the bulk scattering was not affected by the calendering. Most of the brightness decrease was instead attributed to a modification of the coating surface micro-roughness and of the effective refractive index. The decrease in micro-roughness leads to more specular reflection that does not reach the detector. The change in effective refractive index had a greater impact. Densification at the top surface leads to an increase in the effective refractive index and an increase in the internal reflection not fully compensated by an increase in the first surface reflection.
The print quality is probably dependent on a combination of differences in ink transfer and ink setting on the substrates. The print density increased and the dot gain decreased as the coating pore structure became more open. Small-size scale mottling (<0.25 mm) also decreased as the porous structure became more open. The importance of the pressure developed in the flexographic printing nip was indicated by the influence of a large pore volume and a large pore size that appear to increase the ink penetration. Thus, the design of coatings for improved printing and print quality performance for water-based flexographic ink should take into consideration all the ink penetration mechanisms (including the pressure-driven penetration).

68
Local areas of latex-covered and latex-free regions have different effects on the ink transfer, the subsequent ink setting and the print quality. The results also suggest that an increase in latex particle size leads to an increase in porosity, which in turn increases the ink penetration. An increase in surface roughness and in local variations in wettability increased the presence of UCA. The print density increased and the presence of UCA decreased. The result presented in this work also suggests that the print gloss decreases with increased amount of penetrated ink due to a higher rate of ink vehicle removal and thereby a higher ink surface roughness.
69
8 Future work Future work should involve the study of impact of calendering of coated paperboard with variations in latex content and kaolin clay/GCC blends. Measurements of surface roughness and characterization of surface topographic structures as well as additional theoretical calculations of ink behavior, could contribute to further understand the impact of structure variations on print quality. Surface energy should be determined for coatings with varied proportions between kaolin clay and GCC and possible local variations in wettability should also be considered for since these variables are likely to affect the penetration of ink.
For the coatings with varied kaolin clay/GCC blends several additional samples, printed at different printing forces and using ink with varied viscosity, was produced. A further investigation of these parameters could contribute to a deeper understanding of the connection between ink penetration and the resulting optical properties of the printed surfaces. Printing defects, such as mottling and UCA, could also be investigated. Considering the large matrix of causes and responses, multivariate statistical analysis would be a valuable tool for further studies.
Results from the studies of ink penetration and the following print appearance could be used for further development of models that simulates the complex system of paper, coating and ink. Further studies of the blended layer of ink and coating material underneath a printed area, and its impact on print quality, would provide a useful tool for design of future paper and print.

70
9 Acknowledgements I first wish to thank my main supervisor Associate Professor Caisa Johansson for all her help. Thank you Caisa for always being supporting, for your positive attitude and for always keeping a good atmosphere!
I also thank my assistant supervisors Professor Per Edström and Professor Magnus Lestelius for structuring my work and for all our constructive discussions. Thank you all for your support.
Dr. Ludovic Gustafsson Coppel is thanked for good collaboration in this project. I also wish to thank the PhD students and all the associated members of the PaperOpt project for their support.
The Swedish Governmental Agency for Innovation Systems (VINNOVA) and the industrial participants in the PaperOpt project are gratefully acknowledged for their financial support. BillerudKorsnäs Frövi is thanked for performing the pilot coating. Imerys, Synthomer, Omya, Stora Enso and SCA are thanked for supplying material and for performing measurements. Thank you all for taking an interest in my work and for your commitment.
Associate Professor Anthony Bristow is thanked for the linguistic review of this thesis. Thank you for not only correcting my language, but also for guidance and help regarding the content. Dr Henrik Ullsten is also thanked for his valuable comments on the content of this thesis.
My friends and colleagues at Karlstad University are thanked for all their help and support, and also for reminding me of coffee breaks and lunch times.
Finally I wish to thank my family for their understanding and support.
71
10 References
Al-Turaif, H. A.; Bousfield, D. W. (2005) The influence of pigment size distribution and morphology on coating binder migration. Nordic Pulp and Paper Research Journal, 20 (3), 335-344.
Arney, J. S.; Ye, L.; Wible, J.; Oswald, T. (2006) Analysis of paper gloss. Journal of Pulp and Paper Science, 32 (1), 19-23.
Aschan, P.J. (1973) Drying of Coated Board and Binder Migration. Tappi Journal, 56 (4), 78-81.
Aspler, J. S.; Davis, S.; Lyne, M. B. (1987) The surface chemistry of paper in relation to dynamic wetting and sorption of water and lithographic fountain solutions. Journal of Pulp and Paper Science, v 13, n 2, p 55-60.
Bakker, J. W. P.; Bryntse, G.; Arwin, H (2004). Determination of refractive index of printed and unprinted paper using spectroscopic ellipsometry. In The 3rd International Conference on Spectroscopic Ellipsometry, July 6, 2003 - July 11. Vienna, Austria: Elsevier. 361.
Barros, G. G.; Fahlcrantz C. M.; Johansson P. Å. (2005) Topographic Distribution of Uncovered Areas (UCA) in Full tone Flexographic Prints. TAGA Journal 2 (1), 43-57.
Barros, G. G.; Johansson, P. Å. (2006) Prediction of uncoverd area occurrence in flexography – A feasibility study. Nordic Pulp Paper Res. J. 21(2):172-179.
Barros, G. G.; Fahlcrantz, C. M.; Johansson, P. Å. (2004) Topographic distribution of Uncovered Areas (UCA) in full tone flexographic prints. Proceedings of the Technical Association of the Graphic Arts, TAGA, p 127-145.
Berns, R. S. (2000) Billmeyer and Saltzman's Principles of Color Technology. (3rd ed.). USA: John Wiley & Sons, Inc.
Bohan, M. F. J.; Claypole, T. C.; Gethin, D. T.; Megat Ahmed, M.M.H. (2000) A model for ink impression in printing contacts. J.Pulp Paper Sci., 26, 11, 414-419, Pulp and Paper Technical Association of Canada.
Bohnenkamp, B., Tietz, M.; Trefz, M. (2005) New development results of curtain coating for various paper grades. In 2005 TAPPI Coating Conference and Exhibit, April 17, 2005 - April 20. Toronto, ON, Canada: TAPPI Press. 311.
72
Bould, D. C.; Hamblyn, S. M.; Claypole, T. C.; Bohan, M. F. J. (2006) The effect of process characteristics on image reproduction in flexographic printing. 33rd International research conference of IARIGAI, Leipzig, Germany.
Bould, D. C.; Hamblyn, S. M.; Gethin, D. T.; Claypole, T. C. (2011) Effect of impression pressure and anilox specification on solid and halftone density. Proceedings of the Institution of Mechanical Engineers, Part B, Journal of Engineering Manufacture, 225, 5, 699-709.
Browne, T. C.; Crotogino, R. H.; Douglas, W. J. M. (1995) Effect of paper structure on behaviour in a calender nip. Journal of Pulp and Paper Science, v 21, n 10, p 343-347.
Caner, E.; Farnood, R.; Yan, N. (2008) Relationship between gloss and surface texture of coated papers. Tappi Journal, 7 (4), 19-26.
Carman, P.C. (1937) Fluid flow through granular beds. London, Transactions, Institution of Chemical Engineers. 150-166.
Cassie, A. B. D.; Baxter S. (1944) Wettability of porous surfaces. Trans. Faraday Soc., 40, 546-551.
Chinga, G.; Helle, T. (2003) Relationships Between the Coating Surface Structural Variation and Print Quality. Journal of Pulp and Paper Science, 29 (6), 179-184.
Chinga, G.; Helle, T.; Forseth, T. (2002) Quantification of structure details of LWC paper coating layers. Nordic Pulp and Paper Research Journal, 17 (3), 313-318.
Coppel, L.; Lindberg, S.; Rydefalk, S. (2007) Whiteness Assessment of Paper Samples at the Vicinity of the Upper CIE Whiteness Limit. in Proc. 26th session of the CIE, Beijing, China, p. D1-10
Coppel, L. G.; Edström, P. (2009) Open Source Monte Carlo Simulation Platform for Particle Level Simulation of Light Scattering from Generated Paper Structures. Papermaking Research Symposium. Kuopio, Finland: Papermaking Research Symposium.
Cummings, D. O.; Lyons, A.V (1996) Influence of Engineered Kaolin on Web Offset Blister Resistance. Proc. TAPPI Coating Conference, Nashville, TAPPI Press, Atlanta, p. 16.
Dahlström, C.; Uesaka, T. (2009) New insights into coating uniformity and base sheet structures. Industrial and Engineering Chemistry Research, 48 (23).
73
De Grace, J. H.; Mangin, P. J. (1983) A Mechanistic Approach to Ink Transfer Part I: -Effect of Substrate Properties and Press Conditions. London, UK: Banks, W.H., Ed. Pentech Press. 312-332.
Dean, T. W. R. (1997) The Essential Guide to Aqueous Coating of Paper and Board. Leatherhead, United Kingdom: Paper Industry Technical Association.
della Volpe, C. & Siboni, S. (2000) Acid-base surface free energies of solids and the definition of scales in the Good-van Oss-Chaudhury theory. Journal of Adhesion Science and Technology, 14 (2), 235-272.
Desjumaux, D. M.; Bousfield, D. W.; Aurenty, P. (1998) Dynamics of ink gloss: Influence of ink rheology on leveling. In Proceedings of the 1998 Technical Association of the Graphic Arts, TAGA, April 26, 1998 - April 29. Chicago, IL, USA: TAGA. 618.
Dobler, F.; Holl, Y. (1996) Mechanisms of Particle Deformation During Latex Film Formation. ACS Symposium Series, (648), 22-22.
Donigian, D.W. (2006) A new mechanism for the setting and gloss development of offset ink. Journal of Pulp and Paper Science, v 32, n 3, p 163-177.
Edström, P. (2004) Comparision of the DORT2002 radiative transfer solution method and the Kubelka-Munk model. Nordic Pulp and Paper Research Journal., 19 (3), 397-403.
Edström, P. (2005) A fast and stable solution method for the radiative transfer problem. SIAM Review, 47 (3), 447-468.
El-Sherbiny, S.; Xiao, H. (2005) Characteristics of clay and GCC pigment coatings containing synthetic polymeric thickeners. Appita, 58 (2), 116-121.
Elton, N. J.; Preston, J. S. (2006a) Polarized light reflectometry for studies of paper coating structure Part II. Application to coating structure, gloss and porosity. Tappi Journal, 5 (8), 10-16.
Elton, N. J.; Preston, J. S. (2006b) Polarized light reflectometry for studies of paper coating structure. Part I. Method and instrumentation. Tappi Journal, 5 (7), 8-16.
Emilsson, P.; Veyre, J. (2009) INVO®Tip: A new metering element for coating of board and paper. ATIP.Association Technique de L'Industrie Papetiere, 62 (5), 12-15.
Endres, I.; Engström, G. (2005) Influence of calendering conditions on paper surface characteristics - A comparison between hard-nip, soft-nip, and extended soft-nip calendering. Tappi Journal, 4 (9), 9-14.
74
Engström, G. (1993) Forming and consolidation of a coating layer and their effect on offsetprint mottle. Royal Institute of Technology: Stockholm, Sweden.
Engström, G. & Morin, V. (1996) Analysis of the processes of forming and consolidationin blade coating. Tappi Journal, 79(9): p. 120-128
Engström, G.; Morin, V. (1997) Compression of a coating layer during calendering. 18th PTS Coating Symposium, Munich, 16-18 September, p. 189.
Fahlcrantz, C.; Johansson, P. (2004) A comparison of different print mottle evaluation models. In 56th Annual Technical Conference of the Technical Association of the Graphic Arts, TAGA 2004, April 20, 2004 - April 20. San Antonio, TX, United states: Technical Association of the Graphic Arts. 511.
Fujiwara, H.; Fujisaki, N.; Shimizu, I.; Kano, I. (1989) Effect of water penetration on offset mottling. Tappi Journal, 72 (5), 91-97.
Gane, P. A. C.; Ridgway, C. J. (2009) Interactions between flexographic ink and porous coating structures. In TAPPI 2nd Annual PaperCon'09 Conference - Solutions for a Changing World, May 31 - June 3. St. Louis, MO, United states: TAPPI Press.
Gane, P. A. C. (2001) Mineral pigments for paper: Structure, function and development potential (Part II). Wochenblatt fuer Papierfabrikation, 129 (4), 176-179.
Gerdes, S.; Cazabat, A. M.; Ström, G.; Tiberg, F. (1998) Effect of surface structure on the spreading of a PDMS droplet. Langmuir, v 14, n 24, p 7052-7057.
Giesche, H. (2006) Mercury porosimetry: a general (practical) overview. Particle & Particle Systems Characterization. 23 1–11
Granberg, H.; Edström, P. (2003) Quantification of the intrinsic error of the Kubelka-Munk model caused by strong light absorption. Journal of Pulp and Paper Science, 29 (11), 386-390.
Granberg, H.; Rundlöf, M.; Mattson, L. (2003a) Influence of the surface-induced nonuniform reflectance on the diffuse reflectance factor. Part I: model predictions. Journal of Pulp and Paper Science, 29 (8), 247-253.
Granberg, H.; Rundlöf, M.; Mattson, L. (2003b) Influence of the surface-induced nonuniform reflectance on the diffuse reflectance factor. Part II: experimental verification on coated substrates. Journal of Pulp and Paper Science, 29 (8), 254-259.

75
Holmvall, M.; Lindström, S. B.; Uesaka, T. (2010) Simulation of two-phaseflow with moving immersed doundaries. International Journal for Numerical Methods in Fluids, Published online in Wiley Online Library, DOI: 10.1002/fld.2484.
Israelachvili, J. N.; Gee, M. L. (1989) Contact Angles on Chemically Heterogeneous Surfaces. Langmuir, vol. 5, p. 288-289.
Jerkeman, P. (2010) Papper - en mänsklig historia. Second edition, Carlssons bokförlag, Stockholm, Sweden, ISBN 978-91-7331-381-0
Johnson, J.; Rättö, P.; Lestelius, M.; Järnström, L. (2003) Dynamic nip pressure in a flexographic CI-printing press. In TAGA Proceedings 2003: 55th annual conference, Montreal, QC, Canada.
Järnström, J.; Väisänen, M.; Lehto, R.; Jäsberg, A.; Timonen, J.; Peltonen, J. (2010) Effect of latex on surface structure and wetting of pigment coatings. Colloids and Surfaces A: Physicochemical and Engineering Aspects, v 353, n 2-3, p 104-16.
Kadoya, T.; Usuda, M. (1984) The penetration of nonaqueous liquids. In Handbook of Physical and Mechanical Testing of Paper and Paperboard, Marcel Dekker, Inc. New York, 123-141.
Karipidis, C. (1994) Bestämning av ett arks (skikts) optiska egenskaper med tvåbakgrundsmetoden (Licentiate Thesis). Diss. Kungl. Tekniska Högskolan, Stockholm, Sweden: Institutionen för Pappers och Massateknik.
Kenttä, E.; Pöhler, T.; Juvonen, K. (2006) Latex uniformity in the coating layer of paper. Nordic Pulp and Paper Research Journal, v 21, n 5, p 665-669.
Kenttä, E.; Pöhler, T. (2008) How latex distribution is affected by changes in coating structure -Results from a pilot study. In TAPPI Advanced Coating Fundamentals Symposium, June 11-13. Montreal, QC, Canada: TAPPI Press. 22.
Kipphan, H. (2001) Handbook of Print Media, Technologies and Production Methods. (1st ed.). Berlin, Germany: Springer.
Koivula, H.; Preston, J. S.; Heard, P. J.; Toivakka, M. (2008) Visualisation of the distribution of offset ink components printed onto coated paper. Colloids Surf., 317 (1-3), 557-567.
Koponen, A.; Kataja, M.; Timonen, J. (1996) Tortuous flow in porous media. Physical Review E.Statistical Physics, Plasmas, Fluids, and Related Interdisciplinary Topics, 54 (1), 406-406.
76
Koponen, A.; Kataja, M.; Timonen, J. (1997) Permeability and effective porosity of porous media. Physical Review E.Statistical Physics, Plasmas, Fluids, and Related Interdisciplinary Topics, 56 (3-), 3319-3319.
Kozeny, J. (1927) Ueber kapillare Leitung des Wassers im Boden. Wien: Sitzungsber Akad. Wiss.
Kramm, A.; Mair, B. (2010) Coating technology of yesterday and tomorrow in paper manufacture in the same house; Streichtechnik gestern und morgen in einem Haus. Wochenblatt fuer Papierfabrikation, 138 (6), 496-497.
Kubelka, P.; Munk, F. (1931) Ein beitrag zur optic der farbanstriche. In Ein beitrag zur optic der farbanstriche. Z. Tech. Phys. 593-601.
Kuehni, R. G. (1997) Color, an Introduction to Practice and Principles. USA: John Wiley & Sons, Inc.
Kugge, C. (2004) An AFM study of local film formation of latex in paper coatings. Journal of Pulp and Paper Science, 30 (4), 105-111.
Laden, P. (1997) Chemistry and Technology of Water Based Inks. Chapman and Hall, Cornwall, UK.
Lamminmäki, T.; Forsström, U.; Tienari, M.; Saharinen, E.; Mikkila, J.; Koskelainen, J. (2005) Calendering of coated paper at high speeds and temperatures. Nordic Pulp and Paper Research Journal, 20 (3), 354-360.
Lamminmäki, T. T.; Kettle, J. P.; Puukko, P. J. T.; Gane, P. A. C. (2011) The chromatographic separation of anionic dye in inkjet coating structures. Colloids and Surfaces A: Physicochemical and Engineering Aspects, 377 (1-3), 304-311.
Larson, R. G. (1999) The Structure and Rheology of Complex Fluids. New York, USA: Oxford University press.
Larsson, M.; Engström, G.; Vidal, D.; Zou, X. (2006) Compression of coating structures during calendering. In 2006 TAPPI Advanced Coating Fundamentals Symposium, Turku, Finland, February 8-10, Session 6. 19.
Larsson, M.; Engström, G.; Vidal, D.; Zou, X. (2007) Impact of calendering on coating structures. Nordic Pulp and Paper Research Journal, 22 (2), 267-274.
Lepoutre, P.; De Grace, J. H. (1978) Ink Transfer Characteristics and Coating Structure. Paper Technology and Industry, 19 (9), 301-304.
77
Leskinen, A. M., (1987) Layer Structure in Model Coatings. TAPPI Proceedings - 1987 Coating Conference. Houston, TX, USA: TAPPI Press. 71.
Lindberg, S.; Fahlcrantz, C. (2005) Perceptual assessment of simulated print noise with random and periodic structure. Journal of Visual Communication and Image Representation, 16 (3), 271-87.
MacGregor, M. A.; Johansson, P.; Beland, M. (1994) Measurement of small-scale gloss variation in printed paper. Topography explains much of the variation for one paper. In Proceedings of the International Printing and Graphic Arts Conference, October 17- 20. Halifax, Can: TAPPI Press. 33.
Marmur, A. (2003) Wetting of Hydrophobic Rough Surfaces: To be heterogeneous or not to be. Langmuir 19 (20): 8343–8348
Mesic, B.; Lestelius, M.; Engström, G.; Edholm, B. (2005a) Printability of PE-coated paperboard with water-borne flexography; Effects of corona treatment and surfactants addition. Pulp &Paper Canada, v 106, n 11, p 36-41.
Mesic, B.; Lestelius, M.; Engström, G. (2005b) Influence of corona treatment decay on print quality in water-borne flexographic printing of LDPE-coated paperboard. Journal of Packaging Technology and Science, 19:61-70.
Mesic, B.; Lestelius, M.; Engström, G. (2006) Occurrence and causes of uncovered areas in water-borne flexographic print on PE-extrusion-coated packaging papers. Proc. TAPPI Printing and Graphic Arts Conf. (IPGAC), Cincinnati, OH, US.
Mudgett, P. S.; Richards, L. W. (1971) Multiple scattering calculations for technology. Applied Optics, 10 (7), 1485-1502.
Murray, A. (1936) Monochrome Reproduction in Photoengraving. Journal of Franklin Institute, vol 221, 721-744.
Niskanen, I.; Raty, J.; Peiponen, K.; Koivula, H.; Toivakka, M. (2007) Assessment of the complex refractive index of an optically very dense solid layer: Case study offset magenta ink. Chemical Physics Letters, 442 (4-6), 515-517.
Niskanen, K. (1998) Paper Physics, in Gullichsen, J.; Paulapuro, H. (eds). Papermaking science and technology series, Book 16. Helsinki, Finland: Fapet Oy.
Nordling, C.; Österman, J. (2004) Physics Handbook. Seventh edition, Studentlitteratur, Lund, Sweden ISBN 91-44-03152-1.
78
Nordström, J. E. P.(2000) Thermal changes in a Waterless Sheet-Fed Offset Inking Station. International Printing & Graphic Arts Conference, Savannah, GA, USA, TAPPI Press, 153-165.
Nordström, J. E. P.; Johnson, J. (2002) CSWO (Cold Set Waterless Web Offset) Using Standard Tmp/Dip Newsprint. International Printing & Graphic Arts Conference, Bordeaux, France, pp. 11.
Oittinen, P.; Saarelma, H. (1998) Printing, in Gullichsen, J.; Paulapuro, H. (eds). Papermaking science and technology series, Book 13. Helsinki, Finland: Fapet Oy.
Olsson, R.; Yang, L.; van Stam, J.; Lestelius, M. (2006) Effects on ink setting in flexographic printing: coating polarity and dot gain. Nordic Pulp and Paper Research Journal, 21(5), 569-574.
Olsson, R.; Yang, L.; Lestelius, M. (2007) Water retention of flexographic inks and its influence on final print gloss. Nordic Pulp and Paper Research Journal, 22 (3), 287-292.
Olsson, R.; Yang, L.; Lestelius, M. (2008) Flexographic print quality of pilot coated paperboard. Conference paper, IARIGAI, Advances in printing and media technology, 35; 169.
Park, S.; Lee, H. L. (2006) Influence of the calendering conditions on opacity and quantitative evaluation of the z-directional density variation by image analysis. Nordic Pulp and Paper Research Journal, 21 (2), 211-215.
Pauler, N. (2012) Paper optics. AB Lorentzen & Wettre, Kista, Sweden. ISBN 978-91-977604-1-6.
Peiponen, K.; Kontturi, V.; Niskanen, I.; Juuti, M.; Raty, J., Koivula, H.; Toivakka, M. (2008) On estimation of complex refractive index and colour of dry black and cyan offset inks by a multi-function spectrophotometer. Measurement Science and Technology, 19 (11).
Podhajny, R. M. (1990) Critical Ink/Press Performance Parameters in Flexo and Gravure. Polymers, Lamination & Coatings Conference, TAPPI Proceedings, Boston, MA, USA, 581-583.
Preston, J. S.; Daun M.; Nutbeem C.; Jones A. (2000) Attaining print performance through pigment engineering. Wochenblatt Für Papierfabrikation, vol. 5, pp252-265
79
Preston, J. S.; Elton, N. J.; Legrix, A.; Nutbeem, C. (2001) The role of pore density in the setting of offset printed ink on coated paper. Proc. TAPPI Advanced Coating Fundamentals Symposium, San Diego.
Preston, J.; Hiorns, A.; Parsons, D. J.; Heard, P. (2008) Design of coating structure for flexographic printing. Paper Technology, 49 (3), 27-36.
Preston, J. S.; Gate, L. F. (2005) The influence of colour and surface topography on the measurement of effective refractive index of offset printed coated papers. Colloids Surf., 252 (2-3), 99-104.
Preston, J. S.; Elton, N. J.; Legrix, A.; Nutbeem, C.; Husband, J. C. (2002) The role of pore density in the setting of offset printing ink on coated paper. Tappi Journal, 1 (5), 3-5.
Rentzhog, M.; Fogden, A. (2005) Influence of formulation and properties of water-based flexographic inks on printing performance for PE-coated board. Nordic Pulp and Paper Research Journal, 20 (4), 410-417.
Ridgway, C. J.; Gane, P. A. C. (2002) Dynamic absorption into simulated porous structures. Elsevier. 217.
Rodal, J. J. A. (1989) Soft-nip calendering of paper and paperboard. Tappi journal, 72 (5), p 177-186.
Rounsley, R. (1991) How Paper Properties can be Develpoed Using Different Methods of Calendering. Tappi Journal, (74 (1)), 105-109.
Rousu, S.; Gane, P.; Eklund, D. (2005) Print quality and the distribution of offset ink constituents in paper coatings. Tappi Journal, 4 (7), 9-15.
Rättö, P.; Rigdahl, M. (2001) The influence of temperature on the compression behaviour of paper in the thickness direction. Nordic Pulp and Paper Research Journal, 16 (3), 178-182.
Rättö, P. (2002) Description and analysis of paper deformation in a calender nip - Effects of high roll temperatures and thickness variations. Nordic Pulp and Paper Research Journal, v 17, n 2, p 130-138.
Sadovnikov, A.; Lensu, L.; Kalviainen, H. (2008) On estimation of perceived mottling prior to printing. In Image Quality and System Performance V. USA: SPIE - The International Society for Optical Engineering.

80
Schoelkopf, J.; Gane, P. A. C.; Ridgway, C. J.; Matthews, G. P. (2002) Practical observation of deviation from Lucas-Washburn scaling in porous media. Colloids and Surfaces, A: Physicochemical and Engineering Aspects, 206 445-454.
Schoelkopf, J.; Gane, P. A. C.; Ridgway, C. J. (2004) A comparison of the various liquid interaction radii derived from experiment and network modelling of porous pigmented structures. Colloids and Surfaces A: Physicochemical and Engineering Aspects, 251 (1-3), 149-159.
Stokes, G. G. (1862) On the intensity of the light reflected from or transmitted through a pile of plates. Proc. Roy. Soc. London 11, 545–556.
Ström, G.; Gustafsson, J.; Sjölin, K. (2001) Printing Papers Separation of Ink Constituents During Ink Setting on Coated Substrates. Coating and graphic arts conference and trade fair, San Diego, CA, USA, pp 303-313.
Ström, G.; Englund, A.; Karathanasis, M. (2003) Effect of coating structure on print gloss after sheet-fed offset printing. Nordic Pulp and Paper Research Journal, 18 (1), 108-115.
Ström, G. R.; Borg, J.; Svanholm, E. (2008) Short-time water absorption by model coatings. TAPPI Advanced Coating Fundamentals Symposium Proceedings, Montreal, QC, Canada, p 204-216.
Thomas, G. E.; Stamners, K. (2002) Basic State Variables and the Radiative Transfer Equation. In Dessler, A.J., Houghton, J.T. and Rycroft, M.J. (eds.) Radiative Transfer in the Atmosphere and Ocean. Cambridge, United Kingdom: Cambridge University Press. Chapter 2.
Tollenaar, D.; Ernst, P. A. H. (1962) Optical Density and Ink Layer Thickness. InProceedings of International Conference of Printing Research Institute (IARIGAI). 214-234.
van de Hulst, H.C. (1981) Light Scattering by Small Particles. Mineola, N.Y., USA: Dover Publications, Inc.
van Oss, C.J. (1994) Interfacial Forces in Aqueous Media. Canada, Marcel Dekker, inc.
Walker, W. C. (1980) Determination of Ink Transfer Parameters. American Society of Mechanical Engineers, Heat Transfer Division, (Publication) HTD, , 127-136.
Walker, W. C.; Fetsko, J. M. (1955) A Concept of Ink Transfer in Printing. American Ink Maker (December), 38-44, 69-71.
81
Wang, L.; Jacques, S. L.; Zheng, L. (1995) MCML-Monte Carlo modelling of light transport in multi-layered tissues. Computer methods and programs in biomedicine, 47 (2), 131-46.
Wenzel, R. N. (1936) Resistance of solid surfaces to wetting by water. Ind Eng Chem 28:988–994.
Wikström, M.; Nylund, T.; Rigdahl, M. (1997) Calendering of coated paper and board in an extended soft nip. Nordic Pulp and Paper Research Journal Journal, 12 (4): 289.
Xiang, Y.; Bousfield, D.W. (2000) Influence of coating structure on ink tack dynamics. Journal of Pulp and Paper Science, v 26, n 6, p 221-227.
Xiang, Y.; Coleman, P.; Bousfield, D. W.; Osgood, A. (2000) Cause of backtrap mottle: Chemical or physical? In 2000 TAPPI Coating Conference and Trade Fair, May 1-4, Washington, DC, USA: TAPPI Press. 45.
Xiang, Y.; Bousfield, D. W. (2003) Influence of Coating Ink Setting Rate on Ink Transfer. Proceedings-Technical Associations of the Graphic Arts. Montreal, Que., Canada: Technical Association of the Graphic Arts. 66.
Yang, L. (2002) Modelling Ink-Jet Printing Does Kubelka-Munk Theory Apply? In IS and T's NIP18: International Conference On Digital Printing Technologies, September 29, 2002 - October 4. San Diego, CA, United states: Society for Imaging Science and Technology. 482.
Young, T. (1805) An essay on the cohesion of fluids. Philosophical Transactions of the Royal Society of London 95, 65-87.
Zang, Y. H.; Aspler, J. S., (1995) Influence of coating structure on the ink receptivity and print gloss of model clay coatings. Tappi Journal, 78 (1), 147-154.
Zang, Y. H.; Liu, Z.; Cao, Z. L.; Mangin, P. (2008) An extension of lepoutre mechanism for the consolidation of the structure of latex-pigment coatings. In TAPPI Advanced Coating Fundamentals Symposium, June 11-13, Montreal, QC, Canada: TAPPI Press. 29.
urn:nbn:se:kau:diva-30030
Surface and porous structure of pigment coatings
Each day, we are confronted with a large amount of more or less important information that we have to consider, and even in our digital society we need paper for communication, documentation and education. Much of the paper we use or are confronted by in our daily life, such as newspapers, books and packages, contains printed images or texts, and the appearance of both the print and the supporting surface is important. A good contrast between a printed text and the paper makes it easier to read, a detailed print of an illustration makes it more informative and clear and evenly distributed colours on a package or on a poster make it more appealing. All of these qualities depend on the optical properties of the paper product and the behavior of light illuminating the different materials.
The aim of the work described in this thesis is to characterize the structure of coatings and prints, and to validate models for the optical response and interaction of ink and coating based on optical measurements of physical samples. It is the interactions between the printing ink and the porous structure of the coating layers that are subject to investigation. Experiments have been employed to relate the physical conditions in a flexographic printing nip to the ink setting, affected by the physical and chemical properties of the coating, to the resulting optical response of the printed paperboard.
DISSERTATION | Karlstad University Studies | 2013:49
ISSN 1403-8099
ISBN 978-91-7063-528-1