surface and ground water quality assessment of …ijesr.org/admin/upload_journal/journal_abhijeet...
TRANSCRIPT

ISSN 2277-2685 IJESR/Nov. 2018/ Vol-8/Issue-11/1-12 Abhijeet Das Patel et. al., / International Journal of Engineering & Science Research
*Corresponding Author www.ijesr.org 1
SURFACE AND GROUND WATER QUALITY ASSESSMENT OF ROURKELA CITY
Chanchal Kumar Mukherjee1, Dr. Bhagirathi Tripathy2, Dr. PK Pani3, Abhijeet Das*4 1Research Scholar, Utkal University, Bhubaneswar University, Odisha, India.
2Assistant Professor, Civil Engineering Department, IGIT, Sarang, Odisha, India.
3Professor, Civil Engineering Department, IGIT, Sarang, Odisha, India.
4Assistant Professor, Civil Engineering Department, IGIT, Sarang, Odisha, India.
ABSTRACT
Water, a prime natural resource, is a basic need for sustenance of human civilization. It is one of the most essential and important commodities required for a healthy society. The present investigation is aimed at assessing the current water quality standard along the stretch of Brahmani River in terms of physico-chemical parameters [1]. In this paper, an attempt was taken to evaluate the water quality for both surface water and ground water in and around Rourkela, the Steel City of Orissa. The evaluation involves the study of meteorology, hydrogeology, demography and analysis of physico-chemical parameters. From analyzed data, it was found that, except a few all other parameters are not within the permissible limit. The overall water quality for drinking purposes belongs to poor to very poor quality but the water quality for agricultural purposes are found to be suitable. Panposh area is the major polluting part of surface water in river Brahmani [2]. In most of the areas, the physico-chemical parameters of both ground water and surface water are found to be much higher than the permissible limiting value.
Keywords: Water, Meteorology, Hydrogeology, Demography, Physico-chemical Parameters
1. INTRODUCTION
The City Rourkela is very near to the Howrah- Mumbai railway line. Its latitude is 22˚12’ N of equator and longitude is 85˚ east of meridian. This steel city is situated an altitude of 219 meters above sea level. The River Brahmani originates at Vedvyas which is the union point of two rivers namely “Shankha”and “Koel”. Because of the locational advantages of Rourkela Steel Plant, the fertilizer Plant, nearby Captive Power Plant, Heavy Refractory material Units, Cement factories, explosive plants, distillery plants, sponge iron units and almost 300 small and medium scale industries are located in and around city of Rourkela and owing to the discharge of huge amounts of liquid effluents from these industries, sewagewater disposalof thesteel city, the river Brahmani is heavily polluted [3]. The surface water bodies (Ponds, tanks and still water bodies) are also polluted because of heavy discharge of industrial effluents and also domestic waste water.The heavy pollution load in water is an alarming and builds fear among the inhabitants surviving its bank and cause of danger to the aquatic life. Therefore, the water quality parameters of the river Brahmani along with the pollution load of different regions should be collectively studied [4]. The common industries which cause the major sources of pollution in the city are Rourkela Steel Plant, Fertilizer Plant (SAIL), Captive Power Plant, IDL Industries limited, Shiva Cement Limited, Lotus Chemicals, Konark Chrome Chemicals, Siddharth Chemicals, Golcha Pigments, Shanta Chemicals, GN Colours & Chemicals Ltd. Etc.
2. SURFACE QUALITY
Brahmani is the second largest river of Orissa which originates by the confluence of river Sankh and Koel at Rourkela. It has the drainage area of about 39,033 Sq.KM having drainage length of 800 KM. The annual average discharge of the river is 8310 MCM of water to Bay of Bengal. Rourkela Steel Plant discharges its treated and untreated waste water through its polishing pond, lagoon at Panposharea, which is the major

Abhijeet Das Patel et. al., / International Journal of Engineering & Science Research
Copyright © 2018 Published by IJESR. All rights reserved 2
polluting source of Brahmani at both downstream and upstream of confluence of waste water reveals the pollution of river [5]. `
The below (Figure 1, 2, 3) showing monitoring stations of Brahmani basin by the application of GIS Software.
Fig. 1: Brahmani basin showing fifteen monitoring stations
Fig. 2: Flow path of Brahmani basin showing monitoring stations)
Abhijeet Das Patel et. al., / International Journal of Engineering & Science Research
Copyright © 2018 Published by IJESR. All rights reserved 3
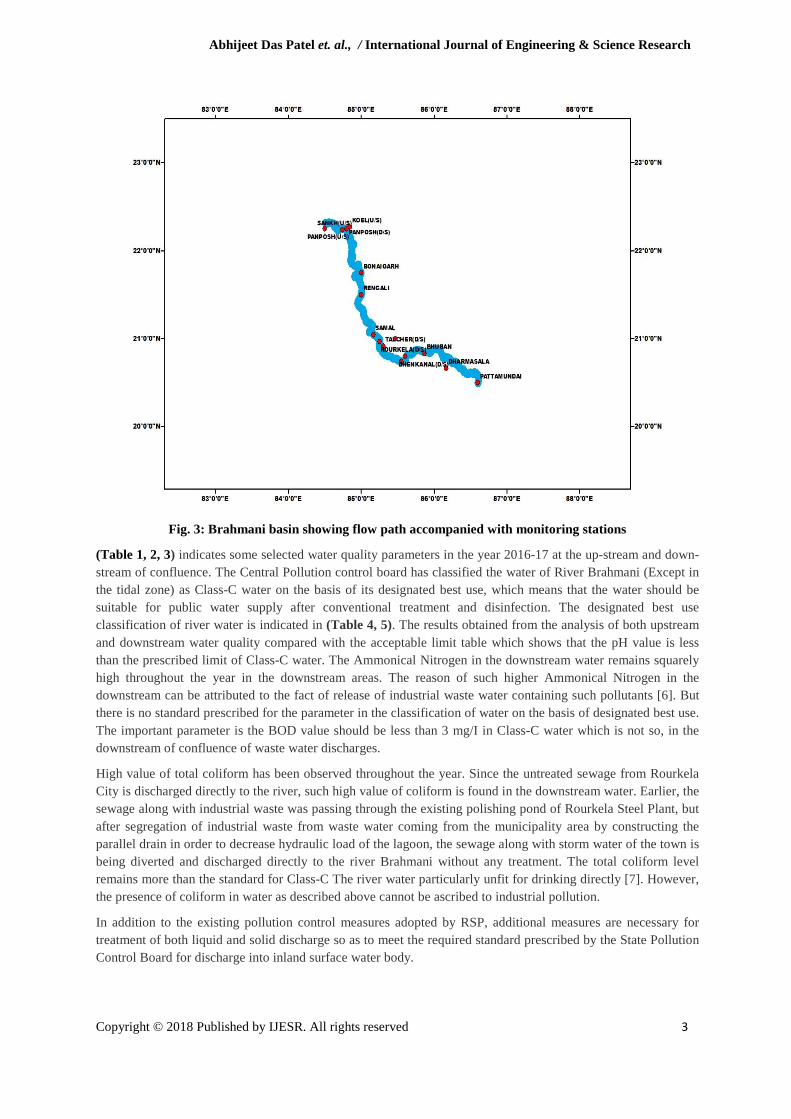
Fig. 3: Brahmani basin showing flow path accompanied with monitoring stations
(Table 1, 2, 3) indicates some selected water quality parameters in the year 2016-17 at the up-stream and down-stream of confluence. The Central Pollution control board has classified the water of River Brahmani (Except in the tidal zone) as Class-C water on the basis of its designated best use, which means that the water should be suitable for public water supply after conventional treatment and disinfection. The designated best use classification of river water is indicated in (Table 4, 5). The results obtained from the analysis of both upstream and downstream water quality compared with the acceptable limit table which shows that the pH value is less than the prescribed limit of Class-C water. The Ammonical Nitrogen in the downstream water remains squarely high throughout the year in the downstream areas. The reason of such higher Ammonical Nitrogen in the downstream can be attributed to the fact of release of industrial waste water containing such pollutants [6]. But there is no standard prescribed for the parameter in the classification of water on the basis of designated best use. The important parameter is the BOD value should be less than 3 mg/I in Class-C water which is not so, in the downstream of confluence of waste water discharges.
High value of total coliform has been observed throughout the year. Since the untreated sewage from Rourkela City is discharged directly to the river, such high value of coliform is found in the downstream water. Earlier, the sewage along with industrial waste was passing through the existing polishing pond of Rourkela Steel Plant, but after segregation of industrial waste from waste water coming from the municipality area by constructing the parallel drain in order to decrease hydraulic load of the lagoon, the sewage along with storm water of the town is being diverted and discharged directly to the river Brahmani without any treatment. The total coliform level remains more than the standard for Class-C The river water particularly unfit for drinking directly [7]. However, the presence of coliform in water as described above cannot be ascribed to industrial pollution.
In addition to the existing pollution control measures adopted by RSP, additional measures are necessary for treatment of both liquid and solid discharge so as to meet the required standard prescribed by the State Pollution Control Board for discharge into inland surface water body.

Abhijeet Das Patel et. al., / International Journal of Engineering & Science Research
Copyright © 2018 Published by IJESR. All rights reserved 4
Table 1: Drinking water standard (manually on water supply and water treatment)
DRINKING WATER STANDARD(MANUALLY ON WATER SUPPLY AND WATER TREATMENT) S. No CHARACTERISTICS ACCEPTABLE CAUSE FOR REJECTION 1 TURBIDITY,NTU 2.5 10 2 COLOUR 5 25 3 TASTE AND ODOUR UNOBJECTIONABLE UNOBJECTIONABLE 4 PH 7.5-8.5 >8.5-9.2
5 TOTAL SUSPENDED SOLIDS 500 1500
6 TOTAL HARDNESS 200 600 7 CHLORINE 200 1000 8 SULPHATE 200 400 9 FLUORIDE 1 1.5 10 NITRATE 45 45 11 CALCIUM 75 200 12 MAGNESIUM 30 150 13 IRON 0.1 1 14 MANGANESE 0.05 0.5 15 COPPER 0.05 1.5 16 ZINC 5 15
17 PHENOLIC COMPOUNDS 0.001 0.002
18 ANIONIC DETERGENTS 0.2 1
19 MINERAL OIL 0.01 0.3 TOXIC MATERIALS 20 ARSENIC 0.05 >=0.05 21 CADMIUM 0.01 >=0.01 22 CHROMIUM 0.05 >=0.05 23 CYANIDE 0.05 >=0.05 24 LEAD 0.1 >=0.1 25 SELENIUM 0.01 >=0.01 26 MERCURY 0.001 >=0.001
Table 2: Water quality of River Brahmani (Upstream)
WATER QUALITY OF RIVER BRAHMANI(UPSTREAM) PARAMETER MONTH-2016 JAN FEB MAR APR MAY JUN JUL AUG SEP OCT NOV DEC PH 6.9 6.3 6.4 5.3 6.8 6.5 6.5 6.5 7.8 6.4 6.4 6.5 BOD 4 5.2 3.9 5.3 3.8 5.3 6.8 6 4 4.6 6.2 3 COD 7.8 8 5.6 6.2 14 7.8 7.2 9.6 12.2 14 15 12.4 AMMONIACAL NITROGEN
0.65 0.7 0.56 0.4 0.42 0.53 0.74 0.82 0.43 0.38 0.34 0.36
PARAMETER MONTHS-2017 JAN FEB MAR APR MAY JUN JUL AUG SEP OCT NOV DEC PH 6.4 6.6 6.8 6.8 6.9 6.7 6.1 5.7 6.3 5.3 5.5 5.6 BOD 9.8 5 6.8 5.8 6.4 18 20 7 7 6.2 6.4 4.8 COD 18 15.6 9.6 9.2 12 58.2 64 23.2 18 19 19 13.6 AMMONIACAL NITROGEN
0.42 0.38 0.22 0.5 0.47 0.38 0.8 0.65 0.25 0.45 0.54 0.5
Abhijeet Das Patel et. al., / International Journal of Engineering & Science Research
Copyright © 2018 Published by IJESR. All rights reserved 5
Table 3: Water quality of River Brahmani (Downstream)
WATER QUALITY OF RIVER BRAHMANI(DOWNSTREAM) PARAMETER MONTH-2016 JAN FEB MAR APR MAY JUN JUL AUG SEP OCT NOV DEC PH 6.6 5.8 6.8 6.7 6.6 5.9 6.3 6.7 6.2 6.4 6.3 6.4 BOD 18 13.7 6.4 8.2 10.4 24 20 13 12.6 13.2 12.6 14 COD 37 37 40 34 66 76 62 53 56 42 33 52.4 AMMONIACAL NITROGEN
19.5 20 8.4 6.2 7.6 2.5 9.6 8.7 14.6 18.2 15 12
PARAMETER MONTHS-2017 JAN FEB MAR APR MAY JUN JUL AUG SEP OCT NOV DEC PH 6.6 6.2 6.7 6.6 6.7 5.8 6 5.8 5.9 6.4 6.4 6.4 BOD 7.8 9.9 8.2 8.6 16.5 18.5 20.4 17.6 19 21.6 22.4 23.2 COD 30.2 36.4 39 37.4 59 58 69 72 73 57.6 57.6 59.2 AMMONIACAL NITROGEN
16.2 14.8 11.3 17.1 18.3 12.8 12.1 24.5 15 12 12 12.3
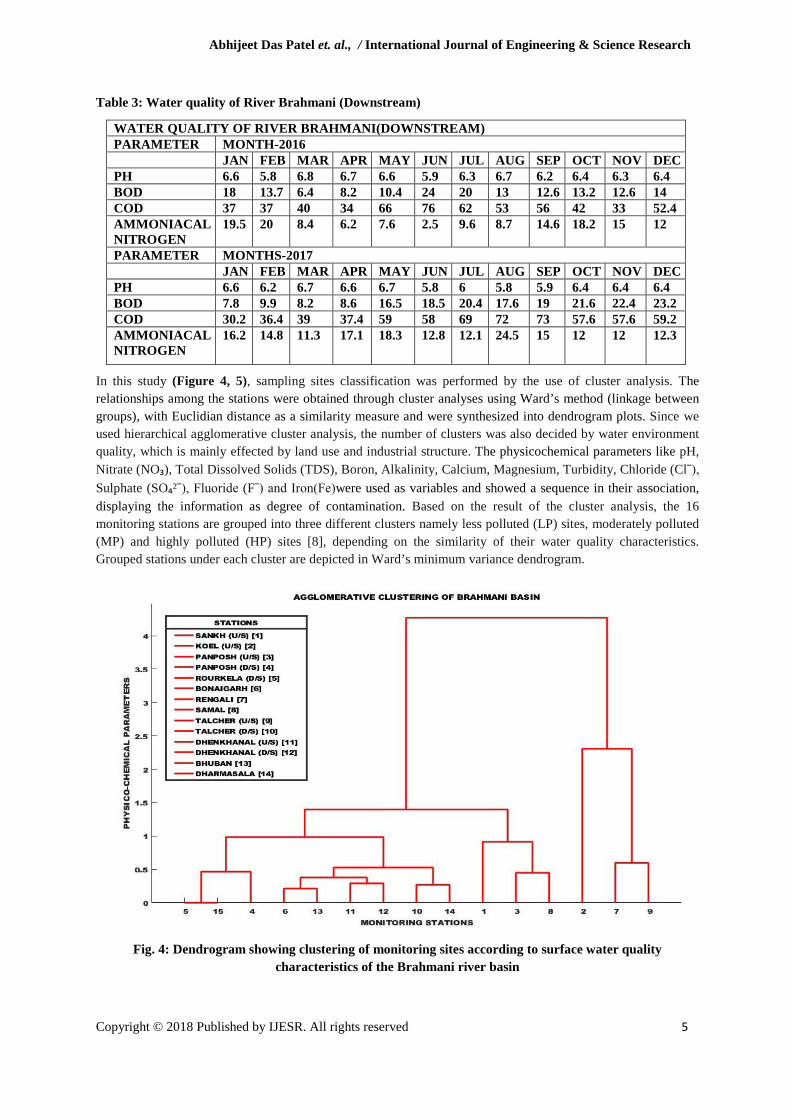
In this study (Figure 4, 5), sampling sites classification was performed by the use of cluster analysis. The relationships among the stations were obtained through cluster analyses using Ward’s method (linkage between groups), with Euclidian distance as a similarity measure and were synthesized into dendrogram plots. Since we used hierarchical agglomerative cluster analysis, the number of clusters was also decided by water environment quality, which is mainly effected by land use and industrial structure. The physicochemical parameters like pH, Nitrate (NO₃), Total Dissolved Solids (TDS), Boron, Alkalinity, Calcium, Magnesium, Turbidity, Chloride (Clˉ), Sulphate (SO₄²ˉ), Fluoride (Fˉ) and Iron(Fe)were used as variables and showed a sequence in their association, displaying the information as degree of contamination. Based on the result of the cluster analysis, the 16 monitoring stations are grouped into three different clusters namely less polluted (LP) sites, moderately polluted (MP) and highly polluted (HP) sites [8], depending on the similarity of their water quality characteristics. Grouped stations under each cluster are depicted in Ward’s minimum variance dendrogram.
Fig. 4: Dendrogram showing clustering of monitoring sites according to surface water quality characteristics of the Brahmani river basin

Abhijeet Das Patel et. al., / International Journal of Engineering & Science Research
Copyright © 2018 Published by IJESR. All rights reserved 6
Fig. 5: Andrew plots showing physico-chemical parameters and their composition of monitoring sites of the Brahmani river basin
Table 4: Classification of water selected on the basis of use
CLASS SELECTED ON THE BASIS OF USE REQUIRED PARAMETER CLASS A DRINKING WATER AFTER
DISINFECTION WITHOUT PROPER TREATMENT
1) TOTAL COLIFORM BACTERIA MPN/100 ML SHALL BE 50 OR LESS 2)PH BETWEEN 6.5-8.5 3)DO=6 MG/L OR MORE 4)BOD=2 MG/L OR LESS
CLASS B OUTDOOR BATHING SWIMMING AND WATER CONTACT SPORTS
1)TOTAL COLIFORM BACTERIA 2)MPN/100 ML SHALL BE 50 OR LESS 3)PH BETWEEN 6.5-8.5 4)DO=5 MG/L OR MORE 5)BOD=3 MG/L OR LESS
CLASSC DRINKING WATER SOURCE WITH CONVENTIONAL TREATMENT FOLLOWED BY DISINFECTION
1)TOTAL COLIFORM BACTERIA 2)MPN/100 ML SHALL BE 5000 OR LESS 3)PH BETWEEN 6-9 4)DO=4 MG/L OR LESS 5)BOD=3 MG/L OR LESS
CLASS D PROPAGATION OF WILDLIFE AND FISHERIES
1)PH BETWEEN 6.5-8.5 2)DO=4 MG/L 3)FREE AMMONIA=1.2 MG/L OR LESS
CLASS E IRRIGATION,INDUSTRIAL COOLING AND CONTROLLED WASTE DISPOSAL
1)PH BETWEEN 6-8.5 2)ELECTRICAL CONDUCTIVITY AT 2250 MHO/CM 3)SODIUM ABSORPTION RATIO=MAX 26 4)BORON MAX=2 MG/L

Abhijeet Das Patel et. al., / International Journal of Engineering & Science Research
Copyright © 2018 Published by IJESR. All rights reserved 7
Table 5: Tolerance limits in land surface water subject to pollution
S. NO CHARACTERISTICS TOLERANCE LIMIT FOR DIFFERENT CLASSES A B C D E 1 PH VALUE(MIN) 6.5 6.5 6.5 6.5 6 PH VALUE(MAX) 8.5 8.5 8.5 8.5 8.5 2 DO 6 5 4 4 3.2 3 BOD 2 3 3 4.2 4.6 4 TDS 500 1900 1500 1700 2100 5 COLOUR 10 300 300 300 300 6 ODOUR AGREEABLE 7 TASTE TASTELESS 8 CHLORIDE 250 340 600 580 600 9 TH 300 320 340 370 372 10 CA HARDNESS 200 210 214 255 152 11 MG HARDNESS 100 110 126 115 120 12 FE 1.3 2.1 5 4.3 4.8 13 MN 0.6 0.75 0.74 0.75 0.72 14 CU 1.6 1.7 1.8 1.6 1.8 15 SULPHATE 450 520 460 780 1000 16 NITRATE 20 32 50 48 56 17 CHLORIDE 1.8 1.7 1.8 1.6 1.8
18 PHENOLIC COMPOUND 0.005 0.006 0.006 0.006 0.006
19 MERCURY 0.001 0.001 0.001 0.001 0.001 20 CADMIUM 0.01 0.1 0.02 0.02 0.02 21 SELENIUM 0.01 0.04 0.05 0.04 0.06 22 AS 0.05 0.2 0.2 0.03 0.03 23 CYANIDE 0.05 0.05 0.05 0.05 0.05 24 PB 0.05 0.1 0.1 0.15 0.15 25 ZN 1.5 1.6 1.5 1.7 1.8 26 CHROMIUM 0.05 0.06 0.06 0.06 0.06
27 ANIONIC DETERGENTS 0.6 1.1 1 1.2 1.1
28 PAH 0.2 0.3 0.25 0.3 0.35 29 MINERAL OIL 0.01 0.01 0.01 0.01 0.01 30 BARIUM 1 0.9 1.1 1.2 1.3 31 AG 0.05 0.06 0.07 0.06 0.06 32 PESTICIDES ABSENT 33 ALPHA EMITTERS 10 10 10 10 10 34 BETA EMISSION 10 10 10 10 10 35 TOTAL COLIFORM 540 590 600 610 610
3. QUALITY OF WATER BODIES
Water from Ponds, tanks and still water bodies are important integral part of social life of people in water scarcity areas., where community water supply has not been provided in some part of the urban area or in encroached or unauthorized dwellings developed in the city which do not have a regular water supply by the urban services department, those still water bodies are very important and are used for a variety of purposes. The quality of those lentic water bodies, over the years undergoes deterioration in their quality due to rapid silting abuse by the ever increasing population and other natural damages [9]. Since the water of the ponds near habitation is used for bathing and drinking purposes apart from adverse effect on ecology and aquatic life bathing also pose serious health hazard to the people. Various pathogenic microorganisms cause transmission of various diseases. Since bathing is the medium through which the diseases are transmitted, hence for this reason it is considered as one of the important criteria and the stipulated standards in the classification of fresh water bodies.

Abhijeet Das Patel et. al., / International Journal of Engineering & Science Research
Copyright © 2018 Published by IJESR. All rights reserved 8
4. QUALITY OF STUDY
The solid waste produced from both the industrial, domestic sources and hospital wastes are usually thrown on the land surface. Depending upon the characteristics of the substances thrown on land surface leaching takes place which causes contaminating the soil as well as ground water due to percolation of leachate produced from it. Rourkela Steel Plant has two numbers of dump yards outside its industrial premises for dumping of different solid wastes generated from its various sources.
There is also one Municipal refuse dump Yard in the city used for land filling by dumping garbage. The domestic as well as industrial wastes contain some of the offensive materials which not only cause toxic effect over the land surface but also if the material leached into the ground it can contaminate the ground water [10].
This is the cause of the dispersal of water borne diseases due to the leaching action of urban waste and effluents at several parts of our earth. Keeping the above point in view, the open dumping of both industrial as well as domestic waste materials should be restricted. Ten ground water samples (Tube Well water) have been collected from different corners of the area (Table 6).
To assess the ground water quality in Rourkela City a total of ten numbers of ground water samples have been collected (all from deep tube wells). The sampling points have been selected according to the location and further use. Most of the locations selected are in thickly populated areas and the tube well caters to the needs of demand for domestic use. The water quality which is found in deteriorated condition would cause damage and affect the health of population in that locality. A brief illustration of the physiochemical parameters as found from the analysis of the samples is given below (Table 7).
PH: The lower value of pH below 4.0 produces a sour taste and the higher value of pH above 8.5 has an alkaline taste. A higher pH not only accelerates the scale formation in pipes but also reduces the germicidal potential of Chlorine. The pH of water in the area varies from 5.33 to 7.06. The lowest value of 5.5 has been recorded at REC campus which may be due to the high iron content found to be 6.9 mg/l. Major use of that tube well water is for drinking purpose and people complain about incipit taste after cooking [11]. The maximum value of pH is found at civil township area (7.06) which is almost in the neutral range. All other values of pH as found out are within the safe limit.
CONDUCTIVITY
It is a rapid method to have some idea about the dissolved solids present in water samples. A higher value of conductivity of water sample indicates soluble solids thereby indicating presented of pollutants. The values recorded for conductivity in water samples collected in Rourkela area are within tolerable range. The minimum value of 91 mg/l has been found at the water sample collected from REC campus and the maximum value of 854 has been found out at Lal Tanki area.
Table 6: Location of sampling stations
S. No. LOCATION 1 DEOGAON 2 LAL TANKI AREA 3 TARKERA VILLAGE 4 CIVIL TOWNSHIP 5 VEDVYAS AREA 6 BASANIT COLONY 7 REC CAMPUS 8 KOEL NAGAR 9 BONDA MUNDA 10 PLANT SITE AREA OPPOSITE TO HIRAKUD DUMP YARD

Abhijeet Das Patel et. al., / International Journal of Engineering & Science Research
Copyright © 2018 Published by IJESR. All rights reserved 9
Table 7: Physico-chemical analysis of Ground water samples
S. No.
LOCATION PH CONDU- CTIVITY
TDS TA TH PO4 NA K PB CU ZN FE
1 DEOGAON 5.33 779 485 132 300 17.2 66 1 0.72 0.67 0.36 0.31 2 LAL
TANKI AREA
5.38 854 488 234 364 2 65 6 0.35 0.4 0.28 0.3
3 TARKERA VILLAGE
5.7 455 277 138 152 2.1 17 2 0.07 1.3 0.43 0.4
4 CIVIL TOWNSHIP
6.28 336 118 98 124 3.2 7 0.1 0.87 2.1 0.03 5.3
5 VEDVYAS AREA
7.06 729 335 282 340 1.9 41 0.1 0.89 1.7 0.31 0.15
6 BASANIT COLONY
6.48 682 390 172 32 4.1 57 1 2.5 3.1 0.34 0.21
7 REC CAMPUS
5.52 91 90 34 86 1.9 0.1 0.2 0.49 2.8 0.7 6.9
8 KOEL NAGAR
6.35 447 280 120 168 4.5 10 2 0.65 2.9 0.36 0.1
9 BONDA MUNDA
6.19 559 380 100 264 4.7 16 2 0.85 3.1 0.05 0.25
10 PLANT SITE AREA OPPOSITE TO HIRAKUD DUMP YARD
6.45 460 338 248 370 1.9 43 4 0.95 3.3 0.17 0.1
TOTAL DISSOLVED SOLIDS: TDS represents mainly various types of minerals present in the water sample. The presence of dissolved solids is a significant parameter in drinking water quality and other water quality standards. It causes a particular taste to the water if the concentration is high it reduces the palatability of water. The TDS value found in the water samples of Rourkela in the range of 90 mg/l to 488 mg/l where the minimum value is found at REC campus and the maximum at Lal Tanki area. All the water samples having TDS in the above range are non-saline in nature according to the US Geological Survey Classification. And also the values are much below the prescribed WHO standard of 500 mg/l.
TOTAL ALKALINITY: The capacity of water to neutralize the acid. is known as alkalinity in itself is not harmful to human health but the portable water supply should have Alkalinity below 100 mg/l. The values obtained for Alkalinity in the water samples are in the range of 34 mg/l to 282mg/l/.
TOTAL HARDNESS: It causes no adverse effect on health and generally hardness below 75 mg/l is termed as soft water and the above 150 mg/l is termed as hard water. A value of hardness more than 300 mg/l is classified as very hard and not useful for domestic uses. The results obtained from the analysis of the water samples indicate the values of total hardness in the range of 32 mg/l to 370 mg/l. The lowest value of 32 mg/l has been found in Basanti Colony area indicating the water to be soft whereas the samples at REC, Vedvyas and Tarkera are moderately soft as the values are below 150 mg/l [12]. Two samples at Deogaon and Bondamunda have within 300 mg/l indicating water to be hard and the samples at Laltanki and plant site area are very hard since the values of the hardness have been found to be more than 300 mg/l. This is due to dumping of various solid waste toxic materials by both RSP as well as Municipality Authority which contains some heavy metals; there is a possibility of leaching of the heavy metals into the soil and thereby contaminating the ground water. The maximum permissible level for different heavy metals such as Copper Iron and Zinc are 1.5 mg/l. 1.5 mg/l and 15 mg/l respectively. The copper has not been detected in any of the water samples collected in the area indicating no leaching of copper from either industrial of municipal waste dumping.

Abhijeet Das Patel et. al., / International Journal of Engineering & Science Research
Copyright © 2018 Published by IJESR. All rights reserved 10
The value of Zinc as obtained from the analysis of the water samples collected vary from .01 mg/l to 0.38 mg/l. Since the desired level of Zinc is 5 mg/l. Most of the samples collected has not exceeded the limiting values. However, the result indicates leaching of zinc from the solid waste dumping site confirming the presence of zinc in the waste dumped.
The potable water standard for iron as prescribed by WHO and ICMR is 1.5 mg/l. All the values obtained from the analysis of the water samples for Iron have exceeded the standard value. Even higher values 6.9 mg/l have been found in the water sample collected from REC Campus. And the samples fromVedvyas also indicate 5.3 mg/lexcept these two, no other water sample indicated alarming figure of iron. The value of lead varies from 0.35 mg/l to 0.87 mg/l. The maximum permissible limit for lead as prescribed by WHO is 0.1 mg/l which indicates all of the samples contain higher lead values. At plant site area and in theBondamunda area lead concentration has been found out to be 9.5 mg/l and 8.5 mg/l respectively. Such high values of lead in these two areas might have been caused due to the leaching from industrial waste and municipal waste dumped nearby that area. The lead concentration at different sampling location indicates leaching from the dumping sites as the sites are very nearer to the sampling collection points. The Concentration of Cd and Ni were found in trace level in all the water samples collected indicating no or negligible leaching from the dumped waste.
5. LEACHING FROM WASTE DUMPS
The integrated iron and steel industry in Rourkela generated various solid wastes during manufacture of various salable products. Such waste differs in composition, characteristic as well as physical state. A part of the waste is also dumped by the unit which may result due to long term exposure causing adverse health effects. The volume of waste generated from RSP dumps about 48% of its total generation of waste on land. This includes waste from Coke Ovens, Coal Chemicals Department, Blast furnace, LDBP, Steel Melting Shop, Rolling Mills, Silicon Steel Mills, Foundry, Power Plants, and Fertilizer Plant. As estimated a total of 510,612 Tons of dust and 60,697.02 Tons of Sludge are generated per year from RSP out of which a part of both dust and sludge are dumped on land [13].
Because of the large waste heaps piled in various parts of the area due to dumping of the waste generated from RSP, not only the visual amenity gents affected but also it becomes anaesthetic. Such open dumping not only contaminates the nearby area but also substances dumped on top become wind borne and creates dust nuisance in the locality. There has been no barrier developed around the dump heaps which could arrest windblown material. This is also a factor for increase in SPM levels in the locality.
Water samples from the Test Well in the dump yard area has also been collected in order to assess if any leaching of materials is caused from the solid waste dumped by RSP. Six of such test wells have been identified and the details of analysis of water with respect to heavy metals leached into the ground are mentioned in Table 8.
Table 8: Ground water quality (Test well water)
GROUND WATER QUALITY(TEST WELL WATER IN PPM) S. No. LOCATION HG ZN CU CD NI PB CR FE 1 BF SLAG DUMP 0.021 2.95 10.5 5.3 7.2 2.62 0.253 0.35 2 GAFUR QUARRY 0.017 0.99 1.67 0.06 1.83 2.21 0.376 0.54 3 LD SLAG DUMP 0.037 0.27 0.92 0.02 0.18 2.27 0.063 0.64 4 LD SLAG
SITALPARA 0.016 0.33 0.42 0.06 0.18 0.19 0.213 0.72
5 F.P 0.45 5.5 0.73 0.43 0.37 0.23 0.35 0.43 6 NEAR F.P 0.32 0.75 0.54 0.47 0.62 0.12 0.35 0.45
6. RESULTS AND DISCUSSION
It has been observed that all the water studied, contains high level of Zn, Cu and Pb which must have been leached from the industrial waste material dumped indiscriminately on the land. The level of copper in the water has been found to be in the range of .42 to 10.5 mg/l. The highest value of copper of 10.5 mg/l has been found at BF slag dump area. Such high value of copper in ground water is unusual and required further study in order to

Abhijeet Das Patel et. al., / International Journal of Engineering & Science Research
Copyright © 2018 Published by IJESR. All rights reserved 11
arrive at any concrete reasoning of such high figure [14]. Since the source of the water is near the BF slag dump area, the leaching of the metal from such waste may not be ruled out.
The value of Zn in few of the water samples have also been found to be in the higher range such as 2.95 – 5.5mg/l. The highest value of 5.5 mg/l has been observed inside the fertilizer plant area; this could be due to the leaching of the metal from the dumping of used Zn catalyst inside the plant. Most of the water samples from iron and steel slag dump area has been observed to be more or less uniform and found in the range of 2.21 – 2.62 mg/l (maximum permissible limit is 0.1 mg/L).
7. RECOMMENDATIONS
· The industries in and around Rourkela should adopt effective pollution control measures for control of water pollution.
· Apart from making PUC certificate mandatory, there should be frequent surprise checks and penalties as per the Act should be imposed on the defaulters.
· RSP and other industries must treat their waste water at each source to meet the quality criteria before discharge and the existing lagoon be considered as the polishing pond to take care only in upset condition.
· There should be common waste effluent treatment plant (CETP) for treatment of waste water generated from small scale industries.
· The municipal sewage water and domestic waste water should be completely treated before mixed with surface water or soil.
· Rourkela municipality should take one or best option for disposal of solid waste and hazardous waste generated from industries.
8. CONCLUSION
RSP generates huge amounts of waste substances (solid waste, waste water) during the process of manufacturing of iron and steel. Other different small and large scale industries and domestic waste of the city also produces huge amount of solid and liquid waste, which mixed with both ground water and surface water. The water pollution problem in this city is of two types. The industrial waste water which is partially meeting the prescribed norm of discharged water quality is discharged into the river Brahmani . The water pollution study of river Brahmani with respect to some important parameters in the downstream stretches indicating pollution load of water due to industrial as well as domestic sewage discharge. Such untreated discharge of waste will enhance the pollution load of river water making it unfit for human use [15]. The variation of PH of the water samples is uniform throughout and remains consistent except few occasions. The parameters BOD, COD and Ammoniacal nitrogen in the downstream water of river Brahmani are in much higher side indicating the heavy pollution level of river. The higher values of BOD have been caused not only due to the industrial source but also due to the discharge of untreated sewage from the city area to the river directly without any treatment. The higher values of Ammonical nitrogen may be attributed to the release of the pollutant from the industrial sources only. The much higher values of heavy metal in both surface and ground water is due to heavy industrial pollution. Therefore, the present study reveals that concerted effort is required by all segments of the society including the Govt., industries public in general for environmental protection before the assimilative capacity of the environment becomes saturated.
REFERENCES
[1] Naik S. Studies on pollution status of Bondamunda area of Rourkela industrial complex, 2005. [2] Pande KS, Sharma SD. Pollution Research 1999; 18(3): 335-338. [3] Singh TB, Indubala, Singh D. Pollution Research 1999; 18(1): 111-114. [4] Srivastava RK, Srivastava S. Assessment of water quality of river Gaur at Jabalpur. Indian J. of Env. Protection 2003; 23(3): 282-285. [5] Kaur H, Syal J, Dhillon SS. Water quality index of the river Satluj. Poll Res., 2001; 20(2): 199-204.

Abhijeet Das Patel et. al., / International Journal of Engineering & Science Research
Copyright © 2018 Published by IJESR. All rights reserved 12
[6] Pani BS. “Outfall diffusers”. In. Abstract of the National Seminar on Air and Water Pollution, April 1986, University College of Engineering, Burla. [7] Amman AA, Hoehn E, Koch S. Groundwater pollution by roof infiltration evidenced with multi-tracer experiments. Water Research 2003; 37(5): 1143-1153. [8] Sinha DK, Saxena S, Saxena R. Ram Ganga river water pollution at Moradabad –A physico-chemical study. Indian J. of Env. Protection 2004; 24(1): 49-52. [9] Bhadra AK, Bhuyan NK, Sahu B, Rout SP. Assessment of the Water Quality Standard of Brahmani River in terms of Physico-Chemical Parameters 2014; 2(12): 1765-1772 [10] Samantaray P, Mishra BK, Panda CR, Rout SP. Assessment of water quality index in Mahanadi and Atharabanki rivers and Taladanda canal in Paradip area. India, J. Hum. Ecol. 2009; 26(3): 153-161. [11] Singh BC, Mohapatra UK. Physico-chemical and Bacteriological Parameters in various sources of Drinking water in the old Capital City of Cuttack. J.T.R. Chem 1998; 5(1): 44-50. [12] Memon M, Soomro MS, Akhtar MS, Memon KS. Drinking water quality assessment in Southern Sindh (Pakistan). Environmen. Monit. Assess 2011; 177: 39-50. [13] Cobbina SJ, Nyame FK, Obiri S. Groundwater Quality in the Sahelian Region of Northern Ghana. West Africa. Res. J. Environ. Earth. Sci. 2012; 4: 482-49. [14] Panda RB et. al., A comparative study of ground water vs surface water in the basin of the river Brahmani at Rourkela Industrial complex, J. Eco Toxicol. Env Monitoring 1991; 1(3): 206-217. [15] Panda RB, Karim AA. Assessment of Water Quality of Subarnarekha River in Balasore Region, Odisha, India, Current World Envionrment 2014; 9(2) 437-446