surface analysis in atmospheric environmental studies
TRANSCRIPT
SURFACE AND INTERFACE ANALYSIS, VOL. 12, 551-564 (1988)
Surface Analysis in Atmospheric Environmental Studies
F. Adarns and J. De Waele Department of Chemistry, University of Antwerp (U.I.A.), B-2610 Wirijk, Belgium
Surface analysis can now be applied on the microscopical level using a number of instrumental analytical tech- niques. A review is given of the field of air pollution and a brief description is presented of a number of examples from our laboratory practice concerned with the characterization of air particulates and emission samples or the surface characterization of pure and modified asbestos fibres.
INTRODUCTION
In the characterization of complex environmental materials such as atmospheric particulate matter, ana- lytical specificity is required to account for the many dimensions of information present in the sample. These dimensions include size, morphology, elemental com- position, inorganic and organic chemical speciation, all to be performed on either single particles or on the population (or bulk sample) basis. Various techniques were developed for such measurements, including a number of bulk analysis procedures, methodologies for microscopical analysis of individual particles, and a variety of procedures for organic chemical speciation. We refer to several recent handbooks for detailed descriptions of the state of de~elopment.’-~
One area of special concern is the determination of chemical composition and structure of the surface layer of natural and anthropogenically generated atmospheric particles. Indeed, condensation and evaporation are important for aerosol formation and growth processes. Besides, chemical reactions on individual particles are responsible for often drastic changes of the bulk chemi- cal composition and structure, and for the differences in composition of the surface layer and the interior of dis- crete particles. It is, of course, the surface which is the active zone for most heterogeneous reactivity with gaseous and solution species and for catalytic activity. Also, a t present it is clearly demonstrated that the effec- tive toxicity of respirable particles critically depends on the nature of the toxic species present, on the particles’ size distribution within an aerosol, and finally on the efficiency with which toxic compounds are extracted by body fluids in the region of respiratory deposition. Thus, the importance of volatile species that become adsorbed onto the particle surfaces during the forma- tion and growth process should be stressed particularly because it is the particle surface which is in immediate contact with the extraction fluids and the body tissues after inge~t ion .~
Assessment of the potential environmental and toxi- cological effects of particulate matter in the atmosphere requires detailed chemical but also physical character- ization of the particles. An important distinction between individual particles is their size. The size range
01 42-242 1/88/24055 1-14 $07.00 0 1988 by John Wiley & Sons Ltd
of atmospheric particles varies from submicrometre dimensions to several hundred micrometres. However, the difficulties for microscopical and analytical study (and the cost involved) increase sharply with decreasing size and most of the work reported up to now in the literature deals with particles of diameter well above 1 pm.6 Nevertheless, it is the smallest particles, with the highest surface-to-volume ratio which are the most important entities in many respects.
For the sake of the discussion that follows we will define the surface of environmental particles in an oper- ational manner as that surface part whose properties (and composition) differs from those of the interior for any of the properties of relevance in atmospheric chem- istry or pollution studies. It is not possible to make an unambiguaus statement on how thick such a surface layer really is, neither is it important in many areas of concern to be able to probe the surface in an atomic layer by layer approach. However, it is clear that as particle size decreases the surface ‘shell’ becomes of more importance in comparison with the central ‘core’ of the objects. Specific questions which are addressed in the characterization of particle surfaces concern the surface composition related to the bulk composition and are related to particle size and to the enrichment (or the depletion) of specific elements and compounds at the surface.
The surface area of a collection of particles is not always an easily definable entity and neither is it always readily accessible for measurement and analysis. Let us take coal fly ash as an example. Coal fly ash contains finely dispersed carbonaceous material, primarily con- sisting of elemental carbon and associated organic matter. These particles have a large surface area and a highly porous ‘spongy’ appearance, and are the result of incomplete fuel combustion processes. This porosity gives rise to considerable hysteresis in the adsorption- desorption behaviour and it also may influence the chemical state of the adsorbed species for instance by shielding material contained in the pores from degrada- tion in the atmosphere. Apart from this carbonaceous fraction a variety of more or less spherical ash particles and crystalline formations appear with a variable dia- meter. These show a surface roughness which is con- siderably higher than that of a non-porous solid. Observation by scanning electron microscopy indicates

552 F. ADAMS A N D J. D E WAELE
Figure 1. Secondary electron micrographs of two morphologically distinct particles obtained from fly ash from a coal-fired electric plant. Top fly ash, bottom carbonaceous particle.
a variety of submicrometre particles and crystalline for- mations attached to the surface of the larger en ti tie^.^ A typical electron micrograph of a particle from both categories is given in Fig. 1.
The surface area as obtained from gas adsorption iso- therms and the surface morphology as obtained from electron microscopy is a first prerequisite for detailed studies of these and other emission particles.' These data ideally must be obtained for samples obtained under carefully controlled conditions with an equipment which provides well known size fractions of the particle collections.
TECHNIQUES FOR SURFACE ANALYSIS
Techniques for surface analysis such as x-ray photoelec- tron spectroscopy (XPS or ESCA), Auger electron spec-
troscopy (AES) and secondary ion mass spectrometry (SIMS), are increasingly applied on a particle aggregate basis for the analysis of surface composition and struc- ture of environmental samples such as air particulate matter and sediment particles. The surface-sensitive techniques, in conjunction with surface erosion under ion bombardment, have a potential for supplying ele- mental and chemical depth profile information. In most of the studies performed thus far with these methods, collections of particles were used, thus obtaining data averaged over many particles in a particular sample. Such studies suffer from a major limitation caused by the fact that environmental particles are morphologi- cally and chemically heterogeneous even after size clas- sification. Thus, in such studies it is impossible to differentiate between a high concentration of a given component present in only a few particles or a low con- centration present in most of the particles. In principle, low energy ion scattering spectroscopy (ISS) and

SURFACE ANALYSIS IN ATMOSPHERIC ENVIRONMENTAL STUDIES 553
Rutherford backscattering spectrometry (RBS) could also be applied but environmental applications are almost non-existent in the actual literature.
During the past decade some of these methods became gradually available as microanalytical tech- niques (e.g. SIMS in the ion microprobe or the ion microscope and electron spectroscopy in the scanning Auger electron microscope or SAM). Also novel micro- scopical methods appeared which show a potential for surface analysis such as laser microprobe mass analysis or laser micro mass spectrometry (LAMMS or with the acronyms for commercial equipment laser microprobe mass analysis, LAMMA, or laser induced mass analysis, LIMA).
The more conventional analytical electron micro- scopy (AEM) methods have evolved into specialized instruments such as the scanning electron microscopy with x-ray analysis (SEM-EDX), the scanning transmis- sion electron microscope (STEM) and the electron probe microanalyser (EPXMA). These methods have a limited direct surface discrimination potential, although they can be applied for the determination of the surface morphology of particulate material (by secondary and backscattered electron imaging) and the determination of the composition of any topological differences com- pared to the bulk (e.g. by x-ray mapping). In general the surface discriminating potential of the conventional high energy (> 15 keV) electron microscopes is insuffi- cient for the study of surface enrichment in environmental applications as the depth resolution is usually greater than the thickness of the surface layer normally of interest. However, the method is used very often alone or in conjunction with other methods.
The advent of the commercial low voltage scanning electron microscope (LVSEM, energy 0.5 to 10 keV) has led to the resurgence of interest for a wide variety of materials including environmental sample^.^ The use of low energy electrons in the range of 0.5 to 5 keV also allows quantitative analytical information to be obtained with a mean information depth of less than 0.1 pm." Another electron beam method that evolved in a microanalytical technique is electron energy loss spectroscopy (imaging EELS).' The method cannot possibly be termed a surface analytical tool but it requires samples with a thickness of the order of less than 0.1 pm for which the surface to volume ratio is very high. Reproduced as an illustration in many pub- lications is Fig. 2, which displays in a clear way the surface and the microscopical potential of the various methods mentioned in this paragraph.6
Several authors have critically evaluated the applica- tions of surface techniques (photoacoustic infrared spec- troscopy, x-ray photoelectron spectroscopy, secondary ion mass spectrometry) in the analysis of aerosols and have compared the utility of all these methods for chemical characterization for specific samples such as, for example, fly ash from steel blast furnaces or from various combustion processes. The rapid development of these methods and their applications are documented in several review paper^.^^'^
In this paper we will review some applications of the analysis and characterization of the surface of airborne particles. The results which can be considered as typical for the actual possibilities within this instrumentally and methodologically complex field are selected as illus-
r--------1 I AUGER
lo-'%
lo-6 '
I o - ~
I
10-2 1 t
100 I I I I I I I I I I
10"' 10-8 10-6 I O - ~ 10-2 l o o m
Figure 2. Typical ranges of dimensions of excited regions with several techniques: AEM, analytical electron transmission micro- scopy; AUGER, electron probe Auger microanalysis; EELS, elec- tron energy loss spectroscopy; EPMA, electron probe microanalysis; MRS, micro-Raman spectroscopy; SEM, scanning electron microscopy; SI MS, secondary ion mass spectroscopy (ion probe microanalysis); XRF, x-ray fluorescence. The horizontal scale represents the diameter of the analysed region in the plane of the specimen surface and the vertical scale represents depth. (From Ref. 6.)
trations for the existing possibilities. Also, they show the importance of surface analysis on the microscopical level for both environmental chemistry and the study of environmental pollution and its impact on human health. Thus, it is not by any means an exhaustive review of the subject. Some applications of the work within the laboratory of the authors will also be described and briefly commented upon.
SURFACE ANALYSIS OF ENVIRONMENTAL PARTICLES
Detailed investigation of atmospheric particles is invari- ably difficult, time-consuming and costly, and hence, the extraction of meaningful information is usually far from obvious. Indeed, the most interesting objects for study are small ( < 5 pm) and the morphology and chemical composition of the surface area is mostly very complex.
Full analytical strategies for surface characterization were summarized by Grasserbauer as follows :' - characterization of the morphology and elemental
surface concentrations with SEM, STEM, AES, XPS, and SIMS;
- investigation of the chemical state of surface material usually with XPS;
- determination of the volatile surface components through surface desorption using thermal processes with compound specific detection or chromato- graphic separation and the determination of the soluble surface components with leaching experi- ments followed by trace analysis from solution.

554 F. ADAMS AND J. DE WAELE
Such fully detailed studies have not yet been performed, and in fact they would be seldom required for practical pollution abatement strategies, in the first place because they could not be performed in a routine fashion. Most studies performed to this date attempt to provide a suf- ficient amount of information in a short time with minimal sample handling, preferably utilizing a single instrument or technique. Up to now, most work has concerned the study of fly ash emissions, but also there is now an increasing amount of work performed for the characterization of the natural marine or continental aerosol.
The earliest basic work on the instrumental study of the particle surface was performed by Natusch, Evans Jr., Linton and coworkers at the University of Illinois and later at Colorado State University for the study of coal fly ash, automobile exhaust, open hearth furnace dust and coal conversion catalysts. Their work was centred on the use of EPXMA and/or SEM-EDX, AES- SAM, ion microprobe analysis and more conventional techniques such as the so-called time resolved solvent leaching in which the sample is subjected to the action of selected solvents and the leachate is analysed as a function of time. The surface predominance of toxic ele- ments was clearly put in evidence in this work for the first X-ray photoelectron spectroscopy was also rapidly recognized as an interesting technique for surface analysis of air particulate material. Novakov et ~ 1 . ’ ~ pioneered in demonstrating the utility of XPS in speciation studies of particles and in studies of reactions on particle surfaces. Work until 1978 was discussed by Powell’ for electron spectroscopy and by Newbury” for SIMS.
Electron spectroscopy
AES combines high spatial resolution with a favourable surface sensitivity of 50 to 200 nm. When a fine-focused primary electron beam is utilized, the analytical volume is several orders of magnitude smaller than that of the EPXMA or SEM/EDX. Therefore, the technique can be employed as a near-surface analytical tool with excep- tionally high lateral resolution. The growth of the use of SAM on insulating surfaces was hampered by the charging problems and also by the surface degradation effects of the electron beam which easily affect the Auger spectra.
A general survey of the problems encountered in the application of high resolution Auger microscopy for the quantitative analysis of electrically insulating mineral
surfaces is given by Hochella et a1.” The potential of the method in environmental analysis was first demon- strated by Linton et by Cheng et ~1.’’ and by von Rosenstiel et a/.” The strong surface predominance of carbon and sulphur on fly ash particles was first demon- strated in their work.
For the specific purpose of the analysis of environmental particles it is of significance that SAM is capable of a lateral resolution better than a few tenths of a micrometre on insulating samples if the material of interest is within a few micrometres of a conducting substrate as a support. Hock and Lichtman studied the surface layer of single particles of a coal fly ashz2 and found that there is a wide chemical and physical dis- parity between particles even in a limited sample range. The data shown in Table 1 give elemental composition at the virgin particle surface, and after sputtering 1 nm and 3 nm below the surface. The particles were partially covered with a very thin (< 1 nm) layer of carbon, prob- ably in the form of hydrocarbons. Also present in the surface layer were S and C1, which were removed to varying degrees as subsurface layers were sampled. Even with the presence of the surface layer, the basic structur- al elements (Si, A1 and 0) were detected, an indication of the shallowness of the hydrocarbon layer.
X-ray photoelectron spectroscopy cannot be applied at the microscopical level but it is powerful enough for the investigation of the chemical state at the surface of particles. The photoelectron binding energy shifts cor- rected for electric charging are indicative of the chemi- cal state and in-depth information is made available by sputtering with an ion gun. Gardella and Herculesz3 applied the method on coal fly ash and on volcanic ash and evaluated the quantitative potential with the USA National Bureau of Standards standard reference materials (SRM) 1648 (urban particulate matter) and 1633a (coal fly ash). The method was exploited using measurements on particle aggregates instead of well- defined individual particles, a factor which in principle is only of importance for heterogeneous aggregates. A review of XPS for the analysis of particles is given by David~on.’~ The chemical state of sulphur associated with the aerosol is especially relevant in environmental pollution control, especially in studies aimed at effec- tively reducing the SO, emissions during coal com- bustion. A number of studies were performed by XPS. The presence of sulphur species with different chemical states including sulphate, sulphite and chemisorbed SO2 and SO, on the surface of soot particles and atmo- spheric aerosols was measured.2s326 Also, sputtering
Table 1. Auger depth profile for coal fly ash2*
Virgin surface 1 nm below surface 3 nm below surface
Element I’ s ?4 I 5 % X s %
Be 0.81 3.25 6 C 29 14 100 74 11.6 27 3.8 10.4 13 AI 1.2 1.8 44 1.5 1.9 53 2.4 2.1 75 Si 1.6 1.9 63 2.0 2.5 67 2.6 2.6 75 P 0.25 1 6 CI 5.4 3.8 100 3.7 3.3 73 3.1 3.0 75 Ca 2 3.6 31 1.4 3.7 13 2.1 4.6 25
a Average composition in percentage, standard deviation of population and fraction of particles that con- tained the element at concentration > 1 %.
- - - - - -
- - - - - -

SURFACE ANALYSIS IN ATMOSPHERIC ENVIRONMENTAL STUDIES 555
SMELTER DUST
WATER LEACHED
DUST
I . LEACHATE SOLUTION (RESIDUE)
LEACHATE SOLUTION (RESIDUEI
I(dl
I W I b TREATED
583 580 575 57 1
BINDING ENERGY. PV
Figure 3. XPS data obtained from the Cr 2p,,, photoelectron peak of (a) ferrochrorne smelter dust, (b) the dust after extraction with water, (c) the residue of the dried aqueous extract, and (d) the residue of the dried extract, after treatment with 2-propanol and acetic acid. (Reproduced, with permission, from Ref. 28).
showed that normally all of the sulphur is associated with the upper 100 to 200 nm surface layer.27
In a study by Cox et aLZ8 chromium speciation in and on particles from a ferrochrome smelter was deter- mined using XPS and various other techniques includ- ing SEM-EDX and different procedures for wet chemical analysis including alkaline, alkaline/acid and aqueous leaching. A distinction was made between Cr3+ and the toxic Cr6+ and this speciation could be related to the surface predominance, and to the pre- sence of the Cr6+ in the small particle fraction. An XPS spectrum of the chromium peaks is shown in Fig. 3.
The composition of the outer layers of submicrometre fly ash particles originating from a coal-burning power- generation station was studied for a large number of elements by means of XPS in conjunction with Ar ion bombardment.'' A surprising observation was the surface predominance of Si relative to Al. Indeed, it seems to contradict frequent measurements on bulk samples of air particulate matter which indicate a Si/A1 ratio in the aerosol which is lower than that in the average earth crust.30
XPS is not sensitive enough to detect many trace ele- ments of environmental interest, e.g. Se and As, and, therefore, the oxidation states of the trace elements must be defined from their chemical behaviour.
Electron microscopy
The studies involving SEM-EDX are numerous and we will just give a few characteristic examples. Many of the
studies mentioned in the previous paragraphs rely heavily on electron microscopy for the characterization of the surface morphology and the overall composition of the objects studied. One specific example involving the use of the SEM and x-ray microanalysis is the study of submicrometre coal fly ash particles performed by Lichtman and Mroczk~wski.~' Variations in topo- graphy between samples obtained from different coals were measured and the composition of surface nodules at the particles with, for example, an elevated concen- tration of sulphur could be determined. Another detailed study concerns the quantitative analysis of the micrometre size lead halide particles in the urban aerosol.32 The authors succeeded in determining quan- titatively the Br/Pb ratio in submicrometre particles, thus providing additional evidence for a decade-long discussion on the loss of bromine from this type of particles.
Secondary ion mass spectrometry
Up to now SIMS with ion microscopy or ion micro- probe analysis has been applied mostly for the study of particle aggregates and rather exceptionally for the analysis of single particles. Indeed, until the recent past, commercial instrumentation lacked sufficient lateral resolution to study individual particles in a more or less routine way. The method was important in providing the surface enrichment of a number of metal^.'^,'^,^^ Only recently, Cox et obtained analytical data on individual particles with an ion microscope, using a digital imaging system. Small regions within individual particles were selected for computer-reconstructed local area depth profiles.
The advantages of the technique are numerous: the shallow surface information depth of about 1-2 nm (but with the possibility for dynamic depth profiling through sputtering) and the capabilities for the sensitive detec- tion of all elements, for isotope ratio measurements and for detection of molecular entities. Complicated organic molecules present at the particle surface can only suc- cessfully be sputtered away from the particle surface in the static SIMS conditions with a very low primary beam current. In these conditions the beam size must be quite large in order to preserve a sufficiently high sensi- tivity. With ion microprobes operated in the regime midway between the static SIMS (lo-' A cm-') and the dynamic SIMS (lo-' A cm-2) limited molecular information has been obtained.18
Laser micro mass spectrometry
Although the commercial laser microprobe mass analysers were developed for trace elemental a n a l y s i ~ , ~ ~ . ' ~ applications on molecular surface- sensitive microanalysis became important recently in many The intensity of the laser ion source can easily be varied to provide a wide range of ionization condition^.^' At irradiance conditions close to the threshold of ion formation (laser desorption, LD), ions will preferentially desorb from the target surface and promote parent ion f~rmation.~' Thus a low irra- diance, possibly slightly defocused beam aimed at the
556 F. ADAMS AND J. DE WAELE
particle surface will lead to selective removal of surface material while the particle remains intact and no gross morphological changes are observed. Limited ‘finger- print’ information on inorganic species can be obtained which can be compared with the mass spectra obtained from reference compounds. Organic compounds provide in general a limited number of ion species which are often directly related to the structure of the material analysed, often with a high yield of the parent molecular ion (M)’, protonated (M + 1)+ or cationized species (M + Na)’ or (M + K)+.41 Thus far the method can only be applied for the major constituents of the sample and with a limited quantitative ability. However, the procedure has proved to be useful in the character- ization of asbestos fibres4’ and aerosol^.^^.^^
A number of examples of this promising, but in its present state of development rather qualitative method, will appear further on in this text. Reviews of the appli- cations in air particulate analysis45 and asbestos r e ~ e a r c h ~ ~ , ~ ~ are available. It has been proposed to utilize the low intensity ‘laser desorption’ regime to probe the organic constituents of specimens, minimizing f r agmen ta t i~n ,~~ .~ ’ and applications on mapping of organic compounds with a lateral resolution of 2.5 pm have been propo~ed.~’ However, the extent of fragmen- tation depends on the specific materials present in the sample. Easily ionized and thermally stable compounds such as the polyaromatic hydrocarbons (PAH), are prominent in many spectra of environmental particles, while other compounds such as aliphatic hydrocarbons are not. This permits tremendous chemical discrimin- ation to be achieved by the laser mass spectrometer; it is uniquely suited to the analysis of PAH in particu- l a t e ~ . ~ ~ On the other hand the ability to examine more labile compounds is considerably more limited.
Solvent leaching
The most frequently exploited method for studying surface predominance of elements and organic com- pounds on the particle surface is an indirect method using solvent leaching and subsequent trace analysis by any of a group of sensitive methods such as, for example, atomic absorption spectrometry for metals, ion chromatography for anions or gas chromatography-mass spectrometry (GC-MS) for organic compounds. This method suffers from obvious drawbacks, especially for materials which are heter- ogeneous in size and composition. Leaching can be described in a straightforward way for simple industrial materials but little is understood of the fundamental mechanisms for complex environmental materials.
In view of the time and cost of the application of any of the instrumental methods of analysis, leaching studies are considered interesting and cheap alternatives. Besides, especially for the organic trace constituents such as the PAH and their chemical transformation products in the atmosphere, no operational instrumen- tal alternatives are available yet. A typical study which includes speciation of the inorganic surface contamin- ants (anions and cations) of size-fractionated coal fly ash was published by Hansen et al.49 It appeared in this study that the surface composition is determined by factors such as concentration of basic metal oxides at
Table 2. Cations associated with sulphate ion in 2.2 pm ash”
Element
Fe Na Ca M9 Al Ba Zn K Ga Mn cu Cr Pb
Oxidation state assumed
3 1 2 2 3 2 2 1 3 2 2 3 2
% of non-cation equiv
35 22 13 1 1 10 4 2 1 0.6 0.4 0.3 0.2 0.2
% of soluble cation equiv.
0.5 12.1 49.4 3.7 33.4 - - 0.5 - - - - -
the surface of the particle at the time it exits from the combustion zone, the concentration of acid gases present in the flue gas and the temperature and contact time between gases and particles. The results in Table 2 provide information on the major cations associated with surface sulphate for 2.2 pm coal fly ash particles.49 The rate of leaching of transition metals from coal fly ash using a range of chelating agents such as EDTA and citric acid but also ‘biological’ chelators such as histidine and glycine was studied by Harris and Silberman.50
Organic compounds at the particle surface
Polyaromatic hydrocarbons constitute the most impor- tant class of organic aerosol components. They are gen- erated in a variety of combustion processes and become preferably associated at the surface of the smallest (submicrometre) atmospheric particles.” The carcino- genic and the mutagenic properties of the organic extracts of collected particulate matter from the atmo- sphere cannot be explained by the PAH alone and various derivates or heteroatom analogues formed in the atmosphere under the influence of light and reactive chemicals also exist at the particle surface. Interactions of PAH with atmospheric pollutants leading to nitra- tion were studied by Grosjean et aL5’ and by Lindskog et a1.53 and to chlorinated products by Eiceman and RgheLS4 Conversion of PAH under the influence of ozone was studied by Van Vaeck and Van Cauwen- berghe.55 For fly ash the decomposition rate has been shown to be substrate-dependent,56 an observation which indicates that any studies on the transformation processes in nature should either utilize a homogeneous well-characterized substrate or else should start from measurements from individual particles.
The presence of PAH on the surface of single par- ticles originating from combustion processes has been demonstrated. Also, the surface reactivity of the PAH was directly measured on alumina and silica particles using infra-red photoacoustic spectroscopy (PAS-IR).57 The specific advantages of PAS-IR over the convention- al technique for the study of fine particulate specimens is that no sample preparation is required and that with a sample as small as 2 mg adsorbed organic compound can be measured in situ with a detection limit of 0.2

SURFACE ANALYSIS IN ATMOSPHERIC ENVIRONMENTAL STUDIES 557
Figure 4. Photoacoustic spectra of 9-nitroanthracene adsorbed on (A) Cabosil silica (0.6 monolayer, 98 mg g- ' ) and (6) Spher- isorb alumina (0.9 monolayer, 62 rng g-').
monolayers. Fig. 4 shows a spectrum of 9-nitro- anthracene as 1 monolayer on silica and the spectrum of anthraquinone produced after UV irradiation of the sample. However, most of the work performed in this environmentally and toxicologically important area was obtained with organic trace analysis after extraction of the compounds with a suitable apolar solvent.
It could be assumed that the enrichment of elemental impurities and organic compounds as measured as a function of particle size is an indirect result of the surface predominance, the larger surface of the sub- micrometre particles accumulating most of the conden- sation products from the gas phase. This is too simple an assumption and it was demonstrated for different materials that the nature of the particle substrate also plays an important role. Griest and Tomkins5' demon- strated clearly that for stack fly ash, the carbonaceous fraction adsorbs more effectively the PAH. Significant for methods relying on analysis after extraction of bulk amounts of material is that these particles also control the extraction recovery of the large ring PAHs, while the recovery of the degraded PAH is influenced more by the mineral particles. Hence, analysis by bulk methods may not reflect the true composition and the heter- ogeneity distribution of the organic compounds sorbed onto different particle types constituting fly ash. Mea- surements of surface area and porosity of size- fractionated coal fly ash particles and of morphology by SEM indicated that the small ash particles are predomi- nantly non-porous spheres with irregular surface mor- phology and with the suiface area being dependent on particle size. However, a large part of the surface areas was attributable to large porous carbonaceous particles resulting from incomplete coal combustion.' XPS was applied by Feerer et for the determination of a conceptual model for leaching of retorted oil shale. As the soluble material disappeared from the surface the
shift in binding energy as determined by XPS indicated the change in chemical environment of the elements at the surface.
APPLICATIONS
To illustrate the potential of microanalysis for the detection of surface impurities we give in what follows a few examples obtained in our laboratory. The examples are concerned with the application of LAMMA, SIMS (ion microscopy) and EPXMA. It will be apparent that, except for the data obtained with SIMS, the surface definition is usually poor. Indeed, it is only through the available evidence from atmospheric chemical processes and with the support from other analytical methods that often the surface predominance is clearly substan- tiated.
SIMS-ion microscopy of surface enrichment in particles
Ion microscopy was used by Van Craen et al. for quan- titative surface analysis6' and for the determination of surface enrichment of electrical steel furnace dust par- t i c l e ~ . ~ ~ Pellets of the dust were used for analysis and it was assumed that the variation of intensity for the pellet corresponds with that of single particles. A few profiles as obtained in the study are shown in Fig. 5. Typical surface enrichments in an electrical furnace dust are given in Table 3. The data provide support for already available data on the surface predominance of a number of elements, namely those that are volatile as either the element or the oxide at the temperatures encountered in the furnace (1500 "C). Incidentally, these were also present as more or less soluble salts and were easily leached in aqueous solvents. Significant in this study was also the close correspondence of the analytical data with those obtained by leaching experiments and bulk analysis using x-ray fluorescence. Also, it was attempted to derive molecular data on the salts present from high resolution negative mass spectra. The cluster ions of sulphur and oxygen and the elemental peak intensity of
Table 3. Mean and extreme surface enrichment factors (SEF) for some elements in electric furnace d u d 3
SEF Element Mean Extreme
Al 0.95 1.65 Si 0.7 0.7 CI 1.6 - 3 Ca 1.25 1.25 Ti 0.7 1.2 V 0.7 1.15 Cr 1.5 1.5 Mn 2 2.25 Fe 0.7 0.7 co 28 28 cu 2.3 2.3 Zn 1.7 1.7 Pb 2.1 2.5

558 F. ADAMS AND J. D E WAELE
EROSION TIME [rnin)
intensity scale are subject to many disturbing factors. Nevertheless, the surface sensitivity of the LD detection can be exploited, for example, for the study of reaction processes in the laboratory of pure PAH in reactive environments on well-characterized substrates such as the NaCl (a model substrate for the sea salt aerosol) or on various carbonaceous materials).
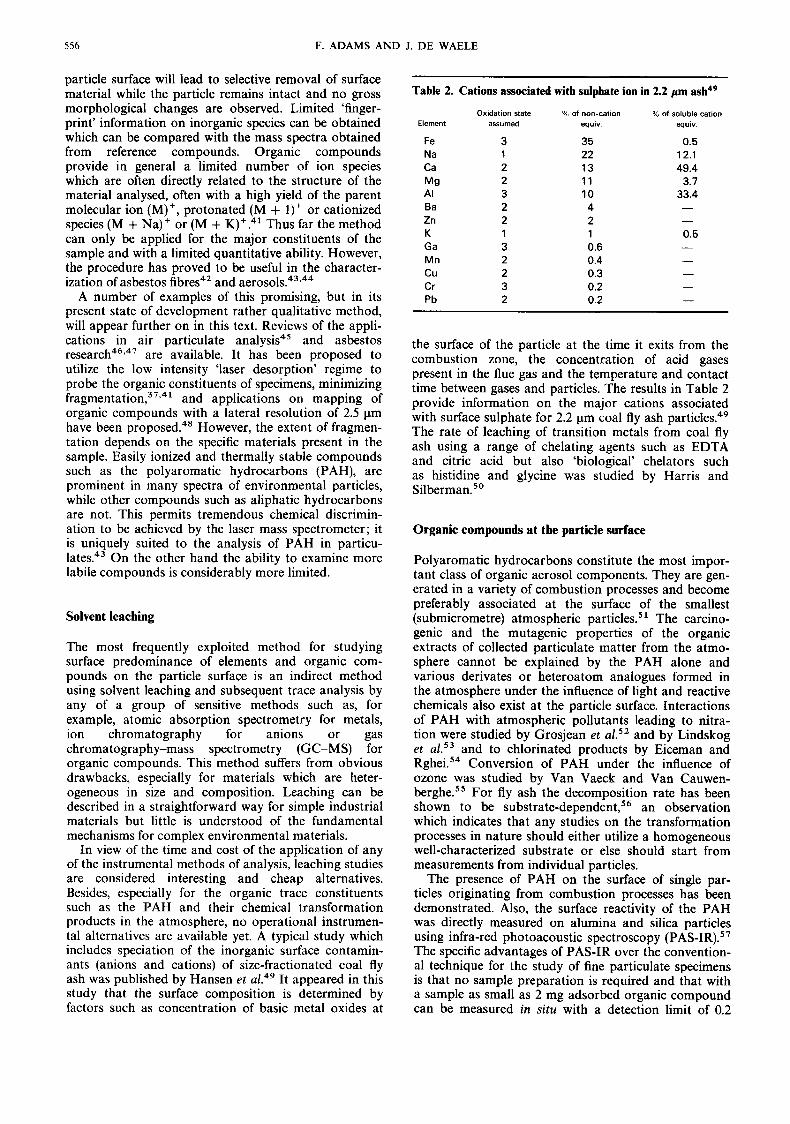
The direct measurement of PAH on environmental soot and other emitted particles in the atmosphere was demonstrated by Mauney and ad am^^^ and Denoyer et ul.62*63 The spectrum in Fig. 7 shows the presence of a number of PAHs. Supporting evidence by chromato- graphic analysis was obtained. The compounds that were identified are listed in Table 4. Dutta et al. also observed alkyl-substituted ~ h e n a n t h r e n e . ~ ~
b Inorganic surface speciation of single particles by LAMMA
C
EROSION TIME ( m i n )
Figure 5. Secondary ion sensitivity of 5'V+(a), 52Cr+(b), and 59C0+(c) relative to 58Fe+ as a function of erosion time for the furnace dust. (0 before leaching, 0 after leaching). (Reproduced, with permission, from Ref. 33.)
both elements did not correspond to sulphate but to a lower but undefinable oxidation state, and to the pre- sence of fluoride, phosphates and chloride.
Detection of PAH on individual particles
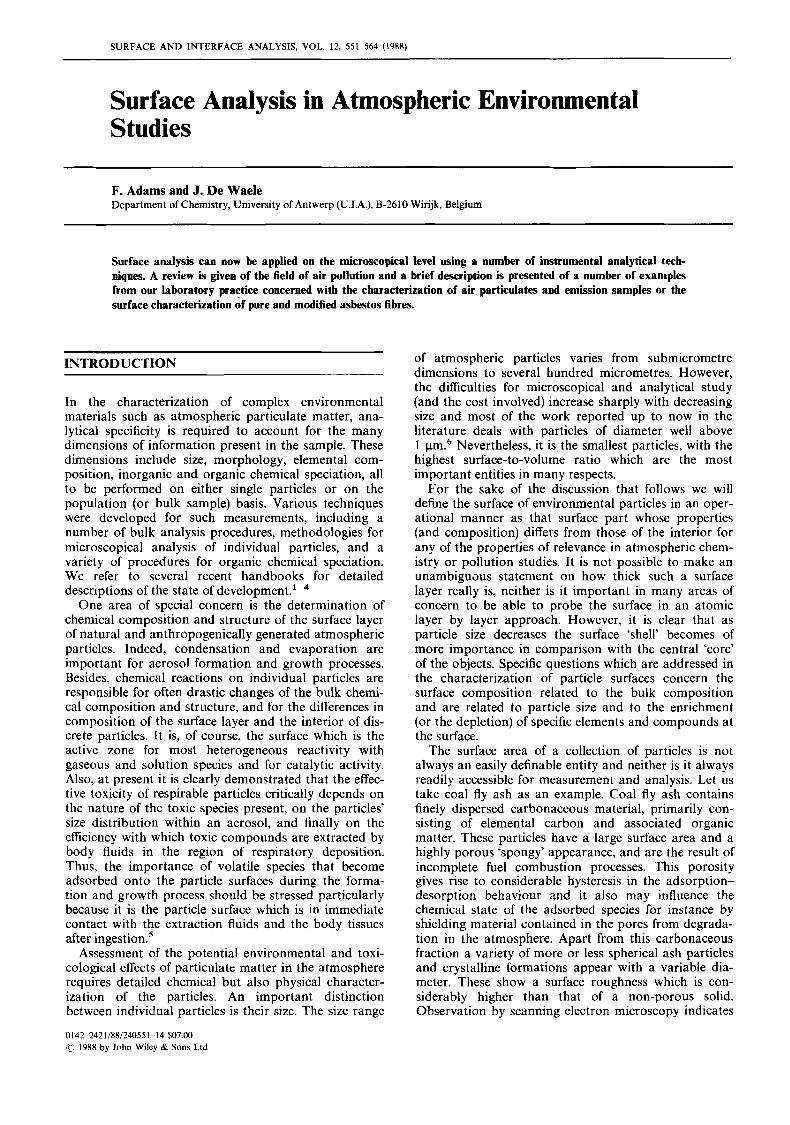
Several types of particles such as soot from an experi- mental oil shale retort, coal fly ash and laboratory gen- erated particle (e.g. NaCl coated with PAH from the gas phase) were studied by LAMMA in the laser desorption mode. Figure 6 shows a series of analyses on a single anthracene-coated particle as described by Niessner et ~ 1 . ~ ~ The PAH is clearly detectable on the first shots after which the NaCl substrate becomes apparent. Such measurements lead to the conclusion that LAMMA has potential for depth probing. It appeared in careful com- parisons between the results of the method and methods with true depth-probing ability that this is a rather sim- plified picture and that both the depth scale and the
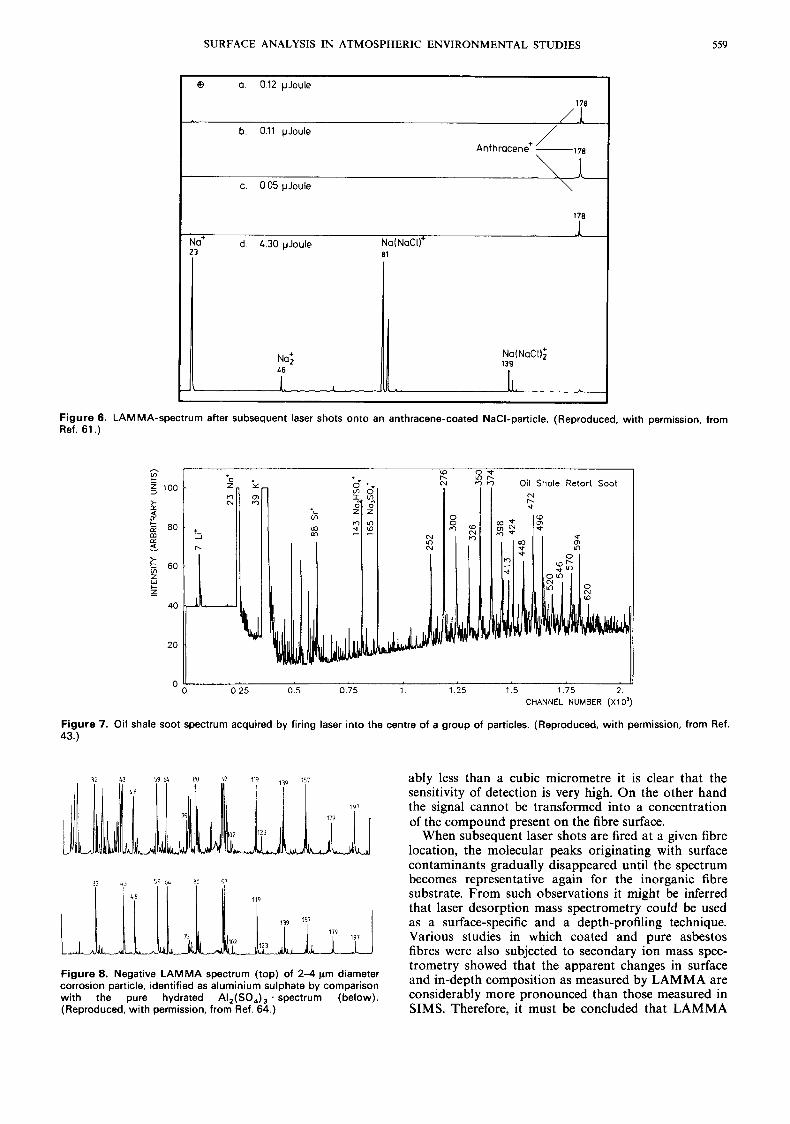
Besides the capability of detecting organic compounds, laser microprobe mass analysis offers a limited potential as an inorganic molecular microprobe. The fingerprint positive and the negative mass spectra can therefore be compared with the spectra of reference compounds and a surface selectivity occurs when low laser intensities are used. The method nevertheless suffers from the non- reproducible nature of the spectra obtained and is of a qualitative nature. The two following examples illus- trate the possibilities. Figure 8 shows a positive spec- trum of a corrosion particle on aluminium wire and the reference spectrum of AI,(SO4)3 indicating that the metal corrosion process originates with sulphur oxides.64 Figure 9 shows positive and negative spectra of a sea salt particle which indicate the presence of a mixture of NaCl, Na2S04 and NaN03.65 X-ray powder diffraction and wet chemical experiments have shown that micrometre-size NaCl particles are coated with a surface layer and also scavenge SO,, SO3 and H 2 S 0 4 .66
Characterization of the surface of fibres
Laser microprobe mass analysis allows the character- ization of individual fibres, for example, distinguishing asbestos fibres from non-asbestos fibre-like micro- objects, and is able to discriminate between different asbestos varieties on the basis of the mass spectral fin- gerprints obtained, this despite the natural variability in composition and the poor reproducibility?6 In several test cases it also appeared that ingested fibres could be identified although they had remained within the lungs and were subject there to considerable compositional changes through leaching out by the action of the body
Figure 10 shows as an example negative LD spectra of pure ferritin, a pure chrysotile fibre, and a chrysotile fibre treated with 2 x M ferritin. The fer- ritin fingerprint is clearly detectable on the fibre. Figure 11 shows a characteristic positive and negative LAMMA mass spectrum of the surface covering of an asbestos body. The detection of typical ferritin ion peaks in especially the negative spectrum illustrates clearly the presence of the ferro-protein coating complex around the central asbestos core. Considering the very small sample subjected to analysis of consider-
SURFACE ANALYSIS IN ATMOSPHERIC ENVIRONMENTAL STUDIES 559
8 0. 0.12 pJoule
178
/ b. 0.11 pJoule
Anthrocend ~ m c. 0.05 pJoule \
178
Na(NoCI)+ 1
No' d. 1.30 pJoule ?3 81
Figure 6. LAMMA-spectrum after subsequent laser shots onto an anthracene-coated NaCI-particle. (Reproduced, with permission, from Ref. 61 .)
h r 3 100
>.
3 80
m
$, 60
z
n 4 v
z W c
40
20
U
CHANNEL NUMBER (X10') 0.25 0.5 0.75 1. 1.25 1.5 1.75 2.
Figure 7. Oil shale soot spectrum acquired by firing laser into the centre of a group of particles. (Reproduced, with permission, from Ref. 43.)
32 43 59 64 80 97 119 151
32 43 59 64 80 91
119
179 197
Figure 8. Negative LAMMA spectrum (top) of 2 4 pm diameter corrosion particle, identified as aluminium sulphate by comparison with the pure hydrated AI,(SO,), . spectrum (below). (Reproduced, with permission, from Ref. 64.)
ably less than a cubic micrometre it is clear that the sensitivity of detection is very high. On the other hand the signal cannot be transformed into a concentration of the compound present on the fibre surface.
When subsequent laser shots are fired at a given fibre location, the molecular peaks originating with surface contaminants gradually disappeared until the spectrum becomes representative again for the inorganic fibre substrate. From such observations it might be inferred that laser desorption mass spectrometry could be used as a surface-specific and a depth-profiling technique. Various studies in which coated and pure asbestos fibres were also subjected to secondary ion mass spec- trometry showed that the apparent changes in surface and in-depth composition as measured by LAMMA are considerably more pronounced than those measured in SIMS. Therefore, it must be concluded that LAMMA

560
Na'
it. ,
F. ADAMS AND J. DE WAELE
- 140
r 5 120
& 100 c! 8 0 - m
60
4 0 - W
y 20 z
0 '
Table 4. Organic compounds indicated by laser mass spectra of oil shale retort
( b ) . 1- 0 b" ' z g 0 I Z 0
. z U
0-
. CI' 0 vl O K ,
51 CN-
7. 0 25 0 5 0 75 1 1 2 5 1 5 1 7 5 2
Mass (amu)
1 252' 2 3 4 5 275' 6 7 8 300* 9 306* 10 326* 1 1 350' 12 362* 13 374* 14 380* 15 398* 16 404 17 424* 18 448* 19 472* 20 496* 21 520 22 546 23 570 24 594 25 620
Compound
benzo[a]pyreneaYb benzo[e] pyrenea.b perylenea*b benzo[k]fluorantheneavb anthanthreneasb di benzo [a,c] ant hracene a
benzo[ghi]peryleneasb coronenea.b a benzothiophene di benzo[a,ghi] perylene benzo[a]coronene a benzothiophene dibenzo[a,bc]coronene a benzothiophene ovalene a benzothiophene benzonapthocoronene benzo[a]ovalene dibenzo [a,bc]ovalene circurnanthracene circurnpyrene benzo[a]circurnanthracene di benzo[abc]circurnanthracene circumtetracene tribenzo[abc,h]circumanthracene
2
2
a Confirmed by HPLC analysis.
*Confirmed by direct insertion El and CI MS analysis. Confirmed by GC-MS analysis.
depth profiling yields only qualitative data which fibre surface as follows: cannot be relied on for real quantitative applications. On the other hand there is a practical advantage: that data become available quickly and straightforwardly. The following examples show this in an illustrative way.
Various treatments have been proposed to modify the chrysotile asbestos surface in order to reduce the unde-
[ESi-o-Mg-oH]3 +
-P [=Si-O-Mg-OI3P-O + 3HCI
To characterize the surface of chrysotile and chryso- phosphate fibres, LAMMA measurements were Der-
sirable biological effects. One of them consists in a treatment with gaseous POCl, which transforms the
formed in various conditions of spectra were summed to increase
E 140
z 80
2 120
& 100
9 60
5 40
20 z
0
z
laser intensity i n d the reproducibility.
Figure 9. Positive (a) and negative (b) mode-LAMMA-spectrum of highly transformed sea salt particles. (Reproduced, with permission, from Ref. 65.)
SURFACE ANALYSIS IN ATMOSPHERIC ENVIRONMENTAL STUDIES 561
Figure 10. Typical negative LAMMA spectra of pure ferritin (a), a pure UlCC chrysotile A fibre (b), and a chysotile fibre treated with 2 x 1 0 - ~ M ferritin (c). (Reproduced, with permission, from Ref. 67.)
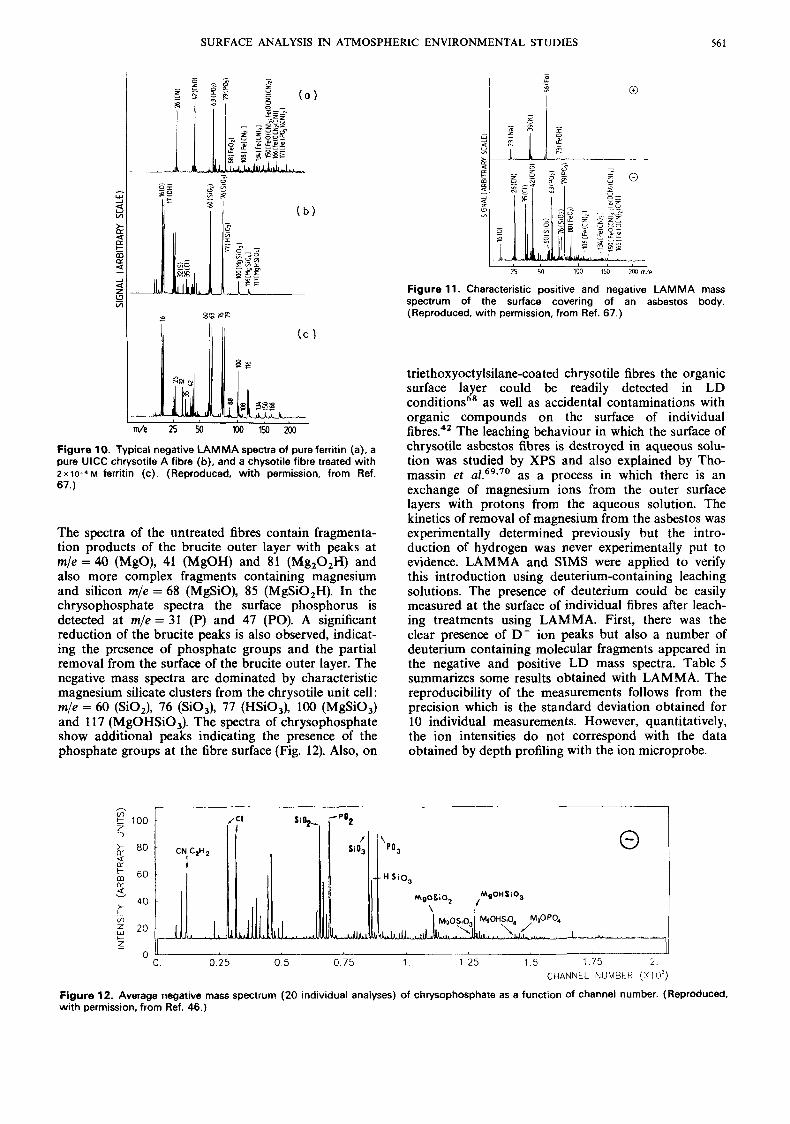
The spectra of the untreated fibres contain fragmenta- tion products of the brucite outer layer with peaks at m/e = 40 (MgO), 41 (MgOH) and 81 (Mg,O,H) and also more complex fragments containing magnesium and silicon m/e = 68 (MgSiO), 85 (MgSi0,H). In the chrysophosphate spectra the surface phosphorus is detected at m/e = 31 (P) and 47 (PO). A significant reduction of the brucite peaks is also observed, indicat- ing the presence of phosphate groups and the partial removal from the surface of the brucite outer layer. The negative mass spectra are dominated by characteristic magnesium silicate clusters from the chrysotile unit cell : m/e = 60 (SO,), 76 (SO,), 77 (HSiO,), 100 (MgSiO,) and 117 (MgOHSiO,). The spectra of chrysophosphate show additional peaks indicating the presence of the phosphate groups at the fibre surface (Fig. 12). Also, on
25 50 100 150 2W m/e
Figure 11. Characteristic positive and negative LAMMA mass spectrum of the surface covering of an asbestos body. (Reproduced, with permission, from Ref. 67.)
triethoxyoctylsilane-coated chrysotile fibres the organic surface layer could be readily detected in LD conditions68 as well as accidental contaminations with organic compounds on the surface of individual fibres.42 The leaching behaviour in which the surface of chrysotile asbestos fibres is destroyed in aqueous solu- tion was studied by XPS and also explained by Tho- massin et ~ 1 . ~ ~ 3 ~ ~ as a process in which there is an exchange of magnesium ions from the outer surface layers with protons from the aqueous solution. The kinetics of removal of magnesium from the asbestos was experimentally determined previously but the intro- duction of hydrogen was never experimentally put to evidence. LAMMA and SIMS were applied to verify this introduction using deuterium-containing leaching solutions. The presence of deuterium could be easily measured at the surface of individual fibres after leach- ing treatments using LAMMA. First, there was the clear presence of D- ion peaks but also a number of deuterium containing molecular fragments appeared in the negative and positive LD mass spectra. Table 5 summarizes some results obtained with LAMMA. The reproducibility of the measurements follows from the precision which is the standard deviation obtained for 10 individual measurements. However, quantitatively, the ion intensities do not correspond with the data obtained by depth profiling with the ion microprobe.
L 0. 0.25 0.5 0.75 1 1.25 1.5 1 7 5 2.
CHANNEL NUMBER ( X 10')
Figure 12. Average negative mass spectrum (20 individual analyses) of chrysophosphate as a function of channel number. (Reproduced, with permission, from Ref. 46.)

562 F. ADAMS AND J. DE WAELE
Table 5. Average intensity ratios and standard deviations of positive and negative ion peaks, for 10 individual measurements on untreated and H,O-, D,O-, and D,O/H,O-treated chrysotile fibres. (P. Heyrman, unpublished data)
Untreated Chrysotile treated with
W e ) , / (mid Assignment chrysotile " 2 0 D20
42/41 (MgOD) +/(MgOH)+ 10 .1 10 .1 0.59 f 0.1 5 46/45 (SiOD) +/(SiOH)+ <0.05 10 .05 10 .05
- - <0.11 - - 10.42
2/1 (D)-/(H)- 1811 7 (OD)-/(OH)- 62/61 (DSiO,) -/(HSiO,)- 10.05 10.05 <0.72 78/77 (DSiO,) -/( HSiO,) - 10.05 10 .05 <0.55
102/101 (MgDSiO,) -/(MgHSiO,)- <0.1 <0.1 1.08 f 0.1 8 11 8/117 (MgDSIO,) -/(MgHSiO,) - 10 .1 1 0 . 1 0.37 f 0.07
FUTURE PROSPECTS
The spectroscopic study of the surface of individual microscopical objects such as air particulate material is dependent on two major technological features. In the first place there is the requirement of very sensitive methods of detection : the surface of a micrometre-size object corresponds with an absolute amount of material which is extremely limited and any signal measured hence necessarily corresponds with ultra trace amounts of matter. Then there is the necessity that the signal is specifically defined as originating from the surface area of the sample. This in general is achieved in one of two ways, either by the depth probing characteristic of the excitation mechanism (as, for example, in SIMS) or else by the inability of the measured signal to originate from any other region of the sample than the outer surface area (as, for instance, in XPS).
Given these general constraints the question can be put forward where possible areas of future development might be situated. One area of potential advance resides in the application of powerful (intense) methods of exci- tation of which one example is the synchrotron excita- tion source. Very intense microscopical sources of synchrotron radiation have been developed for the analysis of microscopical objects by x-ray fluores- ~ e n c e . ~ l - ~ ~ Surface analysis at the 50 to 200 nm level of microscopical objects is in principle possible with a variety of photoelectron spectroscopies, which could yield surface electronic state and chemical bonding of adsorbed atoms and molecule^.^^^^^ Also, photon- stimulated desorption could be applied with the syn- chrotron sources.
A second area of potential development consists in the use of lasers for the specific or non-specific excita- tion of surface species either alone, relying on laser desorption with spectrometric or mass spectrometric detection, or else in conjunction with other sources of energy transfer to the microscopical sample surface. Surface analysis by laser ionization (SALI), the non- resonant multiphoton ionization, coupled with state-of- the-art time-of-flight mass spectrometry, provides extremely sensitive and readily quantifiable surface analysis potential.76 This method attempts to decouple the desorption of material from the surface from the ionization in a non-specific way thus minimizing select- ivity. The other emerging laser-based approach is se-
lected resonant ionization in which a dye laser is tuned to the specific transition of a desired atom or molecule, thus achieving highly specific and very sensitive detec- tion of the surface component^.^^ No documented applications in environmental research of both these methods exist, but the potential is large.
Heavy ion beams from accelerators can be collimated to a microbeam diameter and can be used for the detec- tion of inorganic and organic surface species through particle-induced plasma desorption. Filpus-Luyckx and S ~ h w e i k e r t ~ ~ showed the potential of this method of surface analysis with a lateral resolution of ca 10 pm using 84 MeV 84Kr7+ ions from an 88-inch variable energy cyclotron. Although the beam intensity after focusing becomes very weak, with the high eficiency (ions measured/incident ions on the sample) obtained in a simple time-of-flight mass spectrometer, significant data may be obtained. This instrumental set-up can be considered as a microbeam version of the "'Cf plasma desorption mass spectrometer developed by Macfarlane which is well-suited to the detection of high molecular mass compounds.79 The applications of this latter instrumental technique for the characterization of surface layers of mineral samples was also demon- strated."
New and now commercially available mass spectro- metric systems as secondary neutrals mass spectrometry and glow discharge mass spectrometry have a potential for sensitive and accurate depth profiling, if not on the microscopical scale then at least for larger environmental samples and particle aggregates. Micro- scopical vibrational spectroscopy by Fourier transform infra-red instrumentation, surface Raman spectroscopy and high resolution electron energy loss spectroscopy are other methods gaining in importance with micro- scopical potential for the characterization of environmental particles. At present there are no docu- mented applications in this field.
The methods which have been shown to be the work- horses for this field of study (SEM, microscopical Auger, XPS) undergo no major scientific breakthrough but nevertheless are continuously becoming more powerful and more easy to use. Current specifications on AES are now around 3000 nm which is sufficient for the analysis of the smallest atmospheric particles. Perhaps more significant, advances in XPS led to the possibility of concentrating the x-ray spot to an area much smaller than previously possible (ca 150 pm).

SURFACE ANALYSIS IN ATMOSPHERIC ENVIRONMENTAL STUDIES 563
Although at present there are no immediate prospects of its being exploitable as a microscopical technique (except with synchrotron radiation sources), the advan- tages of a smaller beam area are obvious for this field: smaller particle aggregates can be studied.
Microscopical analysis by secondary ion mass spec- trometry can now be readily achieved with liquid metal ion sources to produce the primary ion beam.81*8Z These high brightness sources permit the formation of high intensity submicrometre ion probes and bring the imaging potential of SIMS well into the submicrometre range83-85 and lateral resolutions of less than 0.1 pm can now be reproducibly obtained. Apart from the obvious potential for the surface-sensitive and in-depth analysis of individual environmental particles, the instruments allow the collection of secondary electron and secondary ion images which provide surface topog- raphy of one m o n ~ l a y e r . ~ ~ Stand-alone ion micro- probes and instruments with multitechnique surface
analysis by XPS, AES and SIMS are available com- mercially. The existing ion microscope equipment also evolved recently into a combination of a microscope and a submicrometre probe, with the latter an advan- tage for submicrometre lateral analysis. Advances in data analysis and image analysis at the same time allow truly tridimensional analytical potential.86 The applica- tions of surface analysis in the environmental field should in the near future profit dramatically from the advances in all these techniques, whose development is driven by the demands of the microelectronics industry, materials science and surface science, especially heter- ogeneous ~atalysis.'~
Acknowledgement
J. D. W. i s indebted to the National Fund for Scientific Research (NFWO, Belgium) for support as a research associate.
REFERENCES
1. K. R. Spurny (ed.), Physical and Chemical Characterization of Individual Airborne Particles. Ellis Horwood, Chichester (1 986).
2. M. Grasserbauer, Mikrochim. Acta 3,415 (1 983). 3. P. K. Hopke and D. F. S. Natusch (eds), Analytical Aspects of
Environmental Chemistry. John Wiley, New York (1 983). 4. H. Malissa and J. W. Robinson (eds), Analysis of Airborne
Particles by Physical Methods, CRC Press, Boca Raton (1 978).
5. D. F. S. Natusch and J. R. Wallace, Science 186. 695 (1974). 6. K. F. J. Heinrich (ed.). Characterization of Particles, ed. by K.
F. J. Heinrich. NBS Special Publication, Washington, DC, NO. 533 (1980).
7. G. L. Fisher, B. A. Prentice, 0. Silberman, J. M. Ondov, J. M. Biermann, R. C. Ragaini and A. R. McFarland, Environ. Sci. Technol. 12, 781 (1977).
8. M. R. Shure, P. A. Soltys, D. F. S. Natusch and T. Mauney, Environ. Sci. Technol. 19, 82 (1 985).
9. J. Hefter, Scanning Microscopy 1, 13 (1987). 10. M. Romand, R. Bador, M. Charbonnier and F. Gaillard, X-ray
11. C. Jeanguillaume, Scanning Microscopy 1,237 (1 987). 12. R. F. Egerton, Scanning Electron Microscopy I, 151 (1 982). 13. N. H. Turner, B. 1. Dunlop and R. J. Colton, Anal. Chem. 56,
373R (1984). 14. R. W. Linton, P. Williams, C. A. Evans Jr. and D. F. S.
Natusch, Anal. Chem. 49, 151 4 (1 977). 15. T. R. Keyser, D. F. S. Natusch, C. A. Evans, Jr. and R. W.
Linton, Environ. Sci. Technol. 12,768 (1978). 16. T. Novakov, P. K. Mueller, A. E. Alcocer and J. W. Otvos, J.
Colloid Interf. Sci. 39, 225 (1972). 17. C. J. Powell, in Characterization of Particles, ed. by K. F. J.
Heinrich, p. 131. NBS Special Publication, Washington, DC, No. 533 (1 980).
18. D. E. Newbury, in Characterization of Particles, ed. by K. F. J. Heinrich, p. 139. NBS Special Publication, Washington, DC, No. 533 (1980).
19. M. F. Hochella Jr., A. M. Turner and D. W. Harris, Scanning Electron Microscopy I t , 337 (1 986).
20. R. J. Cheng, V. A. Mohnen, T. T. Shen, M. Current and J. B. Hudson, J. Air. Pollut. Con. Ass. 26, 787 (1 976).
21. A. P. von Rosenstiel, A, J. Grayand and P. J. van Duin, Beitr. electronenmicroscop. Direktabb. von Oberfl. (BEDO) 14, 153 (1 981 ).
22. J. L. Hock and D. Lichtman, Environ. Sci. Technol. 16, 423 (1 982).
23. J. A. Gardella Jr. and D. M. Hercules, J. Environ. Anal. Chem. 13,275 (1983).
Spectrom. 16,7 (1987).
24. D. L. Davidson, Part. Charact. Technol. 1, 159 (1 984). 25. W. E. Clark, D. A. Landis and A. B. Harker,Atmos. Environ. 10,
637 (1 976). 26. N. L. Craig, A. B. Harker and T. Novakov, Atmos. Environ. 8,
15 (1974). 27. M. 0. Amdur, A. F. Sarofim, M. Neville, R. J. Quann, J. F.
McCarthy, J. F. Elliot, H. F. Lam, A. E. Rogers and M. W. Conner, Environ. Sci. Technol. 20,138 (1 986).
28. X. B. Cox, R. W. Linton and F. E. Butler, Environ. Sci. Technol. 19,345 (1 985).
29. N. Kaufherr, M. Shenesa and D. Lichtman, Environ. Sci. Technol. 1 9,609 (1 985).
30. K. A. Rahn,Atmos. Environ. 10, 597 (1976). 31. D. Lichtman and S. Mroczkowski, Environ. Sci. Technol. 19,
274 (1 985). 32. J. E. Post and P. R. Buseck, Environ. Sci. Technol. 19, 682
(1985). 33. M. J. Van Craen, E. A. Denoyer, D. F. S. Natusch and F. C.
Adams, Environ. Sci. Technol. 17,435 (1 983). 34. X. B. Cox, S. R. Bryan, R. W. Linton and D. P. Griffis, Anal.
Chem. 59,201 8 (1 987). 35. F. Hillenkamp, E. Unsold, R. Kaufman and R. Nitsche, Appl.
Phys. 8, 341 (1975). 36. T. Dingle, B. W. Griffiths, J. C. Ruckman and C. A. Evans, in
Microbeam Analysis 1982, ed. by K. F. J. Heinrich, p. 365. San Francisco Press, San Francisco (1 982).
37. E. Denoyer, D. F. S. Natusch, R. Van Grieken and F. Adams. Anal. Chem. 54,26A (1982).
38. E. Michiels, L. Van Vaeck and R. Gijbels, Scanning Electron Microscopy 111, 11 11 (1 984).
39. F. Hillenkamp, in Ion Formation from Organic Solids, ed. by A. Benninghoven, p. 235. Springer-Verlag, Berlin (1 983).
40. D. M. Hercules, R. J. Day, K. Balasanmugan, T. A. Dang and C. P. Li, Anal. Chem. 54, 280A (1 982).
41. H. J. Heinen, Int. J. Mass Spectrom. Ion Phys. 38, 309 (1 981 ).
42. J. K. De Waele, J. J. Gybels, E. F. Vansant and F. C. Adams, Anal. Chim. 55, 2255 (1 983).
43. T. Mauney and F. Adams, Sci. Total Environ. 36, 21 5 (1984). 44. P. K. Dutta, D. C. Rigano, R. A. Hofstader, E. Denoyer, D. F. S.
Natusch and F. Adams, Anal. Chem. 56,302 (1 984). 45. P. Wieser and R. Wurster, in Physical and Chemical Character-
ization of Individual Airborne Particles. ed. by K. R. Spurny. p. 251. Ellis Horwood, Chichester (1986).
46. J. K. De Waele and F. C. Adams, Scanning Electron Micro- scopy 111, 935 (1 985).
47. J. De Waele and F. Adams, in characterization of Individual

564 F. ADAMS AND J. DE WAELE
Airborne Particles, ed. by K. R. Spurny, p. 271. Ellis Horwood, Chichester (1 986).
48. 2. A. Wilk and D. M. Hercules.Ana1. Chem. 59, 181 9 (1 987). 49.
50.
51.
52.
53.
54.
55.
56.
57.
58.
59.
60.
61.
62.
63.
64. 65
66
L. D. Hansen, D. Silberman, G. L. Fisher and D. J. Eatough, Environ. Sci. Technol. 18, 181 (1 984). W. R. Harris and D. Silberman, Environ. Sci. Technol. 17, 139 (1 983). K. Van Cauwenberghe and L. Van Vaeck, Mutation Research 116, 1 (1983). D. Grosjean, K. Fung and J. Harrison, Environ. Sci. Technol. 17,673 (1983). A. Lindskog, E. Brorstrom-LundBn, I . Alfheim and I . Hagen, Sci. Total Environ. 61,51 (1987). G. A. Eiceman and H. 0. Rghei, Environ. Sci. Technol. 16, 53 (1982). L. Van Vaeck and K. Van Cauwenberghe. Atmos. Environ. 18, 323 (1 984). W. A. Korfmacher, D. F. S. Natusch, D. R. Taylor, G. Maman- tov and E. L. Wehry, Science 207, 763 (1 980). D. A. Saucy, G. E. Cabaniss and R. W. Linton, Anal. Chem. 57, 876 (1985). W. H. Griest and B. A. Tomkins, Environ. Sci. Technol. 20, 291 (1 986). J. L. Feerer, A. G. Miller and W. F. Ramirez, Environ. Sci. Technol. 20, 695 (1986). M. Van Craen, D. F. S. Natusch and F. Adams, Anal. Chem. 54,1786 (1 982). R. Niessner, D. Klockow, F. Bruynseels and R. Van Grieken, Int. J. Environ. Anal. Chem. 22, 281 (1 985). E. Denoyer, T. Mauney, D. F. S. Natusch and F. Adams, Microbeam Analysis 1982, ed. by K. F. J. Heinrich, p. 191. San Francisco Press, San Francisco (1 982). E. Denoyer, D. F. S. Natusch, P. Surkyn and F. Adams, Environ . Sci. Techno/. 1 7,457 (1 983). M. Van Craen and L. Van Beek, Mikrochim.Acta 1, 1 (1984). F. Bruynseels, H. Storms, R. Van Grieken and L. Van der Auwera, Atmos. Environ., in press. F. Bruynseels and R. Van Grieken, Atmos. Environ. 19, 1969 ( 1 985).
67.
68.
69.
70.
71. 72.
73.
74.
75. 76. 77
78.
79. 80.
81.
82. 83. 84.
85.
86.
87.
J. De Waele, F. Adams, P. Vermeire and M. Neuberger, Mikro- chim.Acta, 111,197 (1986). J. K. De Waele, 1. M. Swenters and F. C. Adams, Specrrochim. Acta 408,795 (1 985). J. H. Thomassin, J. Goni, P. Baillif and J. C. Touray, C. R. Acad. Sci. Paris 2830. 1 31 (1 976). J. H. Thornassin, J. Goni, P. Baitlif, J. C. Touray and M. C. Jaurand, Phys. Chem. Miner. 1,385 (1 977). B. M. Gordon, Nucl. Instrum. Meth. 204, 223 (1982). J. R. Chen, B. M. Gordon, A. L. Hanson, K. W. Jones, H. W. Kraner, E. C. T. Chao and J. A. Minkin, Scanning Electron Microscopy IV, 1 483 (1 984). A. L. Hanson, K. W. Jones, B. M. Gordon, J. G. Pounds, M. L. Rivers and G. Schidlovsky, Microbeam Analysis 1985, 227 (1 985). B. W. Batterman and N. W. Ashcroft, Science 206, 157 (1979). N. V. Smith and D. P. Woodruff, Science 216,367 (1982). C. H. Becker, Scanning Electron Microscopy IV, 1267 (1 986). N. Winograd, J. P. Baxter and F. M. Kimock, Chem. Phys. Lett. 88, 581 (1982). P. E. Filpus-Luyckx and E. A. Schweikert, Anal. Chem. 58, 1686 (1 986). R. D. Macfarlane, Acc. Chem. Res. 15, 268 (1 982). W. R. Summers and E. A. Schweikert, Anal. Chem. 58, 2126 (1 986). H. Gnaser and F. G. Rudenauer, Nucl. Instrum. Phys. Res. 21 8,303 (1 983). P. D. Prewett, Vacuum 34, 931 (1984). M. Preus and D. Kingham, Mikrochim.Acta 11,71 (1985). R. Levi-Setti. P. H. La Marche, K. Lam, T. H. Shields and Y. L. Wang, Nucl. Instrum. Meth. Phys. Res. 218, 368 (1983). R. Levi-Setti, G. Crow and Y. L. Wang, Scanning Electron Microscopy It, 535 (1985). W. Steiger, F. Rudenauer and G. Ernst, Anal. Chem. 58, 2037 (1986). C. R. Brundle, Fresenius. Z. Anal. Chem. 324,426 (1 986).