s.u.r.f.a. technical conference: current issues in
TRANSCRIPT
S.U.R.F.A. Technical Conference:Current Issues in Estimating Costof Capital
presented by:
Roger J. Grabowski, FASA
April 28 2016
Roger J. Grabowski, FASA
Roger J. Grabowski, FASA, is a Managing Director at Duff & Phelps LLC. He was formerlyManaging Director of the Standard & Poor’s Corporate Value Consulting practice, a partner ofPricewaterhouseCoopers LLP and one of its predecessor firms, Price Waterhouse (where hefounded its U.S. Valuation Services practice and managed the real estate appraisal practice).
He has directed valuations of businesses, interests in businesses, intellectual property,intangible assets, real property and machinery and equipment. Roger has testified in court asan expert witness on matters of solvency, the value of closely held businesses and businessinterests, valuation and amortization of intangible assets and other valuation issues. Histestimony in U.S. District Court was referenced in the U.S. Supreme Court opinion decided inhis client’s favor in the landmark Newark Morning Ledger case.
Roger is co-author of the annual Duff & Phelps Valuation Handbook series: ValuationHandbook-Guide to Cost of Capital, Valuation Handbook- Industry Cost of Capital,International Valuation Handbook- Guide to Cost of Capital and International ValuationHandbook- Industry Cost of Capital (John Wiley & Sons); co-author with Shannon Pratt of Costof Capital: Applications and Examples, 5th ed. (John Wiley & Sons, 2014); co-author withShannon Pratt of The Lawyer’s Guide to Cost of Capital (American Bar Association, 2014); co-author with Shannon Pratt of Cost of Capital in Litigation: Applications and Examples (JohnWiley & Sons, 2011).
Roger teaches courses for the American Society of Appraisers including Cost of Capital, acourse he developed.
Duff & Phelps 2
Duff & Phelps, LLC
Managing Director, Valuation Advisory Services
Chicago
+1 312 697 4720
S.U.R.F.A. Technical Conference April 28, 2016

Current Issues in Estimating Cost of Capital
• Topics for Today
I. How risk is priced is still a relative unknown
II. Pure CAPM is not a good indicator of expected returns
III. Issues in estimating the cost of capital based on risk-free rateplus ERP plus other risk factors
Duff & Phelps 3S.U.R.F.A. Technical Conference April 28, 2016
Professor John Cochrane recently summarized the changes in ourknowledge of estimating rates of return for equity over the last 40 years:
“In the beginning, there was chaos. Then came CAPM. Every cleverstrategy to deliver high returns ended up delivering high market betas aswell. Then anomalies erupted and there was chaos again.”
Researchers such as Professors Fama and French found that marketreturns were a function of other factors and not simply market betas.
CAPM as it is taught predicts that on the average portfolios of stocks withhigh beta estimates will earn greater returns than portfolios of stocks withlow beta estimates. Variation in returns is not explained by differences inmarket betas. Rather, differences in returns are explained by a “zoo of newvariables.”
How Risk is Priced is Still a Relative Unknown
John C. Cochrane, University of Chicago Booth School of Business, “Discount Rates,” American Finance Association PresidentialAddress, January 8, 2011 http://faculty.chicagobooth.edu.john.cochrane/research/papers
S.U.R.F.A. Technical Conference April 28, 2016 4Duff & Phelps
Professor Cochrane concluded:
“Discount rates vary a lot more than we thought. The puzzles andanomalies that we face amount to discount rate variation we don’tunderstand. Our theoretical controversies are about how discount ratesare formed….Theories are in their infancy….”
Cost of capital is all about pricing risk-matching the risk inherent in the netcash flows with the rate of return demanded by the market for acceptingthat level of risk.
Probably the most widely accepted definition of risk in the context ofbusiness valuation is the degree of uncertainty of achieving futureexpectations at the times and in the amounts forecast.
How Risk is Priced is Still a Relative Unknown (cont’d)
S.U.R.F.A. Technical Conference April 28, 2016 5Duff & Phelps

Issue: pure CAPM is a not a good indicator ofexpected returns
• Pablo Fernandez, “CAPM: an absurd model,” http://shttp://ssrn.com/abstract=2505597 , Oct 6, 2014
• The CAPM is an absurd model because its assumptions and itspredictions/conclusions have no basis in the real world.
• It is quite clear that the CAPM is neither a theory nor a modelbecause it does not “explain facts or events”, nor does it “describethe past, present, or future state of something”.
• It is important to differentiate between a fact (something that trulyexists or happens: something that has actual existence; a true pieceof information) and an opinion (what someone thinks about aparticular thing).
• The CAPM could be described as an uninformed opinion, and notas a sensible opinion.
S.U.R.F.A. Technical Conference April 28, 2016 6Duff & Phelps
Issue: pure CAPM is a not a good indicator ofexpected returns
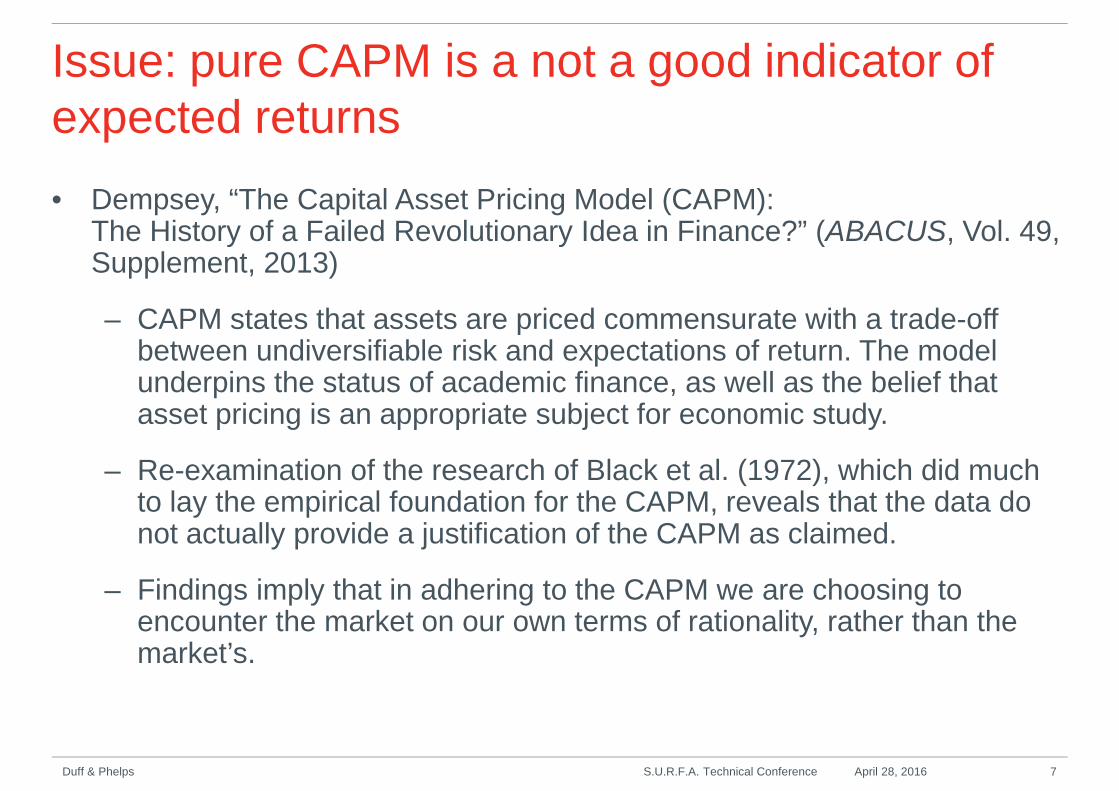
• Dempsey, “The Capital Asset Pricing Model (CAPM):The History of a Failed Revolutionary Idea in Finance?” (ABACUS, Vol. 49,Supplement, 2013)
– CAPM states that assets are priced commensurate with a trade-offbetween undiversifiable risk and expectations of return. The modelunderpins the status of academic finance, as well as the belief thatasset pricing is an appropriate subject for economic study.
– Re-examination of the research of Black et al. (1972), which did muchto lay the empirical foundation for the CAPM, reveals that the data donot actually provide a justification of the CAPM as claimed.
– Findings imply that in adhering to the CAPM we are choosing toencounter the market on our own terms of rationality, rather than themarket’s.
S.U.R.F.A. Technical Conference April 28, 2016 7Duff & Phelps

Issue: pure CAPM does not price market risk
• While the “textbook” capital asset pricing model (CAPM) is the most widely usedasset pricing model, risk pricing has moved beyond considering CAPM beta as thesole measure of risk.
• Empirical tests of CAPM have shown that “textbook” CAPM does not do a good jobin pricing risk:
Have we been incorrectly measuring the risk-free rate and equity riskpremium?
High (low) beta stocks do not always generate high (low) returns» a. Is beta measurement the problem: beta a forward measure of risk, yet we
use backwards looking methods to estimate beta
» b. Are we misinterpreting the meaning of beta?
Does the market price more factors (systematic risks measures) beyond beta?
Does the market work the way the underlying assumptions of the Sharpe-Lintner-Mossin CAPM predict (maximize expected return and minimizevolatility)?
S.U.R.F.A. Technical Conference April 28, 2016 8Duff & Phelps
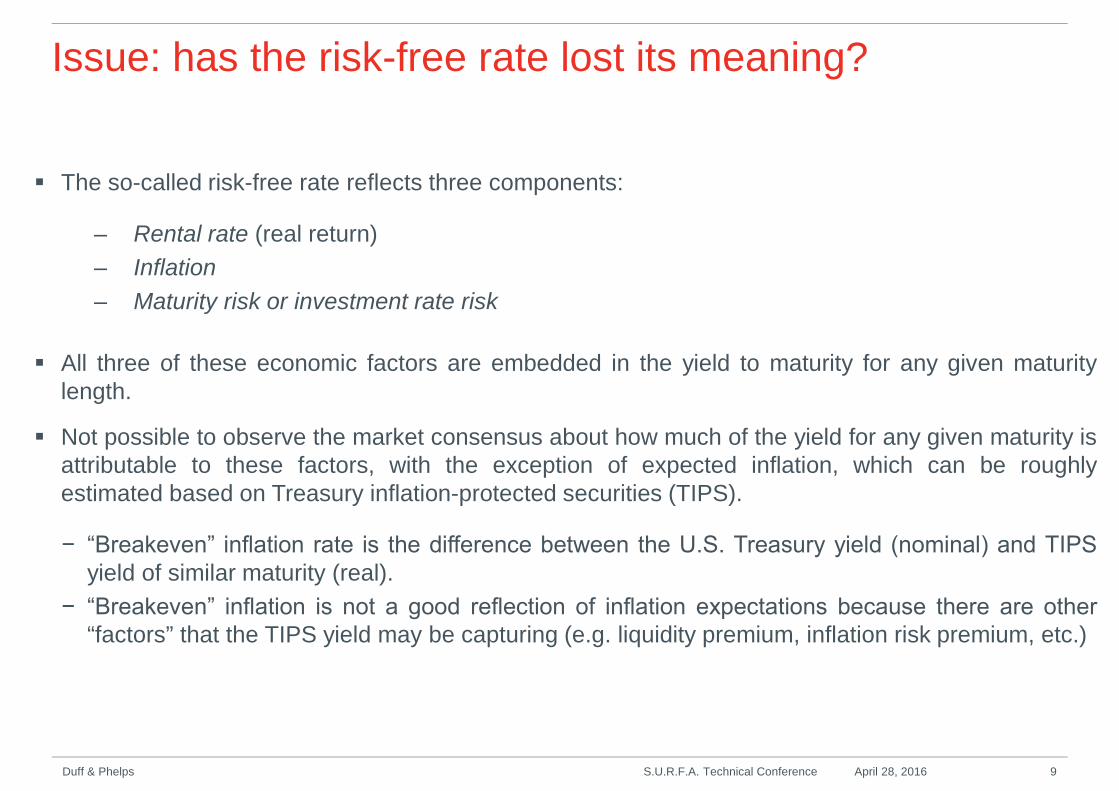
The so-called risk-free rate reflects three components:
– Rental rate (real return)
– Inflation
– Maturity risk or investment rate risk
All three of these economic factors are embedded in the yield to maturity for any given maturitylength.
Not possible to observe the market consensus about how much of the yield for any given maturity isattributable to these factors, with the exception of expected inflation, which can be roughlyestimated based on Treasury inflation-protected securities (TIPS).
− “Breakeven” inflation rate is the difference between the U.S. Treasury yield (nominal) and TIPSyield of similar maturity (real).
− “Breakeven” inflation is not a good reflection of inflation expectations because there are other“factors” that the TIPS yield may be capturing (e.g. liquidity premium, inflation risk premium, etc.)
Issue: has the risk-free rate lost its meaning?
S.U.R.F.A. Technical Conference April 28, 2016 9Duff & Phelps
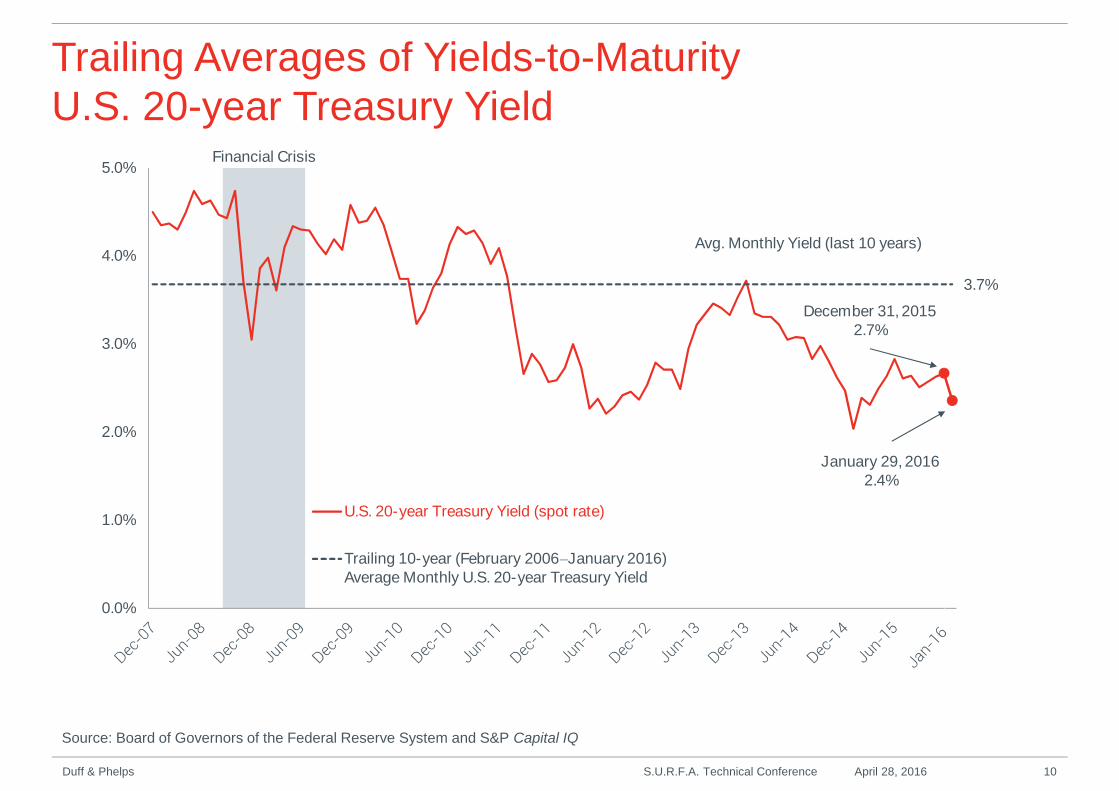
Trailing Averages of Yields-to-MaturityU.S. 20-year Treasury Yield
Source: Board of Governors of the Federal Reserve System and S&P Capital IQ
S.U.R.F.A. Technical Conference April 28, 2016 10Duff & Phelps
January 29, 20162.4%
3.7%
0.0%
1.0%
2.0%
3.0%
4.0%
5.0%
U.S. 20-year Treasury Yield (spot rate)
Trailing 10-year (February 2006‒January 2016)Average Monthly U.S. 20-year Treasury Yield
Financial Crisis
Avg. Monthly Yield (last 10 years)
December 31, 20152.7%

Marketable U.S. Treasury Securities Held by the PublicDecember 2003–December 2015
• Source: (i) Board of Governors of the Federal Reserve System (US), U.S. Treasury securities held by the Federal Reserve: All Maturities [TREAST],retrieved from FRED, Federal Reserve Bank of St. Louis https://research.stlouisfed.org/fred2/series/TREAST/, January 29, 2016; (ii) Monthly Statements ofthe Public Debt (MSPD) retrieved from http://www.treasurydirect.gov/govt/reports/pd/ mspd/mspd.htm, January 29, 2016; and (iii) U.S. Department of theTreasury International Capital (TIC) System’s Portfolio Holdings of U.S. and Foreign Securities – A. Major Foreign Holders of U.S. Treasury Securitiesretrieved from http://www.treasury.gov/resource-center/data-chart-center/tic/Pages/ticsec2.aspx, February 17, 2016. As seen in the 2016 Valuation Handbook– Guide to Cost of Capital.
S.U.R.F.A. Technical Conference April 28, 2016 11Duff & Phelps
$0
$2,000
$4,000
$6,000
$8,000
$10,000
$12,000
$14,000U
.S.
Do
llars
(in
$B
illio
ns)
Others
Foreign Holders
Held by the Fed
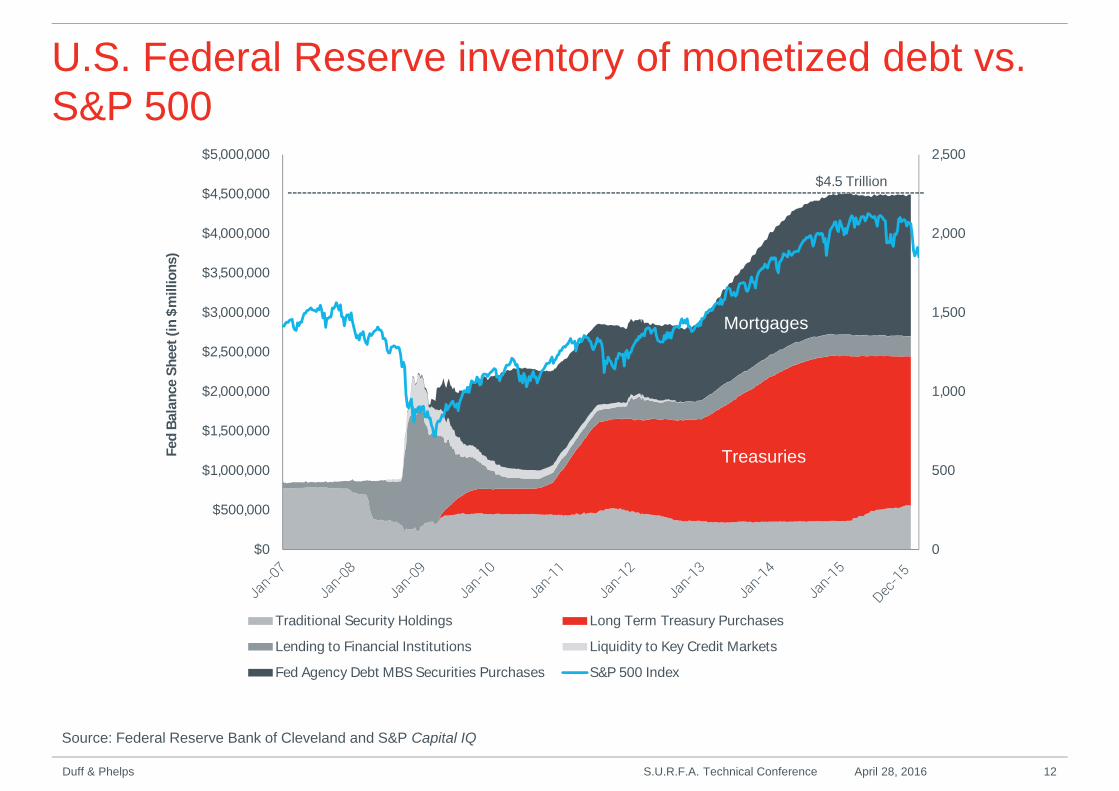
U.S. Federal Reserve inventory of monetized debt vs.S&P 500
Source: Federal Reserve Bank of Cleveland and S&P Capital IQ
S.U.R.F.A. Technical Conference April 28, 2016 12Duff & Phelps
0
500
1,000
1,500
2,000
2,500
$0
$500,000
$1,000,000
$1,500,000
$2,000,000
$2,500,000
$3,000,000
$3,500,000
$4,000,000
$4,500,000
$5,000,000Fed
Bala
nce
Sh
eet
(in
$m
illio
ns)
Traditional Security Holdings Long Term Treasury Purchases
Lending to Financial Institutions Liquidity to Key Credit Markets
Fed Agency Debt MBS Securities Purchases S&P 500 Index
Mortgages
Treasuries
$4.5 Trillion

Methods of Risk-free Rate Normalization
To learn more about the equity risk premium, the risk free rate, and other cost of capital related issues, download a free copy of “Developing the Cost ofEquity Capital: Risk-Free Rate and ERP During Periods of ‘Flight to Quality’”, August 2011, by Roger J. Grabowski atwww.DuffandPhelps.com/CostofCapital
During periods in which risk-free rates appear to be abnormally low due to flight toquality or other issues (e.g. massive monetary interventions), Duff & Phelpsrecommends normalizing the risk-free rate.
Normalization can be accomplished in a number of ways:
• Calculating trailing averages of yields-to-maturity on long-term governmentsecurities over various periods.
• Incorporating one of the various possible “build-up” methods. All build-upmethods are based upon two fundamental relationships for nominalinterest rates:
1) Relationship between nominal and real interest rates
2) Relationship between short and long-term horizons.
S.U.R.F.A. Technical Conference April 28, 2016 13Duff & Phelps
Nominal vs. Real Interest Rates
Fisher, Irving. 1930. The Theory of Interest. New York: Macmillan, which built on his work presented in 1896 as “Appreciation and Interest.” Publications ofthe American Economic Association, First Series, 11(4): 1–110 [331– 442]. These publications have been reprinted in a series of volumes entitled TheWorks of Irving Fisher (Fisher, 1997), Ed. William J. Barber. London: Pickering and Chatto.
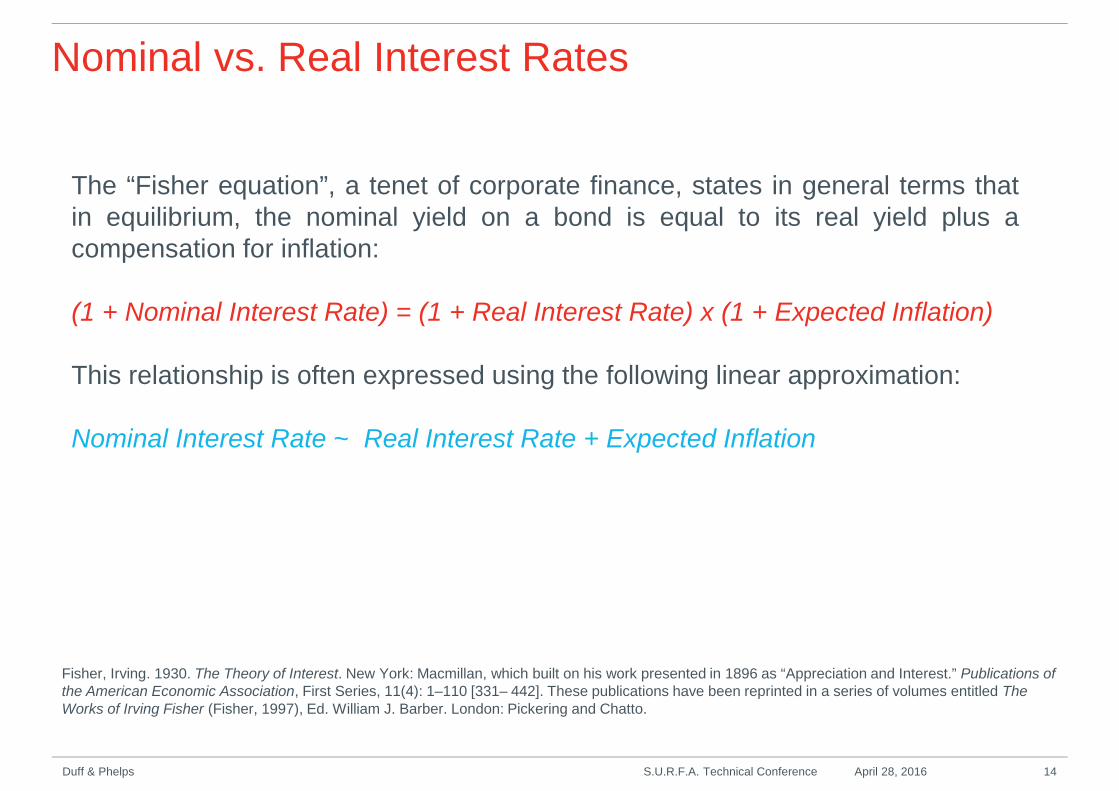
The “Fisher equation”, a tenet of corporate finance, states in general terms thatin equilibrium, the nominal yield on a bond is equal to its real yield plus acompensation for inflation:
(1 + Nominal Interest Rate) = (1 + Real Interest Rate) x (1 + Expected Inflation)
This relationship is often expressed using the following linear approximation:
Nominal Interest Rate ~ Real Interest Rate + Expected Inflation
S.U.R.F.A. Technical Conference April 28, 2016 14Duff & Phelps
Methods of Risk-free Rate Normalization – RealInterest Rate as base
Haubrich, Joseph, George Pennacchi, and Peter Ritchken. “Inflation Expectations, Real Rates, and Risk Premia: Evidence from Inflation Swaps.” Reviewof Financial Studies (2012) 25 (5): 1588-1629. Ang, Andrew, and Gerrt Bekaert. “The Term Structure of Real Rates and Expected Inflation.” The Journal ofFinance, Vol. LXIII, No. 2, April 2008. Grishchenko, Olesya V., and Jing-zhi Huang “Inflation Risk Premium: Evidence from the TIPS Market.” The Journalof Fixed Income, Vol 22(4) (2013):5-30.
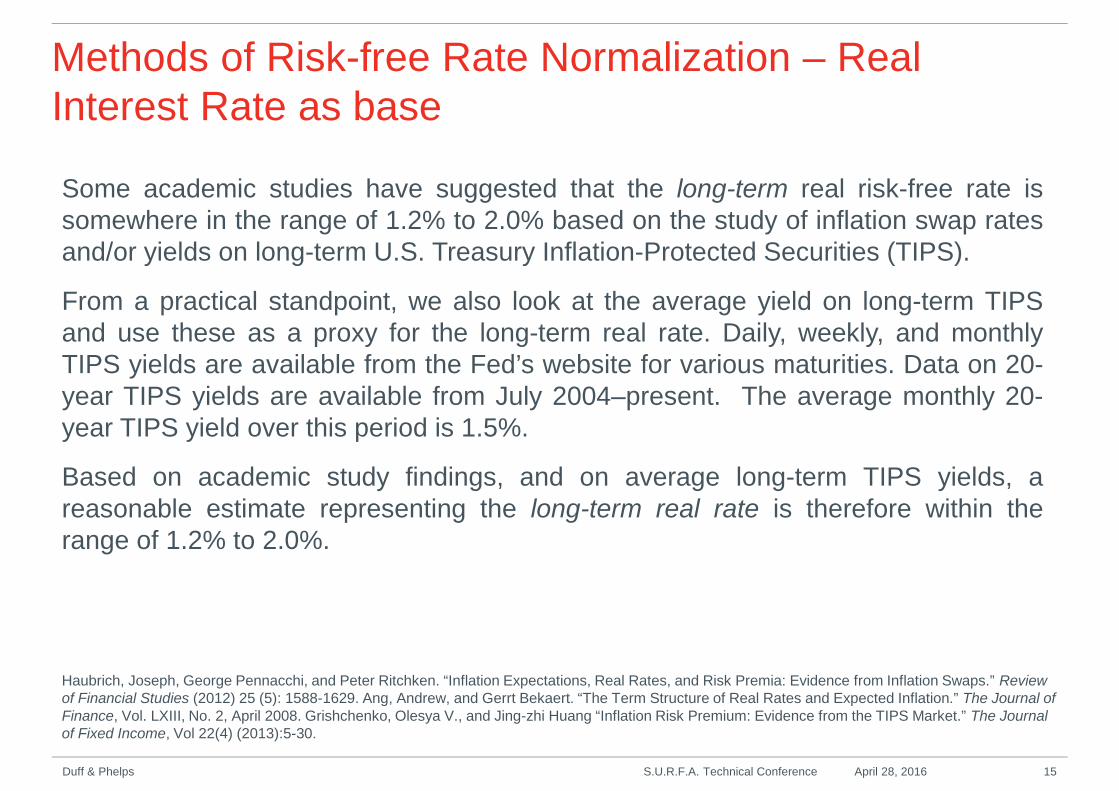
Some academic studies have suggested that the long-term real risk-free rate issomewhere in the range of 1.2% to 2.0% based on the study of inflation swap ratesand/or yields on long-term U.S. Treasury Inflation-Protected Securities (TIPS).
From a practical standpoint, we also look at the average yield on long-term TIPSand use these as a proxy for the long-term real rate. Daily, weekly, and monthlyTIPS yields are available from the Fed’s website for various maturities. Data on 20-year TIPS yields are available from July 2004–present. The average monthly 20-year TIPS yield over this period is 1.5%.
Based on academic study findings, and on average long-term TIPS yields, areasonable estimate representing the long-term real rate is therefore within therange of 1.2% to 2.0%.
S.U.R.F.A. Technical Conference April 28, 2016 15Duff & Phelps
Methods of Risk-free Rate Normalization – Plus Long-termExpected Inflation Estimates – U.S. at Year-end 2015
Sources: "The Livingston Survey: December 2015”, Federal Reserve Bank of Philadelphia (December 10, 2015); "Survey of Professional Forecasters:Fourth Quarter 2015”, Federal Reserve Bank of Philadelphia (November 13, 2015); Federal Reserve Bank of Cleveland (estimates as of December 2015);FRED® Economic Data – Federal Reserve Bank of St. Louis; Blue Chip Financial Forecasts Vol. 34 (12) (December 1, 2015).
S.U.R.F.A. Technical Conference April 28, 2016 16Duff & Phelps
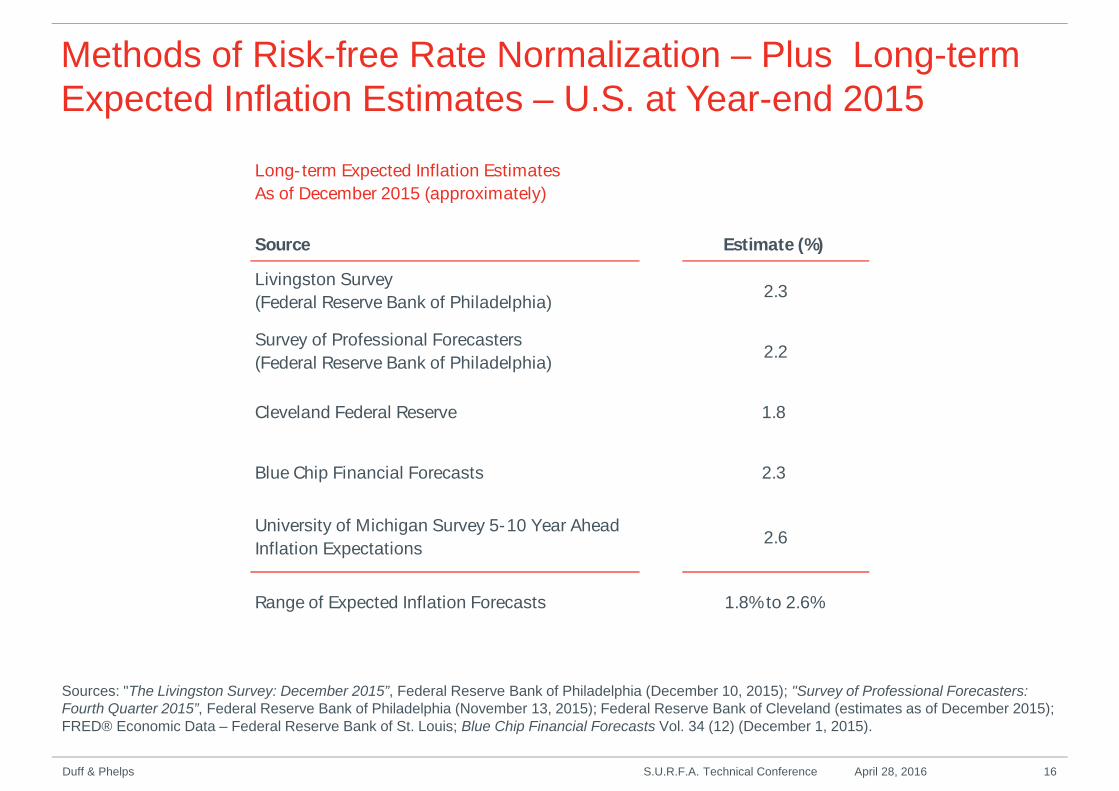
Long- term Expected Inflation Estimates
As of December 2015 (approximately)
Source Estimate (%)
Livingston Survey
(Federal Reserve Bank of Philadelphia)2.3
Survey of Professional Forecasters
(Federal Reserve Bank of Philadelphia)2.2
Cleveland Federal Reserve 1.8
Blue Chip Financial Forecasts 2.3
University of Michigan Survey 5-10 Year Ahead
Inflation Expectations2.6
Range of Expected Inflation Forecasts 1.8%to 2.6%
Methods of Risk-free Rate Normalization –U.S.at Year-end 2015
S.U.R.F.A. Technical Conference April 28, 2016 17Duff & Phelps
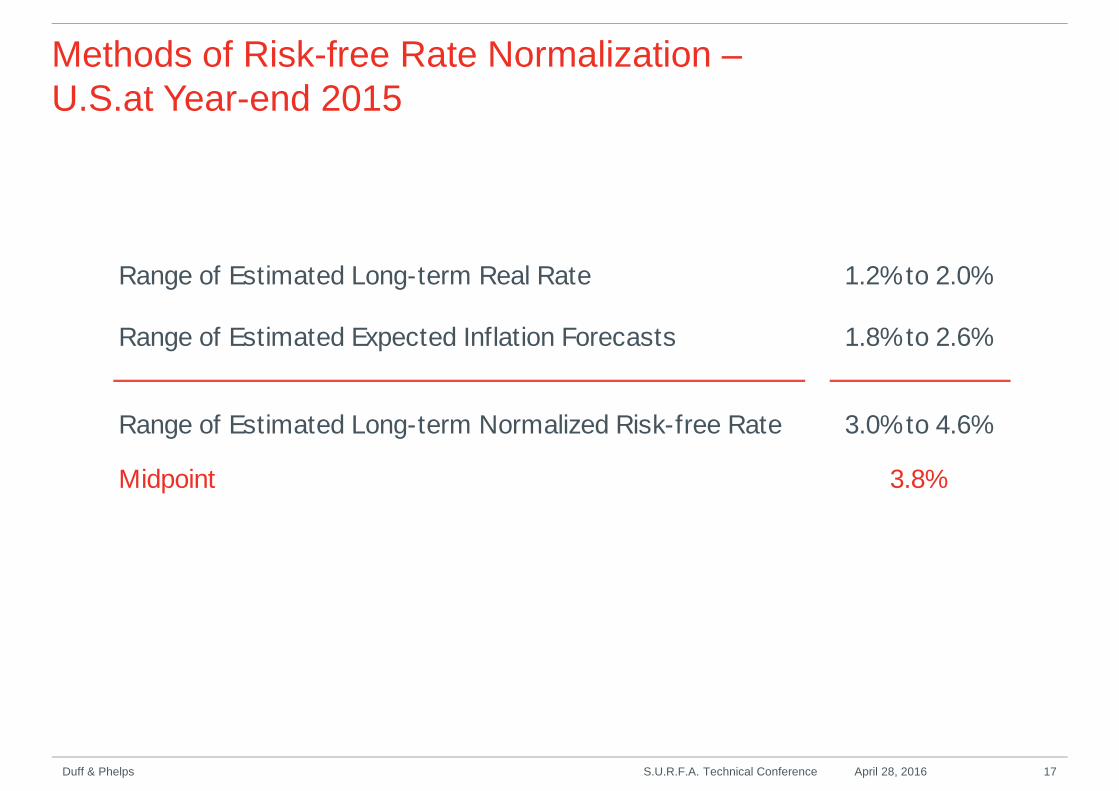
Range of Estimated Long-term Real Rate 1.2%to 2.0%
Range of Estimated Expected Inflation Forecasts 1.8%to 2.6%
Range of Estimated Long-term Normalized Risk-free Rate 3.0%to 4.6%
Midpoint 3.8%
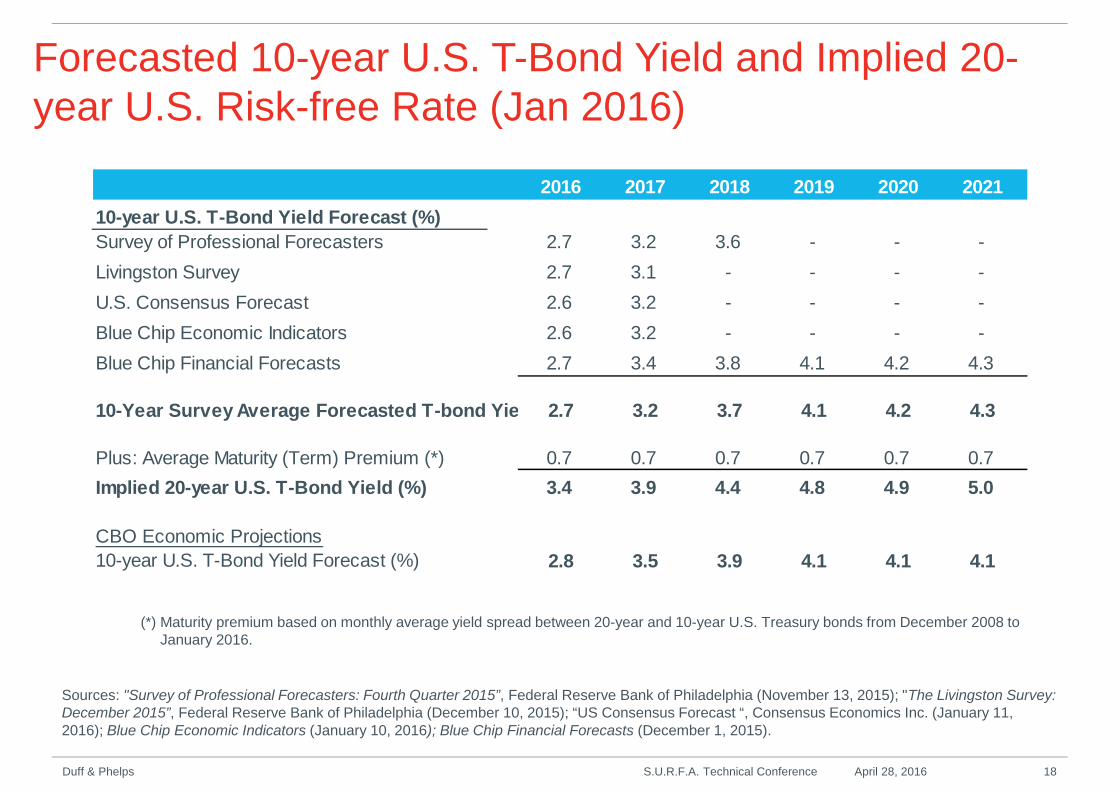
Forecasted 10-year U.S. T-Bond Yield and Implied 20-year U.S. Risk-free Rate (Jan 2016)
Sources: "Survey of Professional Forecasters: Fourth Quarter 2015”, Federal Reserve Bank of Philadelphia (November 13, 2015); "The Livingston Survey:December 2015”, Federal Reserve Bank of Philadelphia (December 10, 2015); “US Consensus Forecast “, Consensus Economics Inc. (January 11,2016); Blue Chip Economic Indicators (January 10, 2016); Blue Chip Financial Forecasts (December 1, 2015).
(*) Maturity premium based on monthly average yield spread between 20-year and 10-year U.S. Treasury bonds from December 2008 toJanuary 2016.
S.U.R.F.A. Technical Conference April 28, 2016 18Duff & Phelps
2016 2017 2018 2019 2020 2021
10-year U.S. T-Bond Yield Forecast (%)
Survey of Professional Forecasters 2.7 3.2 3.6 - - -
Livingston Survey 2.7 3.1 - - - -
U.S. Consensus Forecast 2.6 3.2 - - - -
Blue Chip Economic Indicators 2.6 3.2 - - - -
Blue Chip Financial Forecasts 2.7 3.4 3.8 4.1 4.2 4.3
10-Year Survey Average Forecasted T-bond Yield 2.7 3.2 3.7 4.1 4.2 4.3
Plus: Average Maturity (Term) Premium (*) 0.7 0.7 0.7 0.7 0.7 0.7
Implied 20-year U.S. T-Bond Yield (%) 3.4 3.9 4.4 4.8 4.9 5.0
CBO Economic Projections
10-year U.S. T-Bond Yield Forecast (%) 2.8 3.5 3.9 4.1 4.1 4.1
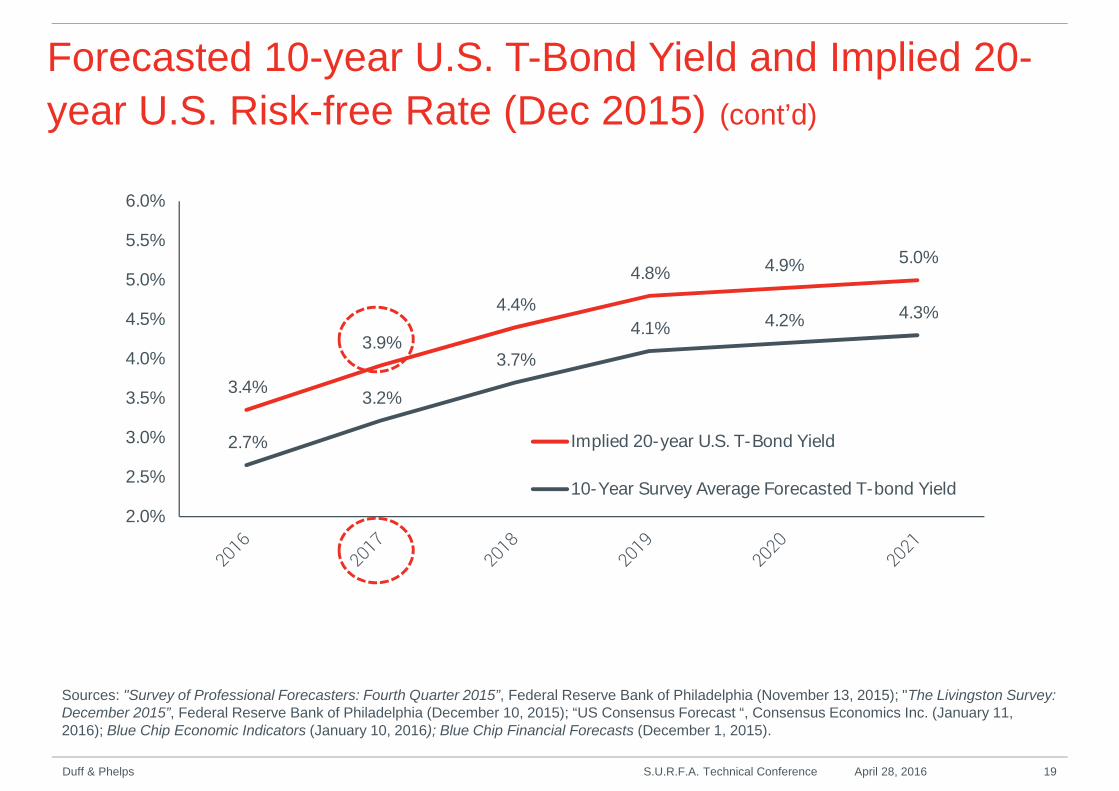
3.4%
3.9%
4.4%
4.8% 4.9% 5.0%
2.7%
3.2%
3.7%
4.1% 4.2% 4.3%
2.0%
2.5%
3.0%
3.5%
4.0%
4.5%
5.0%
5.5%
6.0%
Implied 20-year U.S. T-Bond Yield
10-Year Survey Average Forecasted T-bond Yield
Forecasted 10-year U.S. T-Bond Yield and Implied 20-
year U.S. Risk-free Rate (Dec 2015) (cont’d)
S.U.R.F.A. Technical Conference April 28, 2016 19Duff & Phelps
Sources: "Survey of Professional Forecasters: Fourth Quarter 2015”, Federal Reserve Bank of Philadelphia (November 13, 2015); "The Livingston Survey:December 2015”, Federal Reserve Bank of Philadelphia (December 10, 2015); “US Consensus Forecast “, Consensus Economics Inc. (January 11,2016); Blue Chip Economic Indicators (January 10, 2016); Blue Chip Financial Forecasts (December 1, 2015).
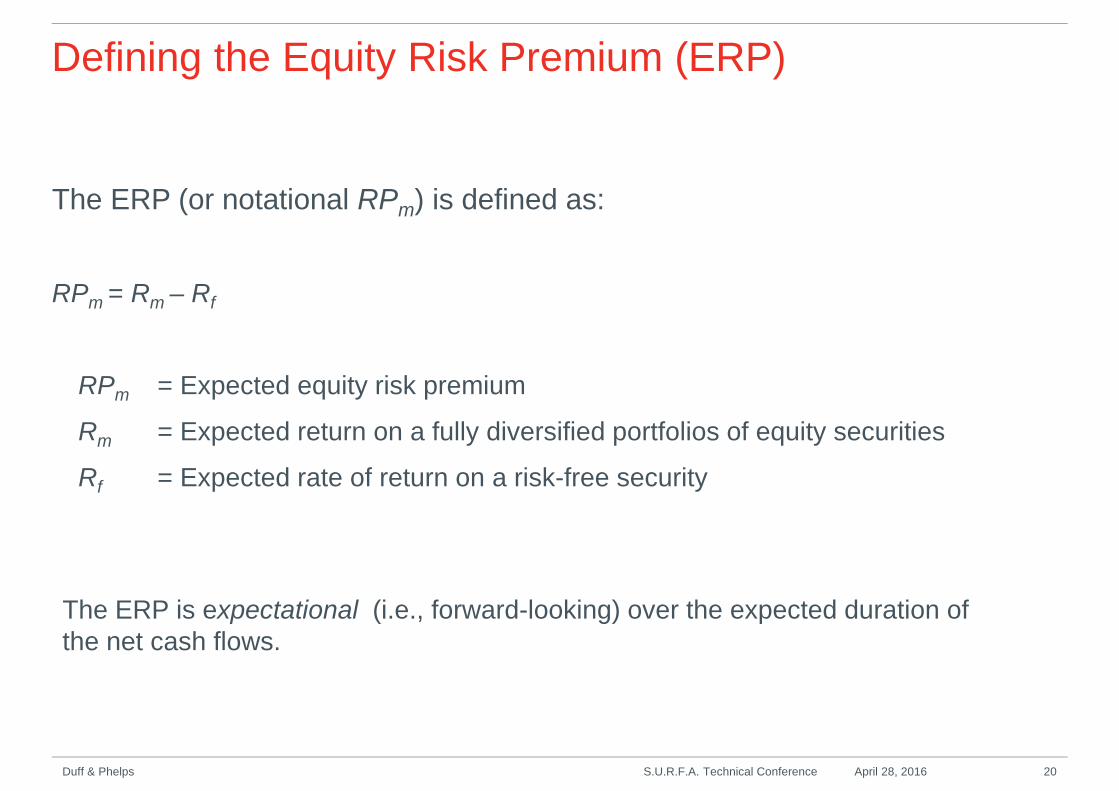
Defining the Equity Risk Premium (ERP)
The ERP (or notational RPm) is defined as:
RPm = Rm – Rf
RPm = Expected equity risk premium
Rm = Expected return on a fully diversified portfolios of equity securities
Rf = Expected rate of return on a risk-free security
The ERP is expectational (i.e., forward-looking) over the expected duration ofthe net cash flows.
S.U.R.F.A. Technical Conference April 28, 2016 20Duff & Phelps

Unconditional ERP
• Unconditional ERP – the long-term average ERP.
• Commonly use realized risk premium data (the ex post approach):
• While academics and practitioners agree that ERP is a forward-lookingconcept, some practitioners, including taxing authorities and regulatorybodies, use historical data to estimate the ERP under the assumption thathistorical data are a valid proxy for current investor expectations –provides appearance of accuracy.
• Estimate of the ERP is the risk premium (realized return on stocks inexcess of the risk-free rate) that investors have, on the average, realizedover some historical holding period
• Underlying theory is that the past provides a reasonable indicator of howthe market will behave in the future, and also that investors’ expectationsare influenced by the historical performance of the market
S.U.R.F.A. Technical Conference April 28, 2016 21Duff & Phelps
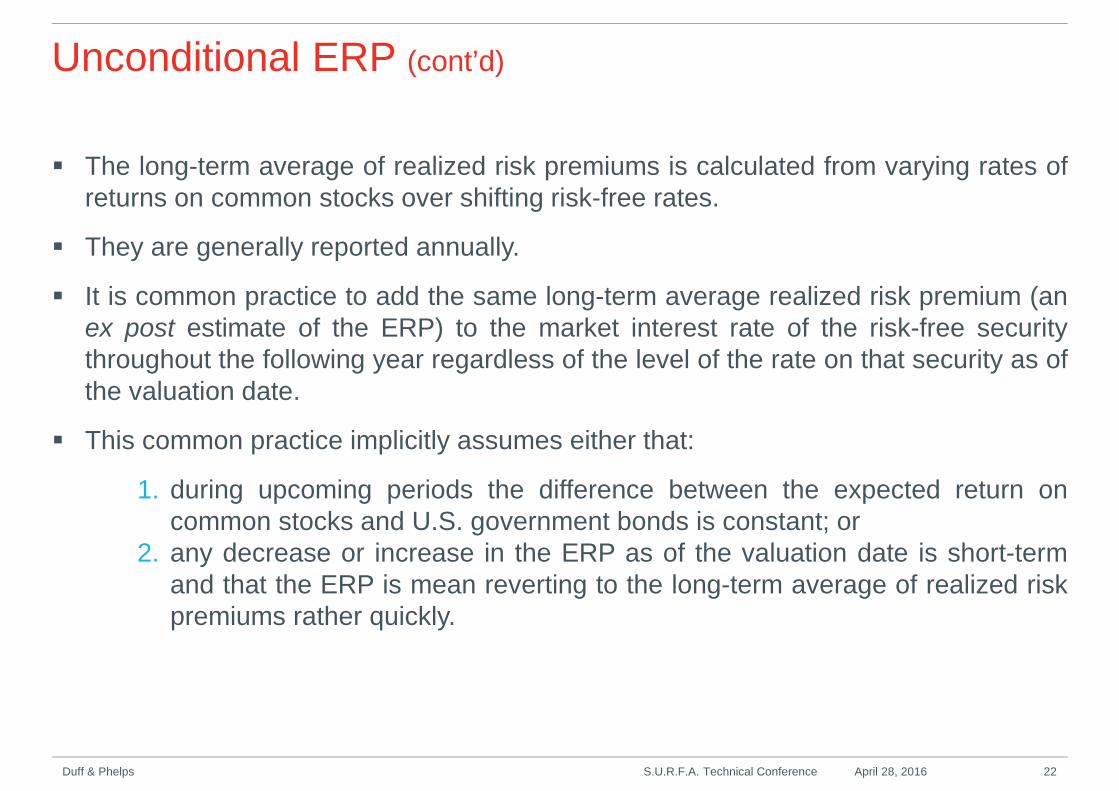
The long-term average of realized risk premiums is calculated from varying rates ofreturns on common stocks over shifting risk-free rates.
They are generally reported annually.
It is common practice to add the same long-term average realized risk premium (anex post estimate of the ERP) to the market interest rate of the risk-free securitythroughout the following year regardless of the level of the rate on that security as ofthe valuation date.
This common practice implicitly assumes either that:
1. during upcoming periods the difference between the expected return oncommon stocks and U.S. government bonds is constant; or
2. any decrease or increase in the ERP as of the valuation date is short-termand that the ERP is mean reverting to the long-term average of realized riskpremiums rather quickly.
Unconditional ERP (cont’d)
S.U.R.F.A. Technical Conference April 28, 2016 22Duff & Phelps
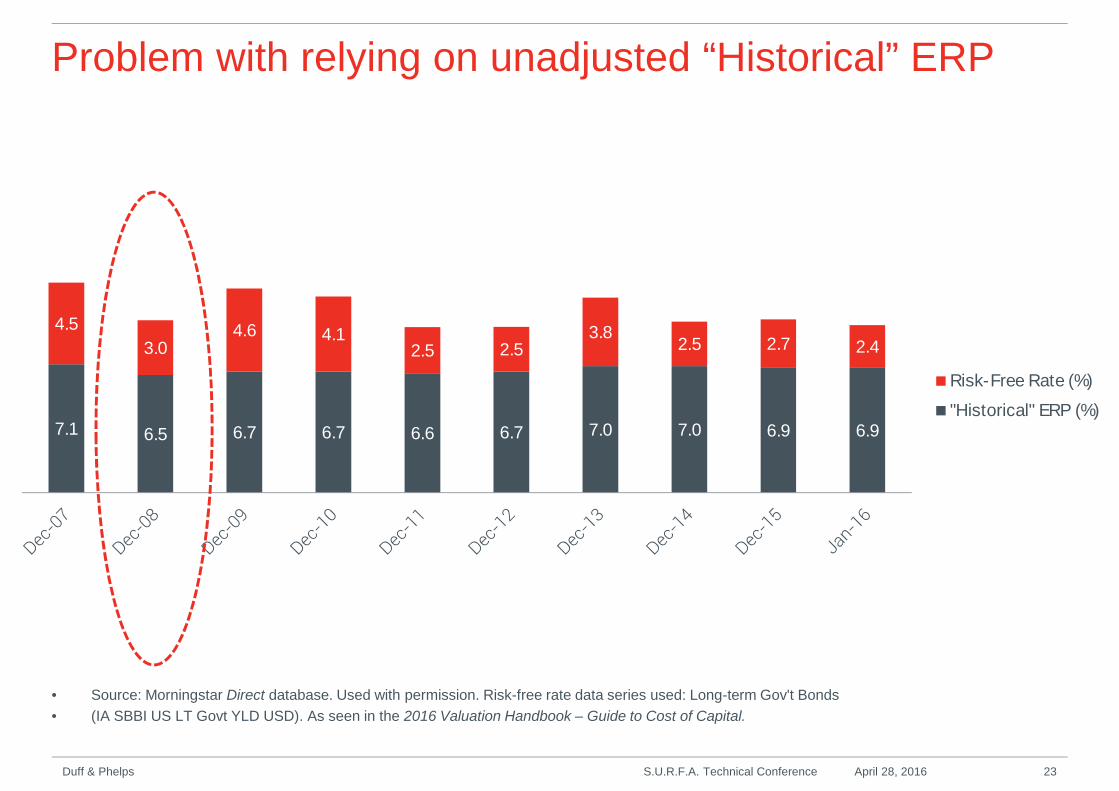
Problem with relying on unadjusted “Historical” ERP
• Source: Morningstar Direct database. Used with permission. Risk-free rate data series used: Long-term Gov't Bonds
• (IA SBBI US LT Govt YLD USD). As seen in the 2016 Valuation Handbook – Guide to Cost of Capital.
S.U.R.F.A. Technical Conference April 28, 2016 23Duff & Phelps
7.1 6.5 6.7 6.7 6.6 6.7 7.0 7.0 6.9 6.9
4.5
3.04.6 4.1
2.5 2.53.8
2.5 2.7 2.4
Risk-Free Rate (%)
"Historical" ERP (%)

Realized Equity Risk Premiums:Stock Market Returns Minus U.S. Government BondsThrough 2015
• Source: Data compiled from R. Ibbotson and G. Brinson, Global Investing (New York: McGraw-Hill, 1993); W. Schwert,“Indexes of U.S. Stock Pricesfrom 1802 to 1987, ” Journal of Business Vol. 63 (July 1990): 399–426; S. Homer and R. Sylla, A History of Interest Rates, 3rd ed. (Piscataway, NJ: RutgersUniversity Press, 1991); and CRSP and Morningstar Direct database. As seen in the 2016 Valuation Handbook – Guide to Cost of Capital.
S.U.R.F.A. Technical Conference April 28, 2016 24Duff & Phelps
Length
(Yrs.) Period Dates
Arithmetic
Average
(%)
Standard
Deviation
(%)
Standard
Error
(%)
Geometric
Average
(%)
20 1996–2015 5.28 18.87 4.22 3.38
30 1986–2015 6.07 17.08 3.12 4.38
40 1976–2015 5.84 16.17 2.56 4.27
50 1966–2015 4.44 16.96 2.40 2.84
90 1926–2015 6.90 20.08 2.12 4.76
116 1900–2015 6.62 19.71 1.83 4.56
144 1872–2015 5.87 18.74 1.56 4.03
218 1798–2015 5.10 17.95 1.22 3.43

Researchers estimating the long-term average ERP adjust average realized riskpremiums for what they believe were non-recurring factors in prior periods or changingeconomic conditions.
The years 1942 through 1951 reflected a period of artificial stability in U.S. governmentbond interest rates. During World War II, the U.S. Treasury decreed that interest rateshad to be kept at artificially low levels in order to reduce government financing costs.This led to the Federal Reserve’s April 1942 public commitment to maintain an interestrate ceiling on government debt, both long term and short term.
After World War II, the Fed continued maintaining an interest rate ceiling, due to theTreasury’s pressure and, to a lesser extent, a fear of returning to the highunemployment levels of the Great Depression.
But postwar inflationary pressures caused the Treasury and the Fed to reach an accordannounced March 4, 1951, freeing the Fed of its obligation of pegging interest rates.
The artificially low rates of 1942–1951 creates an upward bias in realized risk premiumdata from 1926-2015 of approximately 1.1%
Bias in Realized Risk Premium Data
S.U.R.F.A. Technical Conference April 28, 2016 25Duff & Phelps

Realized Risk PremiumsIncluding and Excluding the Years 1942–1951
• Source: Morningstar Direct database. As seen in the 2016 Valuation Handbook – Guide to Cost of Capital.
S.U.R.F.A. Technical Conference April 28, 2016 26Duff & Phelps
Period
Dates
Realized Risk Premiums
(arithmetic average) (%)
Standard
Deviations (%)
1926–2015 6.90 20.08
1926–2015 (excluding 1942–1951) 5.80 20.56
Bias in Realized Risk Premium Data (cont’d)
Ibbotson and Chen report on a study in which they estimated forward-looking
long-term sustainable equity returns and expected ERPs since 1926.
In the update to this study, reported in the 2016 Valuation Handbook – Guide to
Cost of Capital, the long-term ERP since 1926 that could have been expected,
given the underlying economics (the “supply side” model estimate), was less
than the historical returns.
Goetzmann and Ibbotson, commenting on the supply side approach of
estimating expected risk premiums, note:
» “These forecasts tend to give somewhat lower forecasts than historical risk
premiums, primarily because part of the total returns of the stock market
have come from price-earnings ratio expansion. This expansion is not
predicted to continue indefinitely, and should logically be removed from the
expected risk premium.”
S.U.R.F.A. Technical Conference April 28, 2016 27Duff & Phelps

Unconditional ERP Estimates
As reported in the Valuation Handbook-Guide to Cost of Capital:
1926-2013 1926-2014 1926-2015
Long-horizon expected “historical”U.S. equity risk premium
6.96% 7.00% 6.90%
Long-horizon expected “historical”U.S. equity risk premium adjusted forWW II Interest Rate Bias (excluding1942–1951)
5.84% 5.89% 5.80%
Long-horizon expected “supply side”U.S. equity risk premium
6.18% 6.21% 6.03%
Long-horizon expected “supply side”U.S. equity risk premium adjusted forWW II Interest Rate Bias (excluding1942–1951)
5.06% 5.10% 4.93%
S.U.R.F.A. Technical Conference April 28, 2016 28Duff & Phelps
• ERP is cyclical - conditional ERP represents ERP at a specific point in the cycle.
• Forward-looking (ex ante) approaches can be grouped into four categories:
Bottom-up implied ERP estimates This is a company-by-company approach. Thisapproach typically uses expected growth in earnings or dividends as a basis for estimatinga “bottom-up”, company-by-company rate of return for the companies in the universeanalyzed.
Top-down implied ERP estimates This approach uses aggregate estimates for the entiremarket. This approach typically uses expected growth in earnings or dividends for theaggregate of the companies comprising a stock index (e.g., the S&P 500), not company-by-company.
Top-down risk premium estimates This approach estimates the ERP or changes in theERP using observed relationships between interest rates or other factors that impact theERP.
Surveys This approach relies on opinions of investors and financial professionals throughsurveys of their views on the prospects of the overall market and the return expected inexcess of a risk-free benchmark.
Conditional ERP
S.U.R.F.A. Technical Conference April 28, 2016 29Duff & Phelps

Factors Considered in ERP Recommendationas of beginning of December 2015
Duff & Phelps Recommended U.S. Equity Risk Premium (ERP) andCorresponding Risk-Free Rates (Rf): 5.0% (ERP) and matching 4.0% (Rf)
S.U.R.F.A. Technical Conference April 28, 2016 30Duff & Phelps
Factor Change Effect on ERP
U.S. Equity Markets ↔ ↔
Implied Equity Volatility ↔ ↔
Corporate Spreads ↑ ↑
GDP Growth and GDP Growth Forecasts ↔ ↔
Unemployment Environment ↓ ↓
Consumer and Business Sentiment ↔ ↔
Sovereign Credit Ratings ↔ ↔
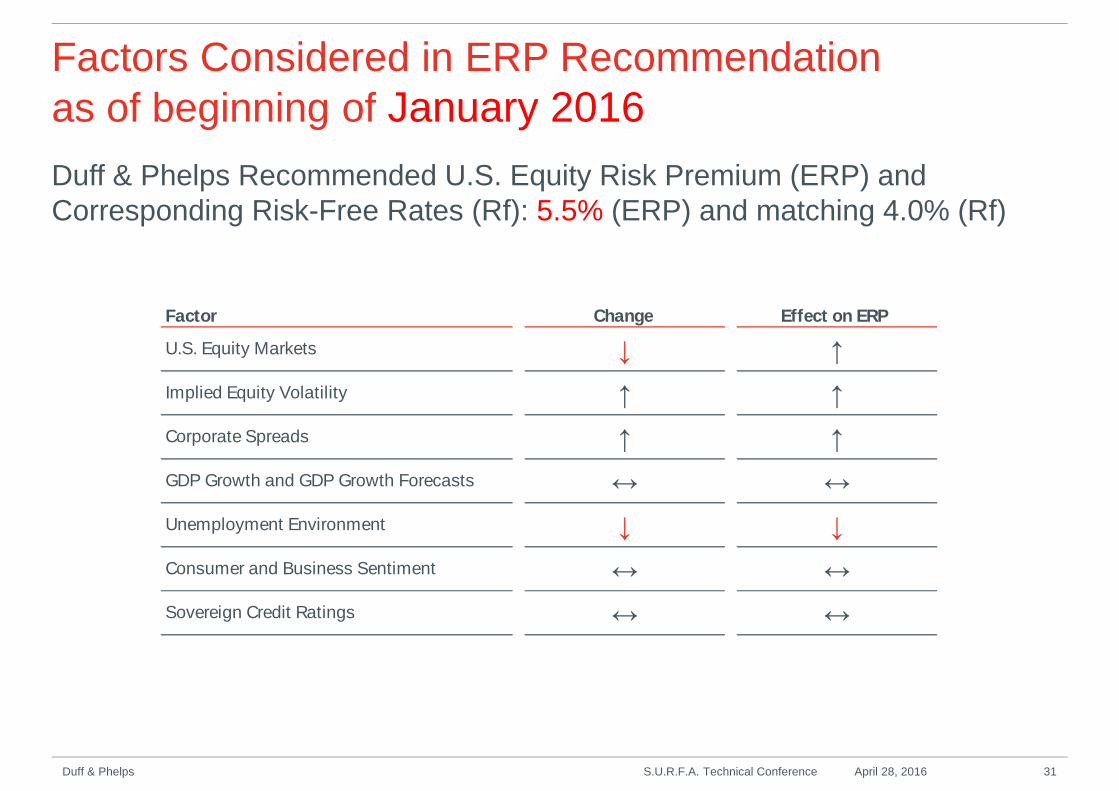
Factors Considered in ERP Recommendationas of beginning of January 2016
Duff & Phelps Recommended U.S. Equity Risk Premium (ERP) andCorresponding Risk-Free Rates (Rf): 5.5% (ERP) and matching 4.0% (Rf)
S.U.R.F.A. Technical Conference April 28, 2016 31Duff & Phelps
Factor Change Effect on ERP
U.S. Equity Markets ↓ ↑
Implied Equity Volatility ↑ ↑
Corporate Spreads ↑ ↑
GDP Growth and GDP Growth Forecasts ↔ ↔
Unemployment Environment ↓ ↓
Consumer and Business Sentiment ↔ ↔
Sovereign Credit Ratings ↔ ↔
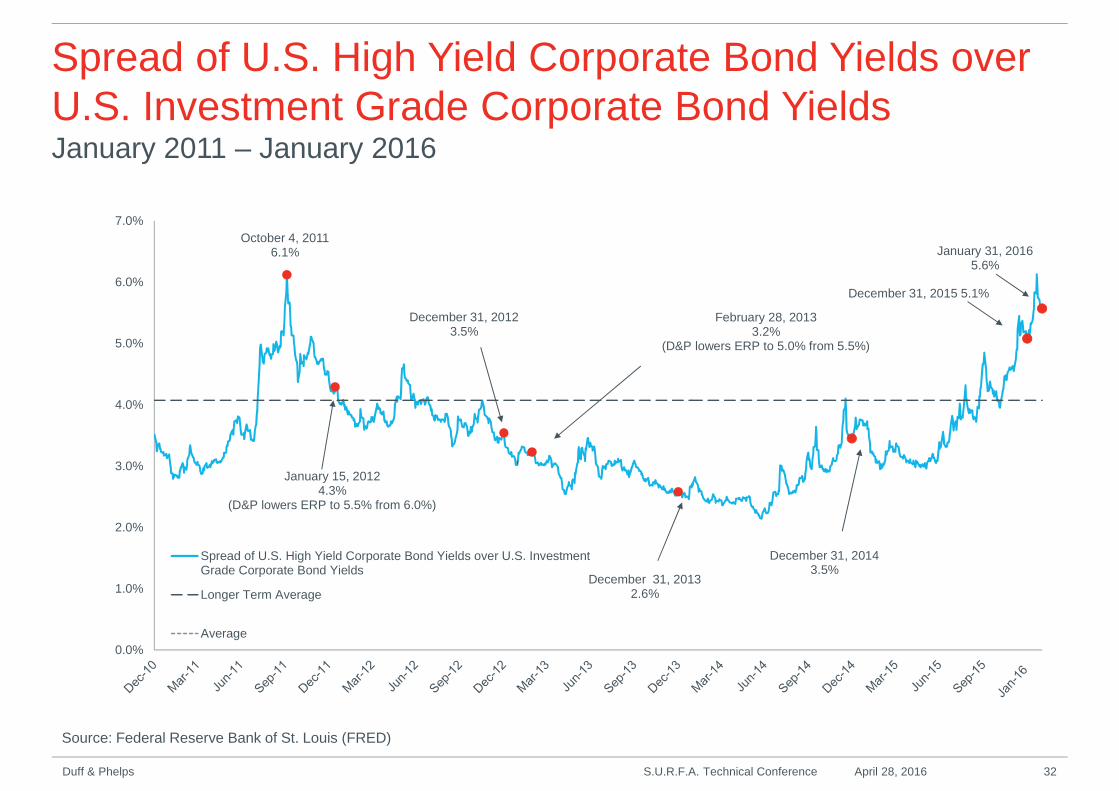
Spread of U.S. High Yield Corporate Bond Yields overU.S. Investment Grade Corporate Bond YieldsJanuary 2011 – January 2016
Source: Federal Reserve Bank of St. Louis (FRED)
S.U.R.F.A. Technical Conference April 28, 2016 32Duff & Phelps
October 4, 20116.1%
December 31, 20123.5%
December 31, 20132.6%
December 31, 20143.5%
December 31, 2015 5.1%
January 31, 20165.6%
0.0%
1.0%
2.0%
3.0%
4.0%
5.0%
6.0%
7.0%
Spread of U.S. High Yield Corporate Bond Yields over U.S. InvestmentGrade Corporate Bond Yields
Longer Term Average
Average
January 15, 20124.3%
(D&P lowers ERP to 5.5% from 6.0%)
February 28, 20133.2%
(D&P lowers ERP to 5.0% from 5.5%)

2016 U.S. Real GDP Forecastat December 2015
S.U.R.F.A. Technical Conference April 28, 2016 33Duff & Phelps
2016 Real GDP Forecasts Forecast (%)
The Livingston Survey 2.6
Survey of Professional Forecasters (SPF) 2.6
Blue Chip Economic Indicators 2.5
Blue Chip Financial Forecasts 2.6
Consensus Economics 2.4
Bloomberg U.S. Economic Forecasts 2.4
Average 2.5%
Sources: "The Livingston Survey: December 2015”, Federal Reserve Bank of Philadelphia (December 10, 2015); "Survey of Professional Forecasters:Fourth Quarter 2015”, Federal Reserve Bank of Philadelphia (November 13, 2015); Federal Reserve Bank of Cleveland (estimates as of December 2015);FRED® Economic Data – Federal Reserve Bank of St. Louis; Blue Chip Financial Forecasts Vol. 34 (12) (December 1, 2015); Bloomberg.
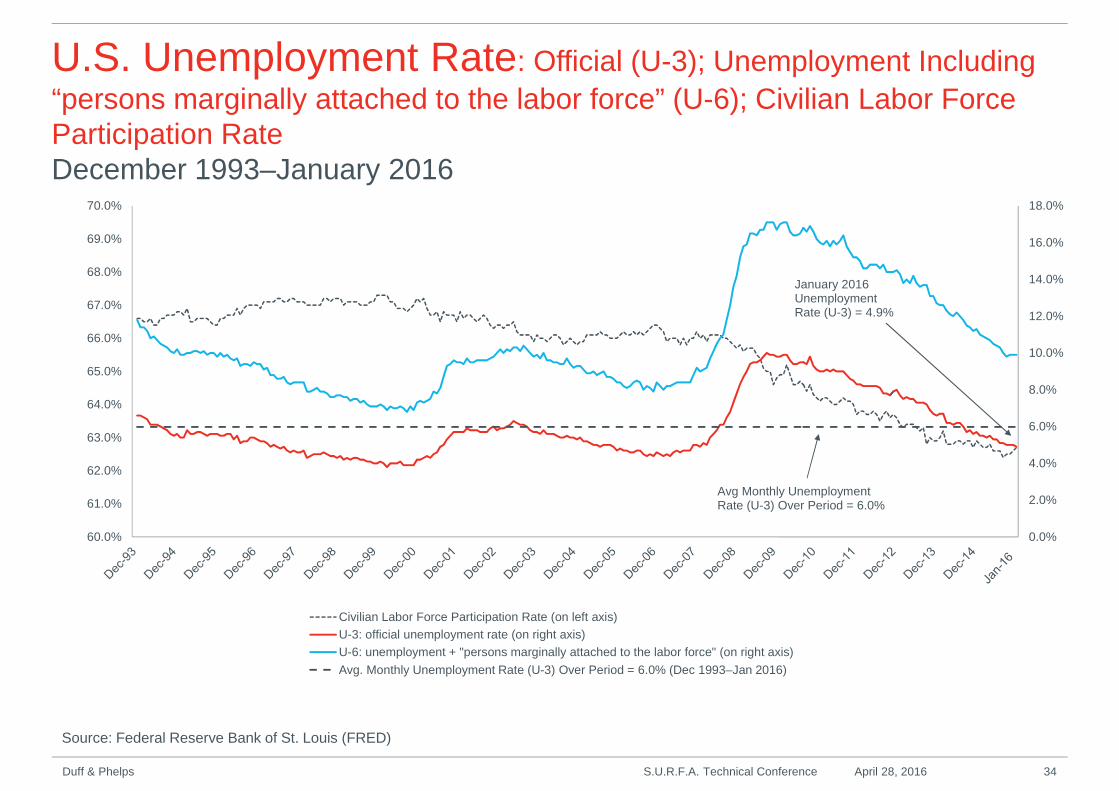
U.S. Unemployment Rate: Official (U-3); Unemployment Including
“persons marginally attached to the labor force” (U-6); Civilian Labor ForceParticipation RateDecember 1993–January 2016
Source: Federal Reserve Bank of St. Louis (FRED)
S.U.R.F.A. Technical Conference April 28, 2016 34Duff & Phelps
0.0%
2.0%
4.0%
6.0%
8.0%
10.0%
12.0%
14.0%
16.0%
18.0%
60.0%
61.0%
62.0%
63.0%
64.0%
65.0%
66.0%
67.0%
68.0%
69.0%
70.0%
Civilian Labor Force Participation Rate (on left axis)
U-3: official unemployment rate (on right axis)
U-6: unemployment + "persons marginally attached to the labor force" (on right axis)
Avg. Monthly Unemployment Rate (U-3) Over Period = 6.0% (Dec 1993–Jan 2016)
January 2016UnemploymentRate (U-3) = 4.9%
Avg Monthly UnemploymentRate (U-3) Over Period = 6.0%
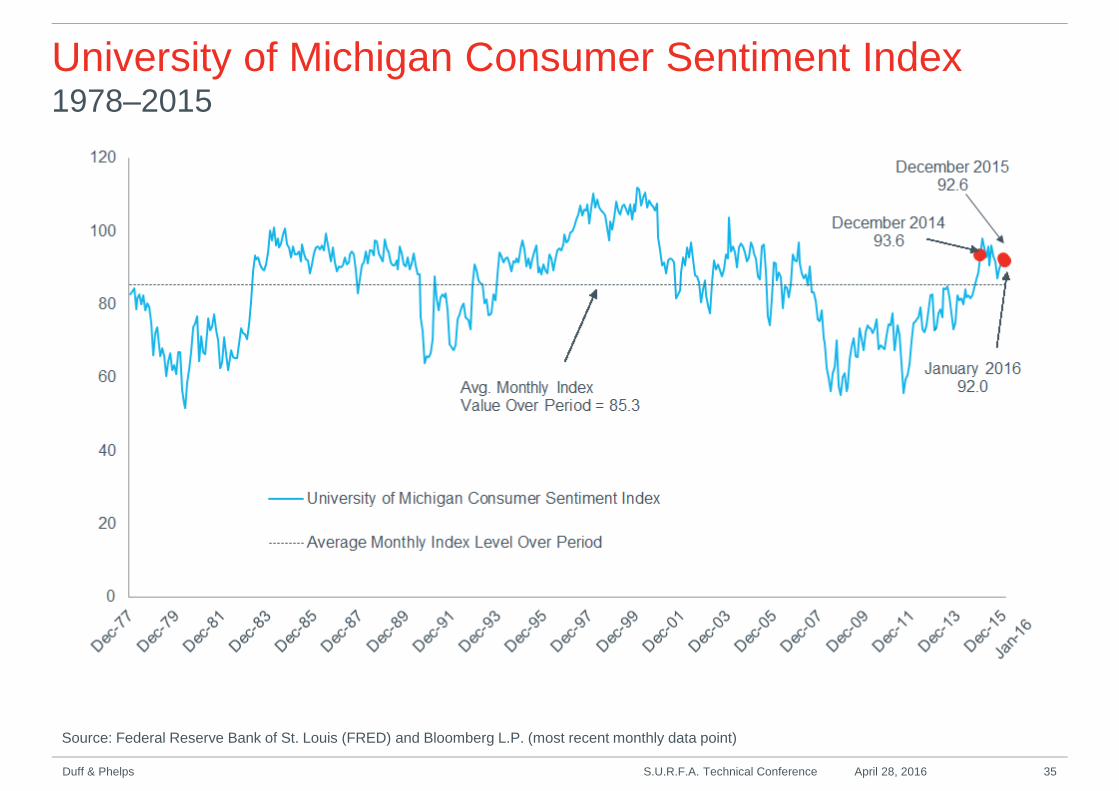
University of Michigan Consumer Sentiment Index1978–2015
Source: Federal Reserve Bank of St. Louis (FRED) and Bloomberg L.P. (most recent monthly data point)
S.U.R.F.A. Technical Conference April 28, 2016 35Duff & Phelps
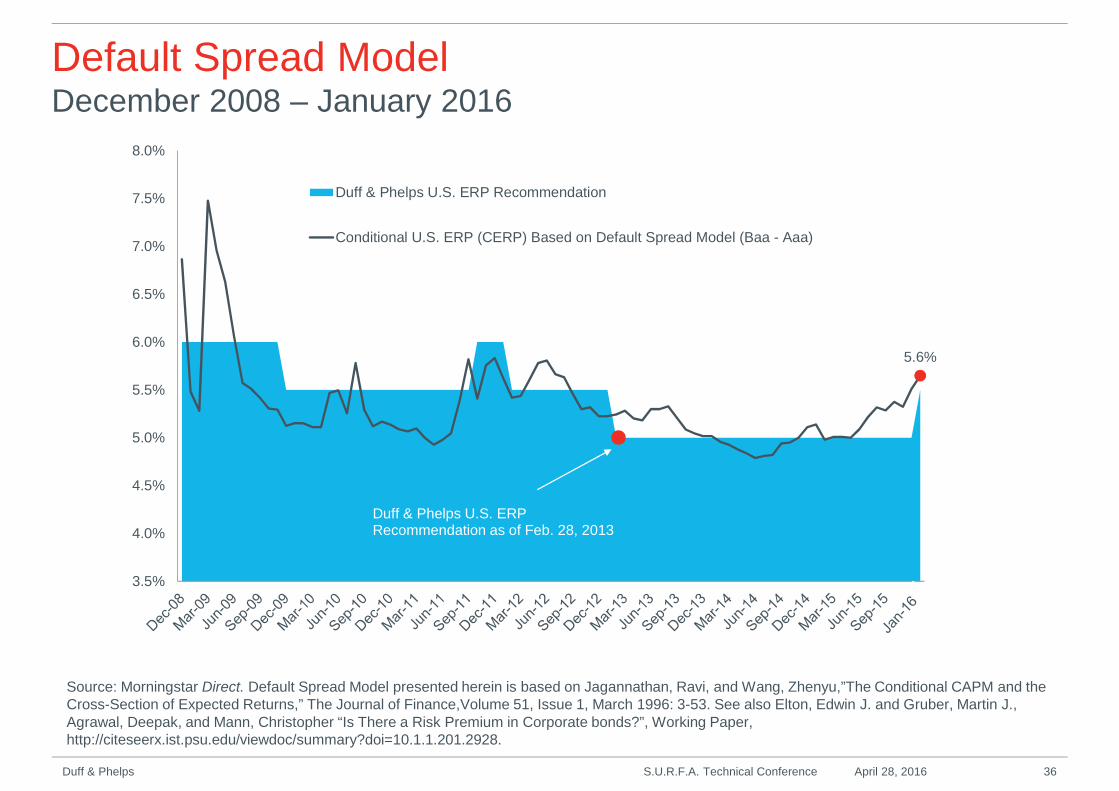
Default Spread ModelDecember 2008 – January 2016
Source: Morningstar Direct. Default Spread Model presented herein is based on Jagannathan, Ravi, and Wang, Zhenyu,”The Conditional CAPM and theCross-Section of Expected Returns,” The Journal of Finance,Volume 51, Issue 1, March 1996: 3-53. See also Elton, Edwin J. and Gruber, Martin J.,Agrawal, Deepak, and Mann, Christopher “Is There a Risk Premium in Corporate bonds?”, Working Paper,http://citeseerx.ist.psu.edu/viewdoc/summary?doi=10.1.1.201.2928.
S.U.R.F.A. Technical Conference April 28, 2016 36Duff & Phelps
5.6%
3.5%
4.0%
4.5%
5.0%
5.5%
6.0%
6.5%
7.0%
7.5%
8.0%
Duff & Phelps U.S. ERP Recommendation
Conditional U.S. ERP (CERP) Based on Default Spread Model (Baa - Aaa)
Duff & Phelps U.S. ERPRecommendation as of Feb. 28, 2013
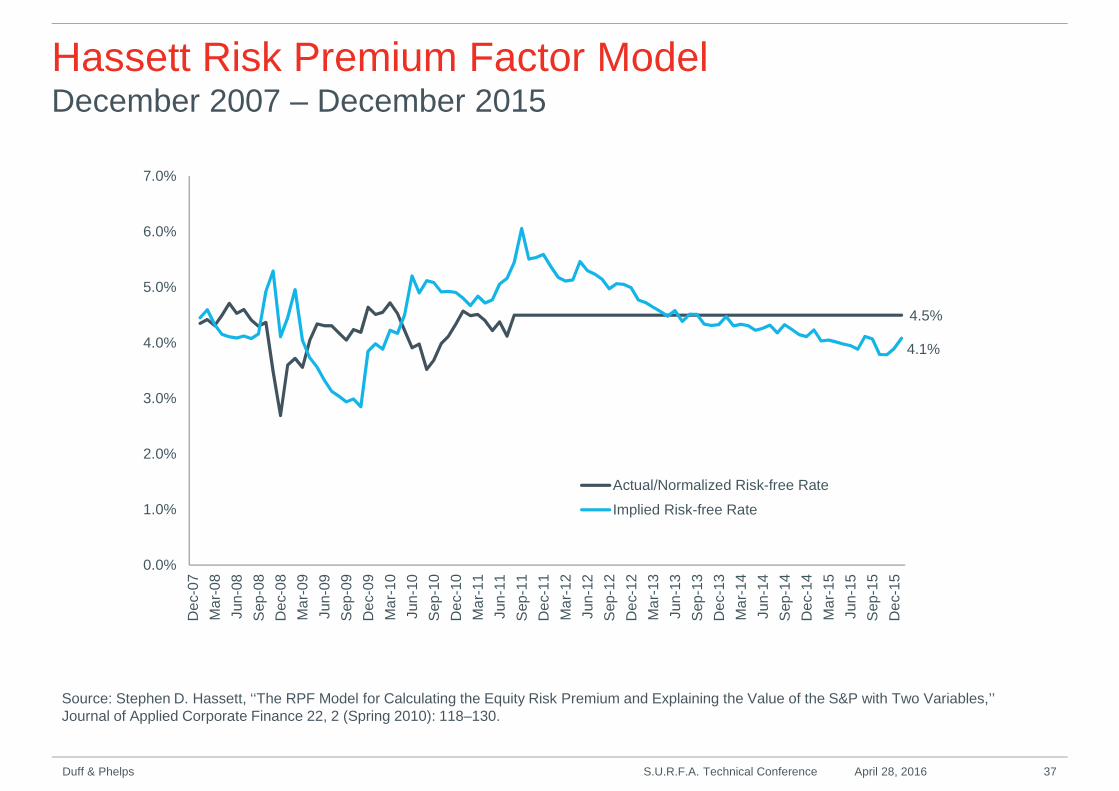
Hassett Risk Premium Factor ModelDecember 2007 – December 2015
Source: Stephen D. Hassett, ‘‘The RPF Model for Calculating the Equity Risk Premium and Explaining the Value of the S&P with Two Variables,’’Journal of Applied Corporate Finance 22, 2 (Spring 2010): 118–130.http://seekingalpha.com/article/2798645-s-and-p-500-ends-2014-in-fair-value-range-with-growth-likely-in-2015?ifp=0
S.U.R.F.A. Technical Conference April 28, 2016 37Duff & Phelps
4.5%
4.1%
0.0%
1.0%
2.0%
3.0%
4.0%
5.0%
6.0%
7.0%D
ec-
07
Ma
r-0
8
Jun
-08
Sep
-08
De
c-0
8
Ma
r-0
9
Jun
-09
Sep
-09
De
c-0
9
Ma
r-1
0
Jun
-10
Sep
-10
De
c-1
0
Ma
r-1
1
Jun
-11
Sep
-11
De
c-1
1
Ma
r-1
2
Jun
-12
Sep
-12
De
c-1
2
Ma
r-1
3
Jun
-13
Sep
-13
De
c-1
3
Ma
r-1
4
Jun
-14
Sep
-14
De
c-1
4
Ma
r-1
5
Jun
-15
Sep
-15
De
c-1
5
Actual/Normalized Risk-free Rate
Implied Risk-free Rate

Hassett Risk Premium Factor Model (cont’d)
December 2007 – December 2015
S.U.R.F.A. Technical Conference April 28, 2016 38Duff & Phelps
Source: Stephen D. Hassett, ‘‘The RPF Model for Calculating the Equity Risk Premium and Explaining the Value of the S&P with Two Variables,’’Journal of Applied Corporate Finance 22, 2 (Spring 2010): 118–130.http://seekingalpha.com/article/2798645-s-and-p-500-ends-2014-in-fair-value-range-with-growth-likely-in-2015?ifp=0
1,940
1,743
-
500
1,000
1,500
2,000
2,500
De
c-07
Ma
r-0
8
Ju
n-0
8
Se
p-0
8
De
c-08
Ma
r-0
9
Ju
n-0
9
Se
p-0
9
De
c-09
Ma
r-1
0
Ju
n-1
0
Se
p-1
0
De
c-10
Ma
r-1
1
Ju
n-1
1
Se
p-1
1
De
c-11
Ma
r-1
2
Ju
n-1
2
Se
p-1
2
De
c-12
Ma
r-1
3
Ju
n-1
3
Se
p-1
3
De
c-13
Ma
r-1
4
Ju
n-1
4
Se
p-1
4
De
c-14
Ma
r-1
5
Ju
n-1
5
Se
p-1
5
De
c-15
Ind
ex
Le
vel
S&P 500 Index
Predicted S&P 500 Index (per Hassett)
Duff & Phelps Recommended ERP vs.Arithmetic Adjusted Damodaran Implied ERP
Additional information and data is available at Professor Damodaran’s website at http://pages.stern.nyu.edu/~adamodar/
Professor Aswath Damodaran calculates implied ERP monthly estimates for theS&P 500 and publishes his estimates on his website.
1. Damodaran estimates an implied ERP by first solving for the discount rate thatequates the current S&P 500 index level with his estimates of cashdistributions (dividends and stock buybacks) in future years.
2. He then subtracts the current yield on 10-year U.S. government bonds to arriveat the implied ERP.
Duff & Phelps adjusts the ERP estimates (based on this model) that ProfessorDamodaran publishes since they are geometric average ERPs in terms of a 10-year U.S. Government bond.
Duff & Phelps first converts both of Damodaran’s published geometric ERPestimates to an equivalent estimate in terms of normalized yields on 20-year U.S.government bonds and then converts the geometric ERP estimates to theirarithmetic average equivalents.
S.U.R.F.A. Technical Conference April 28, 2016 39Duff & Phelps

Duff & Phelps Recommended ERP vs. ArithmeticAdjusted Damodaran Implied ERP (with Normalized Rf)at December 2015
Expected growth will vary based on selected cash yield. Additional information and data is available at Professor Damodaran’s website athttp://pages.stern.nyu.edu/~adamodar/
S.U.R.F.A. Technical Conference April 28, 2016 40Duff & Phelps
Damodaran
Implied ERP
(as
published)
LTM Cash
Yield
Damodaran
Implied ERP
(as
published)
Normalized
10-year Cash
Yield
Extreme
Case 1:
Lowest Cash
Yield &
Lowest
Expected
Growth Rate
Extreme
Case 2:
Lowest Cash
Yield &
Highest
Expected
Growth Rate
Extreme Case
3: Highest
Cash Yield &
Lowest
Expected
Growth Rate
Extreme
Case 4:
Highest
Cash Yield &
Highest
Expected
Growth Rate
Risk Premium Calculator Inputs
Cash yield (dividends and stock buybacks) on Index 5.19% 5.25% 3.63% 3.63% 5.25% 5.25%
Expected Growth Choices (next 5 years) 5.55% 5.55% 4.27% 7.53% 4.27% 7.53%
Long Term Risk Free Rate 2.27% 2.27% 2.27% 2.27% 2.27% 2.27%
Expected growth rate in the long term (after year 5) 2.27% 2.27% 2.27% 2.27% 2.27% 2.27%
Geometric Average Implied ERP 6.12% 6.19% 4.06% 4.68% 5.86% 6.72%
Arithmetic Adjustments:
Normalized RF 4.00% 4.00% 4.00% 4.00% 4.00% 4.00%
Treasury Yield Difference -1.73% -1.73% -1.73% -1.73% -1.73% -1.73%
Geometric Average Implied ERP (Adjusted) 4.39% 4.46% 2.33% 2.95% 4.13% 4.99%
Arithmetic Average ERP Conversion Factor 1.44% 1.44% 1.44% 1.44% 1.44% 1.44%
D&P Arithmetic Adjusted Implied ERP 5.82% 5.89% 3.77% 4.39% 5.57% 6.42%
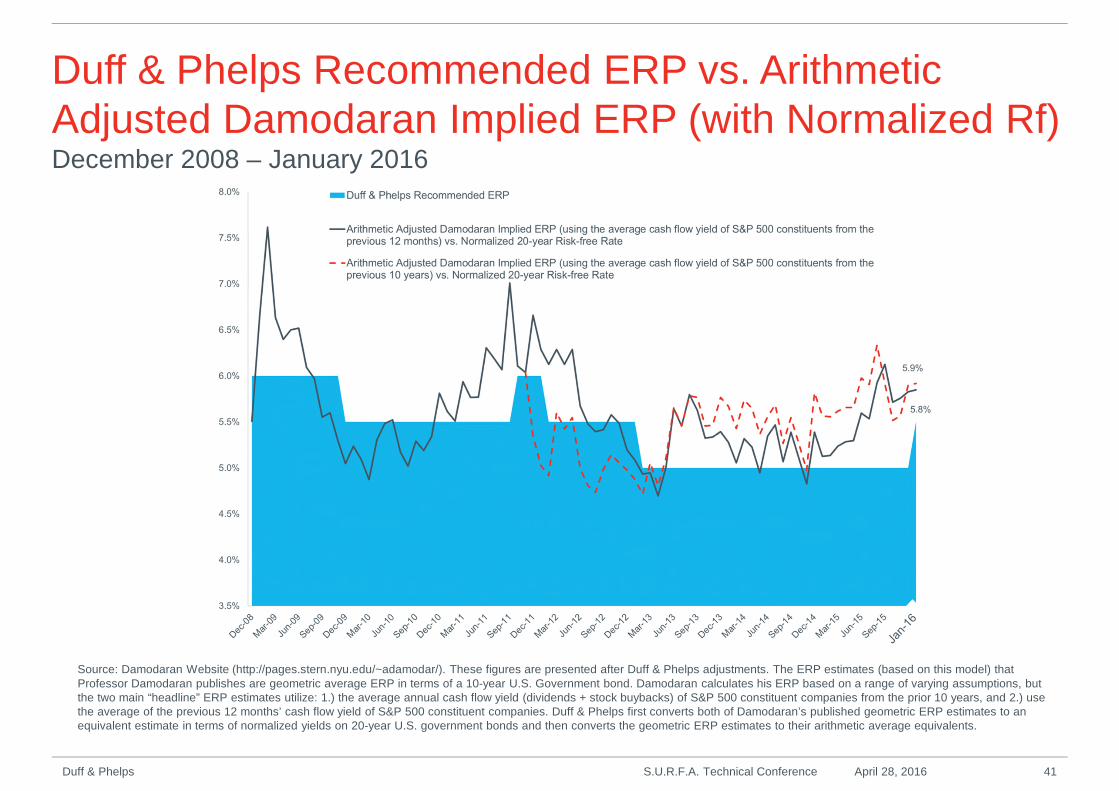
Duff & Phelps Recommended ERP vs. ArithmeticAdjusted Damodaran Implied ERP (with Normalized Rf)December 2008 – January 2016
Source: Damodaran Website (http://pages.stern.nyu.edu/~adamodar/). These figures are presented after Duff & Phelps adjustments. The ERP estimates (based on this model) thatProfessor Damodaran publishes are geometric average ERP in terms of a 10-year U.S. Government bond. Damodaran calculates his ERP based on a range of varying assumptions, butthe two main “headline” ERP estimates utilize: 1.) the average annual cash flow yield (dividends + stock buybacks) of S&P 500 constituent companies from the prior 10 years, and 2.) usethe average of the previous 12 months’ cash flow yield of S&P 500 constituent companies. Duff & Phelps first converts both of Damodaran’s published geometric ERP estimates to anequivalent estimate in terms of normalized yields on 20-year U.S. government bonds and then converts the geometric ERP estimates to their arithmetic average equivalents.
S.U.R.F.A. Technical Conference April 28, 2016 41Duff & Phelps
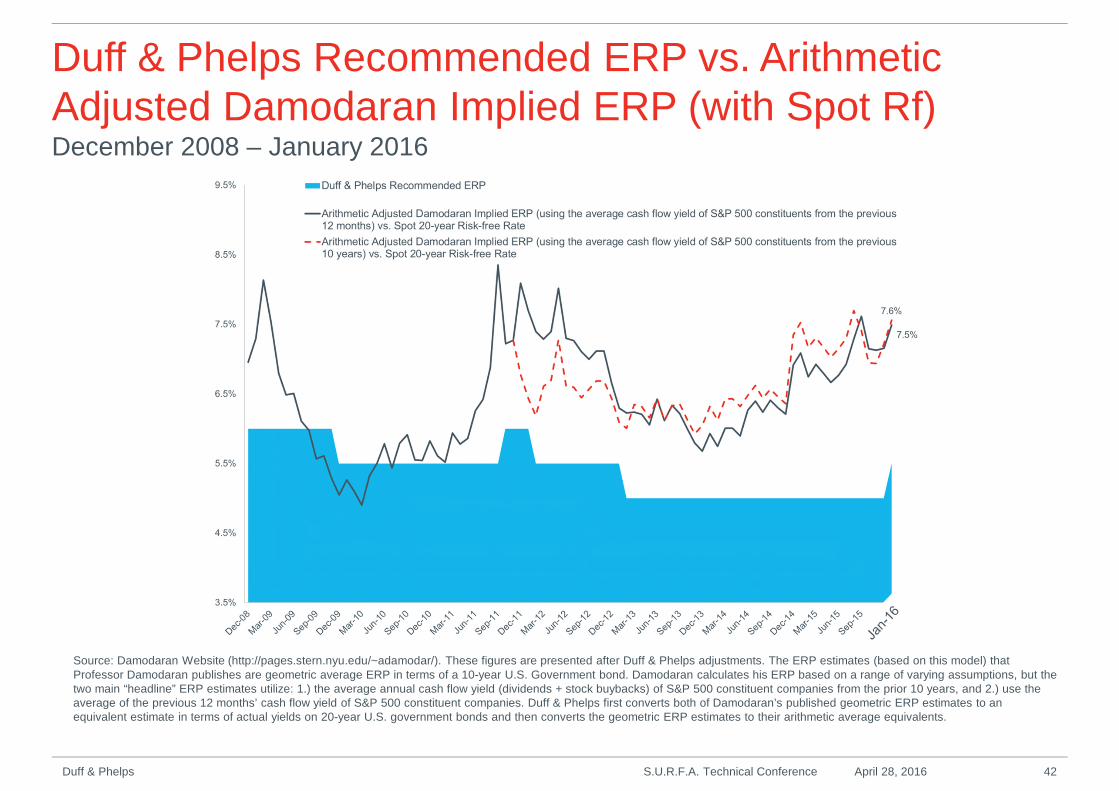
Duff & Phelps Recommended ERP vs. ArithmeticAdjusted Damodaran Implied ERP (with Spot Rf)December 2008 – January 2016
Source: Damodaran Website (http://pages.stern.nyu.edu/~adamodar/). These figures are presented after Duff & Phelps adjustments. The ERP estimates (based on this model) thatProfessor Damodaran publishes are geometric average ERP in terms of a 10-year U.S. Government bond. Damodaran calculates his ERP based on a range of varying assumptions, but thetwo main “headline” ERP estimates utilize: 1.) the average annual cash flow yield (dividends + stock buybacks) of S&P 500 constituent companies from the prior 10 years, and 2.) use theaverage of the previous 12 months’ cash flow yield of S&P 500 constituent companies. Duff & Phelps first converts both of Damodaran’s published geometric ERP estimates to anequivalent estimate in terms of actual yields on 20-year U.S. government bonds and then converts the geometric ERP estimates to their arithmetic average equivalents.
S.U.R.F.A. Technical Conference April 28, 2016 42Duff & Phelps
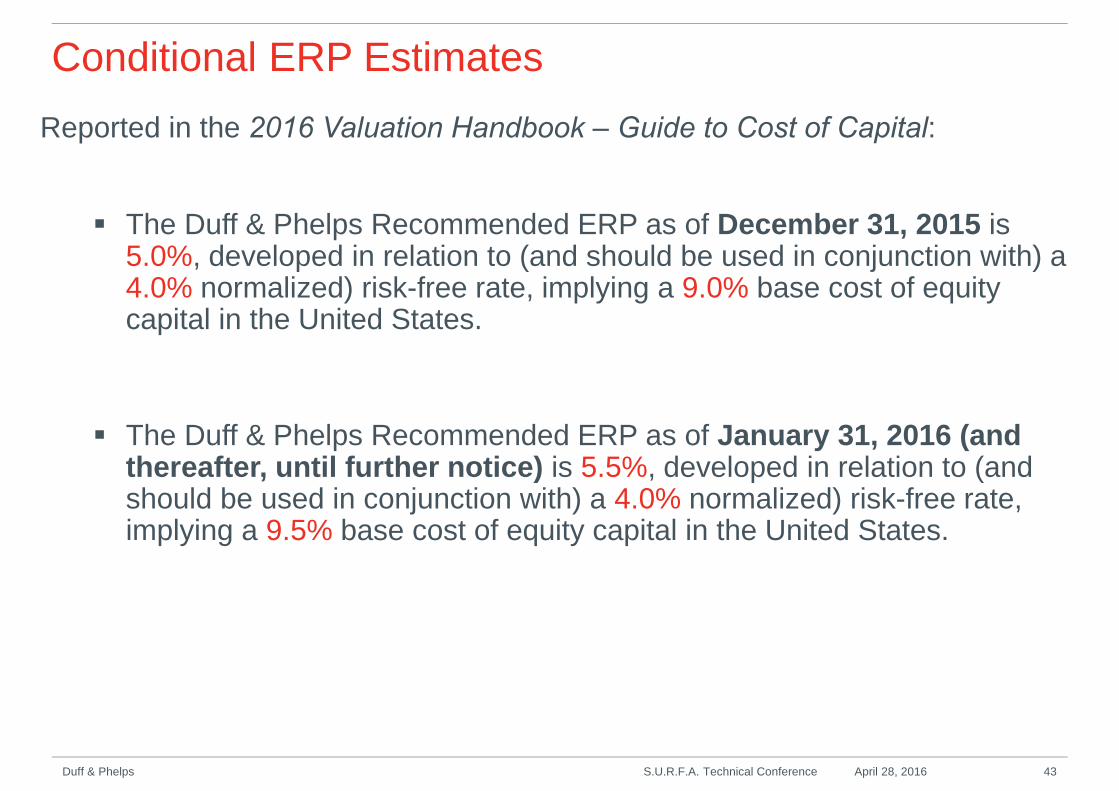
Reported in the 2016 Valuation Handbook ‒ Guide to Cost of Capital:
The Duff & Phelps Recommended ERP as of December 31, 2015 is5.0%, developed in relation to (and should be used in conjunction with) a4.0% normalized) risk-free rate, implying a 9.0% base cost of equitycapital in the United States.
The Duff & Phelps Recommended ERP as of January 31, 2016 (andthereafter, until further notice) is 5.5%, developed in relation to (andshould be used in conjunction with) a 4.0% normalized) risk-free rate,implying a 9.5% base cost of equity capital in the United States.
Conditional ERP Estimates
S.U.R.F.A. Technical Conference April 28, 2016 43Duff & Phelps
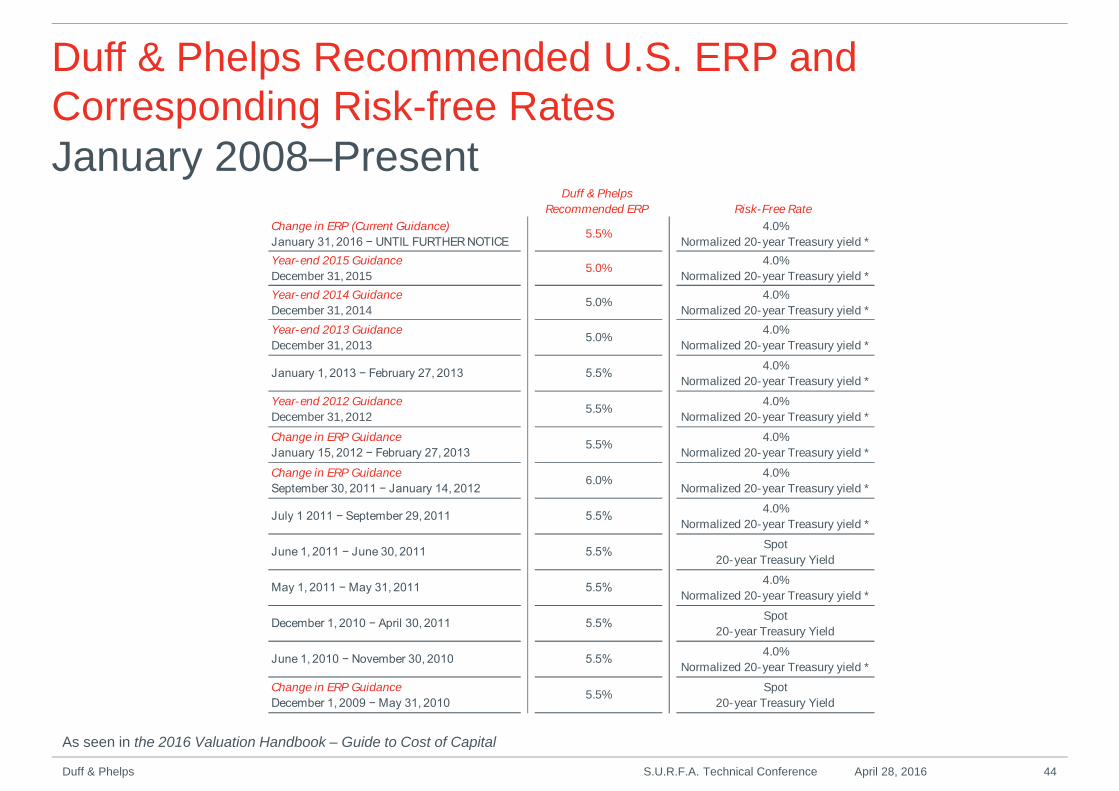
Duff & Phelps Recommended U.S. ERP andCorresponding Risk-free RatesJanuary 2008–Present
As seen in the 2016 Valuation Handbook – Guide to Cost of Capital
S.U.R.F.A. Technical Conference April 28, 2016 44Duff & Phelps
Duff & Phelps
Recommended ERP Risk-Free Rate
Change in ERP (Current Guidance)
January 31, 2016 − UNTIL FURTHER NOTICE5.5%
4.0%
Normalized 20-year Treasury yield *
Year-end 2015 Guidance
December 31, 20155.0%
4.0%
Normalized 20-year Treasury yield *
Year-end 2014 Guidance
December 31, 20145.0%
4.0%
Normalized 20-year Treasury yield *
Year-end 2013 Guidance
December 31, 20135.0%
4.0%
Normalized 20-year Treasury yield *
January 1, 2013 − February 27, 2013 5.5%4.0%
Normalized 20-year Treasury yield *
Year-end 2012 Guidance
December 31, 20125.5%
4.0%
Normalized 20-year Treasury yield *
Change in ERP Guidance
January 15, 2012 − February 27, 20135.5%
4.0%
Normalized 20-year Treasury yield *
Change in ERP Guidance
September 30, 2011 − January 14, 20126.0%
4.0%
Normalized 20-year Treasury yield *
July 1 2011 − September 29, 2011 5.5%4.0%
Normalized 20-year Treasury yield *
June 1, 2011 − June 30, 2011 5.5%Spot
20-year Treasury Yield
May 1, 2011 − May 31, 2011 5.5%4.0%
Normalized 20-year Treasury yield *
December 1, 2010 − April 30, 2011 5.5%Spot
20-year Treasury Yield
June 1, 2010 − November 30, 2010 5.5%4.0%
Normalized 20-year Treasury yield *
Change in ERP Guidance
December 1, 2009 − May 31, 20105.5%
Spot
20-year Treasury Yield
Dealing with Expected Increases in the Risk-free Rate
Any estimate of the ERP must be made in relation to a risk-free security. That is, theERP is measured as the difference between the expected return on a well-diversifiedportfolio of large company common stocks and the rate of return expected on a risk-freesecurity. The selection of an appropriate risk-free security on which to base the ERPestimate is a function of the expected maturity for the investment to which the discountrate (rate of return) is to apply.
In theory, when determining the risk-free rate and the corresponding risk premium, theanalyst should match the duration of the risk-free security and the risk premium with theperiod over which the net cash flows are expected (not over the expected period any oneinvestor may expect to hold the investment). That is, the risk-premium must bemeasured relative to the duration of the risk-free security, and the maturity of the risk-freesecurity must equal the expected life of the investment.
The generalized cost of capital relationship is:
E (Ri) = Rf + RPi
where: E (Ri) = expected return of asset i
Rf = risk-free rate
RPi = risk premium for asset i
S.U.R.F.A. Technical Conference April 28, 2016 45Duff & Phelps
Dealing with Expected Increases in the Risk-free Rate(cont’d)
As a short-cut, analysts often use the maturity of the risk-free instrument instead of theduration as the expected life of the investment. Often this makes little difference.
For example, if you were estimating the expected equity return on a highly liquidinvestment with an expected short-term maturity, a U.S. government short-term note(e.g., T-bill) may be an appropriate instrument to use in benchmarking a risk premium.
Alternatively, if you were estimating the equity return on a long-term investment suchas the valuation of a business where the value can be equated to the present value ofa series of future cash flows over many years, then the yield on a long-term U.S.government bond (e.g., T-bond) may be the more appropriate instrument inbenchmarking a risk premium.
Assuming that the risk premium is a function of a relative risk measure, β, multipliedby the equity risk premium (notationally RPm), the analyst should be discountingexpected cash flows as follows:
Note: We are using the term β here to indicate a generalized relative risk measure; that is, itmeasures how the returns of the respective investment are expected to vary relative to changes inreturns on the market. For simplicity, we are assuming β is constant.
S.U.R.F.A. Technical Conference April 28, 2016 46Duff & Phelps

Dealing with Expected Increases in the Risk-free Rate(cont’d)
Period Risk-free Rate Risk Premium
Short-term cash flows T-bill rate + β x (RPm relative to T-bills)
Cash flows expected in:
Year 1 1-year rate + β x (RPm relative to 1-year T-bonds)
2 2-year rate + β x (RPm relative to 2-year T-bonds)
3 3-year rate + β x (RPm relative to 3-year T-bonds)
. . . and so on
10 10-year rate + β x (RPm relative to 10-year T-bonds)
. . . and so on
long-term long-term rate + β x (RPm relative to long-term T-bonds)
S.U.R.F.A. Technical Conference April 28, 2016 47Duff & Phelps
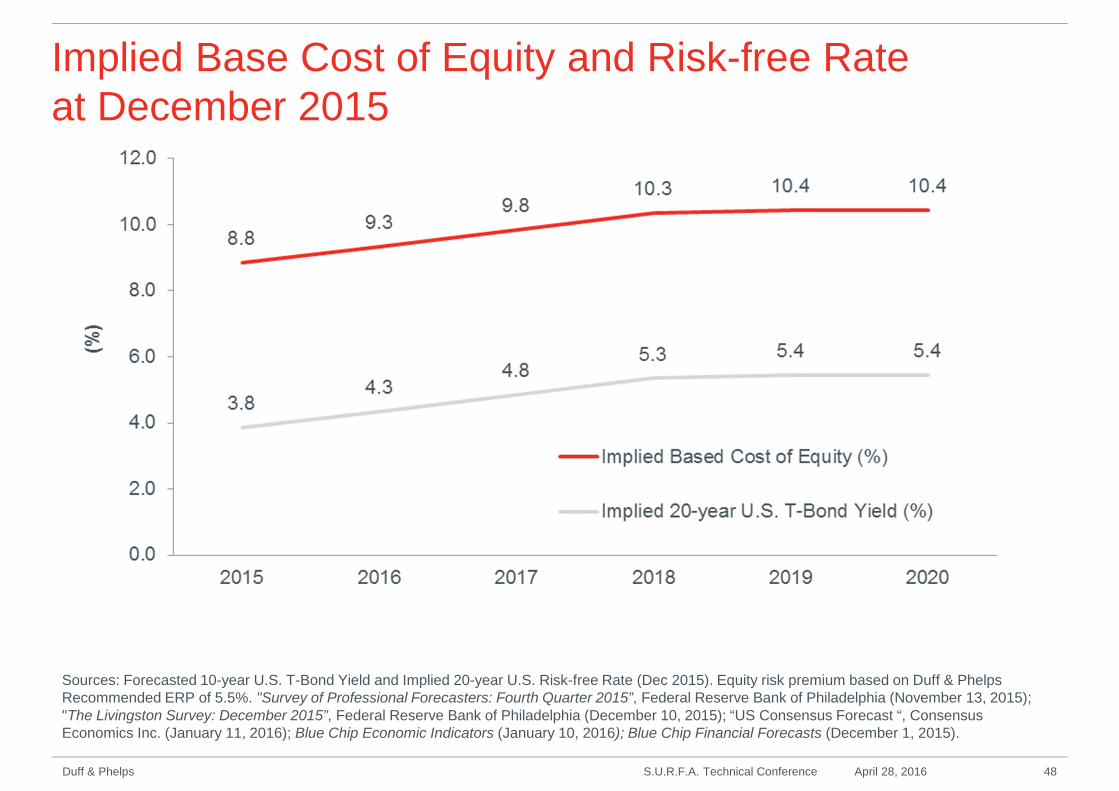
Implied Base Cost of Equity and Risk-free Rateat December 2015
Sources: Forecasted 10-year U.S. T-Bond Yield and Implied 20-year U.S. Risk-free Rate (Dec 2015). Equity risk premium based on Duff & PhelpsRecommended ERP of 5.5%. "Survey of Professional Forecasters: Fourth Quarter 2015”, Federal Reserve Bank of Philadelphia (November 13, 2015);"The Livingston Survey: December 2015”, Federal Reserve Bank of Philadelphia (December 10, 2015); “US Consensus Forecast “, ConsensusEconomics Inc. (January 11, 2016); Blue Chip Economic Indicators (January 10, 2016); Blue Chip Financial Forecasts (December 1, 2015).
S.U.R.F.A. Technical Conference April 28, 2016 48Duff & Phelps
Contact Information
Roger Grabowski
Managing Director
Valuation Advisory
+1 312 697 4720
Duff & Phelps 49S.U.R.F.A. Technical Conference April 28, 2016
Disclaimer
•Any positions presented in this session are those of the speaker and do not
represent the official position of Duff & Phelps, LLC. This material is offered for
educational purposes with the understanding that neither the authors nor Duff
& Phelps, LLC or its affiliates are engaged in rendering legal, accounting or
any other professional service through presentation of this material.
•The information presented in this session has been obtained with the
greatest of care from sources believed to be reliable, but is not guaranteed to
be complete, accurate or timely. Roger J. Grabowski and Duff & Phelps, LLC
or its affiliates expressly disclaim any liability, including incidental or
consequential damages, arising from the use of this material or any errors or
omissions that may be contained in it.
Duff & Phelps 50S.U.R.F.A. Technical Conference April 28, 2016