supramolecular chemistry and self assembly of viologenshss.ulb.uni-bonn.de/2011/2630/2630-2.pdf ·...
TRANSCRIPT

55
Chapter 4
Supramolecular chemistry
and selfassembly of Viologens
4.1 Introduction
Nowadays, supramolecular chemistry has been well established as a major part of modern chemistry dealing with the design, fabrication and characterization of complex molecular architectures of nanometer sizes [2, 79‐81]. A particular challenge for supramolecular chemists is to find artificial model systems allowing them to study the working principles of nano‐sized devices, machines and actuators [82]. A successful strategy towards nano‐scale molecular architectures is based on the so‐called bottom‐up approach. Here, supramolecular structures self‐assemble from simpler molecular building‐blocks via non‐covalent weak forces which often reveal a directional character. As a result molecular architectures are obtained which exhibit a significantly higher complexity than the individual molecular building‐blocks following Lehn‘s definition of supramolecular chemistry as the ‘‘chemistry beyond the molecule’’ [79, 80]. Supramolecular structures are the result not only of additive but also of cooperative interactions, including hydrogen bonding, hydrophobic effects and metal coordination. Their properties differ from the sum of the properties of the individual component [83].
A promising approach to direct the ordering process of supramolecular architectures takes advantage of well defined surfaces of single crystals which can act as electronic and/or geometric templates due to the presence of specific adsorbate–substrate interactions. These are modulated according to the symmetry and periodicity of the substrate surface. Whereas in solution and in the 3D solid‐state only the specific and directional intermolecular interactions govern the assembly of supramolecular architectures we find on surfaces, by contrast, a complex interplay of competing adsorbate‐adsorbate and adsorbate‐substrate interactions controlling the 2D phase behavior. Therefore, it does not astonish that structure motifs and intermolecular spacings of supramolecular ensembles are observed on surfaces which are known neither from the solution phase nor from the 3D solid‐state [84].

Supramolecular chemistry and selfassembly of Viologens
56
The surface can be regarded as an effective template in the course of the 2D ordering of molecular building‐blocks if enhanced adsorbate‐substrate interactions are governing the 2D phase behavior. However, surfaces are not only potential binding partners for these molecular building blocks. The surface can also act as a reactant in terms of an electron‐donor or electron‐acceptor provided an electrochemical environment is used.
In a new text book [83], Ariga and Kunitake subdivided supramolucular chemistry in three categories related to the size of the molecular target system:
(1) The molecular recognition chemistry or the chemistry associated with a molecule recognizing a partner molecule. Molecular recognition as the basis of supramolecular chemistry has been defined as “a process involving both binding and selection of a substrate by a given receptor molecule as well as possibly a specific function”. Two types of receptors are: (i) endo‐receptors are host molecules that have binding sites insides their molecular structures (inner surface) and (ii) exo‐receptors are host molecules with binding sites on their outer surfaces [83, 85].
(2) The chemistry of molecules built to specific shapes: It is possible to build molecules of medium size which have unique geometric features and provide the key to many tailored supramolecular topologies. For example, fullerenes are like “molecular soccer ball”, carbon nanotubes, etc.. One can design one‐dimensional supramolecular objects, rectangles, squares, three dimensional cages, molecular branching such as dendrimers (molecular tree), molecular rings, etc. [81, 83, 86‐90].
(3) The chemistry of molecular assembly from numerous molecules: Supermolecules can also be programmed from a huge number of components producing a supramolecular self‐assembly with a defined shape and structure. For example, supramolecular crystals, micelles, monolayers and Langmuir‐Blodgett films on the surface of water, self‐assembled monolayers on solid surfaces, etc. [83, 85, 90‐93]. Here the concept of self‐assembly is used for the spontaneous assembly of several molecules into a single, highly structured supramolecular aggregate [94]. The intermolecular interactions within supramolecules are non‐covalent and quite diversified such as:
- Electrostatic interaction occurs between charged species, is relatively strong compared to other non‐covalent interactions, and is non‐directional.
- Hydrogen bonding occurs only when the interacting functional groups are properly oriented, and is weak and directional.
- Coordinative bonding occurs between a metal ion and electron‐rich atoms, and is of moderate strength and directional.

Supramolecular chemistry and selfassembly of Viologens
57
- The van der Waals interaction is weak, non‐directional and less specific than other interactions described above, it acts between all kind of matter.
- Hydrophobic “interaction” occurs between hydrophobic molecules and is the major driving force for hydrophobic molecules to aggregate.
- π – π interactions between aromatic rings are present when the aromatic rings face each other, and the overlap of π‐electrons results in an energetic gain.
The formation of supramolecular architectures may be due to one kind of these interactions or a combination of them. By mastering these interactions, one can control the building of supramolecular architectures which have particular forms and specific functions [83]. Therefore, the development of supramolecular chemistry has opened a wide range of promising application in many fields, especially in nanotechnology [81, 82, 85, 91, 95‐100].
However, the new supramolecular chemistry as mentioned above is mostly applied and explored in solution or in 3D crystals, but not yet fully exploited in 2D. Because of the increasing demand to produce surface pattern and devices with nanometer dimensions using the promising “bottom‐up” technique, the autonomous ordering and self‐assembly of atoms and molecules on atomically well‐defined surfaces is receiving more and more attention. That is the reason why the self‐assembly of supramolecules on solid surfaces has been intensively studied only over the past few years. In addition, the invention of the scanning probe techniques has facilitated the studies because of their ability to visualize molecules in real space [84, 91].
Actually, the self‐assembly of supramolecular entities on solid surfaces can be divided into two groups:
(1) Self‐assembly of molecules on solid surfaces in ultrahigh vacuum (UHV):
- Interactions between molecules (intermolecular interactions),
- Interaction between the molecule and the substrate (adsorbate‐substrate interactions).
(2) Self‐assembly of molecules on solid surfaces at the solid/liquid interface:
- Interactions between molecules (intermolecular interactions),
- Interaction between the adsorbed molecules and the substrate,
- Interaction between the molecules and the solvent.
The self‐assembly of supramolecules on surfaces is quite complex and is a result of a delicate balance among all these interactions [101]. It can be also restricted to the monolayer regime or may extend to multilayers. The concept of self‐assembled

Supramolecular chemistry and selfassembly of Viologens
58
monolayers (SAMs) was discovered in the case of chemisorption of thiolates on gold [81]. However, it is clearly seen nowadays that self‐assembled monolayers can be formed in a wide range of systems with different supramolecules on different solid surfaces.
The present work focuses on the self‐assembly of molecules at the solid/liquid interface using viologen molecules as building blocks. The adsorption of viologens could be found to form highly ordered self‐assembled monolayer, sub‐monolayer, multilayer or even disorder phases. These structures of the viologen adsorption on copper surfaces can be controlled by changing the adsorbate‐substrate interactions, i.e. by changing the electrode potential in the case of electrostatic interaction, etc.
4.2 Viologen molecules
4.2.1 Introduction
The common name of “viologen” derives from Michaelis who noted the violet colour formed when 1,1’‐dimethyl‐4,4’‐bipyridilium underwent a one electron reduction to form a radical cation (as dimer). Then, the term “viologen” was used widely to mean a compound or salt of anion X‐ and 4,4’‐bipyridine to form 1,1’‐disubstituted‐4,4’‐bipyridine (Fig. 4.1), whatever its redox‐state. The bipyridine group has one single nitrogen atoms per ring and reveals a rotational degree of freedom along their connecting C‐C axis. Therefore, the two pyridine rings are not always coplanar but are skewed with an inter‐plane angle (dihedral angle) of certain degrees depending on their redox‐state [4].
Figure 4.1: Molecular scheme of a viologen dication, R1, R2 ligands, X‐ counter anion.
Because of the two nitrogen atoms, viologens have three redox‐states: dication, radical cation and uncharged molecules. All three common viologen redox‐states can be converted into each other in an electrochemical environment by two single electron transfer reactions (Fig. 4.2). The bipyridinium dication is the most stable of the three common redox forms, and is the usual starting material for a study.

Supramolecular chemistry and selfassembly of Viologens
59
Figure 4.2: The three common redox forms of viologens and their electron transfer reactions.
In order to understand the particular phase behavior of adsorbed viologens on the chloride modified copper surface depending on their redox‐state one has to consider in particular the intramolecular conformal changes that occur upon the charge transfer. These structural changes have been exemplarily studied for isolated viologen molecules by DFT calculations. Ab initio calculations have been performed by Hoffmann and Nagy Felsobuki [102, 103] to analyse the way electron density from the cationic centres is delocalized around the ring. They investigated the effect of the redox‐state upon the dicatonic and radical cation structure, their results implying that the bipyridinium radical cation is almost flat. By contrast, the dicaton is not planar but skewed in the ground state, exhibiting a much larger interplane angle of more than 40°. This result is presumed to be similar to a (low‐pressure) gas‐phase value since it presupposes the absence of any external forces on the molecule.
As mentioned in the “Introduction and outline” part, viologens are certainly among the most intensively studied molecular building‐blocks in supramolecular chemistry. Their solution electrochemistry is well documented in the literature [3, 4]. Certain attention was paid to the surface chemistry of viologens using standard electrochemical methods such as cyclic voltammetry (CV) [104, 105] and various spectroscopic methods, e.g. Raman spectroscopy [106‐110] or UV reflectance spectroscopy [111, 112] in order to derive information about adsorption geometries depending on the particular redox‐state. Characteristically, the reduction of pre‐

Supramolecular chemistry and selfassembly of Viologens
60
adsorbed viologen dications to the corresponding adsorbed radical mono‐cation takes place at potentials more positive than the redox‐processes of the corresponding solution species giving rise to the appearance of characteristic pre‐peaks in the CV. Their appearance has been rationalized in terms of pure kinetic effects since reaction rates are usually higher for adsorbed reactants than for the corresponding solution species [4]. For the reaction of adsorbed species no diffusion limitations are expected. This phenomenon has been demonstrated for various viologens adsorbed on Hg [105, 113, 114] and HOPG [105, 115, 116] electrodes. In the present work we focus on the surface redox chemistry and the related phase behavior of adsorbed viologens by employing not only ‘‘integral’’ methods averaging over the entire surface but also scanning tunneling microscopy (STM) as a structure‐sensitive local probe technique providing direct access to structural changes within adsorbed viologen films in the course of electron transfer reactions. The two viologens studied in this thesis are dibenzyl‐viologen (DBV) and diphenyl‐viologen (DPV).
4.2.2 DibenzylViologen (DBV)
The chemical model of DBV molecules is displayed in Fig. 4.3. The core of the molecules consist of a 4,4’‐bipyridinium group with an intramolecular distance of 0.71 nm between the nitrogen atoms, and the extra methylene group separates the phenyl groups from the central bipyridinium unit, forming two benzyl groups as outer chains. Due to the methylene groups as connectors, the outer chain of DBV molecules can bend as shown in Fig. 4.3, and the total length of isolated DBV molecules is about 1.55 nmm.
Figure 4.3: The chemical model of DBV molecules.
The quantum chemical optimization of the molecular viologen structures the density functional and ab initio programs provided by the TURBOMOLE 5.1 suite has also been done by Kirchner and Kossmann [117].

Supramolecular chemistry and selfassembly of Viologens
61
Figure 4.4: DFT based structure optimization of the isolated DBV2+, DBV•+ and the uncharged DBV0 molecules.
Fig. 4.4 displays the result of the quantum chemical structure optimization obtained for the isolated di‐cationic DBV2+, the radical mono‐cation DBV•+ and the uncharged DBV0 species in the gas phase. As expected, the DBV2+ exhibits a pronounced non‐zero interplanar dihedral‐angle between the two pyridinium rings of Φ(DBV2+) = 40.11°. However, it is reported for the solution phase that counter ions with electron donor capabilities can undergo CT (charge transfer) interactions with viologen dications leading to a significant decrease of the dihedral angle. The same trend is observed for the reduction of the isolated DBV2+ to the corresponding radical mono‐cation with a resulting dihedral angle Φ(DBV•+) = ‐5.41° (Fig. 4.4). For the uncharged DBV0 molecule the dihedral angle is close to zero with Φ(DBV0) = ‐0.11°. These changes of the intramolecular structure become obvious from a side‐view of the viologens along their main molecular axis (Fig. 4.4). All three common viologen redox‐states can be converted into each other in an electrochemical environment by two single electron transfer reactions. At least the first electron transfer process reducing the di‐cation DBV2+ to the radical mono‐cation DBV•+ is considered as reversible.
Although the C‐C bond length between the two pyridine rings in DBV•+ decreases by 4.2% during reduction, the effects of increased steric repulsion between ortho hydrogens is less than the stability gained by increasing the extent of conjugation between the two rings.
Supramolecular chemistry and selfassembly of Viologens
62
4.2.3 DiphenylViologen (DPV)
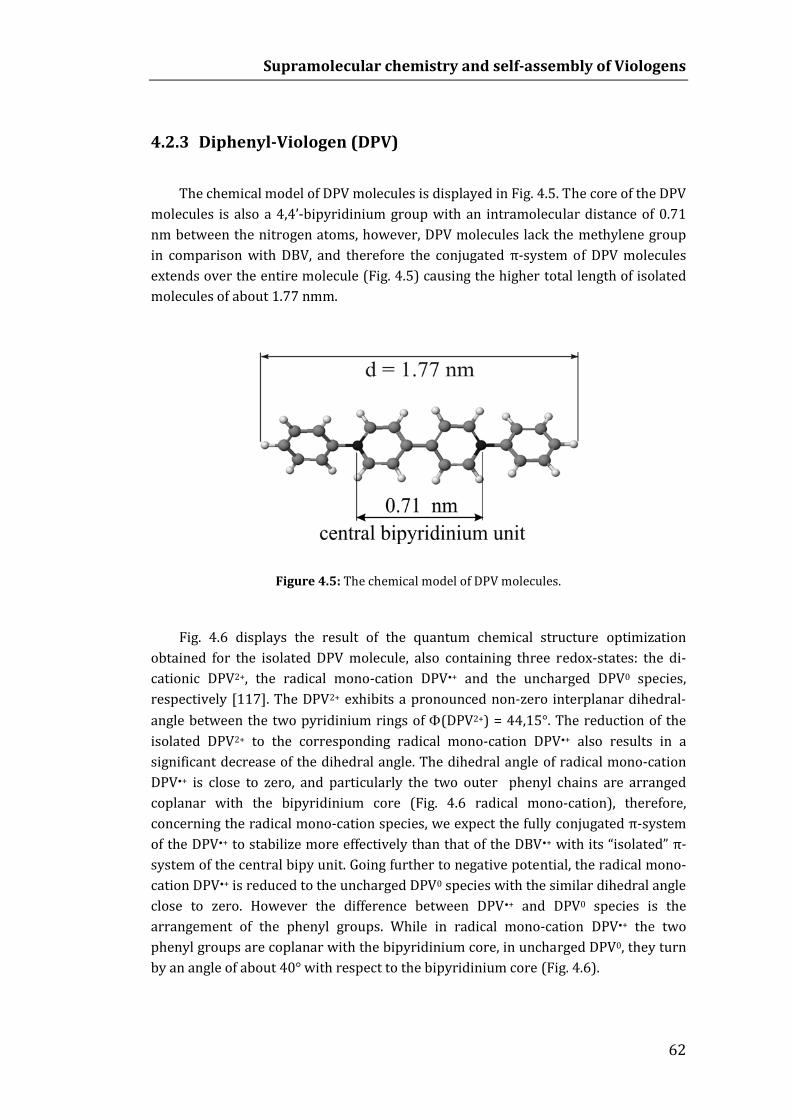
The chemical model of DPV molecules is displayed in Fig. 4.5. The core of the DPV molecules is also a 4,4’‐bipyridinium group with an intramolecular distance of 0.71 nm between the nitrogen atoms, however, DPV molecules lack the methylene group in comparison with DBV, and therefore the conjugated π‐system of DPV molecules extends over the entire molecule (Fig. 4.5) causing the higher total length of isolated molecules of about 1.77 nmm.
Figure 4.5: The chemical model of DPV molecules.
Fig. 4.6 displays the result of the quantum chemical structure optimization obtained for the isolated DPV molecule, also containing three redox‐states: the di‐cationic DPV2+, the radical mono‐cation DPV•+ and the uncharged DPV0 species, respectively [117]. The DPV2+ exhibits a pronounced non‐zero interplanar dihedral‐angle between the two pyridinium rings of Φ(DPV2+) = 44,15°. The reduction of the isolated DPV2+ to the corresponding radical mono‐cation DPV•+ also results in a significant decrease of the dihedral angle. The dihedral angle of radical mono‐cation DPV•+ is close to zero, and particularly the two outer phenyl chains are arranged coplanar with the bipyridinium core (Fig. 4.6 radical mono‐cation), therefore, concerning the radical mono‐cation species, we expect the fully conjugated π‐system of the DPV•+ to stabilize more effectively than that of the DBV•+ with its “isolated” π‐system of the central bipy unit. Going further to negative potential, the radical mono‐cation DPV•+ is reduced to the uncharged DPV0 species with the similar dihedral angle close to zero. However the difference between DPV•+ and DPV0 species is the arrangement of the phenyl groups. While in radical mono‐cation DPV•+ the two phenyl groups are coplanar with the bipyridinium core, in uncharged DPV0, they turn by an angle of about 40° with respect to the bipyridinium core (Fig. 4.6).

Supramolecular chemistry and selfassembly of Viologens
63
Figure 4.6: DFT based structure optimization of the isolated DPV2+, DPV•+ and the uncharged DPV0 molecules.
The small structural difference by the methylene groups between DBV and DPV, however, significantly affects both the viologen solution redox‐chemistry and the phase behavior of the adsorbed viologen species which are discussed in detail in the next chapters.
4.3 Viologen adsorption Traditionally, adsorption is “the taking up of one substance on to the surface of
another”. In electrochemistry, the material taken up is almost always in solution prior to adsorption, and the surface on to which the material is taken (the electrode) is usually a liquid (mercury) or a metallic solid, and the adsorbing species adhere to the substrate between the inner and outer Helmholtz planes [4].
However, in the modern supramolecular chemistry, a promising approach to direct the ordering process of supramolecular architectures takes advantage of well defined surfaces of single crystals which can act as electronic and/or geometric templates due to the presence of specific adsorbate–substrate interactions. These are modulated according to the symmetry and periodicity of the substrate surface. Whereas in solution and in the 3D solid‐state only the specific and directional intermolecular interactions govern the assembly of supramolecular architectures we find on surfaces, by contrast, a complex interplay of competing adsorbate–adsorbate

Supramolecular chemistry and selfassembly of Viologens
64
and adsorbate–substrate interactions controlling the 2D phase behavior. Therefore, it does not astonish that structure motifs and intermolecular spacings of supramolecular ensembles are observed on surfaces which are known neither from the solution phase nor from the 3D solid‐state [84]. The surface can be regarded as an effective template in the course of the 2D ordering of molecular building‐blocks if enhanced adsorbate–substrate interactions are governing the 2D phase behavior. Furthermore, surfaces are not only potential binding partners for these molecular building blocks. The surface can also act as a reactant in terms of an electron‐donor or electron‐acceptor provided an electrochemical environment is used. This applies to the adsorption of viologens on metal substrate.
However, to achieve both the right adsorption geometry and a large extent of lateral order within the organic film, one has to tune carefully the balance between adsorbate‐substrate interactions on the one hand and adsorbate‐adsorbate interactions on the other hand. These can be obtained by alternatively using anion‐modified metal surfaces as substrates in an electrochemical environment. In this case, the negative charge of the anion adlayer can enhance the viologen adsorption due to electrostatic interaction [5]. In this work, chloride is chosen as pre‐adsorption layers resulting in modified metal surface templates.
The compounds used here are highly soluble dibenzyl‐ and diphenyl‐viologen dichloride salts. It should be noted that the electron transfer processes do not necessarily take place at the bare metallic electrode surface but on the chloride modified surface. Therefore, the adsorption from aqueous chloride solutions on these metal surfaces is even more complex due to the superposition of several processes involving both “solution‐” and “surface‐limited” reactions as proposed below:
1. The first reversible transition from di‐cationic species (V2+) into their corresponding radical mono‐cations (V•+) via a one‐electron transfer step, can occur:
a. as surface limited reduction/oxidation of adsorbed viologen species according to
+•−+ ↔+ )(2
)( adsads VeV (4.1)
which might be accompanied by the subsequent dimer formation at the surface according to
++• ↔ 2)(2)( ][2 adsads VV (4.2)
or even oligomer or polymer formation at the surface according to
++• ↔ nadsnads VnV )()( ][ (4.3)
Oligomeric and polymeric reaction products tend to accumulate preferentially on the electrode surface while the dimer species often remain water soluble [3, 4].

Supramolecular chemistry and selfassembly of Viologens
65
b. as reduction/oxidation of viologen solution species according to
+•−+ ↔+ )(2
)( aqaq VeV (4.4)
which might be accompanied by the subsequent dimer formation in solution according to
++• ↔ 2)(2)( ][2 aqaq VV (4.5)
c. as film formation/dissolution of radical mono‐cation chloride salts according to
↓↔+ −+•−+•naq XVnXnV ][)( (4.6)
2. The second single electron transfer step transforms the radical mono‐cation into the fully uncharged viologen species according to:
0VeV ↔+ −+• (4.7)
This latter transition has to be considered as less reversible than the first electron transfer process [3, 4]. Furthermore, the two sequential electron transfer steps in the viologen redox‐chemistry can interfere with an additional conproportio‐nation reaction between the uncharged and the di‐cationic viologen species to the corresponding radical mono‐cation according to:
+•+ ↔+ VVV 220 (4.8)
Since the reduction from their radical cation to uncharged species is supposed to lie within the regime of massive hydrogen evolution of the copper substrate at even more negative potentials only two redox species, the dication and radical cation, have been studied within the potential window of the copper substrates. However, the potential window of the HOPG surface is much broader than that of copper. Thus, for this substrate we expect to observe both electron transfers related to consecutive reductions from dication to radical mono‐cation and to uncharged species.
4.4 Preparation method
4.4.1 Viologen adsorption on chloride modified Cu(100)
The studies of viologen adsorption on the chloride modified copper substrate presented in this thesis consist of three systems:
• “Non‐reactive” adsorption of DBV
• “Reactive” adsorption of DBV

Supramolecular chemistry and selfassembly of Viologens
66
• Adsorption of DPV
Focusing on a chloride modified template, all three systems use 10 mM HCl as supporting electrolyte. The working electrolyte is a mixture of the supporting electrolyte and soluble viologen dichloride salts. For most of the experiments the concentration of the viologen was chosen to be 0.1 mM, however the concentration of 1 mM was also used for CV experiments in order to distinguish between bulk and surface processes in CV curves. The preparation for the viologen adsorption on chloride modified Cu(100) is performed as follows.
After the initial electro‐polishing process as mentioned in Sec. 2.2.6 the copper surface was rinsed with the deoxygenated supporting electrolyte (10 mM HCl), mounted into the electrochemical cell and fixed into the STM unit which is placed in the aluminum chamber filled with Ar gas. The electrochemical cell was then filled with the 10 mM HCl by the electrolyte supply system (see Fig. 2.6) and the electrode was kept under potential control by the bipotentiostat. In order to check the quality of the copper surface, CVs and some STM images were recorded. Within the double layer regime chloride specifically adsorbs and forms a monolayer on the copper surface as shown in Sec. 3.4.2. When the quality of the chloride modified surface was affirmed, the supporting electrolyte was replaced by the working electrolyte containing viologen molecules which was also deoxygenated before use.
The potential where the working electrolyte exchanges the pure supporting electrolyte to initiate the viologen adsorption is called the initial potential. For the system of DBV “non‐reactive” adsorption, the initial potential was chosen in the double layer or unreactive regime (from E = 0 to 100 mV vs. RHE). On the other hand, for the system of DBV “reactive” adsorption, the initial potential was chosen within the reduction peak P1 (transforming dication DPV2+ into the corresponding radical mono‐cation DPV•+ species) from E = ‐130 to ‐250 mV vs. RHE (see Fig. 5.2).
4.4.2 DBV adsorption on HOPG
Although there is no pre‐adsorption of halide on HOPG, the pure supporting electrolyte of 10 mM HCl was still used in order to unify the experimental conditions of DBV adsorption. The working electrolyte is a solution of 0.1 mM DBV in supporting electrolyte.
The electrochemical characterization of the viologens was also done by the use of an inert HOPG electrode. Since anions do not specifically adsorb on HOPG, the redox‐chemistry of organic molecules can be studied in the absence of adsorbed anion layers. Furthermore, HOPG offers a potential window of ‐500 to 2200 mV vs. RHE that is significantly broader than that of the potential window of copper surfaces, thus allowing to study redox processes at even more positive potentials than accessible

Supramolecular chemistry and selfassembly of Viologens
67
with copper as electrode material. HOPG is simply prepared by peeling off graphite layers using an adhesive tape. After introducing HOPG into the electrochemical cell and to the aluminum chamber, the cell was filled with the supporting electrolyte and the reference CVs were then recorded. After the supporting electrolyte was replaced by the working electrolyte, CVs were also recorded to characterize some electrochemical properties of viologens and STM can then be applied to image the surface’s sample.

Part III
“Nonreactive” adsorption of Viologens
– Results and discussion

69
Chapter 5
DBV adsorption on chloride modified Cu(100) and on HOPG
5.1 Introduction
This chapter characterizes the adsorption behavior and surface redox‐chemistry of DBV2+ that is adsorbed on an chloride modified Cu(100) electrode surface under non‐reactive condition.
For this not only the cyclic voltammetry method averaging over the entire surface and the bulk solution is employed, but also STM as a structure‐sensitive local probe technique providing direct access to structural changes within adsorbed viologen films in the course of electron transfer reactions.
As mentioned in the previous general part, there are three redox‐states of DBV molecules: the dication DBV2+, the radical mono‐cation DBV•+ and the uncharged DBV0. In normal form or in open circuit condition, DBV molecules exist as dicationic DBV2+ species even in solid salt form or in the electrochemical electrolyte. It was proven in the literature [4] that the standard electrode potentials are of E0(DBV2+/ DBV•+) = ‐330 mV vs. RHE and E0(DBV•+/DBV0) = ‐548 mV vs. RHE for the first and the second electron transfer step, respectively. Therefore within the potential window of copper (about ‐450 to 250 mV), the first reduction of di‐cationic DBV2+ to the corresponding radical mono‐cationic DBV•+ species takes place, the second reduction can occur within the HER regime of copper substrate. Because of the massive hydrogen evolution reaction, the STM is not able to image the adsorption of uncharged DBV0 species, however for the first reduction, it is important to notice that the structures of the DBV adsorption layer depends strongly on the initial potential where the DBV2+ containing electrolyte is filled into the electrochemical cell. In this chapter, all adsorption experiments were performed under “non‐reactive” potential conditions, i.e. the DBV2+ containing electrolyte was exposed at a double layer potential around 0 mV, far away from the DBV2+ reductive reaction regime.

DBV adsorption on chloride modified Cu(100) and on HOPG
70
5.2 Electrochemistry
5.2.1 CV of Cu(100) in DBV containing acidic solution
Figure 5.1: Black dotted curve: CV in the pure supporting electrolyte (10 mM HCl). Grey curve: CV of Cu(100) in the DBV2+ containing electrolyte (10 mM HCl, 0.1 mM DBVCl2), dE/dt = 10 mV s‐1.
Fig. 5.1 shows representative steady‐state CVs of Cu(100) in the absence (black dotted curve) and the presence (grey curve) of viologen species. The potential window of the Cu(100) electrode in the pure supporting electrolyte (10 mM HCl) is limited by two chemical reactions, the oxidative copper dissolution reaction (CDR) at the anodic limit and the reductive hydrogen evolution reaction (HER) at the cathodic limit.
After exchanging the pure supporting electrolyte for the one containing the redox‐active DBV2+ species we observe drastic changes in the CV curve. The presence of the DBV2+ layer has impact also on the oxidative copper dissolution and the reductive copper deposition, i.e. the on‐set potential of the dissolution reaction is shifted to higher potentials. However, this blocking effect is much less pronounced than that at the HER regime where there is a considerable shift of the HER (ΔE ≈ ‐140 mV) towards lower potentials pointing to a pronounced inhibiting effect of viologens on the HER. Apparently, viologens are still present at the surface under these reductive conditions thereby blocking reactive sites for the HER such as substrate steps. If it is supposed that the DBV2+ exists as adlayer in the regime of copper

DBV adsorption on chloride modified Cu(100) and on HOPG
71
dissolution/redeposition and transforms into the corresponding radical mono‐cation DBV•+ in the HER regime (see Secs. 5.3, 5.4), it can be concluded that 2D films of reduced viologen species block the copper substrate steps as the reactive sites for the hydrogen reduction/reoxidation reaction even more effective than the di‐cationic species. It will be shown later that this is consistent with the molecular packing density of the respective layers.
A further deviation from the CV of the pure supporting electrolyte concerns the appearance of several anodic and cathodic current waves at potentials close to the HER regime. These additional current features have to be assigned to viologen‐related redox processes. Typically, the shape of the CV in the presence of the viologen species depends strongly on the chosen cathodic potential limit. A precise correlation of the cathodic to the respective anodic current waves in the reverse potential scan is achieved by a systematic variation of the cathodic potential limit as shown in Fig. 5.2.
Figure 5.2: Appearance of anodic and cathodic current waves in the CV of Cu(100) in the DBV2+ containing electrolyte upon changing the cathodic potential limit
Figure 5.3: (a) Set of anodic potential sweep curves after holding the potential at E = ‐425 mV for 1 to 4 min, (b) Set of anodic potential sweep curves after holding the potential at E = ‐475 mV for 1 to 6 min, respectively.

DBV adsorption on chloride modified Cu(100) and on HOPG
72
By restricting the cathodic potential limit to E = ‐330 mV only the small peak pair P1/P’1 (P1max = ‐290 mV, P’1max = ‐260 mV) appears in the CV (CV2 in Fig. 5.2). Extending the potential limit further to E = ‐410 mV causes the appearance of P2/P’2 (P2max = ‐380 mV, P’2max = ‐318 mV, CV4 in Fig. 5.2) revealing a slightly greater hysteresis of ΔE = 62 mV than for peak pair P1/P’1. If the cathodic potential limit exceeds a critical value E = ‐430 mV we initiate not only the HER but also a further process related to the viologen redox‐chemistry which is represented by P3. With the presence of P3, peak P’1 increases in line with the shift of the cathodic potential limit (CV5–7 in Fig. 5.2). Besides the potential hysteresis there is also another remarkable difference between P1/P’1, P2/P’2 on the one hand and P3 on the other hand as demonstrated in Fig. 5.4. In this experiment the potential scan was stopped in the cathodic potential sweep at E = –425 mV after passing P1 and P2 (Fig. 5.3a) and at P3, E = ‐475 mV (Fig. 5.3b), respectively. After a well defined hold‐time at these potentials only the anodic potential scans were recorded. Obviously, there is no dependence of P’1 and P’2 on the potential hold time at E = ‐425 mV since all 4 curves (thold= 1–4 min) in Fig. 5.4a are identical. In contrast to that P’1 shows a strong dependence on the hold time at E = ‐475 mV (Fig. 5.3b). Peak height and the FWHM (full width at half maximum) increase with increasing hold time at E = ‐475 mV. Furthermore the peak maximum of P’1 is shifting towards higher potentials with increasing hold time. Now arises the question which reactions or processes relate to the peaks P1/P1’, P2/P2’, P3 and where the P’3 is.
The set of equations (from Eq. 4.1 to 4.6) describing the superposition of several processes involving “solution‐” as well as “surface‐limited” reactions now can be assigned more in detail for this system to:
1. The surface limited reduction/oxidation of pre‐adsorbed viologen species according to:
( ) ( )+•−+ ↔+ ads
2ads DBVDBV e (5.1)
( ) [ ] ( )++• ↔ 2 ads 2ads DBVDBV 2 (5.2)
or even an oligomer or polymer formation at the surface according to
( ) [ ] ( )++• ↔ n
ads nads DBVDBVn
(5.3)
2. The reduction/oxidation of viologen solution species according to:
( ) ( )+•−+ ↔+ aq
2aq DBVDBV e
(5.4)
which might be accompanied by the subsequent dimer‐formation in solution according to:

DBV adsorption on chloride modified Cu(100) and on HOPG
73
( ) [ ] ( )++• ↔ 2 aq 2aq DBVDBV 2
(5.5)
3. The film formation/dissolution of radical mono‐cation chloride salts according to:
( ) [ ] ↓↔+ +•−+•n
-aq Cl DBVCln DBVn
(5.6)
4. The second single electron transfer step transforms the radical mono‐cation into the fully uncharged viologen species according to:
( ) ( )0aqaq DBVDBV ↔+ −+• e (5.7)
It is known that the redox processes of solution DBV2+ on Cu(100) interfere with the redox processes of the preadsorbed species and related surface phase transitions. However, extra “prepeaks” that appear at potentials more positive than the main redox‐current waves are not observed in this particular case. For example, spike‐like prepeaks were reported for various dialkylated viologens interacting with Hg[105, 113, 114] or highly oriented pyrolytic graphite (HOPG)[105, 115, 116] electrode surfaces. This phenomenon was explained in terms of a Faradaic process of adsorbed viologen species coupled with 2D phase transitions between gaslike adsorption phases of the oxidized and more condensed 2D films of the corresponding reduced viologen species. The involvement of redox processes of solution species in the observed peak system P1/P1’ can be clearly proven by concentration‐dependent CV measurements. Peak current densities of P1/P1’ scale up almost linearly with the viologen concentration in solution as predicted by the Randles‐Sevcik equation [1] (Eq. 5.8).
10
2/12/12/1
44.0 −⎟⎠⎞
⎜⎝⎛−= AcD
RTnFnFJ p ν
(5.8)
where Jp is the peak current density, D the viologen diffusion coefficient, ν the potential sweep rate, c0 the viologen concentration in the bulk solution, A the area of the electrode surface, T the temperature, n the number of transferred electrons, F the Faraday constant, and R the gas constant.
Fig. 5.4 displays the concentration dependence of the peak pairs P1/P1’ and P2/P2’. As long as we restrict the cathodic potential limit in the CV experiment to potentials of E > ‐425 mV, we only have to deal essentially with the first electron‐transfer step of the viologen redox system, the quasi‐reversible reduction of the dications (DBV2+) to the radical monocations (DBV•+), and the corresponding oxidation reaction (Eq. 5.1).

DBV adsorption on chloride modified Cu(100) and on HOPG
74
Figure 5.4: (a) CVs of Cu(100) in 10 mM HCl/0.1 mM DBVCl2 (black line) and Cu(100) in 10 mM HCl/1 mM DBVCl2 (grey dashed line), dE /dt = 10 mV s‐1, (b) CVs of Cu(100) in 10 mM HCl/0.1 mM DBVCl2 (black line) and Cu(100) in 5 mM H2SO4/10 mM KBr/0.1 mM DBVCl2 (grey dashed line), dE /dt = 10 mV s‐1. The inset shows the linear dependence of the peak current of P2/P2’ on the potential sweep rate.
By increasing the viologen concentration by a factor of 10 in Fig. 5.4a, we noted an increase in the peak maximum of P1 from JP1 = ‐0.13 μA/cm2 (black curve) to JP1 = ‐1.1 μA/cm2 (gray dashed curve). The concentration dependence of P1/P1’ indicates the dominance of bulk solution redox processes in the voltammetric behavior in the 10 mM HCl/1 mM DBVCl2 solution. Therefore, we assign the peak system P1/P´1 to the reduction of di‐cationic DBV2+ from solution to the corresponding radical mono‐cationic DBV•+ species. Due to different conditions of the RHE reference electrodes the CVs reported here are shifted by ‐40 mV compared to those presented in reference [4].
At this point, it should be noted that the peak heights of P2/P2’ are almost independent of the viologen concentration in solution. In the CV obtained for the 10 mM HCl/1 mM DBVCl2 solution P2/P2’ appears only as a small shoulder at the “cathodic” tail of the peak system P1/P1’. The peak positions of P2/P2’ are slightly downward shifted in the 10 mM HCl/1 mM DBVCl2 solution by about ΔE ≈ 15 mV. As it will be argued below we can attribute this effect to the slight increase of the chloride concentration (note that the DBV2+ is added as chloride salt to the solution). The use of even higher viologen concentrations, for example 10 mM HCl/10 mM DBVCl2, leads to a complete suppression of the peak system P2/P2’ due to the dominance of P1/P1’. In the following, we will discuss in detail the origin of the peak system P2/P2’. In particular, it will be demonstrated that these current waves do not correspond to the redox processes of any adsorbed or solution DBV species but to a quasi‐reversible order‐disorder transition coupled with chloride desorption
DBV adsorption on chloride modified Cu(100) and on HOPG
75
/adsorption processes through a condensed viologen monolayer film. A first experimental hint supporting this idea comes from a comparison of the voltammetric behavior of DBV in chloride and bromide containing electrolytes (Fig. 5.4b). Although bromide anions also form a c(2 x 2) adlayer on Cu(100) [57, 77, 78], the Cu‐Br bond is stronger, and the bromide anions desorb from the electrode surface at more negative potentials [57]. While chloride desorption in 10 mM HCl starts already at E ≈ ‐300 mV (Fig. 5.1), bromide desorption takes place at potentials E < ‐350 mV, which is already within the regime of massive hydrogen evolution. Note that the observed downward shift of the bromide desorption potential is not only due to the stronger copper‐halide interaction but it is also further promoted by the weaker trend toward solvation in the case of bromide compared to that of chloride anions. Assuming that P2/P2’ (black curve in Fig. 5.4b) indeed involve chloride desorption/adsorption and related order/disorder transitions of the c(2 x 2) adlayer and following the reasoning above we would not expect such a pair of peaks for the bromide containing electrolyte, at least within the given potential range. The CV obtained for the bromide containing solution (grey dashed curve in Fig. 5.4b) reveals only the peak pair P1/P1’ that corresponds to the electron‐transfer reaction and there is no peak pair P2/P2’ pointing to bromide desorption/ readsorption and related order‐disorder transitions. Interestingly, the peak maxima of P1 and P1’ are almost at the same potentials as those in the chloride containing electrolyte suggesting that in this particular case there is no significant impact of the nature of the halide counterion on the DBV redox potentials. This kind of anion effect on the viologen redox potentials is well known, for instance, from anions revealing electron donor capabilities [3, 4, 118]. A further observation pointing to a chloride desorption/adsorption process is the slight downward shift of P2/P2’ by ΔE ≈ 15 mV when the chloride concentration is increased upon changing the DBV solution concentration. The inset in Fig. 5.4b indicates a linear dependence of the peak current density of P2/P2’ on the potential sweep rate also suggesting that P2/P2’ is most likely related to a surface process. Typically, the peak position of P2 is less affected by the sweep rate (dE/dt) than that of P2’. By increasing (dE/dt) from 5 to 150 mV/s, we observe a downward shift of only 12 mV for P2 while P2’ reveals an upward shift of about 70 mV, suggesting that the latter process is even more hindered than the one represented by P2 (the graph not shown here).
A further electron‐transfer reaction is not expected for the potential regime where P2/P2’ appears in the CV. This becomes obvious from a comparison of CVs of Cu(100) in 10 mM HCl/1 mM DBVCl2 obtained for two different cathodic limits (Fig. 5.5). Only if we decrease the cathodic potential limit, for example, from E = ‐395 mV (black curve in Fig. 5.5) to E = ‐630 mV (grey dashed curve in Fig. 5.5), we initiate the second electron‐transfer reaction (see Eq. 5.7) that can be correlated with the appearance of P3 at E = ‐440 mV (cathodic sweep). The current features in the corresponding anodic potential sweep appear more complex.

DBV adsorption on chloride modified Cu(100) and on HOPG
76
Figure 5.5: CVs of Cu(100) in 10 mM HCl/1 mM DBVCl2, dE /dt = 10 mV s‐1.
The CV in high concentration of DBV containing electrolyte in Fig. 5.5 interestingly reveals the peak P3’ which appears very close to the chloride readsorption surface peak P’2 (see Fig. 5.4a). By increasing the concentration, the intensity of the solution peak system P3/P’3 increase while the surface peak system P2/P’2 of the chloride desorption process remains unchanged, indicating that the peak P’3 is concealed by P’2 for the low concentration CVs (Fig. 5.2). The peak system P3/P’3 corresponds to the reoxidation of the uncharged species to the corresponding radical monocations (Eq. 5.7). The huge peak P1’ has been assigned to the oxidation of the radical monocations from the (DBV•+ + Cl‐)n precipitate that is most likely formed upon the conproportionation reaction between the uncharged DBV0 formed below E = ‐440 mV and the dicationic DBV2+ solution species [3, 4]. Recent experiments evidenced that at potentials below E = ‐475 mV a colored film appears at the surface, most likely due to the precipitation of the radical mono‐cationic chloride salt (Eq. 5.6) as a consequence of massive reduction of DBV solution species (Eq. 5.4). Hence, the increasing of P’1 of CV5‐7 in Fig. 5.2 might be associated with the oxidation of that film.

DBV adsorption on chloride modified Cu(100) and on HOPG
77
5.2.2 CVs of HOPG in DBV containing acidic solution
The HOPG potential window regime extends broadly from about ‐800 mV to +2300 mV. Since the reduction and oxidation processes of dicationic DBV2+ and radical mono‐cationic DBV•+ species take place within the copper potential window regime (from about ‐500 mV to +200 mV) in this part we focus on CV current waves of the DBV redox behavior on HOPG in comparison with those on Cu(100). All CVs are kept at anodic potential limit of 150 mV despite the very broad potential window of HOPG substrate because there are no DBV redox processes at potentials higher than that limit.
Figure 5.6: Appearance of anodic and cathodic current waves in the CV of HOPG in a DBV2+ containing electrolyte (10 mM HCl, 0.1 mM DBVCl2) upon changing the cathodic potential limit, dE/dt = 10 mV s‐1

DBV adsorption on chloride modified Cu(100) and on HOPG
78
The measurement started with the 10 mM HCl supporting electrolyte, then the 10 mM HCl/0.1 mM DBVCl2 solution was added (the concentration of DBV was chosen the same as in the copper case). After exchanging the pure supporting electrolyte for the one containing the redox‐active DBV2+ species we observe drastic changes in the CV curve. Typically, the shape of the CV in the presence of the viologen species depends strongly on the chosen cathodic potential limit. A precise correlation of the cathodic to the respective anodic current waves in the reverse potential scan is achieved by a systematic variation of the cathodic potential limit as shown in Fig. 5.6.
The CV4 and CV6 in Fig. 5.6 have quite similar shapes and peak pair potentials to the corresponding CVs of the Cu(100) substrate in Fig. 5.2. Therefore, we assume that similar to the Cu(100) substrate, the peak pair system P1/P’1 relates to the reduction of di‐cationic DBV2+ to the corresponding radical mono‐cationic DBV•+ species and the reverse reoxidation, and peak pair P3/P’3 corresponds to the reduction of the radical monocations to the uncharged species and the reverse reoxidation. Moreover, the huge peak P1’ in CV6 has been also assigned to the oxidation of the radical monocations from the (DBV•+ + Cl‐)n precipitate that is most likely formed upon the conproportionation reaction between the uncharged DBV0 formed and the dicationic DBV2+ solution species (like in Fig. 5.5). Noted that HOPG is an inert surface, chloride cannot adsorb to form an anion adlayer as in the case of Cu(100), thus it does not exist the peak pair P2/P’2 of chloride desorption/readsorption in the CVs of HOPG substrate.
However, CVs of DBV on HOPG appear more complex than in the case of the copper surface. By restricting the cathodic potential limit to E = ‐240 mV, the potential within the double layer regime of DBV on copper, the CV2 on HOPG shows a small peak pair P4/P’4 (P4max = ‐193 mV, P’4max = ‐120 mV) with the potential hysteresis of ΔE = 73 mV. The CV2 also reveals a new oxidation peak P’5 whose pair peak will appear more obvious after sweeps to more cathodic potentials. The presence of peak pair P4/P’4 and P5/P’5 was not observed on the copper substrate. The underlying processes are not understood yet. Even the STM results in the last part of this chapter do not help in interpreting these processes. Therefore, in the framework of this thesis, the origin of these two pair peaks remains still unknown.
Extending the potential limit further to E = ‐410 mV causes the appearance of P1/P’1 (CV4 in Fig. 5.6). As mentioned above, the peak pair corresponds to the reduction of di‐cationic DBV2+ to the corresponding radical mono‐cationic DBV•+ species and the reverse reoxidation because of its similarity to the case of the copper substrate. It also has the P’1max = ‐260 mV, however P1max is at more negative potential, i.e. ‐320 mV, in spite of ‐290 mV on copper, indicating the weaker interaction of DBV to the inert HOPG substrate. At this cathodic potential limit, the peak pair P5/P’5 appears completely with P5max = ‐41 mV, P’5max = ‐12 mV in CV4 of

DBV adsorption on chloride modified Cu(100) and on HOPG
79
Fig. 5.6. Due to the fact that the peak pair does not always appear in every CV measurements, the origin of the peak pair P5/P’5 is still unclear.
In a more cathodic scan, reaching close to HER on HOPG, the CV6 reveals the peak pair P3/P’3 similar to the copper substrate with the exact value P3max = ‐466 mV which is very close to that on Cu(100). Therefore, the peak P3 is also assigned to the second reduction of DBV from the radical cation DBV•+ species to the uncharged DBV0 molecules. Notice that on Cu(100) the small oxidation peak P’3 is superimposed on the chloride readsorption peak P’2 causing an unclear appearance, on the other hand on HOPG the P’3 appears clearly (without the presence of P’2) with P’3max = ‐325 mV.
Figure 5.7: Appearance of anodic and cathodic current waves in the CV of HOPG in the DBV2+ containing electrolyte upon changing the cathodic potential limit.
Repeating the experiment by stopping the cathodic potential scan after passing P3 (chosen value E = ‐490 mV), and then changing the hold‐time, the same trend is observed similar to that in the case of the copper surface. Peak heights and the FWHMs (full width at half maximum) of both P’3 and P’1 increase with increasing hold time at E = ‐490 mV. And the peak maximum of these two peaks is also shifting towards higher potentials with increasing hold time simultaneously. Thus, one can conclude that the massive reduction of DBV•+ species to DBV0 forming a thick colored film of an adsorbed multilayer can not only take place on an active copper substrate but also on an inert substrate like HOPG.

DBV adsorption on chloride modified Cu(100) and on HOPG
80
5.3 Structural determination
Following the discussions in the previous part, the electrochemical
characteristics of DBV adsorption on Cl modified Cu(100) can be divided into four regimes within the Cu potential window. They are listed below according to the potential from positive to negative regimes:
1. The adsorption of the dication DBV2+ at the CDR where the Cu dissolution reaction takes place causing the change of surface morphology.
2. The adsorption of dicationic DBV2+ on the Cl modified Cu(100) template at the potential regime from CDR until reaching P1 (reduction peak transforming the dication DBV2+ into the radical cation DBV•+ species), where STM images show a so‐called cavitand phase.
3. The adsorption of radical cations DBV•+ on the Cl modified Cu(100) template at the potential regime after passing P1 until reaching P2 (chloride desorption process), where STM images reveal a stripe phase.
4. The adsorption of an amorphous radical cation DBV•+ phase on the Cl modified Cu(100) template at the potential regime after passing P2 to further negative potential at HER.
Each regime has its own characteristics of redox behavior and structural surface morphology. Within the boundaries of these regimes they reveal changes of structures or phase transitions. The adsorption structures of DBV species at these regimes will be described in the following sub‐parts and the phase transitions among these structures will be then discussed in the next part.
5.3.1 Cavitand phase
The exposure of a chloride‐modified Cu(100) surface to the DBV2+ containing electrolyte within the double‐layer potential regime leads instantaneously to the adsorption and subsequent lateral ordering of DBV2+ species at the surface. Surface morphology and molecular structure in the presence of DBV are displayed in Fig. 5.8. Obviously, the DBV phase has no significant impact on the surface morphology which remains governed by the interaction of the specifically adsorbed chloride anions with the underlying copper lattice. In the presence of the DBV2+ adlayer the copper steps are still oriented parallel to the substrate [100] directions and thus parallel to the main symmetry axes of the chloride c(2 x 2) phase (Fig. 5.8a). The DBV adlayer occurs in two mirror‐domains denoted as I and II and each domain forms a “checker‐board” structure (Fig. 5.8a).

DBV adsorption on chloride modified Cu(100) and on HOPG
81
The structure of the DBV adlayer was investigated and described in detail in the doctoral thesis of C. Zörlein [5]. It can be summarized as follows.
Four DBV2+ molecules build up one single square‐shaped molecular assembly with a cavity in the center. Therefore, the structure has been called “cavitand” phase. Occasionally, some isolated molecular assemblies consist of only three (arrow in Fig. 5.8b) instead of four of these rod‐shaped subunits. Even single subunits can occasionally be observed within the DBV2+ adlayer.
Figure 5.8: Surface morphology and surface structure of Cu(100) in the presence of DBV , (a) It = 0.25 nA, Ub = 174 mV, E = ‐135 mV; (b) It = 0.1 nA, Ub = 390 mV, E = 0 mV.
The structural relation of the DBV adlayer to the chloride lattice underneath could be achieved by a careful variation of the tunneling conditions. While under moderate tunneling conditions (high bias voltage, low tunneling current) the covering viologen film is imaged, the underlying chloride lattice becomes visible by applying more drastic tunneling conditions (low bias voltage, high tunneling current). In this latter case the tunneling tip penetrates into the organic film which leads to the local removal of viologen molecules upon scanning. These kinds of experiments suggest an interaction between the viologen film and the chloride lattice which is weaker than the chemisorptive Cu‐Cl interaction. Note, the chemisorbed chloride layer cannot be removed by the tunneling tip. And the graphical superposition of two STM images showing the cavitand structure of the DBV film and the chloride lattice underneath is presented in Fig. 5.9a,b. With the c(2 × 2)‐Cl phase serving as internal calibration lattice the DBV unit‐cell can be described either by a transformation matrix according to
⎟⎟⎠
⎞⎜⎜⎝
⎛⎟⎟⎠
⎞⎜⎜⎝
⎛=⎟⎟
⎠
⎞⎜⎜⎝
⎛
Cl
Cl
vio
vio
ba
2772
ba

DBV adsorption on chloride modified Cu(100) and on HOPG
82
or in Wood‐notation by a (√53 × √53)R15.9° unit‐mesh with lattice constants of | | = | | = 2.6 nm ± 0.02 nm enclosing an angle of 90° ± 2° (see model in Fig. 5.9c). Alternatively, the two‐dimensional DBV array can be directly related to the copper substrate assuming a (√106 × √106)R29.05° unit‐mesh or a matrix transformation according to
⎟⎟⎠
⎞⎜⎜⎝
⎛⎟⎟⎠
⎞⎜⎜⎝
⎛=⎟⎟
⎠
⎞⎜⎜⎝
⎛
Cu
Cu
vio
vio
ba
5995
ba
This results in a DBV surface coverage of Θ = 0.075ML with respect to the intermediate chloride c(2 x 2) layer or Θ = 0.0375 ML with respect to the copper substrate.
Figure 5.9: (a) “Transparent” superposition of the atomically resolved chloride lattice with the DBV adlayer, (5.6 nm)2; (b) circular chirality of the DBV cavitand ensemble indicated by the white arrow; the white grid represents the chloride lattice, (3.1 nm)2, It = 0.25 nA, Ub = 86 mV, E = +50 mV; (c) tentative structure model of the cavitand phase reflecting the STM imaging contrast [5].
The cavitand phase structure model explains the unit cell of the DBV adlayer with respect to the lattices underneath and even predicts the chirality of the DBV cavitand ensembles which was actually proved by STM observations. However, following the structure model (Fig. 5.9c) one can see that the space between cavitand ensembles is large enough to absorb more species. And as reported by Zörlein, apart from this cavitand‐like structure motif, STM images sometimes show further visible
DBV adsorption on chloride modified Cu(100) and on HOPG
83
satellite spots between the cavitands which, however, appear only under certain tunneling conditions and their origin is still under discussion. One reasonable explanation assumes further adsorbed DBV species residing in different adsorption sites and geometries than those constituting the cavitand ensemble. An alternative interpretation assumes a further co‐adsorption of anions and/or water molecules within the viologen layer as origin of the satellite spots in the STM experiment. The aim of the following explanations is to answer this question.
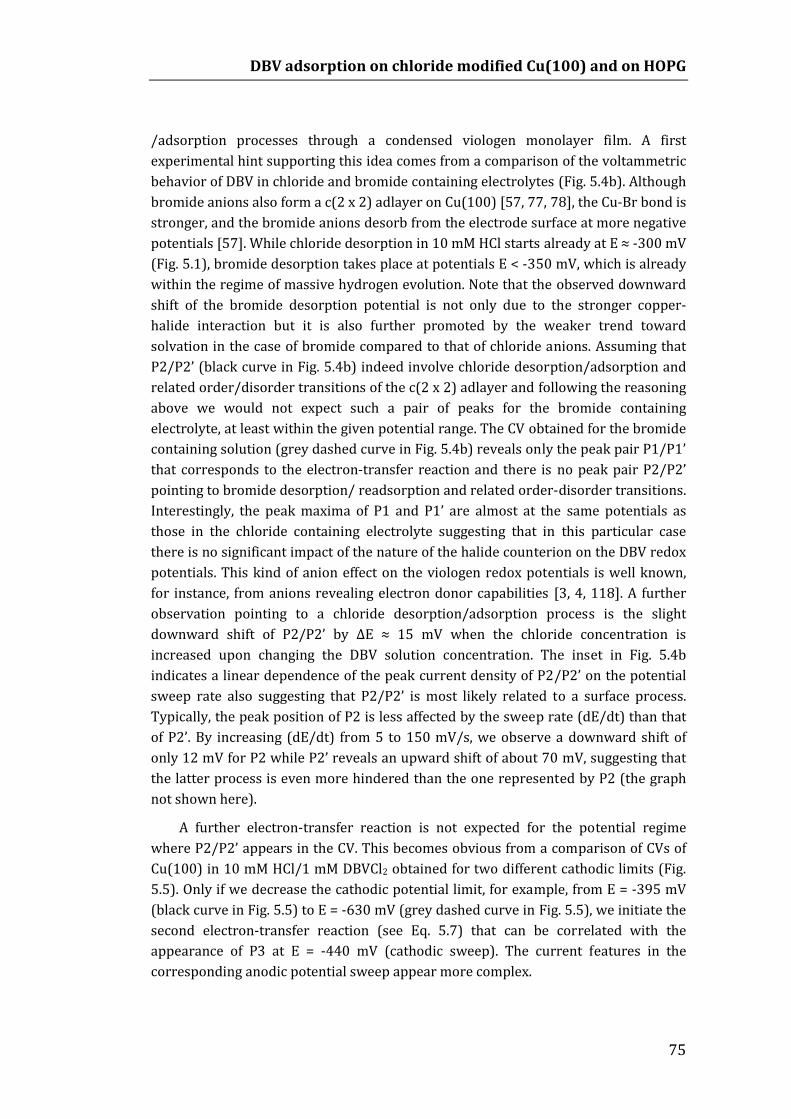
Figure 5.10: Cavitand DBV phase adsorbed on the c(2 x 2)‐Cl/Cu(100) surface: (a)‐(c) It = 1.1 nA, Ub = 350 mV, E = ‐150 mV.
Most of the STM measurements were carried out under normal tunneling condition showing the cavitand phase as seen in Fig. 5.8 which agrees with the structure model in Fig. 5.9c. However, under different tunneling condition or in some specific cases, STM images reveal some different structures. As one such example, Fig. 5.10 shows STM results of a cavitand DBV2+ phase with different resolutions. As we can see, besides the cavitand‐like ensembles marked by 4 white lines in Fig. 5.10c, there are also other ordered adsorbed species (satellites) marked by black lines. From this STM result, the satellites look a little bit different from DBV molecules concerning their size and brightness. The following STM images, however, will prove that these satellites are also DBV molecules.
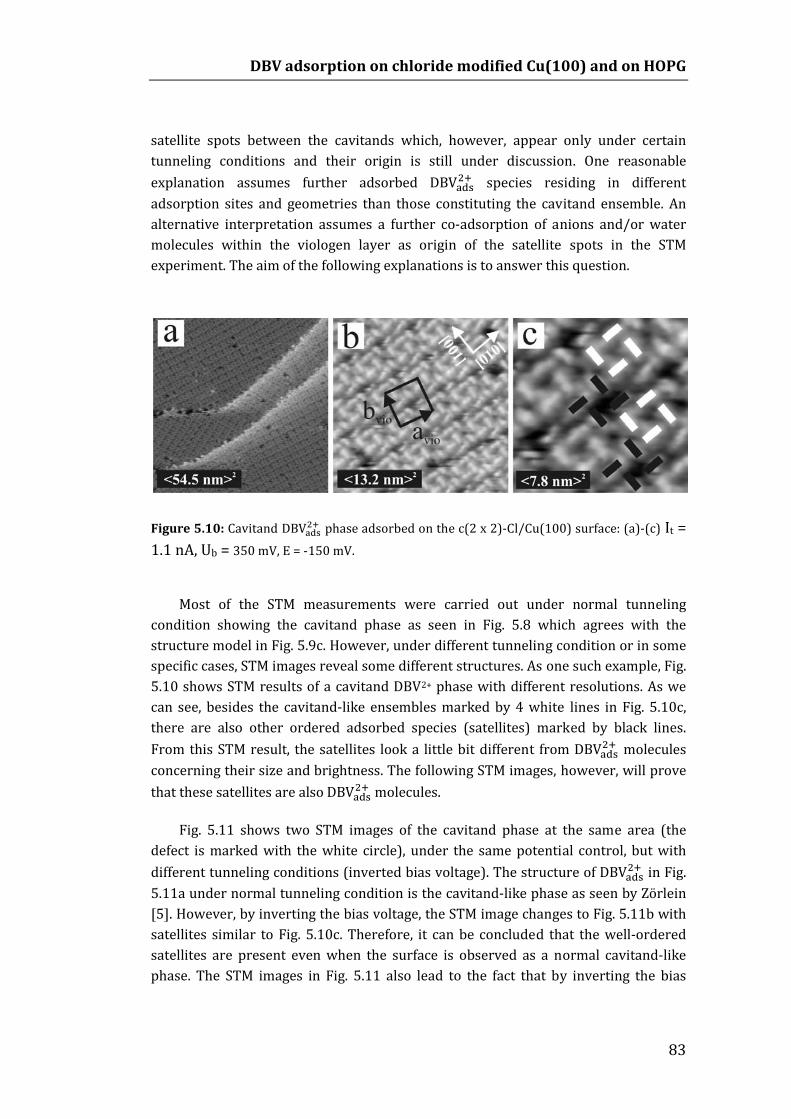
Fig. 5.11 shows two STM images of the cavitand phase at the same area (the defect is marked with the white circle), under the same potential control, but with different tunneling conditions (inverted bias voltage). The structure of DBV in Fig. 5.11a under normal tunneling condition is the cavitand‐like phase as seen by Zörlein [5]. However, by inverting the bias voltage, the STM image changes to Fig. 5.11b with satellites similar to Fig. 5.10c. Therefore, it can be concluded that the well‐ordered satellites are present even when the surface is observed as a normal cavitand‐like phase. The STM images in Fig. 5.11 also lead to the fact that by inverting the bias
DBV adsorption on chloride modified Cu(100) and on HOPG
84
voltage, some of the molecules on the metal surface can be imaged inversely due to the electronic interaction between their orbitals and the STM tip.
Figure 5.11: Structure of cavitand phase under different tunneling conditions, E = +10 mV, a) It = 0.3 nA, Ub = ‐197 mV; b) It = 0.4 nA, Ub = +170 mV,
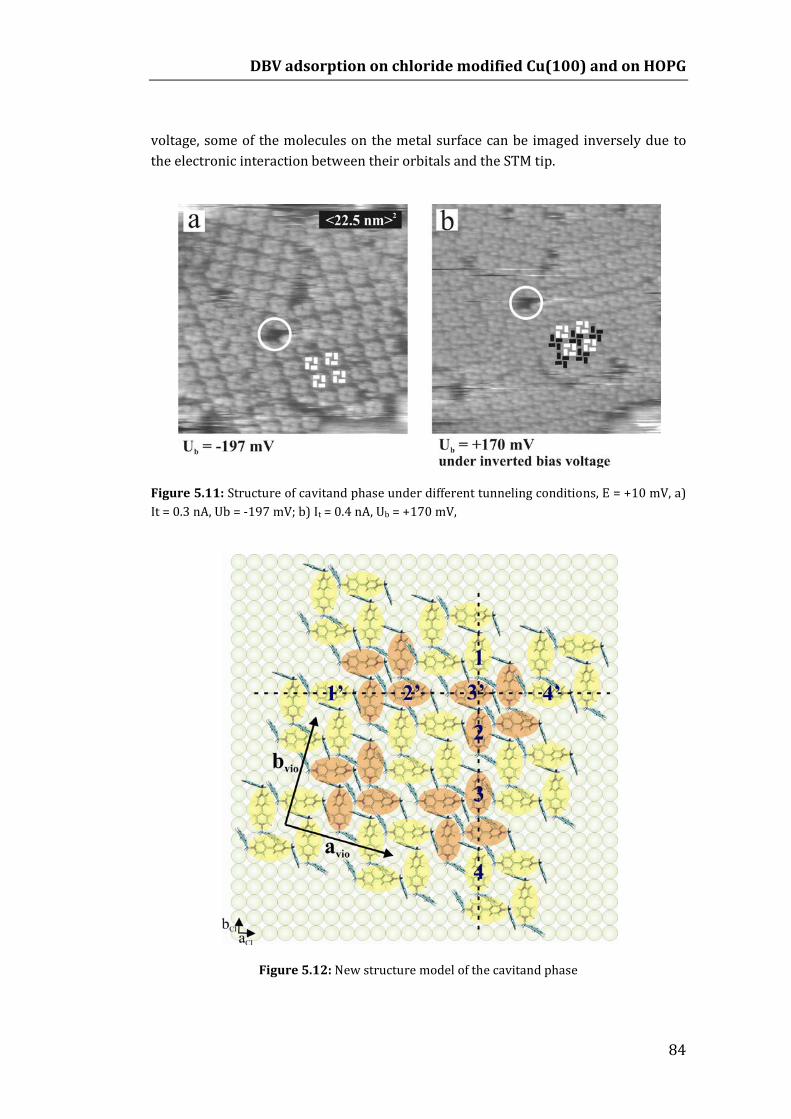
Figure 5.12: New structure model of the cavitand phase

DBV adsorption on chloride modified Cu(100) and on HOPG
85
With the new structure of DBV adsorbed on c(2 x 2)‐Cl/Cu(100) which has been seen in Figs. 5.10 and 5.11b, a new structure model is proposed as shown in Fig. 5.12. This model has the same unit cell as Safarowsky’s. The improvement is that besides the groups of four molecules building a cavitand ensemble (brighter group), there are also groups of four other molecules in the space between the cavitands (darker group). Obviously, in order to fit into this small space, the molecules of the dark groups gather in a different order than in the bright cavitand group. This model is based on the assumption of knowing the correlation between DBV and the chloride lattice underneath. It assumes that the bipyridine group of DBV molecules is packed parallel to the [100] direction of c(2 x 2)‐Cl layer. Therefore a DBV2+ molecule can absorb between two adjacent chloride atom rows. From this assumption and the description of the model in Fig. 5.12, one can observe that DBV2+ molecule in adjacent dark and bright groups have to be aligned as exemplified by the molecules 1 ‐ 4 and 1’ ‐ 4’ in Fig. 5.12. If the condition above cannot be guaranteed, the ordering of the DBV adlayer will be affected. Following the new model, we determine a DBV surface coverage of about Θ = 0.15 ML with respect to the chloride lattice or Θ = 0.075 ML with respect to the bare Cu(100)‐(1 × 1). The area required for each DBV• molecule on c(2 x 2)‐Cl/Cu(100) amounts to 0.864 nm2. The surface coverage amounts to twice that proposed by Zörlein [5].
This new model can be supported even further by the following STM results concerning translational domain boundaries of the cavitand phase.
Figure 5.13: The two types of translational domain boundaries of the cavitand phase.
The STM image of Fig. 5.13a shows a full DBV mono‐adlayer on c(2 x 2)‐Cl/Cu(100), revealing two typical distinct translational domain boundaries: one with bright dots along the boundary which is quite stable within a definite potential regime, thus called strong domain boundary, and on the contrary, one with hollows or

DBV adsorption on chloride modified Cu(100) and on HOPG
86
defects between domains which is much less stable, therefore called weak domain boundary. The instability of the weak domain boundary can be seen in Fig. 5.14 at which the DBV2+ molecules are quite mobile causing the movement of the weak boundary under the same electrochemical control. It is impossible to observe such movement with the strong domain boundary.
Figure 5.14: STM series showing the dynamics of DBV2+ molecules at a “weak” translational domain boundary, It = 1.1 nA, Ub = ‐209 mV, E = +36 mV.
It is noteworthy that in Fig. 5.14, the dynamics of the weak domain boundary takes place at high positive potential of 36 mV where the viologen molecules are supposed to be more active at the surface. And the DBV cavitand phase within domains tends to attain a more ordered structure so that the weak domain boundary becomes more and more straight.
Interestingly, by inverting the bias voltage, the bright dots along strong domain boundaries disappear (see Fig. 5.13b,c). This raises the big question “what are the bright dot?”. Only using the new structure model of the cavitand phase, we can interpret the nature of the two translational domain boundaries.
As mentioned above, there is such a condition that DBV2+ molecules form ordered assemblies, such that there is straight alignment of DBV2+ molecules along and between two adjacent chloride rows. Note that only one DBV2+ molecule can be fitted in a chloride row, and in the same domain, DBV molecules align as indicated in Fig. 5.12, therefore there are only two possibilities for alignment between two adjacent domains: shifted by two chloride rows (“even‐shift”) e.g. between domain I and II in Fig. 5.15 (see dotted lines) or shifted by an odd number (1 or 3) of chloride tows (“odd shift”), e.g. between domain I and III in Fig. 5.15. From the model, we can see, at even shift, the space at the domain boundary is large enough so that each group of four molecules at the domain boundary can share one molecule. The bipyridine groups of the two shared molecules at a domain boundary of “even shift” are closer than within the domain, resulting in a bright dot in the STM image and forming a stable and “strong” domain boundary. On the other hand, the odd

DBV adsorption on chloride modified Cu(100) and on HOPG
87
alignment cannot meet the distance condition to form a strong enough interaction, therefore this domain boundary is “weak”, consisting of spaces of bare chloride layer, thus DBV2+ molecules at this boundary should be much more mobile and easy to remove. And there are only these two translational domain boundary types in DBV2+ adsorption on chloride modified Cu(100) substrate.
Figure 5.15: Schematic drawing of DBV2+ adsorbed on c(2x2)‐Cl/Cu(100), showing the difference between the “strong” and “weak” translational domain boundaries.
Figure 5.16: STM images showing two types of translational domain boundaries corresponding to a shift between two domains of the DBV2+ cavitand phase, (a) “strong” domain boundaries, It = 0.3 nA, Ub = 214 mV, E = ‐141 mV, (b) “weak” domain boundaries, It = 1.1 nA, Ub = ‐209 mV, E = +36 mV.

DBV adsorption on chloride modified Cu(100) and on HOPG
88
Fig. 5.16 displays the shift between two domains determining the characteristics of the domain boundary. An “odd shift” appears in Fig. 5.16b corresponding to a weak domain boundary. And an “even shift” appears in Fig. 5.16a resulting in a strong domain boundary. Fig. 5.16a also includes the realization of two adjacent strong domain boundaries.
This part discussed the structural behavior of DBV adsorption at potentials more positive than needed for the reductive reaction. The next part will focus on the same aspect but in the potential regime after passing the reduction peak P1 (see Fig. 5.2), i.e. the structure of the DBV• species.
5.3.2 Stacking phase
Passing P1 of CV2 in Fig. 5.2, the reduction of DBV to DBV• is complete. The surface morphology of adsorbed DBV• is shown in Fig. 5.17, i.e. the stripe pattern of the stacking phase. The gross surface morphology is still dominated by substrate steps that are parallel to the [100] directions (Fig. 5.17). The presence of the viologen adlayer apparently gives rise to an additional increase of the activation barrier for the chloride desorption. From these results it becomes evident that the electron transfer from the metal to the redox‐active species occurs through the “inner Helmholtz plane” of specifically adsorbed chloride anions (Fig. 5.17).
Figure 5.17: Surface morphology of the stacking phase on c(2 x 2)‐Cl/Cu(100), It = 0.4 nA, Ub = 176 mV, E = ‐321 mV.

DBV adsorption on chloride modified Cu(100) and on HOPG
89
On a mesoscopic length scale, these DBV• polymer chains arrange themselves into extended rotational and mirror domains (Fig. 5.17). Individual DBV• molecules within the DBV• oligomer and polymer chains are often imaged as elongated “discs” with an intermolecular spacing of 3.6 ± 0.2 Å within and 1.82 nm between adjacent DBV• chains (Fig. 5.18a). However, the particular imaging contrast sensitively depends on the applied tunneling conditions. A selective imaging of the more conductive bipyridinium redox‐centers is obtained in Fig. 5.18b. The structural correlation to the chloride lattice is achieved by the local removal of the viologen layer upon scanning under drastic tunneling conditions (Fig. 5.18c).
Figure 5.18: Structural correlation between the stacking phase and the c(2 x 2)‐Cl/Cu(100) lattice underneath by a systematic variation of the tunneling conditions, (a) It = 0.2 nA, Ub = 93 mV, E = ‐200 mV; (b) It = 40 nA, Ub = 28 mV, E = ‐200 mV; (c) It = 9 nA, Ub = 1 mV, E = ‐130 mV
For the stacking phase we propose in Fig. 5.19 a structure model for only one of the possible mirror domains with individual DBV• molecules residing with their main molecular axes parallel to the surface in a side‐on adsorption geometry. The stripe propagation direction encloses a characteristic angle of α = 37° with one of the main symmetry axes of the chloride lattice. The bright stripes in Figs. 5.18a, b are assigned to bipyridinium cores arranged in an almost face‐to‐face orientation. Benzyl groups are expected to lie within the dark ditches revealing a reduced STM imaging contrast. Essential for the formation of such a 1D polymer chain with a nearest neighbor distance of only 3.6 ± 0.2 Å is the almost planar conformation of the bipyridinium cores in the reduced state. A dihedral‐angle of Φ = 40.1° as predicted for the DBV2+ species (Fig. 4.4) would not allow such a small intermolecular distance within the 1D polymer chain. A further sterical requirement for the stabilization of the 1D polymer chains consists in the slight side‐shift of adjacent DBV• molecules and explains the slight deviation from an ideal face‐to‐face arrangement. As a consequence of that, the propagation direction of the 1D polymer chain is not exactly perpendicular to the main molecular axes of the DBV• molecules (Figs. 5.18 and 5.19) but rotated by an angle α. On c(2 x 2)‐Cl/Cu(100) we determine a DBV•

DBV adsorption on chloride modified Cu(100) and on HOPG
90
surface coverage of about Θ = 0.2 ML with respect to the chloride lattice or Θ = 0.1 ML with respect to the bare Cu(100)‐(1 × 1). The area required for each DBV• molecule on c(2 x 2)‐Cl/Cu(100) amounts to 0.648 nm2.
Figure 5.19: Structure model of one possible mirror domain of the stacking phase on c(2 x 2)‐Cl/Cu(100).
The driving forces for the formation of the observed polymeric DBV• stacking chains are intermolecular π‐π interactions between neighboring benzyl groups and even stronger interactions between neighboring reduced bipyridinium moieties, probably due to spin pairing [3, 4]. It should be stressed that such an effective π‐π‐interaction between adjacent DBV• molecules can only be realized on the surface if the benzyl groups take up a trans‐conformation. Attractive intermolecular interactions apparently overcome the repulsive electrostatic interactions of positively charged monocations within this compact film. Note that the nearest neighbor distance (NND) within the DBV• stacking chains amounts only to 0.36 nm.
This value is typical for π‐stacking assemblies of aromatic systems and has also been observed, for example, for 2,2’‐ bipyridine phases on Au(111) [119] and Au(100) [120]. Strong attractive intermolecular interactions as the driving force for dimerization of open‐shell planar aromatic species in aqueous solutions were first reported by Hausser and co‐workers in 1957 [121]. The face‐to‐face orientation of adjacent radical species allows an overlap of the singly occupied π* orbitals of the neighboring aromatic ring systems. It is assumed that the redox‐active (reduced) bipyridinium moieties are imaged as bright and elongated dots under these tunneling conditions while the benzyl groups are supposed to lie within the dark ditches

DBV adsorption on chloride modified Cu(100) and on HOPG
91
exhibiting a lower imaging contrast (Fig. 5.18b). This phenomenon is known not only for viologens [122] but also for reduced naphtyl [123], anthracyl [123], and pyridinium [124] derivatives in aqueous solution. The formation of a dimer species is also discussed for viologen radical monocations that were immobilized before reduction on electrode surfaces via thiol or disulfide functional groups [109, 125]. In these SAM‐like films, the dimerization is favored over the extended polymerization due to the lack of lateral mobility of the covalently immobilized viologens. Note that the STM image in Fig. 5.18b was obtained by using a tunneling current of It = 40 nA and a bias voltage of Ub = 28 mV. This extraordinary stability can be clearly attributed to the presence of the anionic chloride layer under the polycationic DBV• stacking phase.
Figure 5.20: Surface morphology of DBV• stacking phase showing: (a) the four domains, It = 0.2 nA, Ub = 268 mV, E = 380 mV; (b) translational domain boundary, It = 0.15 nA, Ub = 174 mV, E = ‐330 mV.
Fig. 5.20 shows more details about the 4 domains of the DBV• stacking phase including 2 extended rotational domains rotated by 90° with respect to each other and 2 mirror domains. The angle between 2 mirror domains of the DBV• stacking phase is defined to be 250. The areas at the domain boundaries appear to be hollow sites or a combination of disordered DBV• species which will then act as active sites for the nucleation of phase transitions. However, STM results also reveal the typical translational domain boundary of ordered DBV• species (Fig. 5.20b) where the DBV• stacking chains shift by half the distance between two chains. This type of domain boundary is much more stable than those in Fig. 5.20a. The translational domain boundary between two parallel stacking chains provides surely not enough space to fit for a full stacking chain, however it accommodates an ordered row of separated DBV• species (the zoom‐in image in Fig. 5.20b). The distance between these entities in the translational domain boundaries is about 1.15 nm

DBV adsorption on chloride modified Cu(100) and on HOPG
92
(nearly equal to three times of the 0.36 nm distance value between two adjacent DBV•+ molecules in the typical stacking chain). The half‐distance of 0.91 nm at the translational domain boundary is less than the theoretical length of 1.55 nm of isolated DBV molecule (Fig. 4.3). Therefore, the adsorption of the ordered row in the translational domain boundary is assumed to associate with a flexible twist of the methyl group in the DBV molecule so that at the translational domain boundaries only the bipyridinium groups appear while the benzyl groups can twist and raise perpendicular to the surface in order to fit into the narrow area of the boundaries.
It should be mentioned that even these translational domain boundaries are generally stable but at moderate tunneling condition or in a very active potential regime, these boundaries can be dynamic to move and also act as active sites for the nucleation of phase transitions.
Figure 5.21: STM image shows the DBV• stacking phase at the on‐set of the chloride desorption process, It = 0.2 nA, Ub = 219 mV, E = ‐320 mV.
As shown in Fig. 5.17, in the surface morphology of DBV• , normally, the stacking phase does not arrange parallel to the [100] directions of the typical 900 step edges. However, at the potential of ‐320 mV or the on‐set of the chloride desorption process, it initiates the removal of the adlayer starting from step edges, described as the obtuseness of the step edge angle in Fig. 5.21. Hereby, the adsorbed DBV• stacking chains are now parallel or perpendicular to the decayed step edges at some places.
Fig. 5.21 also represents the possibility to form a very well‐ordered assembly of the DBV• stacking phase even on a mesoscopic length scale.

DBV adsorption on chloride modified Cu(100) and on HOPG
93
5.3.3 Amorphous phase
After passing P2 of CV4 in Fig. 5.2, the DBV species both in solution and on the surface is still the radical cation DBV•+, however the surface morphology does not appear as the stacking phase but as another disordered phase of radical cation DBV•+ adsorption, called amorphous phase describe in Fig. 5.22a.
The amorphous DBV phase represented in Fig. 5.22a seems to be composed of randomly distributed and immobilized entities. The immobilization of DBV species is assumed to be related to the chloride desorption through the DBV•+ adlayer. This hypothesis is further supported by a tip induced local removal of the disordered viologen layer as demonstrated in Fig. 5.22b.
Figure 5.22: (a) Amorphous DBV•+ layer imaged under moderate tunneling conditions, It= 0.2 nA, Ub = 286 mV, E = ‐415 mV, (b) Cu(100)‐(1x1)‐lattice imaged under more drastic tunneling conditions, It= 1.7 nA, Ub = 1 mV, E = ‐500 mV.
While the disordered viologen phase could be obtained under moderate tunneling conditions (Fig. 5.22a), it is possible to image a square lattice using more drastic tunneling conditions (Fig. 5.22b). An NND = 0.25 nm gives clear evidence for the presence of the bare Cu(100)‐(1 x 1) lattice under the amorphous phase. Apparently, the DBV• molecules do not accompany the desorbing chloride anions into the bulk of the solution. Such an anion “carrier effect” is, for instance, known from polycationic porphyrin layers adsorbed on an ordered sulfate/water coadsorption layer on Cu(111) [126]. Here, the sulfate desorption leads to a co‐ desorption of the cationic porphyrin molecules. In turn, sulfate adsorption initiates the coadsorption of the polycationic porphyrins again resulting in a laterally ordered paired anion‐cation layer. In the present case, by contrast, the cationic organic

DBV adsorption on chloride modified Cu(100) and on HOPG
94
molecules remain on the bare metal surface after anion desorption. The missing lateral order within the viologen layer right after (partial) chloride desorption points to a strongly reduced diffusivity of the radical monocations on the bare metal surface. Two reasons can be assumed causing that effect:
(1) Radical monocations interact much stronger with the metallic copper substrate than with the anionic chloride lattice thus preventing a lateral mobility of the viologens.
(2) It can further be assumed that the chloride desorption is not fully completed even in the presence of the disordered phase.
In this scenario a disordered chloride submonolayer still in contact with the copper prevents a lateral ordering of the viologens on the metallic copper substrate (Fig. 5.23b). How the starting chloride desorption/adsorption process affects the polycationic viologen film is illustrated in Fig. 5.23.
Figure 5.23: Schematic drawing showing (a) the chloride desorption through the polycationic organic layer; (b) the disordered DBV•+ layer after (partial) chloride desorption.
5.4 Phase transitions
5.4.1 Cavitand/Stacking phase transition
The DBV related cavitand structure and the DBV• stripe phase on c(2 x 2)‐Cl/Cu(100) are displayed in Fig. 5.24 again. The cavitand phase is stable only down to potentials of about ‐240 mV. Reaching the potential regime where P1 appears in the CVs (Fig. 5.2) we initiate the reduction of the viologen di‐cation to the corresponding radical mono‐cation which leads to a slow decay of the DBV cavitand phase as demonstrated in Fig. 5.25.
DBV adsorption on chloride modified Cu(100) and on HOPG
95
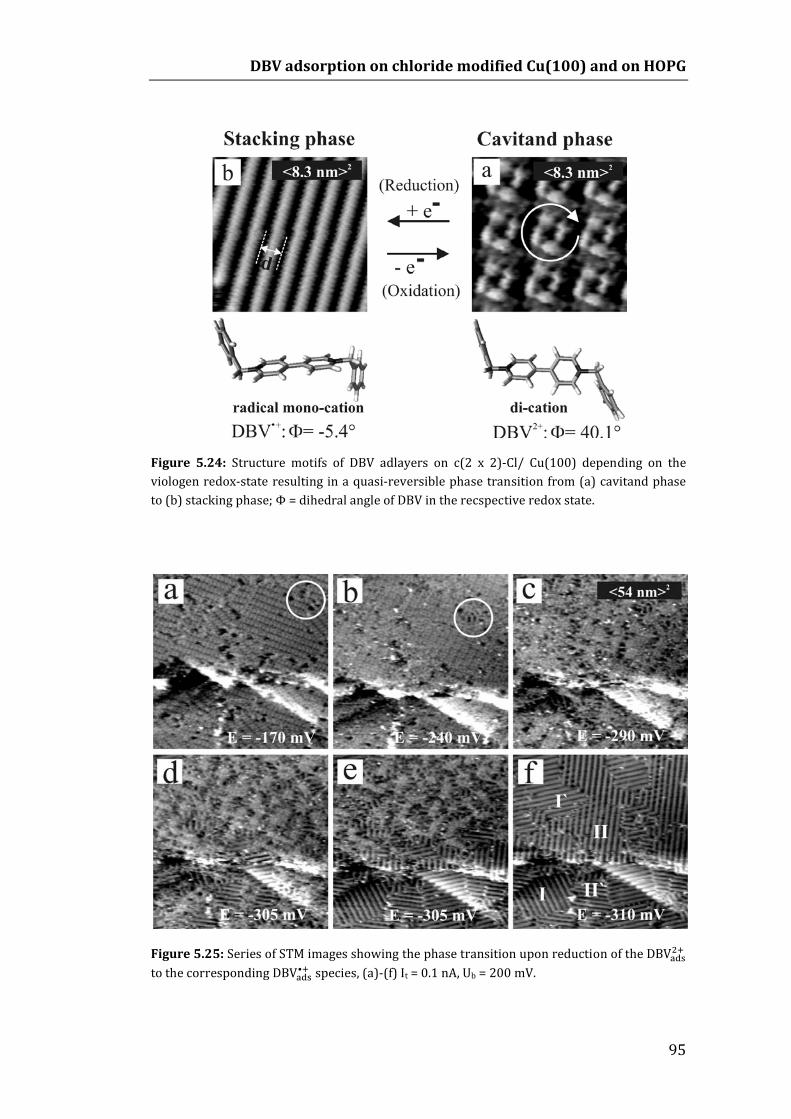
Figure 5.24: Structure motifs of DBV adlayers on c(2 x 2)‐Cl/ Cu(100) depending on the viologen redox‐state resulting in a quasi‐reversible phase transition from (a) cavitand phase to (b) stacking phase; Φ = dihedral angle of DBV in the recspective redox state.
Figure 5.25: Series of STM images showing the phase transition upon reduction of the DBV to the corresponding DBV• species, (a)‐(f) It = 0.1 nA, Ub = 200 mV.

DBV adsorption on chloride modified Cu(100) and on HOPG
96
This process is accompanied by the nucleation and subsequent growth of the stacking phase that occurs in two mirror and two further rotational domains (Fig. 5.25f). Defects such as translational or mirror domain boundaries within the pre‐existing DBV cavitand phase serve as preferential nucleation centers for this growth process (see white circles in Figs. 5.25a and b). Due to the slow transition kinetics there is a wide potential range of co‐existence of both phases in the cathodic potential sweep ranging from E = –240 mV to E = –320 mV. The phase transition is fully completed at about E = ‐330 mV.
Figure 5.26: Coexistence of the DBV and DBV• species at the surface, It = 0.38 nA, Ub = 161 mV, E = ‐315 mV.
It should be stressed that the electron‐transfer reaction does not come to a standstill after completion of the surface phase transition presented in Fig. 5.25. Fig. 5.26 shows a molecularly resolved STM image obtained in this potential regime of coexistence with isolated DBV cavitands surrounded by short chains of the stacking phase. Their lateral order and structural relation to the substrate is still poor in this intermediate regime. Ongoing ripening processes after the initial nucleation and growth lead to an overall improvement of the lateral order of this stacking, the increase of domain sizes and to a significant decrease of the domain boundary density indicating that the presence of these domain boundaries is energetically unfavorable. After completion of these ripening processes individual domains of the stacking phase often extend over entire substrate terraces (Fig. 5.25f).
Apparently, the ongoing electron‐transfer reaction does not seriously affect the structural integrity of the DBV• stacking phase on top of the chloride lattice, at least in a solution of 10 mM HCl and 0.1 mM DBVCl2. Solvated DBV• monomers or DBV• dimers as reaction products are transported back into the bulk of the

DBV adsorption on chloride modified Cu(100) and on HOPG
97
solution. Their solubility in the chloride containing electrolyte is still sufficient to prevent a thick film formation of chloride salts of the radical monocations, at least at these low reaction rates. From STM experiments alone it cannot be concluded where and how this further reaction takes place, either by an electron transfer through the paired anion‐cation layer at terraces ((1) in Fig. 5.27), which might involve electron transfer via electronic states of the viologen moiety, or at defect sites such as domain boundaries of the viologen stacking layer and substrate step edges ((2) in Fig. 5.27) or via an exchange process of an already reduced DBV• by an oxidized DBV species followed by its reduction directly on top of the chloride layer ((3) in Fig. 5.27).
Figure 5.27: Out‐of‐plane structure model of the interface in the presence of the paired anion‐cation layer.
In principle, the transition of the DBV cavitand to the stacking phase can be regarded as a quasi‐reversible process. Sweeping the potential back towards the double layer regime converts the stacking back into the DBV cavitand phase (Fig. 5.28). This transition preferentially starts again at defect sites, e.g. at mono‐atomically high substrate steps which serve as natural domain boundaries of the stacking phase. Comparing Fig. 5.28a and f it becomes evident that the appearance of both mirror domains of the DBV cavitand phase is independent on the pre‐orientation of the stacking rows. Both mirror domains of the DBV cavitand phase can originate from the same mirror domain of the stacking phase.
Since we change the delicate balance between the substrate‐adsorbate and the adsorbate‐adsorbate interactions by the electron transfer a resulting change in the lateral ordering within the viologen film appears plausible. For the resulting DBV• film we expect both, reduced repulsive electrostatic interactions due to the reduced positive charge on the adsorbed viologens and increased intramolecular interactions.

DBV adsorption on chloride modified Cu(100) and on HOPG
98
From the solution phase chemistry of viologens it is known [4, 104] that the paramagnetic radical mono‐cations reveal a strong tendency towards dimerization in particular in an aqueous environment resulting in highly soluble and spin‐paired DBV species (see Eq. 5.5). Driving forces for such a spontaneous dimerization in solution are enhanced π‐π‐interactions between bipyridinium cores and the tendency towards spin‐pairing in the reduced redox‐state which can even overcompensate the repulsive electrostatic interactions between those radical mono‐cations [4]. The Standard Free Gibb’s Enthalpy for the exergonic dimerization of DBV• species in an aqueous and chloride containing solution amounts to ΔG0 = ‐16.81 kJ/mol [4]. Blandamer et al. even report an oligomerization of di‐alkylated radical mono‐cations in solution [4, 127]. A similar tendency towards oligomerization and polymerization is observed here on the electrode surface (Figs. 5.24 and 5.25). The observed stacking formation can be understood in terms of the 2D ordering of the adsorbed DBV• species to 1D oligomer and polymer aggregates DBV according to Eq. 5.3. Here, “polymerization” does not imply a covalent bonding as it has been reported for a DBV•+ polymer being irreversibly formed by a “prolonged electrolysis of an aqueous solution” [4, 128, 129]. The stacking phase on c(2 x 2)‐Cl/Cu(100) can be quasi‐reversibly transformed back into the DBV cavitand phase by applying potentials in the double layer regime as evidenced in Fig. 5.28.
Figure 5.28: Series of STM images showing the phase transition from DBV• stacking phase to the DBV cavitand structure upon increasing potentials, (a)–(f) It = 0.15 nA, Ub: ranging from 228 mV to 310 mV.

DBV adsorption on chloride modified Cu(100) and on HOPG
99
While the first electron transfer step in the viologen redox‐chemistry of solution species is often considered as a fast and fully reversible process the related surface phase transitions of the adsorbed viologen species are slow and therefore reveal a considerable potential hysteresis which arises from additional activation barriers. These might originate from the required positional and conformational changes of viologen molecules within the condensed 2D layer in the course of the phase transition. Note, the restoration of the DBV cavitand phase in the anodic potential sweep is completed only at E = 0 mV (Fig. 5.28f). In particular the transition from the stacking to the DBV cavitand phase seems to be kinetically hindered. Such a kinetical hindrance appears plausible considering that intermolecular π‐π‐bonds have to be broken upon this phase transition.
5.4.2 Chloride desorption/adsorption phase transition
Figure 5.29: Quasi‐reversible order/disorder phase transition from (a) DBV stacking phase to (b) DBV amorphous phase due to chloride desorption/readsorption.
Previous STM studies already gave clear evidence for a surface phase transition from cavitand to stacking phase upon reaching the CV‐peak P1 (cathodic potential sweep in Fig. 5.2, CV2). A further decrease of the electrode potential upon reaching P2 causes a reversible order/disorder transition within the DBV• stacking phase related to the chloride desorption/readsorption process (Fig. 5.29).
Fig. 5.30 shows an STM series of this quasi‐reversible phase transition. The surface process starts at defects or domain boundaries of the stacking phase (marked by the circles in Fig. 5.30a). Obviously, the activation free energy for the dissolution at these defects is significantly lower than the one necessary to create new point defects within intact domains. The structural transition is completed after passing P2 (Fig. 5.2, CV4). In contrast to the reported order‐disorder transitions of organic films, it is not a “gaseous”, an “expanded‐liquid”‐, or a “condensed‐liquid”‐like phase of laterally mobile organic molecules that is left behind after completion of the phase transition.

DBV adsorption on chloride modified Cu(100) and on HOPG
100
Instead, the amorphous viologen phase seems to be composed of randomly distributed and immobilized entities (Fig. 5.30d).
A further deviation from the reported examples of defect mediated dissolution processes is the respective underlying driving force. While it is usually a temperature or potential induced reorientation of adsorbed molecules that might be associated with the partial desorption/adsorption of the organic molecules initiating these transitions [130], here, it is the starting chloride desorption though the organic film that drives the observed order‐disorder transition.
Figure 5.30: Series of STM images showing the reversible potiential dependent decay and formation of the DBV• stacking phase at very negative potentials: (a)‐(h) It = 0.1 nA, Ub = 151 mV.
In general, the observed order‐disorder transition is quasi‐reversible with a remarkably small potential hysteresis of about ΔEhyst ≈ 70 mV. In the reverse potential sweep, chloride anions are forced to readsorb onto the copper surface once potentials close to P2’ (Fig. 5.1) are reached. Therefore, chloride anions have not only to penetrate into the disordered viologen film but also displace DBV• molecules from the metallic copper surface, which then order themselves again into patches of the c(2 x 2)‐Cl phase in the presence of the disordered viologen phase. In this sense, the chloride anions “crawl” under the polycationic amorphous viologen layer. Driven by the chloride readsorption two coupled disorder‐order transitions take place

DBV adsorption on chloride modified Cu(100) and on HOPG
101
successively. The first one affects the ordering of chloride anions that are in contact with the metallic substrate, and the other one affects the viologen overlayer. The lateral diffusivity of DBV• molecules is again enhanced on top of the chloride lattice compared to that on the bare metal surface, thus allowing the fast recombination of DBV• molecules into the DBV• stacking phase on top of the locally restored c(2 x 2)‐Cl phase (Figs. 5.30e‐g). The reorganization of the c(2 x 2)‐Cl phase is considered as rate determining. Sweep‐rate dependent CV measurements as discussed in part 5.2.1 suggest a kinetical hindrance that is stronger for the disorder‐order transition (P2’) than for the preceding order‐disorder transition (P2). In general, the chloride mediated disorder‐order transition also complies with the typical 2D nucleation and growth behavior and the coexistence of two discernible phases (disordered/2D‐ordered) within a certain potential regime between P2 and P2’. Ongoing nucleation during the disorder‐order transition combined with a relatively slow growth of the stable 2D nuclei leads to the appearance of a high number of growing patches of the DBV• stacking phase and consequently to a high density of energetically unfavorable line and point defects. However, postgrowth ripening effects tend to reduce the total length of domain boundaries (white arrows in Figs. 5.30g‐h).
It should be mentioned that the electrode is still under reactive conditions even after chloride desorption. Ongoing electron‐transfer processes now take place either through the disordered viologen layer or at defects in the disordered viologen film at the bare metal surface (Fig. 5.23b). Not only the chloride desorption has an influence on the lateral order of the DBV• stacking phase but also the presence of the viologen layer affects the chloride desorption/adsorption process. Compared to the pure supporting electrolyte (Fig. 5.1), the chloride desorption is shifted toward lower potentials in the presence of the viologen by up to ΔEdesorp ≈ 90 mV. While chloride desorption in the pure supporting electrolyte has already started at E ≈ ‐320 mV (see Fig. 3.6), both the DBV• stacking phase and the chloride lattice underneath are still largely intact at E = ‐410 mV in the DBV containing electrolyte as evidenced in Fig. 5.30b. The observed downward shift of the chloride desorption can simply be understood in terms of an additional activation barrier for chloride desorption when the covering viologen film is present. While chloride desorption in the pure supporting electrolyte exclusively starts at the step edges, we observe, in addition, chloride desorption from terraces in the presence of the viologen film with line and point defects in the covering DBV• stacking phase, which act as active sites for that process. It should also be noted that the shift of the chloride desorption potential depends on the structural quality of the covering viologen film. A high defect density within the viologen film generally leads to a smaller shift of the chloride desorption.
Passing P2 (Fig. 5.1) in the cathodic potential sweep, STM measurements normally showed only the disorder phase covering the whole sample surface, but occasionally they revealed also ordered structures as indicated by the white arrows

DBV adsorption on chloride modified Cu(100) and on HOPG
102
in Figs. 5.31e‐f. Obviously, the orientation of the new stacking phase is not the orientation of any DBV• stacking phase domains (compare angles in Figs. 5.31b and 5.31e). Furthermore, the orientation of the new stacking structure is about 44° in relation with that of the adlayer DBV stacking phase on c(2 x 2)‐Cl (similar with the 45° angle of main symmetry axes between c(2 x 2)‐Cl and Cu(100)‐(1 x 1)), it is supposed that DBV• molecules can now directly interact with the metallic copper substrate, giving more evidence about the chloride desorption process. The reorganization of the DBV• species to 1D oligomer or polymer chains now on‐top of the bare copper is much slower than on the chloride modified electrode surface. The stacking structure of adsorbed DBV• species on bare copper is shown in the enlarged image in Fig. 5.31f as stripes of separated molecules.
Figure 5.31: Decay of the stacking phase due to chloride desorption, (a)‐(f) It = 0.2 nA, Ub = 268 mV, the inset in (f) shows local structure of DBV• on bare copper lattice.
In brief, the role of the chloride anions in the course of the lateral ordering of DBV• molecules is not a templating one in the sense of controlling the DBV• ordering process due to strongly modulated adsorbate‐substrate interactions. The chloride layer acts here more as a “buffer layer” between the DBV• film and the metallic copper substrate. This allows the DBV• entities to self‐organize at the surface.

DBV adsorption on chloride modified Cu(100) and on HOPG
103
5.5 Copper dissolution in the presence of DBV adlayer
Figure 5.32: Series of STM images showing the adsorbed DBV cavitand phase at the on‐set of CDR, (a)‐(f) It = 1.1 nA, Ub = 290 mV.
Fig. 5.32 shows the series of STM images at the on‐set of the copper dissolution reaction (CDR), beginning with a full monolayer of DBV cavitand phase (Fig. 5.32a) the surface morphology changes due to the dissolution reaction of the copper lattice underneath. The copper dissolution reaction starts at the potential of +120 mV. With the copper dissolution reaction, the surface terraces decay preferential parallel to the [100] orientation of the Cl lattice (Fig. 5.32f). However, the DBV cavitand phase still adsorbs as a full monolayer even under the destructive process of the copper dissolution reaction (Fig. 5.32d).
5.6 DBV adsorption on HOPG
In previous parts, we discussed the adsorption of DBV on the chloride modified Cu(100) substrate. On this surface the adsorption of cationic DBV species is enhanced by electrostatic attraction from the anionic chloride template. As a result with decreasing potential the structures of the cavitand phase, stacking phase and an amorphous phase related to the dication DBV2+ and reduced radical cation DBV•+

DBV adsorption on chloride modified Cu(100) and on HOPG
104
species, respectively, are observed. The phase transitions between these phases were observed in specific potential regimes.
However, the presence of the anionic chloride adsorbed on the electrode surface is not mandatory for the adsorption of DBV molecules. On an HOPG substrate there is no specifically adsorbed chloride layer present. Here, the phase formation of the viologen species takes place directly on the unmodified HOPG surface. Furthermore, the much broader potential window of the HOPG substrate gives a chance to investigate the viologen adsorption at more anodic or cathodic potentials than this is possible on the copper substrate, especially at more negative potentials where the reduction from the radical DBV•+ to uncharged species takes place.
In order to study the adsorption of DBV on the HOPG surface the DBV2+ containing electrolyte was added to the electrochemical cell at a potential of 0 mV. The corresponding CV was shown in Fig. 5.6. In the positive potential regime before reaching the reduction peak P1, the CV shows two unknown peak pairs P4/P’4 and P5/P’5, however, DBV adsorption on the HOPG surface can be observed with STM. Passing P1 of CV4 in Fig. 5.6 causes the reduction of viologen molecules from dication DBV2+ to the corresponding radical cation DBV•+ species. Then the adsorption of DBV can be observed by STM, revealing a new structure as shown in Fig. 5.33. Obviously, the structure of adsorbed DBV•+ on HOPG is different from the stacking phase of DBV• on chloride modified Cu(100) (see Fig. 5.18).
Figure 5.33: STM images of DBV• double layer stripe phase obtained on HOPG, (a)‐(c) It = 0.2 nA, Ub = 350 mV, E = ‐350 mV.
This new structure is composed of stripes of separated DBV• species (Fig. 5.33b) in the first layer and further stripes adsorbed on top of the first layer (Figs. 5.33a,c). In Fig. 5.33b, the bright dots are assigned to the bipyridinium cores and the benzyl groups are assumed to lie within the darker area between these bright stripes. By using tip‐induced removal of the DBV adlayer revealing the HOPG substrate underneath, it is found that the bipyridinium cores are arranged along the [1000]

DBV adsorption on chloride modified Cu(100) and on HOPG
105
direction of the HOPG lattice (Fig. 5.34). The second stripes are assigned to stay on top and in between the DBV• stripes of the first layer therefore showing up brighter in Fig. 5.33a. The stripe propagation direction encloses a characteristic angle of 51° with one of the main symmetry axes of the HOPG lattice (Fig. 5.33a). The nearest neighbor distance between molecules within the stripe is 0.95 ± 0.05 nm, and the distance between adjacent stripes is 2.0 ± 0.1 nm (Fig. 5.33b). Both the distance between the entities and their size in Fig. 5.33b are so high that these adsorbed DBV• species are assumed to lay flat down on the substrate, unlike the face‐to‐face polymeric DBV• stacking phase known from Cl/Cu(100).
Figure 5.34: STM images of the first DBV• stripe layer in comparison with the HOPG lattice underneath at the same position, (a) DBV• stripe phase under moderate tunneling conditions, It = 0.2 nA, Ub = 350 mV, (b) HOPG lattice imaged under more drastic tunneling conditions, It = 1 nA, Ub = ‐1 mV.
Going further to negative potential, as mentioned in the CV part 5.2.2, the peak P3 is assigned to the second reduction of DBV from the radical cation DBV•+ species to the uncharged DBV0 molecules. In the case of a copper substrate, the hydrogen evolution reaction already takes place in the potential regime of P3. Therefore STM images cannot show the surface covered with the DBV adsorption adlayer. On the other hand, due to the broader potential window of the HOPG substrate the hydrogen evolution reaction does not taken place yet at P3, giving a chance for STM experiments to observe the adsorption of uncharged DBV0 molecules. In fact, starting from the DBV• double layer stripe phase on the HOPG substrate and going to more negative potentials than P3, a phase transition of the DBV adlayer appears on the unmodified HOPG substrate. Surprisingly, the observed structure of the adsorbed uncharged DBV0 molecules is a stacking phase (similar to the DBV• stacking phase on chloride modified copper surface). This structure is described in Fig. 5.35.

DBV adsorption on chloride modified Cu(100) and on HOPG
106
The structural motifs of the uncharged DBV0 stacking phase has a nearest neighbor distance (NND) of 0.37 nm which is almost identical with the DBV• stacking phase on copper. Therefore, this structure represents a face‐to‐face polymeric DBV stacking phase adsorbed directly on the HOPG surface. The stacking chain propagation direction encloses an angle of α = 65° with one of the main symmetry axes of the HOPG lattice (Fig. 5.35).
Figure 5.35: Uncharged DBV stacking phase obtained on HOPG, (a)‐(b) It = 0.2 nA, Ub = 337 mV, E = ‐510 mV.
Thus, on copper the face‐to‐face polymeric stacking phase formation appears even with DBV• species, while the stacking phase on HOPG can only be observed after the reduction to the corresponding DBV molecules. It is noteworthy that the NNDs within stacking chains on copper is smaller (0.36 nm) than on HOPG (0.37 nm). Therefore the chloride‐covered Cu‐template apparently enhances the attractive intermolecular interaction of DBV• species and reduces the repulsive electrostatic interactions of the positively charged monocations within this compact film. On the other hand, on HOPG without the enhancement of any anionic template, the mere intermolecular interactions of DBV+• species cannot overcome the repulsive electrostatic interactions to form the polymeric stacking phase until the reduced uncharged molecules are formed. Another evidence proving the enhancement of the chloride template on the adsorption of DBV lies in their stability and robustness against externally induced mechanical stress, for instance, by the tunneling tip upon scanning. While on HOPG the stacking phases of adsorbed DBV are extremely fragile and, hence, often are destroyed upon scanning even at moderate tunneling conditions, by contrast, even drastic tunneling conditions for the imaging of the DBV• stacking phases on c(2 x 2)‐Cl/Cu(100) can be applied without destroying them (see Fig. 5.18b).

DBV adsorption on chloride modified Cu(100) and on HOPG
107
Figure 5.36: Series of STM images showing the phase transition from DBV• double layer stripe phase to DBV stacking phase on HOPG upon scanning towards negative potential regime, (a)‐(f) It = 0.2 nA, Ub = 373 mV.
Fig. 5.36 represents a potential‐dependent series of STM images showing the surface morphology upon going towards negative potentials. Starting with the initial potential of 0 mV, the HOPG substrate does not adsorb dicationic DBV2+ in a broad potential regime reaching until P1 of CV4 in Fig. 5.6 (Fig. 5.36a). Reaching P1 at the potential of ‐250 mV where the dications DBV start to be reduced to the corresponding radical cation DBV• causes immediately the adsorption of the DBV• double layer stripe phase on the bare HOPG substrate (Figs. 5.36b,c). The DBV• double layer stripe phase persists towards more negative potential before reaching P3 of CV6 in Fig. 5.6 (Fig. 5.36d,e). Note that the change of working potential causes also a change of the tunneling conditions, therefore, the same structures of the DBV• double layer stripe phase in Figs. 5.36b‐e appears in different contrast.

DBV adsorption on chloride modified Cu(100) and on HOPG
108
Reaching P3 at the potential of ‐470 mV, in Fig. 5.6, CV6, together with the reduction from DBV•+ to DBV0, the phase transition from the DBV• double layer stripe phase to DBV stacking phase takes place (Fig. 5.36f,g). Right after the completion of the phase transition at ‐550 mV (Fig. 5.36h), the whole DBV adlayer desorbs due to the hydrogen evolution reaction (Fig. 5.36i).
Figure 5.37: Series of STM images showing the phase transition from DBV stacking phase back to DBV• double layer stripe phase upon scanning towards positive potential regime, (a)‐(f) It = 0.2 nA, Ub = 373 mV.
These phase transition processes are reversible. Fig. 5.37 represents a potential‐dependent series of DBV phase transitions on HOPG upon scanning back towards positive potentials. Starting from the uncovered surface within the HER regime the DBV stacking phase readsorbs at ‐500 mV (Fig. 5.37b). This process takes place

DBV adsorption on chloride modified Cu(100) and on HOPG
109
gradually until forming a full monolayer at the potential of ‐380 mV. Further change towards positive potentials through both solution oxidation peaks P’3 and P’1 of CV6 in Fig. 5.6, the DBV stacking phase remains stable on the surface (Fig. 5.37d). Only until totally passing P’1 at the potential of ‐220 mV or the completion of the oxidation from DBV• back to DBV species in solution, the reverse phase transition from DBV stacking phase back to DBV• double layer stripe phase takes place (Figs. 5.37e,f). However, due to the lack of DBV• in solution, this phase of DBV• double layer stripes is only a sub‐monolayer (Fig. 5.37g) which decays to expose the bare HOPG substrate (Figs. 5.37h,i). In comparison with the transition in the negative‐scan in Fig. 5.36, in which the phase transition takes place almost simultaneously with the corresponding processes of the solution species, the reverse transition in Fig. 5.37 starts at much more positive potential than the corresponding solution peak P’3. Therefore, the phase transitions between DBV• double layer stripe phase and DBV stacking phase result in a very high hysteresis of ΔE ≈ 250 mV, indicating the extremely high stability of the DBV stacking structure.
Going further to positive potentials, into the solution dication regime, the DBV• double layer stripe phase decays until there is again no DBV adsorption observed (Figs. 5.37h,i).
5.7 Summary
In this chapter, the non‐reactive adsorption of DBV molecules on chloride modified Cu(100) and on HOPG has been investigated systematically by using the combination of two methods, CV and EC‐STM. Although the system of DBV adsorbed on the chloride template has been partly studied in the doctoral thesis of Zörlein [5], the present work adds new information about this system.
From the CV experiments, we can conclude on the reactions or processes corresponding to the peak pairs P1/P’1, P2/P’2 and P3/P’3 appearing in the CVs of Figs. 5.2 and 5.5. According to the results, the peaks P1 and P3 are solution peaks assigned to the first and the second electron transfer reduction from the dication DBV2+ to the corresponding radical cation DBV•+ species, and then to the uncharged DBV0+ molecules, respectively. P’1 and P’3 are their corresponding reoxidation peaks. On the other hand, the P2 and P’2 peaks correlate with the chloride desorption/readsorption processes on the surface. The above conclusions fit well with the CV results on an inert HOPG substrate where the preadsorbed anion layer is not present. Indeed, CVs on HOPG in Fig 5.6 show the similar solution peak systems P1/P’1 and P3/P’3 in corresponding potential regimes without the presence of the peak system P2/P’2 of the chloride desorption process. It is noteworthy that in the

DBV adsorption on chloride modified Cu(100) and on HOPG
110
CVs of the HOPG substrate also some small peak systems P4/P’4 and P5/P’5 appear at high potentials, however, these peaks have not been identified yet.
The corresponding STM experiments on the copper substrate show clear results which provide complementary information about surface structures and phase transitions as suggested by the CV data.
First of all, under non‐reactive adsorption at high initial potential, the surface morphology represents a very well‐ordered cavitand phase of DBV2+ species which is characterized by a square‐shaped structure of DBV2+ species with “strong” as well as dynamic “weak” boundaries between different structural domains. A new structural model is proposed for the cavitand phase which agrees with the obtained high resolution STM images and the explanation of the two types of translational domain boundaries.
Passing the first reduction peak P1 of the CV a phase transition from the dication DBV cavitand phase to the radical cation DBV• stacking phase is observed on the surface. The stacking phase is characterized by the polymerization of face‐to‐face DBV•+ species forming stripes which enclose an angle of 37° with one of the main symmetry axes of the chloride lattice.
At even more negative potentials, passing the chloride desorption peak P2, the stacking phase transforms into a disordered amorphous phase which suggests that the chloride desorption occurs through the organic adlayer. The presence of the amorphous phase causes also an inhibition effect shifting the hydrogen reduction reaction (HER) in the DBV containing electrolyte to much more negative potentials.
The two phase transitions are reversible with different hysteresis as presented in the result sessions. However, it is noteworthy that with every phase transition the number of defects or the perfectness of ordering may decreases.
In addition, STM experiments have been done on an HOPG substrate with a broader potential window into the more negative regime revealing different structures from those observed on the copper surface. At first, at high potentials the DBV2+ species do not form an ordered structure to be observed by STM. In the radical cation regime of the CV, the DBV•+ species orders on the HOPG lattice, however, the obtained structure does not appear as a stacking phase but as a double layer stripe phase of separated DBV• species. Passing the second reduction peak P3, a phase transition takes place from the DBV• double layer stripe phase to the polymeric DBV stacking phase. The phase transition is also reversible, however the DBV stacking phase is so stable that a very high hysteresis of ΔE ≈ 250 mV between cathodic formation and anodic decay results.

111
Chapter 6
DPV adsorption on chloride modified Cu(100)
6.1 Introduction
The goal of this chapter is to discuss the redox chemistry and the structural phase behavior of adsorbed Diphenyl‐viologen (DPV) on a Cu(100) surface. Since the molecules (see Fig. 4.5) are dissolved as cations in aqueous electrolytes, a negatively charged metal surface like the chloride modified Cu(100) surface is expected to be a good template for the self‐assembly of this kind of molecules.
Like DBV, the DPV molecules have three redox states: dication, radical cation and uncharged molecule. All three common viologen redox‐states can be converted into each other in an electrochemical environment by two single electron transfer reactions (see Sec. 4.2), however, within the Cu potential window, we expect only the transition from the dication DPV2+ to the radical cation DPV•+ following the first election transfer reaction.
The main difference between DPV and DBV consists in the lack of the extra methylene group separating the phenyl groups from the central bipyridinium unit as in case of the DBV (see Figs. 4.3 and 4.5), therefore the conjugated π‐system of the DPV molecule extends over the entire molecule. In the following, it will be demonstrated that this small structural difference significantly affects both the viologen solution redox chemistry and the structural phase behavior of the adsorbed viologen species. The fully conjugated π‐system of the DPV can be expected to stabilize the radical mono‐cation more effectively than the ‘isolated’ π‐system of the central bipyridinium unit as in the case of DBV.
6.2 Cyclic Voltammetry

DPV adsorption on chloride modified Cu(100)
112
Figure 6.1: Black dotted curve: CV of Cu(100) in the pure supporting electrolyte (10 mM HCl). Grey curve: CV of Cu(100) in the DPV2+ containing electrolyte (10 mM HCl, 0.1 mM DPVCl2), dE/dt = 10 mV s‐1.
Fig. 6.1 shows representative steady‐state CVs of Cu(100) in the absence (black dotted curve) and the presence (grey curve) of DPV species in the supporting electrolyte 10 nM HCl. After exchanging the pure supporting electrolyte by the one containing the redox‐active DPV2+ species we observe drastic changes in the CV curve, namely the appearing of a pair of peaks in the potential regime from about ‐200 to 50 mV. Unlike DBV, the presence of the DPV layer has almost no impact on the chloride modified Cu(100) surface at the HER regime, however, the DPV layer has strong impact on the oxidative copper dissolution regime (CDR), manifested by the fact that the potential of the dissolution reaction is considerably shifted to higher potentials (Fig. 6.1) (ΔE ≈ 60 mV). That points to a pronounced inhibition effect of DPV on the CDR. Obviously DPV molecules are still present at the surface even under the copper dissolution conditions thereby blocking reactive sites for the CDR such as substrate steps. It is worth to note that also in the case of DBV, the molecules have also a blocking effect on CDR but with much lower efficiency. In the case of DBV the blocking adlayer is the dicationic DBV2+ layer (see chapter 5 and 7), however at CDR the adsorbed DPV species is not the dication. That strong DPV blocking effect will be explained in the next part of STM results.
Towards negative potentials, the CV in DPV containing electrolyte shows some anodic and cathodic current waves. These additional current features have to be assigned to viologen‐related redox processes. Typically, the shape of the CV in the presence of the viologen species depends strongly on the chosen cathodic potential limit. A precise correlation of the cathodic to the respective anodic current waves in

DPV adsorption on chloride modified Cu(100)
113
the reverse potential scan is achieved by a systematic variation of the cathodic potential limit as shown in Fig. 6.2.
Figure 6.2: Appearance of anodic and cathodic current waves in the CV of Cu(100) in the DPV2+ containing electrolyte upon changing the cathodic potential limit
In Fig. 6.2, by restricting the cathodic potential limit to E = ‐250 mV, a peak pair P1/P’1 (P1max = ‐120 mV, P’1max = ‐10 mV) appears in the CV1. In CV2, extending the potential a bit further than ‐250 mV to about ‐300 mV and then even back to the cathodic potential limit of ‐250 mV, the peak pair P1/P’1 becomes considerably higher and shifts towards positive potentials (P1max = ‐80 mV, P’1max = +10 mV). Towards a more negative regime, if the cathodic potential limit exceeds a critical value E = ‐450 mV we initiate not only the HER but also a further process which is represented by P2 (CV3 Fig. 6.2). The small oxidation peak P’2, i.e. the counterpart of P2, can still be within the HER regime and does not appear clearly in the CV of DPV. CV3 of Fig. 6.2 also shows surprisingly that the peak system P1/P’1 is now not at the same positions as in CV2 but seems to shift back close to that of CV1 in both respects, intensity and position.

DPV adsorption on chloride modified Cu(100)
114
It is worth mentioning that when restricting the cathodic potential to values higher than ‐250 mV (CV1 Fig. 6.2), the peak pair P1/P’1 does not represent a perfect steady state during continuous scans. Fig. 6.3 shows a set of potential sweep curves while the cathodic potential limit is kept at ‐250 mV showing the instability of the peak pair P1/P’1. During scans, that peak pair shifts towards negative potentials and the height of the reduction peak P1 becomes higher while the height of the oxidation peak P’1 becomes lower continuously. However, if scanning further than ‐250 mV, the peak pair P1/P’1 in CV2 of Fig. 6.2 becomes a steady state CV and remains extremely stable. Both P1 and P’1 shift to positive potentials with the peak heights becoming almost double than in the former case. Following these CV results, it is expected that ongoing scanning to negative potentials further than the onset of HER, there should be 3 different reactions or processes related to the adsorption of DPV on the chloride modified Cu(100) surface:
- A reaction of DPV giving rise to P1/P’1, - the process happening when passing below ‐250 mV, - and the reaction or process related to P2.
-
Figure 6.3: Set of continuous CV scans while the cathodic potential limit is kept at ‐250 mV.
Similar to the case of DBV, the redox behavior of adsorbed DPV adsorption on chloride modified Cu(100) might be described in more detail below by the set of Eqs. 6.1 to 6.4 involving “solution‐” as well as “surface‐limited” reactions:
1. The surface limited reduction/oxidation of pre‐adsorbed viologen species according to:
( ) ( )+•−+ ↔+ ads
2ads DPVDPV e (6.1)

DPV adsorption on chloride modified Cu(100)
115
or even a polymer formation at the surface according to
( ) [ ] ( )++• ↔ n ads nads DPVDPVn (6.2)
2. The reduction/oxidation of viologen solution species according to:
( ) ( )+•−+ ↔+ aq
2aq DPVDPV e (6.3)
3. And the film formation/dissolution of radical mono‐cation chloride salts according to:
( ) [ ] ↓↔+ +•−+•n
-aq Cl DPVCln DPVn (6.4)
Note from CV3 in Fig. 6.2 that the HER regime in the DPV containing electrolyte comes so early that the second single electron transfer step transforming the radical mono‐cation into the fully uncharged DPV species does not take place within the potential window.
Firstly, the peak pair P1/P’1 is similar to that in the CV of a DBV containing electrolyte. Therefore we assign the peak system P1/P´1 to the reduction of di‐cationic DPV2+ to the corresponding radical mono‐cationic DPV•+ species. However, the STM results in the next part show that DPV adsorption leads exclusively to a stacking phase of mono‐reduced species or DPV• across the whole potential window. This indicates that at the surface DPV dications are so active that they undergo the reductive reaction already before P1(DPV) even when their species in bulk solution is still stable DPV . Therefore, the peak pair P1/P’1 is only related to the reduction/oxidation process of the solution species described by Eq. 6.3.
Figure 6.4: Out‐of‐plane structure model of the interface in the presence of the reductive reaction of dication DPV species in bulk solution to radical cation DPV• through the stable preadsorbed DPV• adlayer.

DPV adsorption on chloride modified Cu(100)
116
The surface reactions of Eqs. 6.1 and 6.2 take place prior to P1 and do not appear in the CV. The reduction taking place at P1 is illustrated in the structure model of the interface in Fig. 6.4. P1 is supposed to be a fast reduction of molecules from the liquid layer near the surface (or “interface” layer in Fig. 6.4). With the presence of the preadsorbed DPV•+ adlayer on the surface, the DPV2+ species in solution come to the interface layer to be reduced to DPV•+ species. After consumption of molecules from the ”interface” layer, further dication DPV2+ species in solution have to diffuse towards the surface which leads to a reduced reaction current of P1. The process is correlated with the re‐oxidation process at P’1.
Secondly, after passing ‐250 mV, the process which leads to the increase and the shift of the peak system P1/P’1 is assumed to be related to a stable double adlayer formation. That can explain why P1 and P’1 have almost double heights compared to those in the stacking monolayer phase.
Thirdly, similar to the DBV experiment, P2 is attributed to the chloride desorption process, starting just at the onset of the HER regime (about ‐350 mV) and completing at a potential of about ‐420 mV. These potential values fit with the chloride desorption process observed in the experiments with DBV molecules.
The structure of the DPV adlayer, the evidence proving the double layer when passing ‐250 mV, and the chloride desorption/readsorption processes will be represented in the next parts discussing STM results.
6.3 Structural determination
In the previous part, we have already discussed the redox behavior of DPV cations on chloride modified Cu(100), inferring that there might be 3 main processes or reactions of the system within the copper potential window. The aim of this part is to demonstrate the concommittant structural characteristics of the DPV adsorption.
Following the DBV experiment, after exchanging the pure supporting HCl electrolyte for the DPV2+ containing solution at potentials more positive than the main redox waves in the CV, we expected the presence of the dicationic DPV2+ species both in solution and at the surface. But with an initial starting potential at 0 mV, the DPV monolayer phases which are present on c(2 x 2)‐Cl/Cu(100) differ significantly in their structural appearance, in that DPV adsorption leads exclusively to a stacking phase (Fig. 6.5). This observation appears surprising since this stacking motif has been identified as a structural ‘fingerprint’ for the presence of mono‐reduced viologen species but not for the presence of adsorbed viologens in their di‐cationic redox state [132, 133]. That stacking phase remains unchanged even when passing

DPV adsorption on chloride modified Cu(100)
117
P1 to more negative potential. Obviously, this DPV adlayer corresponds to mono‐reduced viologen species. At the surface DPV2+ dications are so active that they are immediately reduced upon adsorption at potentials even above P1.
Due to symmetry reasons the DPV stacking phase occurs in two rotational domains rotated by 900. The nearest neighbor distance (NND) of DPV entities within these stacking chains amounts to NNDDPV = 0.36 ± 0.02 nm which is identical to the NND of the underlying chloride lattice of NNDc(2×2)‐Cl = 0.362 nm and close to the intermolecular spacings of monoreduced DBV species on both the c(2×2)‐Cl/Cu(100) surface and the chloride‐free HOPG (see Sec. 5.6). Assuming that the redox‐active bipyridinium groups are imaged brighter in the STM experiment than the phenyl groups are most likely located within the ‘darker grooves’ of the stacking phase (Fig. 6.5c). The inter‐chain distance amounts to d = 1.88 ± 0.02 nm and compares well with the length of the DPV molecules (Fig. 4.5). An interdigitation of the phenyl groups of DPV entities of adjacent DPV stacking chains can therefore be ruled out. However, from the STM images alone it cannot be concluded whether the aromatic rings of the central bipyridinium unit are oriented perfectly perpendicular to the surface or whether their plane is slightly tilted.
Figure 6.5: Surface morphology of the DPV stacking phase on c(2 x 2)‐Cl/Cu(100) at high potentials, E = 0 mV: a) It = 0.6 nA, Ub = 250 mV; b) It = 0.6 nA, Ub = 250 mV, c It = 5.0 nA, Ub = 250 mV.
A distinct structural characteristic of this DPV phase is its typical behavior at step edges which is different from the DBV stacking phase (pointed out in Fig. 6.5b). The DPV stacking chains are preferentially oriented along the substrate [100] directions. The alignment of substrate steps along the [100] directions is clearly indicative for the presence of the c(2×2)‐Cl layer underneath. It is worth mentioning that the lateral order of the DPV stacking phase is particularly well developed close to the mono‐atomically high substrate steps. This results in two almost defect‐free stacking chains running parallel on either side of these step edges, i.e. the upper and the lower side.

DPV adsorption on chloride modified Cu(100)
118
Figure 6.6: Selective decoration of [100] steps in the DPV submonolayer regime, It = 0.1 nA, Ub = 350 mV, E = ‐150 mV. The actual DBVCl2 solution concentration was 10‐6 mol/l.
Figure 6.7: Structure model of the DPV• stacking phase on the c(2×2)‐Cl/Cu(100) layer.

DPV adsorption on chloride modified Cu(100)
119
The specific affinity of DPV towards substrate step edges can further be demonstrated by using low concentration DPV solutions (Fig. 6.6). Under these experimental conditions no condensation and lateral ordering of DPV is observed on terraces. Only step edges that are oriented parallel to the substrate [100] directions are selectively decorated by DPV stacking chains (see white arrows ‘1’ in Fig. 6.6), while step edges oriented along other crystallographic directions, e.g. [110], remain uncovered in this initial stage of the DPV phase formation (see white arrow denoted by ‘2’ in Fig. 6.6). Each DPV chain in contact with a substrate [100] step contains DPV molecules that are oriented with their main molecular N–N axis perpendicular to the respective step edge and are therefore parallel to one of the [100] directions.
Figure 6.8: Different types of DPB stacking phases, (a)‐(b) Type I: It = 0.2 nA, Ub = 300 mV, E = 0 mV; (c)‐(d) Type II: It = 5.0 nA, Ub = 300 mV, E = 0 mV.
There is a clear preference of DPV for the lower sites at step edges which become decorated first before the corresponding upper sites of the step edges are populated (Fig. 6.6). The observed preference of the adsorbed DPV molecules for the substrate steps explains the strong inhibition effect of DPV on the copper dissolution and re‐

DPV adsorption on chloride modified Cu(100)
120
deposition reaction as revealed by the voltammetry (Fig. 6.1). The structure model of the DPV stacking phase on the c(2×2)‐Cl/Cu(100) layer is shown in Fig. 6.7.
The stacking phase in Fig. 6.5 is stable, remaining unchanged upon going towards more negative potentials until reaching the HER regime. However, there is an exception. Because at initial potentials higher than P1 (typically 0 mV), there can be found two structures of DPV stacking phase, namely Type I and Type II shown in Figs. 6.8a,b and c,d respectively. Normally, the coverage of Type I structure is much smaller than Type II and can be seen as small domains surrounded by Type II structure. In comparison with the typical step edges oriented in the substrate [100] directions, it appears that in both types of structures the bipyridinium groups are parallel to the [100] directions, however the orientations of the DPV stacking chains as a whole in the two structures are different. The dominant Type II stripe has a structure similar to the DPV stripes at step edges, therefore it is also parallel to the [100] directions of the Cl rows underneath (Figs. 6.10a,b). On the other hand, the Type I stripe propagation direction encloses a characteristic angle of α = 200 ± 10 with one of the main symmetry axes of the chloride lattice (Fig. 6.8b). Therefore, we propose structure models for both Type I and Type II that assume DPV entities being adsorbed in a so‐called ‘edge‐on’ geometry with the molecular N–N‐axes parallel to the surface (Fig. 6.9). And since the preferential adsorption and orientation of DPV molecules at [100] oriented step edges even with very low DPV containing concentration is already known, we expect a higher electrochemical stability of Type II than that of Type I.
Figure 6.9: Preliminary structure models of both types of the DPV stacking phase.

DPV adsorption on chloride modified Cu(100)
121
The explanation for the presence of two stacking DPV structures in comparison to only one stacking phase of DBV adsorption takes into account their different conformations with respect to the chloride lattice. As mentioned above, the inter‐DPV‐chain distance amounts to d = 1.88 nm and that of DBV is only 1.82 nm (see Sec. 5.3.2) fitting well with the length of the molecules of 1.77 nm and 1.55 nm, respectively (Fig. 4.5), while the NND of the underlying chloride lattice is 0.362 nm. Therefore the distance between two DBV stripes is almost perfectly 5 times as much as the NND of the chloride lattice while that distance of DPV stripes is longer than the length of 5 adjacent chloride lattice atoms. Obviously, for the stacking phases the DBV stripes fit better with respect to the chloride lattice than the DPV ones explaining that the ordering of the monolayer DBV stacking phase (see Fig. 5.20) is found much better than that of DPV. The stacked DPV monolayer is divided in small domains and even the stripes of the Type II phase are not perfectly parallel to one another as seen inside the white dotted circle in Fig. 6.10. This imperfectly‐ordered stacking phase structure is typical for DPV adsorption on the chloride modified Cu(100) substrate.
Figure 6.10: DPV stacking structures and the phase transition from Type I structure to more stable Type II phase upon passing P1, 50 x 50 nm, It = 0.2 nA, Ub = 300 mV, (a) Type I presence, E = 0 mV; (b) Type II mono layer, E = ‐150 mV.
Fig. 6.10a shows the STM results of DPV stacking phases at an initial adsorption potential of 0 mV. The structure represents both Type I and Type II phase. The surface morphology is not perfectly‐ordered but is stable in the positive potential range before reaching the solution reduction peak P1 (P1max at about ‐120 mV). At the same area, passing P1, a phase transition only from Type I to Type II phase happens while surrounding Type II is still stable, forming a full monolayer of Type II stacking phase (Fig. 6.10b). Once transformed to Type II phase, the structure is stable even when scanning the potential back to the very positive regime above P’1. That means

DPV adsorption on chloride modified Cu(100)
122
this transition is irreversible and as expected the Type II phase has a higher electrochemical stability than the Type I stacking. After obtaining a full monolayer of Type II stacking phase, the surface morphology keeps stable in a broad regime from the onset of CDR as positive limit to the potential below P1 at ‐250 mV as negative limit.
As mentioned in the previous CV part, the potential value of ‐250 mV is critical in that it causes even a dramatic change of the reductive reaction peak system P1/P’1, which raises the question of what happens to the morphology of the DPV adsorption layer.
Figure 6.11: Potential‐dependent series of STM images showing the structural change of the DPV stacking phase at potentials below ‐250 mV, (a)‐(c) It = 0.2 nA, Ub = 300 mV, the in‐set in (c) represents an enlargement of (c) showing the preferred second‐layer adsorption of reduced DPV species in the ‘darker’ grooves of the DPV stacking monolayer phase
Fig. 6.11 shows the surface morphology of the DPV adlayer as a function of on‐going potential changes to more and more negative potentials below ‐250 mV. At ‐240 mV (Fig. 6.11a), the DPV adlayer is still a full monolayer of Type II phase,

DPV adsorption on chloride modified Cu(100)
123
however when passing ‐250 mV, many bright dots on top of the previous Type II phase start to appear as indicated by white arrows in Fig. 6.11b. The lower the potential, the more dots appear. The in‐set in Fig. 6.11c represents a zoom‐in area of the surface, showing more details of these dots concerning their concentration, size and position on top of the previous DPV stacking monolayer phase. Obviously, the size of the dots is equal to the width of one DPV chain, and all dots stay in the darker grooves or the space between two adjacent DPV chains underneath. Therefore, these dots are assigned to be new reduced DPV•+ species adsorbed on top of the stable DPV stacking monolayer phase starting to form the second layer, and the preferred place of new second layer DPV•+ species is between DPV chains of the first layer. Fig. 6.11c also reveals an area indicated by a white arrow where there is a change of surface morphology in spite of the unchanged structure. That area denotes the formation of other reduced DPV chains above the first layer with the same structure as building blocks for the second layer. It is worth noting that in the STM image of Fig. 6.11c, the second layer area (marked by arrow) is on the down step terrace where the effect
Figure 6.12: (a) Mono‐atomically high step edge, (b) Periodicity of the stripe pattern in the full monolayer, (c) Periodicity of the stripe pattern in the sub‐monolayer regime, It = 0.2 nA, Ub = 300 mV, (d) Cross sections along the white lines in (a)‐(c).

DPV adsorption on chloride modified Cu(100)
124
of STM tip‐removal is much less than on the upper one. Thus, it is supposed that at this potential the second DPV stacking adlayer should already grow to a full layer, but due to the STM tip‐removal effect at the higher terrace step the new DPV•+ species cannot easily adsorb and the surface morphology cannot be imaged accurately in comparison with lower steps or surrounding areas. Fig. 6.11d shows only stripes in the second layer, but unfortunately due to the chloride desorption starting from the potential value of ‐330 mV, this double layer just appears as sub‐layer.
The reduced DPV double layer can explain the change and shift of the peak system P1/P’1 of CV2 in Fig. 6.2. After passing ‐250 mV, the formation of the double layer on the surface leads to reconstruction of the structure of the interface layer (Fig. 6.4) enforcing the reduction or oxidation process of DPV molecules from solution to occur through this overlayer. Following the CV2 of Fig. 6.2, after passing ‐250 mV, even if the cathodic limit is set back to ‐250 mV, the peak pair P1/P’1 is stable and in steady state. Therefore, the DPV double layer is assumed to remain stable in a broad potential regime unless reaching the chloride desorption regime at negative potentials or CDR at positive ones.
Figure 6.13: Side view structure models of the double layer DPV stacking phase.
Upon chloride desorption starting at a potential value of ‐330 mV towards negative potentials near the HER, the double layer decays step by step, revealing the bare surface underneath (Figs. 6.11d and 6.12a‐c). This process actually provides more insight into the double layer structure. If reduced DPV adsorbs as a full double layer, the STM results show a surface morphology similar to the Type II stacking phase (Fig. 6.12b). Therefore it is difficult to conclude on the double layer structure. However, while decaying during the chloride desorption process (Fig. 6.12c), in comparison with the bare surface makes clear that the imaged DPV chains of this structure are twice as high as a single chain of the Type II monolayer phase (see

DPV adsorption on chloride modified Cu(100)
125
corrugation in Fig. 6.12d). In correlation with the height of an atomic step, obviously, the DPV stacking chains along the white line in Fig. 6.12c stay on top of the first DPV stacking layer underneath. Fig. 6.12c also shows besides the top bright DPV chains blurry grooves which are definitely not bare surface but underlying DPV chains. In fact, as seen in Fig. 6.12d, the down DPV chains are showing up as side shoulders of the maxima in profile 3. Therefore, it is concluded that the surface morphology of the double layer structure is almost the copy of the first DPV adlayer with only a very slight change and shift. After all, a structure model of the reduced DPV+• double layer structure is proposed in Fig. 6.13.
6.4 Chloride desorption/readsorption
Previous STM studies already gave evidence for the decaying of the DPV double layer stacking phase (Fig. 6.11d) if the electrode potential decreases below ‐330 mV in the negative direction and reaches P2 (CV3 of Fig. 6.2) at the onset of HER.
Figure 6.14: Potential‐dependent series of STM images showing the chloride desorption process of the double layer DPV stacking phase, (a)‐(f) It = 0.2 nA, Ub = 300 mV.
Fig. 6.14 represents more details in a potential dependent series of STM images showing the decaying process of the DPV double layer. The potential regime of this decaying process starts at potential of ‐330 mV and completes at about ‐400 mV. As

DPV adsorption on chloride modified Cu(100)
126
proved in part 5.4.2, also DBV adsorption on chloride modified Cu(100) showed a chloride desorption process in the potential regime from ‐320 mV to ‐430 mV (see Fig. 5.31). Therefore, in the similar potential regime, the decaying process of the DPV double layer stacking phase is also related to the chloride desorption process. However, in spite of an order/disorder phase transition in the case of DBV, the chloride desorption from the DPV covered surface results in a decaying process in which the DPV double adlayer phase is removed step by step from the surface revealing the bare substrate underneath (Figs. 6.14a‐f). Thus, in comparison with the CV in this regime (CV3 of Fig. 6.2), it can be reinforced that the peak P2 corresponds to the chloride desorption process.
The surface morphology of the DPV adlayer before chloride desorption (Fig. 6.14a) shows step egdes with the typical 900 step edges of the c(2 x 2)‐Cl lattice underneath (see Sec. 3.4.2 for more detail). However, during the chloride desorption process, not only the DPV stacking adlayer on terraces decays but also the straight step edges are removed gradually to become the step edges of the bare p(1 x 1)‐Cu substrate as indicated by arrows in Fig. 6.14f. That means the c(2 x 2)‐Cl template is lost causing the changes of the adsorbed viologen layers above, namely the disorder in the DPV phase or the total decaying of DPV layer.
Figs. 6.14c,d again prove the [100] oriented step edge being preferred for adsorption of DPV molecules as pointed out by the white arrow. The typical DPV stacking chains at step edges parallel to [100] direction seem to be stronger adsorbed and act as inhibitors even for the c(2 x 2)‐Cl desorption process.
Although in CV3 of Fig. 6.2 only the reduction peak P2 appeared without its oxidation peak (or very small at HER if at all), the chloride desorption phase transition, demonstrated by STM results, is a reversible process. Fig. 6.15 represents the readsorption process when scanned back towards in the positive potential regime. Beginning with the bare substrate at very negative potential, and going back to the positive regime, the c(2 x 2)‐Cl structure reappears together with the readsorption of DPV stacking chains. And the readsorbed DPV stacking phase is directly the stable double layer DPV structure (indicated by blurred chains aside the bright top ones). This process starts from step edges and defects, then spreading across the whole surface. It is worth noting that the process takes place at very low speed, starting at a potential value of ‐320 mV and completing at ‐110 mV, revealing a great hysteresis of ΔE = 210 mV, while the chloride readsorption process of DBV had a much smaller hysteresis of ΔE = 62 mV (see Sec. 5.2.1).
As mentioned in the CV part, by restricting the cathode potential limit to ‐500 mV, the CV3 of Fig. 6.2 shows surprisingly that the peak system P1/P’1 is now not the same as in CV2 but seems to be shifted back close to that of CV1 in respect to intensity and position. The low speed chloride re‐adsorption process with DPV can explain that phenomenon. With the scan speed for the CV of dE/dt = 10 mV s‐1 which is much

DPV adsorption on chloride modified Cu(100)
127
faster than the potential change of STM experiments, we suppose that until reaching the oxidation peak P’1, the surface is still not fully covered by the double layer DPV stacking phase or just fully covered by areas of both double layer and single layer phases. The interface region on the surface is somehow in between of a monolayer and a double layer DPV stacking phase. Therefore, in Fig. 6.2, the peak system P1/P’1 of CV3 is expected to appear in between of these of CV1 and CV2 with respect to intensity and position.
Figure 6.15: Potential‐dependent series of STM images showing the chloride readsorption process of the double layer DPV stacking phase, (a)‐(f) It = 0.2 nA, Ub = 300 mV.
With the low changing potential speed of STM experiments, the chloride readsorption process ends up with a fully‐covered DPV double layer phase at a potential value of ‐110 mV (Fig. 6.15e). And this structure then remains stable even when passing the oxidation peak P’1 to very positive potentials and even in a broad range of the Cu potential window.
6.5 Copper dissolution in the presence of the DPV adlayer
As discussed in the CV parts, the DPV layer has a strong impact on the CDR, i.e. the potential of the dissolution reaction is considerably shifted to higher potentials

DPV adsorption on chloride modified Cu(100)
128
(ΔE ≈ 60 mV) with respect to the CDR in the pure supporting electrolyte (see Fig. 6.1). That can be explained by the inhibiting effect of DPV on the CDR.
Figure 6.16: Potential‐dependent series of STM images at the on‐set of CDR, (a)‐(f) It = 0.2 nA, Ub = 300 mV.
Fig. 6.16 shows a potential dependent series of STM images at the on‐set of CDR, beginning with a full double layer of the stable DPV stacking phase (Fig. 6.16a). The copper dissolution reaction starts at the potential of +255 mV. It is worth to note that the copper dissolution reaction of a DBV covered surface started at the potential of just +120 mV (see Sec. 5.5). The huge difference of the inhibiting effect of the two molecules is related to the structural stability of the adsorption layers. At the on‐set of CDR on the chloride modified Cu(100) template, the structure of the DBV adlayer is the rather open dication DBV2+ cavitand phase, while the more active DPV molecules in the form of the radical cations DPV•+ form the double layer stacking phase which is much denser and particularly stable at step edges.
However, similar to the DBV case, at the on‐set of CDR, viologen molecules immediately re‐adsorb on the newly created Cu areas thereby maintaining an always full adlayer in spite of the strong Cu dissolution reaction taking place underneath. Because of the new adsorption of viologen during the Cu dissolution reaction, the surface morphology can change. As marked by arrows inside the white dotted circles of Figs 6.16a,d, the same structure of the DPV stacking Type II phase is observed but the detailed arrangements are different. Interestingly, at some areas, the new DPV

DPV adsorption on chloride modified Cu(100)
129
adsorption forms the less stable DPV stacking Type I phase as indicated by arrows in Figs. 6.16d,e. Obviously, the Cu dissolution reaction causes the removal of the stable DPV stacking phase above, then DPV molecules in solution readsorb to form the less stable stacking Type I phase.
6.6 Summary
In this chapter the studies of DPV adsorption on a chloride modified Cu(100) surface was presented, using also the combination of CV and EC‐STM methods.
The CV experiments indicate that there are 3 different reactions or phenomena taking place within the copper potential window:
‐ The first electron transfer reaction leading to the peak system P1/P’1 relates to the reduction/reoxidation between the dication DPV2+ and DPV•+ species in solution.
‐ After passing a critical potential value of ‐250 mV the peak system P1/P’1 increases and shifts to more positive potentials.
‐ The chloride desorption process related to the peak P2 in the HER regime.
The STM experiments provide complementary information about the corresponding surface structures and phase transitions related to these three processes.
With initial adsorption at high potential, surprisingly the DPV cannot be adsorbed and stabilized in its dicationic form on the chloride‐modified electrode surface. Instead, DPV2+ species instantaneously react to the corresponding radical cation DPV+• at the surface followed by the formation of a condensed (DPV+•)n stacking monolayer phase. A distinct structural characteristics of this DPV stacking phase is its typical behavior at step edges. There the DPV stacking chains are always preferentially oriented along the substrate [100] directions, forming typical double rows along the edges. Furthermore, two modifications of the DPV stacking monolayer phase are found on the terraces, namely Type I and Type II, for which detailed structural models have been proposed. Of the two structures, Type I is found to be less stable than the Type II phase, because by passing the first reduction peak P1, all Type I structure transforms into Type II, creating a homogeneous DPV stacking monolayer surface.
Upon scanning even further cathodically and passing the critical potential value of ‐250 mV, more DPV•+ species adsorb on the surface and form another DPV stacking layer, resulting in a stacking double layer phase. The DPV chains of the second layer are proved to lie on the troughs between two chains of the first stacking layer. Once

DPV adsorption on chloride modified Cu(100)
130
formed the double layer structure is stable on the surface in the whole copper potential window despite the occurrence of electron transfer reaction through it. The stability of the double layer phase is also the reason for the strong inhibition effect for the copper dissolution reaction (CDR), which is shifted to much more positive potentials.
Scanning even further in the negative direction until reaching the chloride desorption peak P2, the DPV double layer phase co‐desorbs together with the chloride leaving the bare substrate behind. This also explains that no inhibition effect is observed in the HER regime of the CV data. The co‐desorption process of chloride and the DPV double layer is found to be quasi‐reversible. However, the reverse phase transition for the readsorption of the double layer phase occurs at very slow speed, showing a great hysteresis of ΔE = 210 mV.