supporting report 5 water resources sub-sector development...
TRANSCRIPT

SUPPORTING REPORT 5 WATER RESOURCES SUB-SECTOR DEVELOPMENT PLAN

WATER RESOURCES SUB-SECTOR DEVELOPMENT PLAN
Water Resources Sub‐Sector Development Plan
SR5.2 Irrigation and Drainage Development PlanSR1.5.1 Existing Public Irrigation SchemeSR1.5.2 Supplementary Irrigation SchemeSR1.5.3 Dam Irrigation Scheme
SR5.1 Water Supply Development PlanSR5.1.1 Current Status of Water SupplySR5.1.2 Water Supply Development PlanSR5.1.3 Sanitation Development Plan
SR5.3 Other Sub‐SectorsSR5.3.1 Flood and Erosion Control and Inland Waterway NavigationSR5.3.2 Inland FisherySR5.3.3 Livestock
The Project for Review and Update of Nigeria National Water Resources Master Plan
Volume-5, SR3 (1)
Contents Page
SR 5.1 Water Supply and Sanitation Development Plan ............................................................ SR5-1
SR5.1.1 Current Status of Water Supply ........................................................................................ SR5-1 SR5.1.2 Water Supply Development Plan ...................................................................................... SR5-6 SR5.1.3 Sanitation Development Plan ............................................................................................ SR5-58
SR 5.2 Irrigation and Drainage Development Plan .................................................................... SR5-64
SR5.2.1 Existing Public Irrigation Scheme .................................................................................... SR5-64 SR5.2.2 Supplementary Irrigation Scheme ..................................................................................... SR5-85 SR5.2.3 Dam Irrigation Scheme ..................................................................................................... SR5-85
SR 5.3 Other Sub-Sectors .............................................................................................................. SR5-93
SR5.3.1 Flood and Erosion Control and Inland Waterway Navigation ............................................ SR5-93 SR5.3.2 Inland Fishery ..................................................................................................................... SR5-148 SR5.3.3 Livestock ............................................................................................................................ SR5-151

The Project for Review and Update of Nigeria National Water Resources Master Plan
Volume-5, SR5 (SR5-1)
SR5 WATER RESOURCES SUB-SECTOR DEVELOPMENT PLAN
SR5.1 Water Supply and Sanitation Development Plan
SR5.1.1 Current Status of Water Supply
(1) Existing Water Treatment Facility of Surface Water
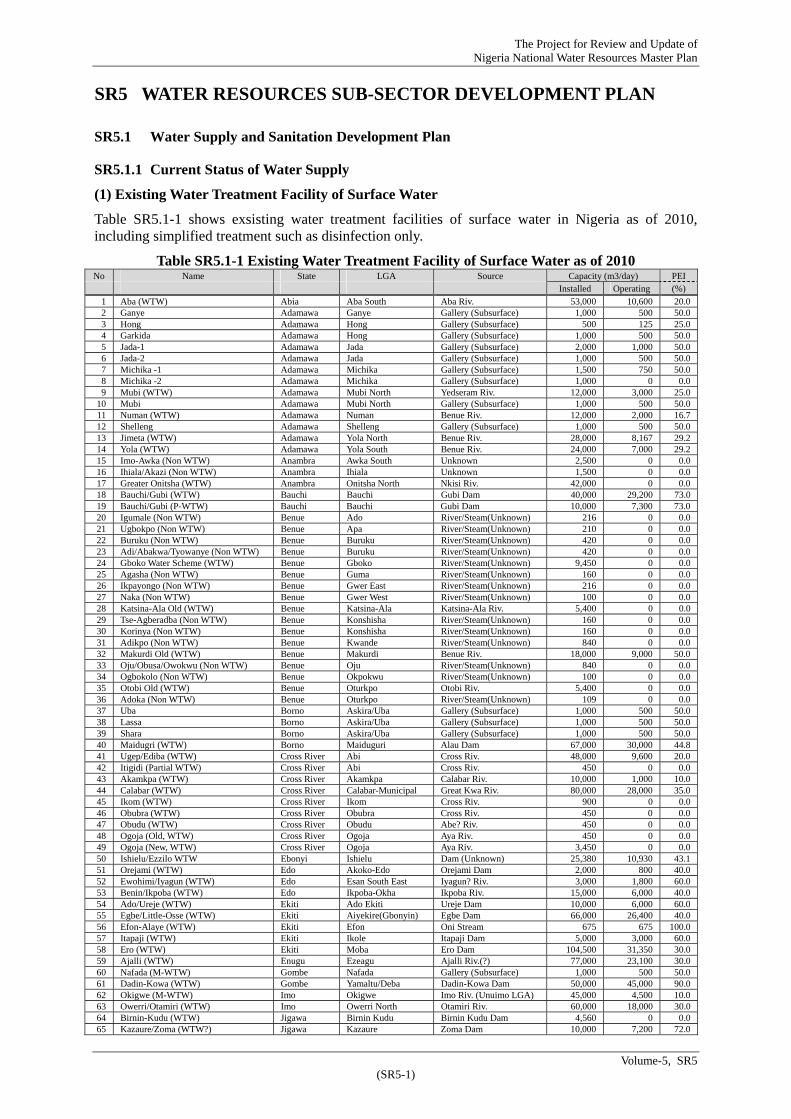
Table SR5.1-1 shows exsisting water treatment facilities of surface water in Nigeria as of 2010, including simplified treatment such as disinfection only.
Table SR5.1-1 Existing Water Treatment Facility of Surface Water as of 2010 No Name State LGA Source Capacity (m3/day) PEI Installed Operating (%)
1 Aba (WTW) Abia Aba South Aba Riv. 53,000 10,600 20.02 Ganye Adamawa Ganye Gallery (Subsurface) 1,000 500 50.03 Hong Adamawa Hong Gallery (Subsurface) 500 125 25.04 Garkida Adamawa Hong Gallery (Subsurface) 1,000 500 50.05 Jada-1 Adamawa Jada Gallery (Subsurface) 2,000 1,000 50.06 Jada-2 Adamawa Jada Gallery (Subsurface) 1,000 500 50.07 Michika -1 Adamawa Michika Gallery (Subsurface) 1,500 750 50.08 Michika -2 Adamawa Michika Gallery (Subsurface) 1,000 0 0.09 Mubi (WTW) Adamawa Mubi North Yedseram Riv. 12,000 3,000 25.0
10 Mubi Adamawa Mubi North Gallery (Subsurface) 1,000 500 50.011 Numan (WTW) Adamawa Numan Benue Riv. 12,000 2,000 16.712 Shelleng Adamawa Shelleng Gallery (Subsurface) 1,000 500 50.013 Jimeta (WTW) Adamawa Yola North Benue Riv. 28,000 8,167 29.214 Yola (WTW) Adamawa Yola South Benue Riv. 24,000 7,000 29.215 Imo-Awka (Non WTW) Anambra Awka South Unknown 2,500 0 0.016 Ihiala/Akazi (Non WTW) Anambra Ihiala Unknown 1,500 0 0.017 Greater Onitsha (WTW) Anambra Onitsha North Nkisi Riv. 42,000 0 0.018 Bauchi/Gubi (WTW) Bauchi Bauchi Gubi Dam 40,000 29,200 73.019 Bauchi/Gubi (P-WTW) Bauchi Bauchi Gubi Dam 10,000 7,300 73.020 Igumale (Non WTW) Benue Ado River/Steam(Unknown) 216 0 0.021 Ugbokpo (Non WTW) Benue Apa River/Steam(Unknown) 210 0 0.022 Buruku (Non WTW) Benue Buruku River/Steam(Unknown) 420 0 0.023 Adi/Abakwa/Tyowanye (Non WTW) Benue Buruku River/Steam(Unknown) 420 0 0.024 Gboko Water Scheme (WTW) Benue Gboko River/Steam(Unknown) 9,450 0 0.025 Agasha (Non WTW) Benue Guma River/Steam(Unknown) 160 0 0.026 Ikpayongo (Non WTW) Benue Gwer East River/Steam(Unknown) 216 0 0.027 Naka (Non WTW) Benue Gwer West River/Steam(Unknown) 100 0 0.028 Katsina-Ala Old (WTW) Benue Katsina-Ala Katsina-Ala Riv. 5,400 0 0.029 Tse-Agberadba (Non WTW) Benue Konshisha River/Steam(Unknown) 160 0 0.030 Korinya (Non WTW) Benue Konshisha River/Steam(Unknown) 160 0 0.031 Adikpo (Non WTW) Benue Kwande River/Steam(Unknown) 840 0 0.032 Makurdi Old (WTW) Benue Makurdi Benue Riv. 18,000 9,000 50.033 Oju/Obusa/Owokwu (Non WTW) Benue Oju River/Steam(Unknown) 840 0 0.034 Ogbokolo (Non WTW) Benue Okpokwu River/Steam(Unknown) 100 0 0.035 Otobi Old (WTW) Benue Oturkpo Otobi Riv. 5,400 0 0.036 Adoka (Non WTW) Benue Oturkpo River/Steam(Unknown) 109 0 0.037 Uba Borno Askira/Uba Gallery (Subsurface) 1,000 500 50.038 Lassa Borno Askira/Uba Gallery (Subsurface) 1,000 500 50.039 Shara Borno Askira/Uba Gallery (Subsurface) 1,000 500 50.040 Maidugri (WTW) Borno Maiduguri Alau Dam 67,000 30,000 44.841 Ugep/Ediba (WTW) Cross River Abi Cross Riv. 48,000 9,600 20.042 Itigidi (Partial WTW) Cross River Abi Cross Riv. 450 0 0.043 Akamkpa (WTW) Cross River Akamkpa Calabar Riv. 10,000 1,000 10.044 Calabar (WTW) Cross River Calabar-Municipal Great Kwa Riv. 80,000 28,000 35.045 Ikom (WTW) Cross River Ikom Cross Riv. 900 0 0.046 Obubra (WTW) Cross River Obubra Cross Riv. 450 0 0.047 Obudu (WTW) Cross River Obudu Abe? Riv. 450 0 0.048 Ogoja (Old, WTW) Cross River Ogoja Aya Riv. 450 0 0.049 Ogoja (New, WTW) Cross River Ogoja Aya Riv. 3,450 0 0.050 Ishielu/Ezzilo WTW Ebonyi Ishielu Dam (Unknown) 25,380 10,930 43.151 Orejami (WTW) Edo Akoko-Edo Orejami Dam 2,000 800 40.052 Ewohimi/Iyagun (WTW) Edo Esan South East Iyagun? Riv. 3,000 1,800 60.053 Benin/Ikpoba (WTW) Edo Ikpoba-Okha Ikpoba Riv. 15,000 6,000 40.054 Ado/Ureje (WTW) Ekiti Ado Ekiti Ureje Dam 10,000 6,000 60.055 Egbe/Little-Osse (WTW) Ekiti Aiyekire(Gbonyin) Egbe Dam 66,000 26,400 40.056 Efon-Alaye (WTW) Ekiti Efon Oni Stream 675 675 100.057 Itapaji (WTW) Ekiti Ikole Itapaji Dam 5,000 3,000 60.058 Ero (WTW) Ekiti Moba Ero Dam 104,500 31,350 30.059 Ajalli (WTW) Enugu Ezeagu Ajalli Riv.(?) 77,000 23,100 30.060 Nafada (M-WTW) Gombe Nafada Gallery (Subsurface) 1,000 500 50.061 Dadin-Kowa (WTW) Gombe Yamaltu/Deba Dadin-Kowa Dam 50,000 45,000 90.062 Okigwe (M-WTW) Imo Okigwe Imo Riv. (Unuimo LGA) 45,000 4,500 10.063 Owerri/Otamiri (WTW) Imo Owerri North Otamiri Riv. 60,000 18,000 30.064 Birnin-Kudu (WTW) Jigawa Birnin Kudu Birnin Kudu Dam 4,560 0 0.065 Kazaure/Zoma (WTW?) Jigawa Kazaure Zoma Dam 10,000 7,200 72.0

The Project for Review and Update of Nigeria National Water Resources Master Plan
Volume-5, SR5 (SR5-2)
No Name State LGA Source Capacity (m3/day) PEI Installed Operating (%) 66 Bagoma (WTW) Kaduna Birnin Gwari Bagoma Dam 2,600 917 35.367 Ikara (WTW) Kaduna Ikara Ikara(?) Dam 7,680 830 10.868 Kwoi (WTW) Kaduna Jaba Gurara Riv. 12,300 1,291 10.569 Kafanchan (WTW) Kaduna Jema'a River/Steam(Unknown) 13,200 9,100 68.970 Kaduna North/Old (WTW) Kaduna Kaduna North Kaduna Riv. 90,000 55,000 61.171 Kaduna North/New (WTW) Kaduna Kaduna North Kaduna Riv. 150,000 52,000 34.772 Kaduna South (WTW) Kaduna Kaduna South Kaduna Riv. 27,000 13,600 50.473 Saminaka (WTW) Kaduna Lere River/Steam(Unknown) 3,500 1,700 48.674 Zaria New (WTW) Kaduna Sabon-Gari Galma Dam 50,000 39,200 78.475 Zaria Old (WTW) Kaduna Zaria Galma Riv. 10,000 3,200 32.076 Chiromawa (P-WTW) Kano Bebeji Kano Riv. (Subsurface) 2,400 1,600 66.777 Watari Old (P-WTW) Kano Bichi Watari Dam 9,600 0 0.078 Joda (P?-WTW) Kano Gabasawa Hadejia Riv. 9,600 4,500 46.979 Kafin Chiri (P-WTW) Kano Garko Kafin Chiri Dam 4,800 4,800 100.080 Pada (Partial WTW) Kano Gwarzo Pada Dam 6,400 4,000 62.581 Mainika (Mobile-WTP) Kano Gwarzo Unknown 300 200 66.782 Guzu-Guzu (Disinfection) Kano Kabo Guzu-Guzu Dam 7,200 6,000 83.383 Magaga (P-WTW) Kano Kabo Magaga Dam 4,800 4,000 83.384 Kusalla (WTW) Kano Karaye Karaye Dam 15,000 12,500 83.385 G. Kano/Challawa1 (WTW) Kano Kumbotso Challawa Riv. 20,000 10,000 50.086 G. Kano/Challawa2 (WTW) Kano Kumbotso Challawa Riv. 90,000 66,000 73.387 G. Kano/Challawa3 (WTW) Kano Kumbotso Challawa Riv. 90,000 45,000 50.088 G. Kano/Tamburawa Old (WTW) Kano Kumbotso Kano Riv. (Subsurface) 20,000 0 0.089 Gari (P-WTW) Kano Kunchi Gari Dam 4,800 3,400 70.890 Kura (Mobile-WTP) Kano Kura Unknown 300 200 66.791 Tomas (P-WTW) Kano Makoda Tomas Dam 2,400 1,000 41.792 Tiga-Tiga & Tiga-Rano (Disinfection) Kano Rano Tiga Dam 9,600 3,600 37.593 Tudun Wada (P-WTW) Kano Tudun Wada Tudun Wada Dam 2,400 1,000 41.794 Wudil (WTW) Kano Wudil Wudil Riv. 20,000 13,000 65.095 Katsina/Ajiwa (WTW) Katsina Batagarawa Ajiwa Dam 50,000 37,500 75.096 Daura/Buja (WTW) Katsina Daura Sabke Dam 7,000 0 0.097 Dutsin-Ma (WTW) Katsina Dutsin-Ma Dutsin-Ma Dam 3,380 2,030 60.198 Zobe (WTW) Katsina Dutsin-Ma Zove Dam 80,000 0 0.099 Funtua/Mairua Old (WTW) Katsina Funtua Funtua Dam 5,000 1,300 26.0
100 Funtua/Mairua New (WTW) Katsina Funtua Funtua Dam 13,500 2,150 15.9101 Jibia (WTW) Katsina Jibia Jibia Dam 6,000 360 6.0102 Malumfashi (WTW) Katsina Malumfashi Malumfashi Dam 4,500 0 0.0103 Argungu (WTW) Kebbi Argungu Sokoto Riv. 8,000 6,500 81.3104 Birnin-Kebbi/Duku (WTW) Kebbi Birnin Kebbi Sokoto Riv. 61,000 36,000 59.0105 Yauri/Yelwa (WTW) Kebbi Yauri Niger Riv. 12,600 5,000 39.7106 Zuru (WTW) Kebbi Zuru Zuru Dam 6,200 4,000 64.5107 Ankpa (WTW) Kogi Ankpa Maboro Riv. 1,350 250 18.5108 Dekina (WTW) Kogi Dekina Iteme Riv. 3,375 2,250 66.7109 Aynigba (WTW) Kogi Dekina Ofu Riv. 2,500 100 4.0110 Idah (WTW) Kogi Idah Niger Riv. 13,500 6,750 50.0111 Lokoja Old (WTW) Kogi Lokoja Niger Riv. 3,500 2,500 71.4112 Ekuku (WTW) Kogi Okene Ekuku Dam 6,750 1,515 22.4113 Okene (WTW) Kogi Okene Okene Dam 2,250 757 33.6114 Abeju-Kolo (WTW) Kogi Omala Amala Riv. 3,375 1,591 47.1115 Isanlu (WTW) Kogi Yagba East Isanlu Dam 2,250 1,125 50.0116 Egbe (WTW) Kogi Yagba West Egbe Dam 1,350 150 11.1117 Ilorin/Agba Old (WTW) Kwara Ilorin East Agba Dam 4,500 2,250 50.0118 Ilorin/Agba New (WTW) Kwara Ilorin East Agba Dam 9,000 4,500 50.0119 Ilorin/Sobi Old (WTW) Kwara Ilorin East Sobi Dam 4,500 2,250 50.0120 Ilorin/Sobi New (WTW) Kwara Ilorin East Sobi Dam 4,500 2,250 50.0121 Ilorin/Asa (WTW) Kwara Illorin West Asa Dam 114,750 91,800 80.0122 Offa/Oyun (Old, WTW) Kwara Oyun Oyun Dam 4,500 3,600 80.0123 Offa/Oyun (New, WTW) Kwara Oyun Oyun Dam 15,750 12,600 80.0124 Adiyan (WTW) Lagos Ifako-Ijaye Ogun Riv.(Akute) 318,220 190,932 60.0125 Iju (WTW) Lagos Ifako-Ijaye Ogun Riv.(Akute) 204,570 153,428 75.0126 Isashi (WTW) Lagos Ojo Owo Riv. 18,184 0 0.0127 Keffi/Mada (WTW) Nasarawa Akwanga Mada Riv. 45,000 0 0.0128 Doma (WTW) Nasarawa Doma Doma Dam 9,000 7,200 80.0129 Lafia (WTW) Nasarawa Lafia River/Steam(Unknown) 13,500 8,100 60.0130 Nasarawa (WTW) Nasarawa Nasarawa Uke Riv. 2,250 0 0.0131 Nasarawa-Eggon (WTW) Nasarawa Nasarawa-Eggon Arikya Riv. 1,125 0 0.0132 Agaie (Package WTW) Niger Agaie River/Steam(Unknown) 3,270 0 0.0133 Bida (WTW) Niger Bida Mana (Gbako?) Riv. 27,000 10,800 40.0134 New Bussa (WTW) Niger Borgu Kainji Dam 10,000 2,400 24.0135 Chanchaga Old (WTW) Niger Bosso Gbako Riv. 2,250 1,350 60.0136 Chanchaga (WTW) Niger Bosso Gbako Riv. 77,000 51,200 66.5137 Bosso (Package WTW) Niger Bosso Bosso Dam 2,250 900 40.0138 Badeggi (Package WTW) Niger Katcha River/Steam(Unknown) 1,579 790 50.0139 Katcha (Package WTW) Niger Katcha River/Steam(Unknown) 1,123 0 0.0140 Kontagora (WTW) Niger Kontagora Kotagora (Matandi?) Dam 4,500 1,400 31.1141 Lapai (Package WTW) Niger Lapai River/Steam(Unknown) 3,250 0 0.0142 Suleja (WTW) Niger Suleja Suleja Dam 50,000 35,000 70.0143 Abeokuta Old (WTW) Ogun Abeokuta South Ogun Riv. 15,000 3,890 25.9144 Abeokuta New (WTW) Ogun Abeokuta South Ogun Riv. 82,000 37,060 45.2145 Ota Old (WTW) Ogun Ado-Odo/Ota River/Steam(Unknown) 2,450 0 0.0146 Ota New (WTW) Ogun Ado-Odo/Ota River/Steam(Unknown) 6,750 1,210 17.9147 Ilaro (Package WTW) Ogun Egbado South River/Steam(Unknown) 240 75 31.3

The Project for Review and Update of Nigeria National Water Resources Master Plan
Volume-5, SR5 (SR5-3)
No Name State LGA Source Capacity (m3/day) PEI Installed Operating (%) 148 Ajilete (Package WTW) Ogun Egbado South River/Steam(Unknown) 810 0 0.0149 Ifo Akinsede/Papalanto(WTW) Ogun Ifo River/Steam(Unknown) 12,000 6,000 50.0150 Itele (WTW) Ogun Ijebu East River/Steam(Unknown) 1,800 180 10.0151 Ijebu-Igbo/Apoje (WTW) Ogun Ijebu North Osun Riv. 18,500 9,250 50.0152 Ijebu-Ode/Yemoji (WTW) Ogun Ijebu Ode River/Steam(Unknown) 18,000 9,000 50.0153 Ogere (WTW) Ogun Ikenne River/Steam(Unknown) 6,700 3,350 50.0154 Imeko (WTW) Ogun Imeko-Afon River/Steam(Unknown) 2,400 315 13.1155 Owode-Egba (WTW) Ogun Obafemi-Owode River/Steam(Unknown) 1,700 0 0.0156 Abiji (WTW) Ogun Ogun Waterside River/Steam(Unknown) 1,800 30 1.7157 Akaka (WTW) Ogun Remo North River/Steam(Unknown) 1,800 0 0.0158 Shagamu (WTW) Ogun Shagamu River/Steam(Unknown) 6,500 0 0.0159 Awara (WTW) Ondo Akoko North East Awara Dam 1,800 600 33.3160 Owena/Ondo-Road (WTW) Ondo Idanre Owena Riv. 19,600 6,533 33.3161 Owena/Igbara-Oke (WTW) Ondo Ifedore Owena Riv. 5,450 1,817 33.3162 Okeigbo (WTW) Ondo Ile-Oluji-Okeigbo Oni Riv. 2,275 0 0.0163 Araromi-Obu (WTW?) Ondo Odigbo River/Steam(Unknown) 450 150 33.3164 Ido-Ani (WTW) Ondo Ose Ogbasa Riv. 990 330 33.3165 Ose Owo (WTW) Ondo Owo Ose Owo Dam 3,900 1,300 33.3166 Uso-Ogbese (WTW) Ondo Owo Ogbese Riv. 450 150 33.3167 Orile-Owu (Mini-WTW) Osun Aiyedade River/Steam(Unknown) 600 0 0.0168 Odeyinka (Mini-WTW) Osun Aiyedade River/Steam(Unknown) 300 0 0.0169 Ile-Ogbo/Kuta (Mini-WTW) Osun Aiyedire River/Steam(Unknown) 200 40 20.0170 Oluponna (Mini-WTW) Osun Aiyedire River/Steam(Unknown) 300 60 20.0171 Iperindo (Mini-WTW) Osun Atakumosa East River/Steam(Unknown) 300 0 0.0172 Ifewara (WTW?) Osun Atakumosa East River/Steam(Unknown) 420 150 35.7173 Ifewara (Mini-WTW) Osun Atakumosa West River/Steam(Unknown) 200 0 0.0174 Osu/Ilesha (Mini-WTW) Osun Atakumosa West River/Steam(Unknown) 1,800 0 0.0175 Igbajo (WTW?) Osun Boluwaduro River/Steam(Unknown) 1,800 450 25.0176 Otan/Iresi (Mini-WTW) Osun Boluwaduro River/Steam(Unknown) 600 120 20.0177 Igbajo/Oke-Irun (Mini-WTW) Osun Boluwaduro River/Steam(Unknown) 600 120 20.0178 Iree/Eripa (Mini-WTW) Osun Boripe River/Steam(Unknown) 600 120 20.0179 Ada (Mini-WTW) Osun Boripe River/Steam(Unknown) 200 40 20.0180 Ede/Old (WTW) Osun Ede North Ede Dam 9,000 0 0.0181 Ede/New (WTW) Osun Ede North Ede Dam 180,000 27,500 15.3182 Ejigbo (Mini-WTW) Osun Ejigbo River/Steam(Unknown) 2,400 480 20.0183 Ife-Odan (Mini-WTW) Osun Ejigbo River/Steam(Unknown) 300 0 0.0184 Mokuro (WTW?) Osun Ife East River/Steam(Unknown) 1,000 450 45.0185 Famia/Oyere (Mini-WTW) Osun Ife North River/Steam(Unknown) 200 0 0.0186 Alajue (Mini-WTW) Osun Ife North River/Steam(Unknown) 200 0 0.0187 Ifetedo (WTW?) Osun Ife South River/Steam(Unknown) 3,700 950 25.7188 Aye-Oba (Mini-WTW) Osun Ife South River/Steam(Unknown) 600 120 20.0189 Omifunfun (Mini-WTW) Osun Ife South River/Steam(Unknown) 600 0 0.0190 Mefoworade (Mini-WTW) Osun Ife South River/Steam(Unknown) 200 0 0.0191 Ora (Mini-WTW) Osun Ifedayo River/Steam(Unknown) 200 0 0.0192 Eko-Ende (WTW) Osun Ifelodun Eko-Ende Dam 12,000 2,000 16.7193 Dagbolu (Mini-WTW) Osun Ifelodun River/Steam(Unknown) 200 40 20.0194 Iba (Mini-WTW) Osun Ifelodun River/Steam(Unknown) 150 30 20.0195 Ila/Orangun (WTW?) Osun Ila River/Steam(Unknown) 2,200 380 17.3196 Ilesha (WTW) Osun Ilesha East Efon-Alaaye, Ekiti State 0 0 0.0197 Ibodi/Oscoed (Mini-WTW) Osun Ilesha East River/Steam(Unknown) 600 120 20.0198 Asejire (Mini-WTW) Osun Irewole River/Steam(Unknown) 1,200 0 0.0199 Iwo/Ayiba (WTW) Osun Iwo Ayiba Dam 9,080 2,500 27.5200 Esa-Odo (WTW) Osun Obokun Esa-Odo Dam 5,000 2,000 40.0201 Oyan (WTW?) Osun Odo-Otin River/Steam(Unknown) 230 0 0.0202 Okuku (Mini-WTW) Osun Odo-Otin River/Steam(Unknown) 600 120 20.0203 Igbaye (Mini-WTW) Osun Odo-Otin River/Steam(Unknown) 300 60 20.0204 Inisa (Mini-WTW) Osun Odo-Otin River/Steam(Unknown) 600 120 20.0205 Tootoo/Igere (Mini-WTW) Osun Ola-Oluwa River/Steam(Unknown) 200 40 20.0206 Ajagunlase (Mini-WTW) Osun Ola-Oluwa River/Steam(Unknown) 600 0 0.0207 Ikeji-Ile (WTW?) Osun Oriade River/Steam(Unknown) 2,200 750 34.1208 Esa-Oke (Mini-WTW) Osun Oriade River/Steam(Unknown) 200 40 20.0209 Iwara/Igangan (Mini-WTW) Osun Oriade River/Steam(Unknown) 300 0 0.0210 Ikeji-Arakeji (Mini-WTW) Osun Oriade River/Steam(Unknown) 300 0 0.0211 Oke-Osun/Abere (Mini-WTW) Osun Osogbo River/Steam(Unknown) 200 40 20.0212 Ibadan/Asejire (WTW) Oyo Egbeda Asejire Dam 186,000 28,249 15.2213 Ibadan/Osegere (WTW) Oyo Egbeda Asejire Dam 13,500 0 0.0214 Ibadan/Eleyele (WTW) Oyo Ibadan North West Eleyele Dam 27,240 3,668 13.5215 Eruwa (WTW) Oyo Ibarapa East Eruwa Dam 3,300 914 27.7216 Owode (WTW) Oyo Ido River/Steam(Unknown) 900 0 0.0217 Kishi (WTW) Oyo Irepo Kishi Dam 720 410 56.9218 Iseyin (WTW) Oyo Iseyin River/Steam(Unknown) 1,200 240 20.0219 Lalupon (Partial-WTW) Oyo Lagelu Osun Riv. 436 0 0.0220 Ogbomoso/Oba (WTW) Oyo Ogbomoso North Oba Dam 6,400 456 7.1221 Igbetti/Afowose (Partial-WTW) Oyo Olorunsogo Igbetti Dam 1,000 103 10.3222 Igboho/Sanya (WTW) Oyo Orelope Igboho Dam 1,000 26 2.6223 Oyo/Erelu (WTW) Oyo Oyo East Erelu Dam 7,500 754 10.1224 Ago Amodu (P-WTW) Oyo Saki East Ago Amodu Dam 500 32 6.4225 Saki/Fofo (WTW) Oyo Saki West Saki Dam 1,333 94 7.1226 Jos/Lamiga (WTW) Plateau Jos North Liberty Dam 18,000 0 0.0227 Bukuku/Yakubu-Gowon (WTW) Plateau Jos South Yakubu-Gowon Dam 90,000 45,000 50.0228 Langtang (WTW) Plateau Langtang North Langtang Dam 18,000 9,000 50.0229 Pankshin (WTW) Plateau Pankshin Pankshin Dam 4,500 2,250 50.0

The Project for Review and Update of Nigeria National Water Resources Master Plan
Volume-5, SR5 (SR5-4)
No Name State LGA Source Capacity (m3/day) PEI Installed Operating (%) 230 Sokoto Old (WTW) Sokoto Sokoto North Sokoto Riv. 54,000 24,000 44.4231 Sokoto New (WTW) Sokoto Sokoto North Sokoto Riv. 103,500 74,250 71.7232 Sokoto/Biwater (WTW) Sokoto Sokoto North Sokoto Riv. 27,000 15,750 58.3233 Gassol (P-WTW) Taraba Gassol Gellery (Subsurface) 450 0 0.0234 Ibi/Wukari (WTW) Taraba Ibi Benue Riv. 20,900 4,750 22.7235 Gembu (WTW) Taraba Sardauna Leme Riv. 1,980 950 48.0236 Fikyu (P-WTW) Taraba Ussa Gellery (Subsurface) 450 0 0.0237 Bantaji (M-WTW) Taraba Wukari Gellery (Subsurface) 450 350 77.8238 Gusau (WTW) Zamfara Gusau Gusau Dam 45,000 27,000 60.0239 Kaura Namoda (WTW) Zamfara Kaura Namoda Kaura Namoda Dam 1,350 743 55.0240 Maradun (P-WTW) Zamfara Maradun Bakolodi Dam 900 540 60.0241 Talata Mafara (P-WTW) Zamfara Talata Mafara Bakolodi Dam 1,125 0 0.0242 Abuja/Usuma1 (WTW) FCT Abuja Bwari Lower Usuma Dam 120,000 84,000 70.0243 Abuja/Usuma2 (WTW) FCT Abuja Bwari Lower Usuma Dam 120,000 84,000 70.0
4,239,776 1,915,820 45.2PEI: Production Efficiency Index WTW: Water Treatment Works P-WTW: Package WTW M-WTW: Mini/Micro WTW Source: State Governments and Agencies
(2) Existing Water Treatment Facility of Surface Water commenced between 2011 and 2012
Table SR5.1-2 shows the exsisting water treatment facilities of surface water, which were commenced between 2011 and 2012.
Table SR5.1-2 Existing Water Treatment Facility of Surface Water commenced between 2011 and 2012
No Name State LGA Source Capacity (m3/day) PEI Installed Operating (%)
1 Katsina-Ala New (WTW) Benue Katsina-Ala Katsina-Ala Riv. 15,000 11,000 73.32 Greater Makurdi New(WTW) Benue Makurdi Benue Riv. 100,000 25,000 25.03 Otobi New (WTW) Benue Oturkpo Otobi Riv. 15,000 10,000 66.74 Northern Ishan (WTW) Edo Esan Central Ugbalo Riv. 9,000 3,600 40.05 Watari New (P-WTW) Kano Bichi Watari Dam 75,000 30,000 40.06 G. Kano/Tamburawa New (WTW) Kano Kumbotso Kano Riv. 150,000 120,000 80.07 Mahuta (WTW) Kebbi Fakai Rafin Stamiya Riv. 1,000 450 45.08 Greater Lokoja (WTW) Kogi Ajaokuta Niger Riv. 45,000 20,000 44.49 Mangu (WTW) Plateau Mangu Mangu Dam 10,000 0 0.0 420,000 220,050 52.4
PEI: Production Efficiency Index WTW: Water Treatment Works P-WTW: Package WTW M-WTW: Mini/Micro WTW Source: State Governments and Agencies
(3) Ongoing or Planned Project of Water Treatment Facility of Surface Water as of 2013
Table SR5.1-3 shows ongoing or planned projects of water treatment facilities of surface water as of 2013, which will be basically included in the water supply development plan.

The Project for Review and Update of Nigeria National Water Resources Master Plan
Volume-5, SR5 (SR5-5)
Table SR5.1-3 Ongoing or Planned Projects of Water Treatment Facility of Surface Water as of 2013
No Name State LGA Source Design Capacity Remarks (m3/day)
1 Fufore (M-WTW) Adamawa Fufore Benue Riv. 5,000 Plan 2 Maiha (Gallery) Adamawa Maiha Gallery (Subsurface) 1,000 Plan 3 Mayo-Belwa Adamawa Mayo-Belwa Gallery (Subsurface) 1,000 Plan 4 Mubi North Adamawa Mubi North Gallery (Subsurface) 2,000 Plan 5 Shelleng (M-WTW) Adamawa Shelleng Kiri Dam 5,000 Plan 6 Toungo Adamawa Shelleng Gallery (Subsurface) 1,000 Plan 7 Yola (WTW) Adamawa Yola South Benue Riv. 68,800 Plan 8 Greater Awka (WTW) Anambra Awka South Mamu(Ezu) Riv. 100,000 Plan 9 Ihiala Regional (WTW) Anambra Ihiala Ntamili Riv. 43,000 Plan
10 Nnewi Regional (WTW) Anambra Nnewi North Ubor Riv. 82,000 Plan 11 Greater Onitsha (WTW) Anambra Onitsha North Niger Riv. 240,000 Ongoing 12 Bauchi/Gubi (WTW) Bauch Bauchi Waya Dam 20,000 Plan 13 Biu (WTW) Borno Biu Biu Dam 12,000 Plan 14 Maiduguri/Bulunkutu Borno Maiduguri Alau Dam 9,000 Plan 15 Itigidi (WTW) Cross River Abi Cross River 3,000 Plan 16 Ikom Phase-1 (WTW) Cross River Ikom Cross River 9,300 Plan 17 Ikom Phase-2 (WTW) Cross River Ikom Cross River 15,560 Plan 18 Obubra (WTW) Cross River Obubra Cross River 3,000 Plan 19 Obudu Phase-1 (WTW) Cross River Obudu Obudu Dam 3,000 Plan 20 Obudu Phase-2 (WTW) Cross River Obudu Obudu Dam 3,550 Plan 21 Ogoja Phase-1 (WTW) Cross River Ogoja Aya Riv. 8,144 Plan 22 Ogoja Phase-2 (WTW) Cross River Ogoja Aya Riv. 9,336 Plan 23 Okpoma (WTW) Cross River Yala Onwu Riv. 3,000 Plan 24 Oferekpe (WTW) Ebonyi Ikwo Cross River 100,000 Ongoing 25 Ohafia-Ukawu (WTW) Ebonyi Onicha Unknown 100,000 Ongoing 26 Ojirami (WTW) Edo Akoko-Edo Ojirami Dam 6,000 Ongoing 27 Efon-Alaye (WTW) Ekiti Efon Oni Stream 7,200 Ongoing 28 Itapaji (WTW) Ekiti Ikole Itapaji Dam 5,000 Plan 29 Ado/Ogbesse (WTW) Ekiti Ise/Orun Ogbesse Dam 84,000 Plan 30 Oji-River Regional (WTW) Enugu Oji-River Unknown 4,000 Plan 31 Balanga (WTW) Gombe Balanga Balanga 38,000 Plan 32 Dadin-Kowa (WTW) Gombe Yamaltu/Deba Dadin-Kowa 25,000 Plan 33 Kachia (WTW) Kaduna Kachia Unknown 11,000 Plan 34 Zaria (WTW) Kaduna Sabon-Gari Galma Dam 150,000 Plan 35 Chiromawa (WTW) Kano Bebeji Kano Riv. 7,200 Plan 36 Joda-1 (WTW) Kano Gabasawa Hadjia Riv. 7,200 Plan 37 Joda-2 (WTW) Kano Gabasawa Hadjia Riv. 90,000 Plan 38 Kafin Chiri (WTW) Kano Garko Kafin Chiri Dam 3,600 Plan 39 Guzu-Guzu (WTW) Kano Kabo Guzu-Guzu Dam 20,000 Plan 40 Challawa (WTW) Kano Karaye Challawa Riv. 67,667 Plan 41 Tamburawa New (WTW) Kano Kumbotso Kano Riv. 180,000 Plan 42 Gari Regional (P-WTW) Kano Kunchi Gari Dam 3,600 Plan 43 Madobi (P-WTW) Kano Madobi Tube well 12,000 Plan 44 Tomas Regional (WTW) Kano Makoda Tomas Dam 3,600 Plan 45 Tiga-Tiga & Tiga-Rano Regional (Disinfection) Kano Rano Tiga Dam 10,000 Plan 46 Tudun Wada (WTW) Kano Tudun Wada Tudun Wada Dam 3,600 Plan 47 Wudil New (WTW) Kano Wudil Wudil Riv. 90,000 Plan 48 Zobe Regional (WTW) Katsina Dutsin-Ma Zobe Dam 27,500 Plan 49 Yewa Phase-1 (WTW, Desalination) Lagos Badagry Yewa Riv. 227,300 Plan 50 Yewa Phase-2 (WTW, Desalination) Lagos Badagry Yewa Riv. 227,300 Plan 51 Otta Ikosi (WTW) Lagos Epe Aye Riv. 18,184 Ongoing 52 Odomola Phase-1 (WTW) Lagos Epe Osun Riv. 113,650 Plan 53 Odomola Phase-2 (WTW) Lagos Epe Osun Riv. 409,140 Plan 54 Odomola Phase-3 (WTW) Lagos Epe Osun Riv. 431,870 Plan 55 Adiyan-2 (WTW) Lagos Ifako-Ijaye Ogun Riv. 318,220 Plan 56 Adiyan-3 (WTW) Lagos Ifako-Ijaye Ogun Riv. 318,220 Plan 57 Ibesha (WTW, Desalination) Lagos Ikorodu Lagos Lagoon 227,300 Plan 58 Ishashi Expansion-1 (WTW) Lagos Ojo Owo Riv. 36,368 Plan 59 Ishashi Expansion-2 (WTW) Lagos Ojo Owo Riv. 104,558 Plan 60 Doma (WTW) Nasarawa Doma Doma Dam 29,000 Plan 61 Nasarawa (WTW) Nasarawa Nasarawa Uke Riv. 13,500 Plan 62 Agaie (P-WTW) Niger Agaie Unknown 3,000 Ongoing 63 Bida (P-WTW) Niger Bida Gbako Riv. 3,000 Ongoing 64 Gurara (P-WTW) Niger Gurara Gurara Riv. 3,000 Ongoing 65 Kontagora (P-WTW) Niger Kontagora Kontagora Dam 3,000 Ongoing 66 Lapai (P-WTW) Niger Lapai Unknown 3,000 Ongoing 67 Mokwa (WTW) Niger Mokwa River 3,000 Ongoing 68 Zungeru/Wushishi (WTW) Niger Wushishi Kaduna Riv. 4,500 Plan 69 Ota Old (WTW) Ogun Ado-Ado/Ota Unknown 2,450 Plan 70 Ota New (WTW) Ogun Ado-Ado/Ota Unknown 6,750 Plan 71 Yewa Regional-1 (WTW) Ogun Egbado South Yewa Riv. 100,000 Plan 72 Yewa Regional-2 (WTW) Ogun Egbado South Yewa Riv. 100,000 Plan 73 Apoje Regional-1 (WTW) Ogun Ijebu North Osun Riv. 200,000 Plan 74 Apoje Regional-2 (WTW) Ogun Ijebu North Osun Riv. 200,000 Plan 75 Mokoloki Regional Phase-1 (WTW) Ogun Obafemi-Owode Ogun Riv. 250,000 Plan 76 Mokoloki Regional Phase-2 (WTW) Ogun Obafemi-Owode Ogun Riv. 250,000 Plan 77 Mokoloki Regional Phase-3 (WTW) Ogun Obafemi-Owode Ogun Riv. 200,000 Plan 78 Awara (WTW) Ondo Akoko North East Awara Dam 4,500 Ongoing 79 Awara-Olyinmo (WTW) Ondo Akoko North West Dam 5,000 Plan 80 Owena Dam (WTW) Ondo Ile-Oluji-Okeigbo Owena Dam 60,000 Ongoing

The Project for Review and Update of Nigeria National Water Resources Master Plan
Volume-5, SR5 (SR5-6)
No Name State LGA Source Design Capacity Remarks (m3/day) 81 Ido-Ani (WTW) Ondo Ose Ogbasa Riv. 1,000 Ongoing 82 Ose Owo (WTW) Ondo Owo Ose Owo Dam 4,500 Ongoing 83 Ilesha (WTW) Osun Atakumosa West Unknown 60,000 Plan 84 Ife (WTW) Osun Ife Central Unknown 30,000 Plan 85 Afijio (WTW) Oyo Afijio Unknown 3,000 Plan 86 Akinyele (WTW) Oyo Akinyele Unknown 6,000 Plan 87 Ago-Are/Tede (WTW) Oyo Atigbo Dam 3,000 Plan 88 Ayete (WTW) Oyo Oyo Ayete Dam 3,000 Ongoing 89 Ido (WTW) Oyo Ido Unknown 5,000 Plan 90 Iganna (WTW) Oyo Iwajowa Unknown 3,000 Plan 91 Ilero (WTW) Oyo Kajola Ilrero Dam 3,000 Ongoing 92 Okeho (WTW) Oyo Kajola Okeho Dam 3,000 Plan 93 Lagelu (WTW) Oyo Lagelu Osun Riv. 8,000 Plan 94 Ogo Otuwa (WTW) Oyo Ogo Otuwa Unknown 2,000 Plan 95 Oluyole Oyo Oluyole Unknown 3,000 Plan 96 Ona-Ara (WTW) Oyo Ona-Ara Osun Riv. 8,000 Plan 97 Ibadan/Odedele-1 (WTW) Oyo Ona-Ara Odedele Dam (Osun Riv.) 120,000 Plan 98 Ibadan/Odedele-2 (WTW) Oyo Ona-Ara Odedele Dam (Osun Riv.) 120,000 Plan 99 Ibadan/Odedele-3 (WTW) Oyo Ona-Ara Odedele Dam (Osun Riv.) 120,000 Plan
100 Oriowo-Owode Oyo Oyo West Unknown 7,000 Plan 101 Surulere/Oko (WTW) Oyo Surulere Unknown 4,000 Plan 102 Jos/Barikin (WTW) Plateau Barikin Ladi New dam 43,750 Plan 103 Gembu (WTW) Taraba Sardauna Lemei Riv. 1,020 Plan 104 Takum/Kashimbilla (WTW) Taraba Takum Kashimbilla Dam 60,000 Plan 105 Fika/Gadaka (M-WTW) Yobe Fika Ngeji Riv. 4,000 Plan 106 Talata Mafara (WTW) Zamfara Talata Mafara Bakolodi Dam 45,000 Ongoing 107 Abaji (WTW) FCT Abuja Abaji Agena Riv. 5,000 Ongoing 108 Karshi (WTW) FCT Abuja Abuja Municipal (Amac) Unknown 3,000 Plan 109 Abuja/Usuma3 (WTW) FCT Abuja Bwari Lower Usuma & Gurara Dam 240,000 Ongoing 110 Abuja/Usuma4 (WTW) FCT Abuja Bwari Lower Usuma & Gurara Dam 240,000 Ongoing 111 Kuje (WTW) FCT Abuja Kuje Usuma Riv. 5,000 Plan 112 Kwali (WTW) FCT Abuja Kwali Bobo Riv. 3,000 Plan
6,745,937 WTW: Water Treatment Works P-WTW: Package WTW M-WTW: Mini/Micro WTW Source: State Governments and Agencies
SR5.1.2 Water Supply Development Plan
(1) Water Supply Development Plan
To meet the future water demand projected in the Project, the Project calculates state-wise water supply development for both hydrological balance and facility planning in the target year 2030, as shown in Table SR5.1-4 and Table SR5.1-5.
Figure SR5.1-1 shows demand and supply graph in water development plan in facility planning in each state.

The Project for Review and Update of Nigeria National Water Resources Master Plan
Volume-5, SR5 (SR5-7)
Table 5.1-4 Water Supply Development Plan for Hydrological Balance (1/6)
Scheme Category Existing Capacity Pre-MP Period MP Period Total(2010) (2011-2014) (2015-2030) (2030)
NationwideRehabilitation Urban, SU/ST (SW) 1,870 - 1,388 3,257
Urban, SU/ST (GW) 5,667 425 1,761 7,852 Rural (GW) 718 126 430 1,274 Sub-Total 8,254 551 3,578 12,383
Newly Urban, SU/ST (SW) 964 3,317 4,280 Construction Urban, SU/ST (GW) 1,109 4,449 5,558
Rural (GW) 379 1,276 1,655 Sub-Total 2,452 9,041 11,493
Total (MLD) 8,254 3,003 12,620 23,876 1. AbiaRehabilitation Urban, SU/ST (SW) 24 - 18 42
Urban, SU/ST (GW) 172 16 57 245 Rural (GW) 15 1 5 22 Sub-Total 211 17 81 309
Newly Urban, SU/ST (SW) - - - Construction Urban, SU/ST (GW) 35 126 161
Rural (GW) 6 19 24 Sub-Total 41 145 186
Total (MLD) 211 58 226 495 2. AdamawaRehabilitation Urban, SU/ST (SW) 39 - 30 69
Urban, SU/ST (GW) 10 0 1 11 Rural (GW) 11 0 2 13 Sub-Total 60 1 33 93
Newly Urban, SU/ST (SW) - 67 67 Construction Urban, SU/ST (GW) 39 136 175
Rural (GW) 15 48 62 Sub-Total 53 251 305
Total (MLD) 60 54 284 398 3. Akwa IbomRehabilitation Urban, SU/ST (SW) - - - -
Urban, SU/ST (GW) 204 33 122 360 Rural (GW) 20 6 19 45 Sub-Total 225 39 142 405
Newly Urban, SU/ST (SW) - - - Construction Urban, SU/ST (GW) 33 122 156
Rural (GW) 10 35 45 Sub-Total 44 157 201
Total (MLD) 225 82 299 606 4. AnambraRehabilitation Urban, SU/ST (SW) - - - -
Urban, SU/ST (GW) 147 7 42 196 Rural (GW) 10 1 3 15 Sub-Total 157 8 45 211
Newly Urban, SU/ST (SW) - 372 372 Construction Urban, SU/ST (GW) 12 74 86
Rural (GW) 11 35 45 Sub-Total 23 480 503
Total (MLD) 157 31 526 714 5. BauchiRehabilitation Urban, SU/ST (SW) 23 - 17 40
Urban, SU/ST (GW) 132 24 88 244 Rural (GW) 19 4 13 35 Sub-Total 174 28 118 320
Newly Urban, SU/ST (SW) - 16 16 Construction Urban, SU/ST (GW) 41 147 188
Rural (GW) 22 72 93 Sub-Total 62 235 297
Total (MLD) 174 91 352 617 6. BayelsaRehabilitation Urban, SU/ST (SW) - - - -
Urban, SU/ST (GW) 3 1 3 8 Rural (GW) 6 2 7 14 Sub-Total 9 3 10 22
Newly Urban, SU/ST (SW) - - - Construction Urban, SU/ST (GW) 57 185 242
Rural (GW) 3 8 11 Sub-Total 60 193 253
Total (MLD) 9 63 203 275

The Project for Review and Update of Nigeria National Water Resources Master Plan
Volume-5, SR5 (SR5-8)
Table 5.1-4 Water Supply Development Plan for Hydrological Balance (2/6)
Table 5.1-4 Water Supply Development Plan for Hydrological Balance (3/6)
Scheme Category Existing Capacity Pre-MP Period MP Period Total(2010) (2011-2014) (2015-2030) (2030)
7. BenueRehabilitation Urban, SU/ST (SW) 17 - 13 31
Urban, SU/ST (GW) 157 13 60 230 Rural (GW) 28 6 19 53 Sub-Total 202 19 92 313
Newly Urban, SU/ST (SW) 104 - 104 Construction Urban, SU/ST (GW) 13 60 73
Rural (GW) 14 47 61 Sub-Total 131 107 239
Total (MLD) 202 150 200 552 8. BornoRehabilitation Urban, SU/ST (SW) 32 - 24 56
Urban, SU/ST (GW) 151 8 30 189 Rural (GW) 16 1 3 20 Sub-Total 199 9 57 265
Newly Urban, SU/ST (SW) - 17 17 Construction Urban, SU/ST (GW) 54 198 253
Rural (GW) 18 60 78 Sub-Total 72 276 348
Total (MLD) 199 81 333 613 9. Cross RiverRehabilitation Urban, SU/ST (SW) 62 - 48 110
Urban, SU/ST (GW) 38 12 48 99 Rural (GW) 6 8 24 38 Sub-Total 107 20 121 247
Newly Urban, SU/ST (SW) - 46 46 Construction Urban, SU/ST (GW) 12 48 61
Rural (GW) 8 24 32 Sub-Total 20 119 139
Total (MLD) 107 39 240 386 10. DeltaRehabilitation Urban, SU/ST (SW) - - - -
Urban, SU/ST (GW) 171 58 198 427 Rural (GW) 18 6 21 45 Sub-Total 189 64 219 472
Newly Urban, SU/ST (SW) - - - Construction Urban, SU/ST (GW) 47 162 209
Rural (GW) 7 25 32 Sub-Total 55 186 241
Total (MLD) 189 119 406 713 11. EbonyiRehabilitation Urban, SU/ST (SW) 11 - 9 20
Urban, SU/ST (GW) 64 - - 64 Rural (GW) 13 1 3 17 Sub-Total 88 1 12 101
Newly Urban, SU/ST (SW) 131 - 131 Construction Urban, SU/ST (GW) - - -
Rural (GW) 9 29 37 Sub-Total 140 29 168
Total (MLD) 88 141 40 270 12. EdoRehabilitation Urban, SU/ST (SW) 9 - 7 16
Urban, SU/ST (GW) 247 - - 247 Rural (GW) 10 0 2 12 Sub-Total 266 0 9 275
Newly Urban, SU/ST (SW) 7 5 12 Construction Urban, SU/ST (GW) 43 169 212
Rural (GW) 10 32 42 Sub-Total 60 206 266
Total (MLD) 266 61 214 541 13. EkitiRehabilitation Urban, SU/ST (SW) 84 - 64 148
Urban, SU/ST (GW) 50 3 29 83 Rural (GW) 16 4 12 31 Sub-Total 150 7 105 262
Newly Urban, SU/ST (SW) 6 71 77 Construction Urban, SU/ST (GW) 3 29 33
Rural (GW) 4 12 16 Sub-Total 13 113 126
Total (MLD) 150 20 218 388

The Project for Review and Update of Nigeria National Water Resources Master Plan
Volume-5, SR5 (SR5-9)
Table 5.1-4 Water Supply Development Plan for Hydrological Balance (4/6)
Scheme Category Existing Capacity Pre-MP Period MP Period Total(2010) (2011-2014) (2015-2030) (2030)
14. EnuguRehabilitation Urban, SU/ST (SW) 35 - 27 62
Urban, SU/ST (GW) 34 5 17 56 Rural (GW) 10 2 5 16 Sub-Total 78 7 49 134
Newly Urban, SU/ST (SW) - 3 3 Construction Urban, SU/ST (GW) 82 273 355
Rural (GW) 10 32 42 Sub-Total 92 308 400
Total (MLD) 78 99 357 534 15. GombeRehabilitation Urban, SU/ST (SW) 23 - 18 41
Urban, SU/ST (GW) 36 9 35 80 Rural (GW) 8 2 7 17 Sub-Total 67 11 60 138
Newly Urban, SU/ST (SW) - 50 50 Construction Urban, SU/ST (GW) 19 71 90
Rural (GW) 9 31 40 Sub-Total 28 152 181
Total (MLD) 67 40 212 319 16. ImoRehabilitation Urban, SU/ST (SW) 47 - 37 84
Urban, SU/ST (GW) 88 8 29 125 Rural (GW) 20 2 7 29 Sub-Total 155 10 72 238
Newly Urban, SU/ST (SW) - - - Construction Urban, SU/ST (GW) 71 249 320
Rural (GW) 14 46 60 Sub-Total 85 295 380
Total (MLD) 155 95 368 618 17. JigawaRehabilitation Urban, SU/ST (SW) 7 - 2 8
Urban, SU/ST (GW) 217 3 12 232 Rural (GW) 41 4 13 58 Sub-Total 265 7 27 298
Newly Urban, SU/ST (SW) - - - Construction Urban, SU/ST (GW) 50 187 237
Rural (GW) 9 32 41 Sub-Total 60 218 278
Total (MLD) 265 66 245 576 18. KadunaRehabilitation Urban, SU/ST (SW) 166 - 128 293
Urban, SU/ST (GW) 174 6 50 229 Rural (GW) 55 10 36 101 Sub-Total 394 16 213 622
Newly Urban, SU/ST (SW) - 129 129 Construction Urban, SU/ST (GW) 6 50 55
Rural (GW) 10 36 46 Sub-Total 16 214 230
Total (MLD) 394 31 427 852 19. KanoRehabilitation Urban, SU/ST (SW) 136 - 102 238
Urban, SU/ST (GW) 453 17 145 615 Rural (GW) 39 4 13 56 Sub-Total 629 20 260 909
Newly Urban, SU/ST (SW) 152 383 534 Construction Urban, SU/ST (GW) 17 145 162
Rural (GW) 31 105 136 Sub-Total 199 633 832
Total (MLD) 629 220 893 1,741 20. KatsinaRehabilitation Urban, SU/ST (SW) 72 - 42 114
Urban, SU/ST (GW) 81 9 30 119 Rural (GW) 33 4 13 50 Sub-Total 186 13 85 284
Newly Urban, SU/ST (SW) - 22 22 Construction Urban, SU/ST (GW) 85 293 378
Rural (GW) 20 67 87 Sub-Total 105 382 487
Total (MLD) 186 117 467 770

The Project for Review and Update of Nigeria National Water Resources Master Plan
Volume-5, SR5 (SR5-10)
Table 5.1-4 Water Supply Development Plan for Hydrological Balance (5/6)
Scheme Category Existing Capacity Pre-MP Period MP Period Total(2010) (2011-2014) (2015-2030) (2030)
21. KebbiRehabilitation Urban, SU/ST (SW) 40 - 31 70
Urban, SU/ST (GW) 55 14 50 119 Rural (GW) 19 5 17 41 Sub-Total 114 19 98 231
Newly Urban, SU/ST (SW) 1 - 1 Construction Urban, SU/ST (GW) 30 108 138
Rural (GW) 11 36 46 Sub-Total 42 143 185
Total (MLD) 114 61 241 416 22. KogiRehabilitation Urban, SU/ST (SW) 18 - 14 32
Urban, SU/ST (GW) 79 17 61 157 Rural (GW) 14 3 11 28 Sub-Total 111 21 86 217
Newly Urban, SU/ST (SW) 36 - 36 Construction Urban, SU/ST (GW) 40 139 179
Rural (GW) 10 32 42 Sub-Total 85 171 256
Total (MLD) 111 106 257 473 23. KwaraRehabilitation Urban, SU/ST (SW) 71 - 55 126
Urban, SU/ST (GW) 64 11 43 118 Rural (GW) 16 3 10 29 Sub-Total 151 14 108 273
Newly Urban, SU/ST (SW) - - - Construction Urban, SU/ST (GW) 15 61 76
Rural (GW) 3 12 15 Sub-Total 19 72 91
Total (MLD) 151 32 181 364 24. LagosRehabilitation Urban, SU/ST (SW) 244 - 188 433
Urban, SU/ST (GW) 1,145 - - 1,145 Rural (GW) 8 1 4 13 Sub-Total 1,397 1 192 1,591
Newly Urban, SU/ST (SW) 15 1,323 1,338 Construction Urban, SU/ST (GW) - - -
Rural (GW) 1 4 6 Sub-Total 16 1,327 1,343
Total (MLD) 1,397 17 1,519 2,934 25. NasarawaRehabilitation Urban, SU/ST (SW) 29 - 20 49
Urban, SU/ST (GW) 48 9 38 95 Rural (GW) 10 3 10 23 Sub-Total 87 12 68 167
Newly Urban, SU/ST (SW) - 34 34 Construction Urban, SU/ST (GW) 9 38 47
Rural (GW) 4 14 19 Sub-Total 14 86 100
Total (MLD) 87 26 154 267 26. NigerRehabilitation Urban, SU/ST (SW) 82 - 63 146
Urban, SU/ST (GW) 140 16 72 228 Rural (GW) 31 4 16 51 Sub-Total 253 21 151 425
Newly Urban, SU/ST (SW) 14 4 18 Construction Urban, SU/ST (GW) 19 84 103
Rural (GW) 10 35 45 Sub-Total 44 123 167
Total (MLD) 253 65 274 592 27. OgunRehabilitation Urban, SU/ST (SW) 79 - 61 139
Urban, SU/ST (GW) 225 - - 225 Rural (GW) 15 3 9 26 Sub-Total 319 3 69 391
Newly Urban, SU/ST (SW) 5 272 277 Construction Urban, SU/ST (GW) - - -
Rural (GW) 9 30 38 Sub-Total 14 302 316
Total (MLD) 319 17 371 707

The Project for Review and Update of Nigeria National Water Resources Master Plan
Volume-5, SR5 (SR5-11)
Table 5.1-4 Water Supply Development Plan for Hydrological Balance (6/6)
Scheme Category Existing Capacity Pre-MP Period MP Period Total(2010) (2011-2014) (2015-2030) (2030)
28. OndoRehabilitation Urban, SU/ST (SW) 16 - 12 28
Urban, SU/ST (GW) 157 15 63 235 Rural (GW) 24 6 19 49 Sub-Total 197 20 94 311
Newly Urban, SU/ST (SW) 56 4 60 Construction Urban, SU/ST (GW) 15 63 77
Rural (GW) 9 29 37 Sub-Total 79 96 175
Total (MLD) 197 100 189 486 29. OsunRehabilitation Urban, SU/ST (SW) 110 - 84 194
Urban, SU/ST (GW) 115 3 36 154 Rural (GW) 33 5 19 57 Sub-Total 258 8 139 406
Newly Urban, SU/ST (SW) - 72 72 Construction Urban, SU/ST (GW) 3 36 39
Rural (GW) 5 19 24 Sub-Total 8 127 135
Total (MLD) 258 17 266 541 30. OyoRehabilitation Urban, SU/ST (SW) 113 - 87 201
Urban, SU/ST (GW) 299 - - 299 Rural (GW) 45 6 24 75 Sub-Total 458 6 111 575
Newly Urban, SU/ST (SW) 5 331 336 Construction Urban, SU/ST (GW) - - -
Rural (GW) 10 38 48 Sub-Total 15 368 383
Total (MLD) 458 21 479 959 31. PlateauRehabilitation Urban, SU/ST (SW) 56 - 14 70
Urban, SU/ST (GW) 59 12 42 112 Rural (GW) 9 2 7 18 Sub-Total 123 14 63 200
Newly Urban, SU/ST (SW) 8 35 43 Construction Urban, SU/ST (GW) 26 94 120
Rural (GW) 14 45 59 Sub-Total 48 174 222
Total (MLD) 123 62 237 422 32. RiversRehabilitation Urban, SU/ST (SW) - - - -
Urban, SU/ST (GW) 329 48 172 548 Rural (GW) 26 4 14 43 Sub-Total 355 51 185 591
Newly Urban, SU/ST (SW) - - - Construction Urban, SU/ST (GW) 79 285 364
Rural (GW) 13 46 59 Sub-Total 92 331 423
Total (MLD) 355 144 516 1,014 33. SokotoRehabilitation Urban, SU/ST (SW) 83 - 64 148
Urban, SU/ST (GW) 88 18 72 179 Rural (GW) 25 7 24 57 Sub-Total 197 26 161 384
Newly Urban, SU/ST (SW) - - - Construction Urban, SU/ST (GW) 18 72 91
Rural (GW) 7 24 32 Sub-Total 26 97 122
Total (MLD) 197 51 258 506 34. TarabaRehabilitation Urban, SU/ST (SW) 11 - 8 19
Urban, SU/ST (GW) 22 1 4 28 Rural (GW) 6 0 1 8 Sub-Total 39 2 14 55
Newly Urban, SU/ST (SW) - 49 49 Construction Urban, SU/ST (GW) 30 107 138
Rural (GW) 12 38 49 Sub-Total 42 194 236
Total (MLD) 39 44 208 291

The Project for Review and Update of Nigeria National Water Resources Master Plan
Volume-5, SR5 (SR5-12)
Source: JICA Project Team
Scheme Category Existing Capacity Pre-MP Period MP Period Total(2010) (2011-2014) (2015-2030) (2030)
35. YobeRehabilitation Urban, SU/ST (SW) - - - -
Urban, SU/ST (GW) 71 15 51 136 Rural (GW) 13 3 9 25 Sub-Total 84 17 60 161
Newly Urban, SU/ST (SW) - 3 3 Construction Urban, SU/ST (GW) 28 99 127
Rural (GW) 8 28 36 Sub-Total 37 130 166
Total (MLD) 84 54 190 327 36. ZamfaraRehabilitation Urban, SU/ST (SW) 22 - 17 39
Urban, SU/ST (GW) 124 9 40 174 Rural (GW) 24 2 8 35 Sub-Total 171 12 65 247
Newly Urban, SU/ST (SW) 36 - 36 Construction Urban, SU/ST (GW) 16 68 84
Rural (GW) 12 41 53 Sub-Total 64 109 173
Total (MLD) 171 76 174 420 37. FCT AbujaRehabilitation Urban, SU/ST (SW) 108 - 84 192
Urban, SU/ST (GW) 20 3 20 42 Rural (GW) 2 1 2 5 Sub-Total 130 3 106 239
Newly Urban, SU/ST (SW) 388 9 397 Construction Urban, SU/ST (GW) 59 470 529
Rural (GW) 3 13 16 Sub-Total 450 492 942
Total (MLD) 130 453 598 1,182

The Project for Review and Update of Nigeria National Water Resources Master Plan
Volume-5, SR5 (SR5-13)
Table 5.1-5 Water Supply Development Plan for Facility Planning /Installed Capacity (1/6)
Scheme Category Existing Capacity Pre-CMP Period CMP Period Total(2010) (2011-2014) (2015-2030) (2030)
NationwideRehabilitation Urban, SU/ST (SW) 1,870 - 1,388 3,257
Urban, SU/ST (GW) 5,667 425 1,761 7,852 Rural (GW) 718 126 430 1,274 Sub-Total 8,254 551 3,578 12,383
Newly Urban, SU/ST (SW) 1,204 4,146 5,350 Construction Urban, SU/ST (GW) 1,386 5,561 6,947
Rural (GW) 474 1,595 2,069 Sub-Total 3,065 11,302 14,367
Total (MLD) 8,254 3,616 14,880 26,750 1. AbiaRehabilitation Urban, SU/ST (SW) 24 - 18 42
Urban, SU/ST (GW) 172 16 57 245 Rural (GW) 15 1 5 22 Sub-Total 211 17 81 309
Newly Urban, SU/ST (SW) - - - Construction Urban, SU/ST (GW) 44 158 202
Rural (GW) 7 24 30 Sub-Total 51 181 232
Total (MLD) 211 68 262 542 2. AdamawaRehabilitation Urban, SU/ST (SW) 39 - 30 69
Urban, SU/ST (GW) 10 0 1 11 Rural (GW) 11 0 2 13 Sub-Total 60 1 33 93
Newly Urban, SU/ST (SW) - 84 84 Construction Urban, SU/ST (GW) 48 171 219
Rural (GW) 18 60 78 Sub-Total 67 314 381
Total (MLD) 60 67 346 474 3. Akwa IbomRehabilitation Urban, SU/ST (SW) - - - -
Urban, SU/ST (GW) 204 33 122 360 Rural (GW) 20 6 19 45 Sub-Total 225 39 142 405
Newly Urban, SU/ST (SW) - - - Construction Urban, SU/ST (GW) 42 153 195
Rural (GW) 13 43 56 Sub-Total 54 196 251
Total (MLD) 225 93 338 656 4. AnambraRehabilitation Urban, SU/ST (SW) - - - -
Urban, SU/ST (GW) 147 7 42 196 Rural (GW) 10 1 3 15 Sub-Total 157 8 45 211
Newly Urban, SU/ST (SW) - 465 465 Construction Urban, SU/ST (GW) 15 92 107
Rural (GW) 13 43 57 Sub-Total 29 600 629
Total (MLD) 157 37 646 840 5. BauchiRehabilitation Urban, SU/ST (SW) 23 - 17 40
Urban, SU/ST (GW) 132 24 88 244 Rural (GW) 19 4 13 35 Sub-Total 174 28 118 320
Newly Urban, SU/ST (SW) - 20 20 Construction Urban, SU/ST (GW) 51 184 235
Rural (GW) 27 90 117 Sub-Total 78 293 372
Total (MLD) 174 106 411 691 6. BayelsaRehabilitation Urban, SU/ST (SW) - - - -
Urban, SU/ST (GW) 3 1 3 8 Rural (GW) 6 2 7 14 Sub-Total 9 3 10 22
Newly Urban, SU/ST (SW) - - - Construction Urban, SU/ST (GW) 72 231 303
Rural (GW) 3 10 14 Sub-Total 75 241 316
Total (MLD) 9 78 251 338

The Project for Review and Update of Nigeria National Water Resources Master Plan
Volume-5, SR5 (SR5-14)
Table 5.1-5 Water Supply Development Plan for Facility Planning /Installed Capacity (2/6)
Table 5.1-5 Water Supply Development Plan for Facility Planning /Installed Capacity (3/6)
Scheme Category Existing Capacity Pre-CMP Period CMP Period Total(2010) (2011-2014) (2015-2030) (2030)
7. BenueRehabilitation Urban, SU/ST (SW) 17 - 13 31
Urban, SU/ST (GW) 157 13 60 230 Rural (GW) 28 6 19 53 Sub-Total 202 19 92 313
Newly Urban, SU/ST (SW) 130 - 130 Construction Urban, SU/ST (GW) 16 75 92
Rural (GW) 18 59 77 Sub-Total 164 134 298
Total (MLD) 202 183 227 612 8. BornoRehabilitation Urban, SU/ST (SW) 32 - 24 56
Urban, SU/ST (GW) 151 8 30 189 Rural (GW) 16 1 3 20 Sub-Total 199 9 57 265
Newly Urban, SU/ST (SW) - 21 21 Construction Urban, SU/ST (GW) 68 248 316
Rural (GW) 22 76 98 Sub-Total 90 345 435
Total (MLD) 199 99 402 700 9. Cross RiverRehabilitation Urban, SU/ST (SW) 62 - 48 110
Urban, SU/ST (GW) 38 12 48 99 Rural (GW) 6 8 24 38 Sub-Total 107 20 121 247
Newly Urban, SU/ST (SW) - 58 58 Construction Urban, SU/ST (GW) 15 61 76
Rural (GW) 9 30 40 Sub-Total 25 149 173
Total (MLD) 107 44 270 421 10. DeltaRehabilitation Urban, SU/ST (SW) - - - -
Urban, SU/ST (GW) 171 58 198 427 Rural (GW) 18 6 21 45 Sub-Total 189 64 219 472
Newly Urban, SU/ST (SW) - - - Construction Urban, SU/ST (GW) 59 202 261
Rural (GW) 9 31 40 Sub-Total 68 233 301
Total (MLD) 189 133 452 774 11. EbonyiRehabilitation Urban, SU/ST (SW) 11 - 9 20
Urban, SU/ST (GW) 64 - - 64 Rural (GW) 13 1 3 17 Sub-Total 88 1 12 101
Newly Urban, SU/ST (SW) 164 - 164 Construction Urban, SU/ST (GW) - - -
Rural (GW) 11 36 47 Sub-Total 175 36 211
Total (MLD) 88 176 48 312 12. EdoRehabilitation Urban, SU/ST (SW) 9 - 7 16
Urban, SU/ST (GW) 247 - - 247 Rural (GW) 10 0 2 12 Sub-Total 266 0 9 275
Newly Urban, SU/ST (SW) 9 6 15 Construction Urban, SU/ST (GW) 54 211 265
Rural (GW) 12 40 52 Sub-Total 75 257 332
Total (MLD) 266 76 265 607 13. EkitiRehabilitation Urban, SU/ST (SW) 84 - 64 148
Urban, SU/ST (GW) 50 3 29 83 Rural (GW) 16 4 12 31 Sub-Total 150 7 105 262
Newly Urban, SU/ST (SW) 7 89 96 Construction Urban, SU/ST (GW) 4 37 41
Rural (GW) 4 15 20 Sub-Total 16 141 157
Total (MLD) 150 23 247 419

The Project for Review and Update of Nigeria National Water Resources Master Plan
Volume-5, SR5 (SR5-15)
Table 5.1-5 Water Supply Development Plan for Facility Planning /Installed Capacity (4/6)
Scheme Category Existing Capacity Pre-CMP Period CMP Period Total(2010) (2011-2014) (2015-2030) (2030)
14. EnuguRehabilitation Urban, SU/ST (SW) 35 - 27 62
Urban, SU/ST (GW) 34 5 17 56 Rural (GW) 10 2 5 16 Sub-Total 78 7 49 134
Newly Urban, SU/ST (SW) - 4 4 Construction Urban, SU/ST (GW) 103 341 444
Rural (GW) 12 40 52 Sub-Total 115 385 500
Total (MLD) 78 122 434 634 15. GombeRehabilitation Urban, SU/ST (SW) 23 - 18 41
Urban, SU/ST (GW) 36 9 35 80 Rural (GW) 8 2 7 17 Sub-Total 67 11 60 138
Newly Urban, SU/ST (SW) - 63 63 Construction Urban, SU/ST (GW) 24 89 113
Rural (GW) 12 39 50 Sub-Total 35 191 226
Total (MLD) 67 47 250 364 16. ImoRehabilitation Urban, SU/ST (SW) 47 - 37 84
Urban, SU/ST (GW) 88 8 29 125 Rural (GW) 20 2 7 29 Sub-Total 155 10 72 238
Newly Urban, SU/ST (SW) - - - Construction Urban, SU/ST (GW) 88 311 399
Rural (GW) 17 58 75 Sub-Total 106 369 475
Total (MLD) 155 116 441 713 17. JigawaRehabilitation Urban, SU/ST (SW) 7 - 2 8
Urban, SU/ST (GW) 217 3 12 232 Rural (GW) 41 4 13 58 Sub-Total 265 7 27 298
Newly Urban, SU/ST (SW) - - - Construction Urban, SU/ST (GW) 63 233 296
Rural (GW) 11 40 51 Sub-Total 74 273 347
Total (MLD) 265 81 299 645 18. KadunaRehabilitation Urban, SU/ST (SW) 166 - 128 293
Urban, SU/ST (GW) 174 6 50 229 Rural (GW) 55 10 36 101 Sub-Total 394 16 213 622
Newly Urban, SU/ST (SW) - 161 161 Construction Urban, SU/ST (GW) 7 62 69
Rural (GW) 13 45 57 Sub-Total 19 268 287
Total (MLD) 394 35 481 909 19. KanoRehabilitation Urban, SU/ST (SW) 136 - 102 238
Urban, SU/ST (GW) 453 17 145 615 Rural (GW) 39 4 13 56 Sub-Total 629 20 260 909
Newly Urban, SU/ST (SW) 189 478 668 Construction Urban, SU/ST (GW) 21 181 202
Rural (GW) 39 131 170 Sub-Total 249 791 1,040
Total (MLD) 629 270 1,051 1,949 20. KatsinaRehabilitation Urban, SU/ST (SW) 72 - 42 114
Urban, SU/ST (GW) 81 9 30 119 Rural (GW) 33 4 13 50 Sub-Total 186 13 85 284
Newly Urban, SU/ST (SW) - 28 28 Construction Urban, SU/ST (GW) 106 367 472
Rural (GW) 25 83 108 Sub-Total 131 477 608
Total (MLD) 186 143 562 892

The Project for Review and Update of Nigeria National Water Resources Master Plan
Volume-5, SR5 (SR5-16)
Table 5.1-5 Water Supply Development Plan for Facility Planning /Installed Capacity (5/6)
Scheme Category Existing Capacity Pre-CMP Period CMP Period Total(2010) (2011-2014) (2015-2030) (2030)
21. KebbiRehabilitation Urban, SU/ST (SW) 40 - 31 70
Urban, SU/ST (GW) 55 14 50 119 Rural (GW) 19 5 17 41 Sub-Total 114 19 98 231
Newly Urban, SU/ST (SW) 1 - 1 Construction Urban, SU/ST (GW) 38 135 172
Rural (GW) 13 44 58 Sub-Total 52 179 231
Total (MLD) 114 71 277 462 22. KogiRehabilitation Urban, SU/ST (SW) 18 - 14 32
Urban, SU/ST (GW) 79 17 61 157 Rural (GW) 14 3 11 28 Sub-Total 111 21 86 217
Newly Urban, SU/ST (SW) 45 - 45 Construction Urban, SU/ST (GW) 49 174 223
Rural (GW) 12 40 52 Sub-Total 107 214 320
Total (MLD) 111 127 299 537 23. KwaraRehabilitation Urban, SU/ST (SW) 71 - 55 126
Urban, SU/ST (GW) 64 11 43 118 Rural (GW) 16 3 10 29 Sub-Total 151 14 108 273
Newly Urban, SU/ST (SW) - - - Construction Urban, SU/ST (GW) 19 76 95
Rural (GW) 4 15 19 Sub-Total 23 91 114
Total (MLD) 151 37 199 387 24. LagosRehabilitation Urban, SU/ST (SW) 244 - 188 433
Urban, SU/ST (GW) 1,145 - - 1,145 Rural (GW) 8 1 4 13 Sub-Total 1,397 1 192 1,591
Newly Urban, SU/ST (SW) 18 1,654 1,672 Construction Urban, SU/ST (GW) - - -
Rural (GW) 2 5 7 Sub-Total 20 1,659 1,679
Total (MLD) 1,397 21 1,851 3,270 25. NasarawaRehabilitation Urban, SU/ST (SW) 29 - 20 49
Urban, SU/ST (GW) 48 9 38 95 Rural (GW) 10 3 10 23 Sub-Total 87 12 68 167
Newly Urban, SU/ST (SW) - 43 43 Construction Urban, SU/ST (GW) 12 48 59
Rural (GW) 5 18 23 Sub-Total 17 108 125
Total (MLD) 87 29 176 292 26. NigerRehabilitation Urban, SU/ST (SW) 82 - 63 146
Urban, SU/ST (GW) 140 16 72 228 Rural (GW) 31 4 16 51 Sub-Total 253 21 151 425
Newly Urban, SU/ST (SW) 18 5 23 Construction Urban, SU/ST (GW) 24 105 129
Rural (GW) 13 44 57 Sub-Total 55 154 209
Total (MLD) 253 76 305 633 27. OgunRehabilitation Urban, SU/ST (SW) 79 - 61 139
Urban, SU/ST (GW) 225 - - 225 Rural (GW) 15 3 9 26 Sub-Total 319 3 69 391
Newly Urban, SU/ST (SW) 7 340 347 Construction Urban, SU/ST (GW) - - -
Rural (GW) 11 37 48 Sub-Total 18 377 395
Total (MLD) 319 20 446 786

The Project for Review and Update of Nigeria National Water Resources Master Plan
Volume-5, SR5 (SR5-17)
Table 5.1-5 Water Supply Development Plan for Facility Planning /Installed Capacity (6/6)
Scheme Category Existing Capacity Pre-CMP Period CMP Period Total(2010) (2011-2014) (2015-2030) (2030)
28. OndoRehabilitation Urban, SU/ST (SW) 16 - 12 28
Urban, SU/ST (GW) 157 15 63 235 Rural (GW) 24 6 19 49 Sub-Total 197 20 94 311
Newly Urban, SU/ST (SW) 70 5 75 Construction Urban, SU/ST (GW) 18 78 97
Rural (GW) 11 36 47 Sub-Total 99 119 219
Total (MLD) 197 119 213 530 29. OsunRehabilitation Urban, SU/ST (SW) 110 - 84 194
Urban, SU/ST (GW) 115 3 36 154 Rural (GW) 33 5 19 57 Sub-Total 258 8 139 406
Newly Urban, SU/ST (SW) - 90 90 Construction Urban, SU/ST (GW) 4 45 49
Rural (GW) 7 23 30 Sub-Total 11 159 169
Total (MLD) 258 19 298 575 30. OyoRehabilitation Urban, SU/ST (SW) 113 - 87 201
Urban, SU/ST (GW) 299 - - 299 Rural (GW) 45 6 24 75 Sub-Total 458 6 111 575
Newly Urban, SU/ST (SW) 6 413 419 Construction Urban, SU/ST (GW) - - -
Rural (GW) 13 47 60 Sub-Total 19 460 479
Total (MLD) 458 25 571 1,054 31. PlateauRehabilitation Urban, SU/ST (SW) 56 - 14 70
Urban, SU/ST (GW) 59 12 42 112 Rural (GW) 9 2 7 18 Sub-Total 123 14 63 200
Newly Urban, SU/ST (SW) 10 44 54 Construction Urban, SU/ST (GW) 33 117 150
Rural (GW) 17 56 73 Sub-Total 60 217 277
Total (MLD) 123 74 280 477 32. RiversRehabilitation Urban, SU/ST (SW) - - - -
Urban, SU/ST (GW) 329 48 172 548 Rural (GW) 26 4 14 43 Sub-Total 355 51 185 591
Newly Urban, SU/ST (SW) - - - Construction Urban, SU/ST (GW) 99 356 455
Rural (GW) 17 57 74 Sub-Total 115 414 529
Total (MLD) 355 167 599 1,120 33. SokotoRehabilitation Urban, SU/ST (SW) 83 - 64 148
Urban, SU/ST (GW) 88 18 72 179 Rural (GW) 25 7 24 57 Sub-Total 197 26 161 384
Newly Urban, SU/ST (SW) - - - Construction Urban, SU/ST (GW) 23 90 113
Rural (GW) 9 30 40 Sub-Total 32 121 153
Total (MLD) 197 58 282 537 34. TarabaRehabilitation Urban, SU/ST (SW) 11 - 8 19
Urban, SU/ST (GW) 22 1 4 28 Rural (GW) 6 0 1 8 Sub-Total 39 2 14 55
Newly Urban, SU/ST (SW) - 61 61 Construction Urban, SU/ST (GW) 38 134 172
Rural (GW) 15 47 62 Sub-Total 53 242 295
Total (MLD) 39 54 256 350

The Project for Review and Update of Nigeria National Water Resources Master Plan
Volume-5, SR5 (SR5-18)
Source: JICA Project Team
Scheme Category Existing Capacity Pre-CMP Period CMP Period Total(2010) (2011-2014) (2015-2030) (2030)
35. YobeRehabilitation Urban, SU/ST (SW) - - - -
Urban, SU/ST (GW) 71 15 51 136 Rural (GW) 13 3 9 25 Sub-Total 84 17 60 161
Newly Urban, SU/ST (SW) - 4 4 Construction Urban, SU/ST (GW) 36 123 159
Rural (GW) 10 35 45 Sub-Total 46 162 208
Total (MLD) 84 63 222 369 36. ZamfaraRehabilitation Urban, SU/ST (SW) 22 - 17 39
Urban, SU/ST (GW) 124 9 40 174 Rural (GW) 24 2 8 35 Sub-Total 171 12 65 247
Newly Urban, SU/ST (SW) 45 - 45 Construction Urban, SU/ST (GW) 20 85 105
Rural (GW) 15 51 66 Sub-Total 80 136 216
Total (MLD) 171 92 201 463 37. FCT AbujaRehabilitation Urban, SU/ST (SW) 108 - 84 192
Urban, SU/ST (GW) 20 3 20 42 Rural (GW) 2 1 2 5 Sub-Total 130 3 106 239
Newly Urban, SU/ST (SW) 485 11 496 Construction Urban, SU/ST (GW) 74 588 662
Rural (GW) 4 16 20 Sub-Total 563 615 1,178
Total (MLD) 130 566 721 1,417

The Project for Review and Update of Nigeria National Water Resources Master Plan
Volume-5, SR5 (SR5-19)
Source: JICA Project Team
Figure 5.1-1 Demand and Supply in Water Supply Development Plan for Facility Planning (1/38)
Nationwide
Figure N-1 Population Growth by Settlement Category Figure N-2 Population Growth with Distribution of Settlement Category
Figure N-3 Sanitation Coverage by Settlement Category Figure N-4 Population and Population Served
Figure N-5 Water Demand Growth by Water Use Category Figure N-6 Water Demand Growth with Distribution of Water Use Category
Figure N-7 Demand and Supply in Water Supply Development Plan for Facility Planning
8,253.7
11,666.4
15,889.8
20,994.1
23,876.3
0
5,000
10,000
15,000
20,000
25,000
30,000
2010 2015 2020 2025 2030
Total
Urban
S.U./S.T.
Rural
Commercial
Industry
3,204.9 4,095.5 5,185.3 6,486.9 7,326.1 3,191.5
4,761.2 6,687.0
8,986.3 10,066.9
717.6
1,225.5
1,855.1
2,613.5 2,929.0
8,253.7
11,666.4
15,889.8
20,994.1
23,876.3
0
5,000
10,000
15,000
20,000
25,000
30,000
2010 2015 2020 2025 2030
Industry
Commercial
Rural
S.U./S.T.
Urban
Total
MLD MLD
158,423 179,791
203,869
229,796
257,815
88,818
127,011
173,873
229,796
257,815
0
50,000
100,000
150,000
200,000
250,000
300,000
2010 2015 2020 2025 2030
Total
PopulationServed
(x1,000)
56.1%
70.6%
85.3%
100.0% 100.0%
0%
20%
40%
60%
80%
100%
2010 2015 2020 2025 2030
Total
Urban
S.U./S.T.
Rural
158,423 179,791
203,869
229,796
257,815
0
50,000
100,000
150,000
200,000
250,000
300,000
2010 2015 2020 2025 2030
Total
Urban
S.U./S.T.
Rural
(x1,000)
25,964 29,440 33,436 37,840 42,736
72,562 82,248 93,140
104,840 117,447
59,897 68,102
77,293 87,116
97,632
158,423 179,791
203,869
229,796
257,815
0
50,000
100,000
150,000
200,000
250,000
300,000
2010 2015 2020 2025 2030
Rural
S.U./S.T.
Urban
Total
(x1,000)
-
5,000
10,000
15,000
20,000
25,000
30,000
2011 2012 2013 2014 2015 2016 2017 2018 2019 2020 2021 2022 2023 2024 2025 2026 2027 2028 2029
Newly Construction Scheme for Rural Water Supply(Installed Capacity, Groundwater)
Newly Construction Scheme for Urban/SU&ST WaterSupply (Installed Capacity, Groundwater)
Newly Construction Scheme for Urban/SU&ST WaterSupply (Installed Capacity, Surface Water)
Rehabilitation Scheme for Rural Water Supply(Operating Capacity, Groundwater)
Rehabilitation Scheme for Urban/SU&ST WaterSupply (Operating Capacity, Groundwater)
Rehabilitation Scheme for Urban/SU&ST WaterSupply (Operating Capacity, Surface Water)
Existing Rural Water Supply from 2010(Groundwater)
Existing Urban/SU&ST Water Supply from 2010(Groundwater)
Existing Urban/SU&ST Water Supply from 2010(Surface Water)
MLD
8,254
23,876
Water Demand
MP 1st Stage MP 2nd Stage MP 3rd Stage

The Project for Review and Update of Nigeria National Water Resources Master Plan
Volume-5, SR5 (SR5-20)
Source: JICA Project Team
Figure 5.1-1 Demand and Supply in Water Supply Development Plan for Facility Planning (2/38)
1. Abia
Figure 1-1 Population Growth by Settlement Category Figure 1-2 Population Growth with Distribution of Settlement Category
Figure 1-3 Water Supply Coverage by Settlement Category Figure 1-4 Population and Population Served
Figure 1-5 Water Demand Growth by Water Use Category Figure 1-6 Water Demand Growth with Distribution of Water Use Category
Figure 1-7 Demand and Supply in Water Supply Development Plan for Facility Planning
3,157 3,519
3,918 4,334
4,771
0
1,000
2,000
3,000
4,000
5,000
6,000
2010 2015 2020 2025 2030
Total
Urban
S.U./S.T.
Rural
(x1,000)
903 976 1,054 1,134 1,218
1,279 1,442 1,623 1,812 2,011
974 1,101
1,241 1,388
1,542 3,157
3,519 3,918
4,334 4,771
0
1,000
2,000
3,000
4,000
5,000
6,000
2010 2015 2020 2025 2030
Rural
S.U./S.T.
Urban
Total
(x1,000)
3,157 3,519
3,918 4,334
4,771
1,995
2,639
3,420
4,334 4,771
0
1,000
2,000
3,000
4,000
5,000
6,000
2010 2015 2020 2025 2030
Total
PopulationServed
(x1,000)
146.8 161.5 177.6 194.4 208.8
24.8 59.8
103.2 155.3
172.4
15.3
22.6
31.3
41.6 46.3
211.0
275.9
354.5
447.1
495.2
0
100
200
300
400
500
600
2010 2015 2020 2025 2030
Industry
Commercial
Rural
S.U./S.T.
Urban
Total
MLD
-
100.0
200.0
300.0
400.0
500.0
600.0
2011 2012 2013 2014 2015 2016 2017 2018 2019 2020 2021 2022 2023 2024 2025 2026 2027 2028 2029
Newly Construction Scheme for Rural Water Supply(Installed Capacity, Groundwater)
Newly Construction Scheme for Urban/SU&ST WaterSupply (Installed Capacity, Groundwater)
Newly Construction Scheme for Urban/SU&ST WaterSupply (Installed Capacity, Surface Water)
Rehabilitation Scheme for Rural Water Supply(Operating Capacity, Groundwater)
Rehabilitation Scheme for Urban/SU&ST WaterSupply (Operating Capacity, Groundwater)
Rehabilitation Scheme for Urban/SU&ST WaterSupply (Operating Capacity, Surface Water)
Existing Rural Water Supply from 2010(Groundwater)
Existing Urban/SU&ST Water Supply from 2010(Groundwater)
Existing Urban/SU&ST Water Supply from 2010(Surface Water)
MLD
211.0
495.2
Water Demand
MP 1st Stage MP 2nd Stage MP 3rd Stage
211.0
275.9
354.5
447.1
495.2
0
100
200
300
400
500
600
2010 2015 2020 2025 2030
Total
Urban
S.U./S.T.
Rural
Commercial
Industry
MLD
63.2%
75.0%
87.3%
100.0% 100.0%
0%
20%
40%
60%
80%
100%
2010 2015 2020 2025 2030
Total
Urban
S.U./S.T.
Rural

The Project for Review and Update of Nigeria National Water Resources Master Plan
Volume-5, SR5 (SR5-21)
Source: JICA Project Team
Figure 5.1-1 Demand and Supply in Water Supply Development Plan for Facility Planning (3/38)
2. Adamawa
Figure 2-1 Population Growth by Settlement Category Figure 2-2 Population Growth with Distribution of Settlement Category
Figure 2-3 Water Supply Coverage by Settlement Category Figure 2-4 Population and Population Served
Figure 2-5 Water Demand Growth by Water Use Category Figure 2-6 Water Demand Growth with Distribution of Water Use Category
Figure 2-7 Demand and Supply in Water Supply Development Plan for Facility Planning
3,543 3,968
4,436
4,930
5,450
0
1,000
2,000
3,000
4,000
5,000
6,000
2010 2015 2020 2025 2030
Total
Urban
S.U./S.T.
Rural
(x1,000)
280 311 345 379 415
1,656 1,848 2,058 2,279 2,511
1,606 1,809
2,033 2,272
2,524 3,543
3,968
4,436
4,930
5,450
0
1,000
2,000
3,000
4,000
5,000
6,000
2010 2015 2020 2025 2030
Rural
S.U./S.T.
Urban
Total
(x1,000)
3,543 3,968
4,436
4,930
5,450
811
1,928
3,296
4,930
5,450
0
1,000
2,000
3,000
4,000
5,000
6,000
2010 2015 2020 2025 2030
Total
PopulationServed
(x1,000)
59.9
141.7
241.3
360.0
397.8
0
50
100
150
200
250
300
350
400
450
2010 2015 2020 2025 2030
Total
Urban
S.U./S.T.
Rural
Commercial
Industry
MLD
16.8 30.2 46.2 65.0 71.1 26.3
72.3
128.5
195.4 215.3
11.4
26.6
45.5
68.1 75.7
59.9
141.7
241.3
360.0
397.8
0
50
100
150
200
250
300
350
400
450
2010 2015 2020 2025 2030
Industry
Commercial
Rural
S.U./S.T.
Urban
Total
MLD
-
50.0
100.0
150.0
200.0
250.0
300.0
350.0
400.0
450.0
500.0
2011 2012 2013 2014 2015 2016 2017 2018 2019 2020 2021 2022 2023 2024 2025 2026 2027 2028 2029
Newly Construction Scheme for Rural Water Supply(Installed Capacity, Groundwater)
Newly Construction Scheme for Urban/SU&ST WaterSupply (Installed Capacity, Groundwater)
Newly Construction Scheme for Urban/SU&ST WaterSupply (Installed Capacity, Surface Water)
Rehabilitation Scheme for Rural Water Supply(Operating Capacity, Groundwater)
Rehabilitation Scheme for Urban/SU&ST WaterSupply (Operating Capacity, Groundwater)
Rehabilitation Scheme for Urban/SU&ST WaterSupply (Operating Capacity, Surface Water)
Existing Rural Water Supply from 2010(Groundwater)
Existing Urban/SU&ST Water Supply from 2010(Groundwater)
Existing Urban/SU&ST Water Supply from 2010(Surface Water)
59.9
397.8
Water Demand
MP 1st Stage MP 2nd Stage MP 3rd StageMLD
22.9%
48.6%
74.3%
100.0% 100.0%
0%
20%
40%
60%
80%
100%
2010 2015 2020 2025 2030
Total
Urban
S.U./S.T.
Rural

The Project for Review and Update of Nigeria National Water Resources Master Plan
Volume-5, SR5 (SR5-22)
Source: JICA Project Team
Figure 5.1-1 Demand and Supply in Water Supply Development Plan for Facility Planning (4/38)
3. Akwa Ibom
Figure 3-1 Population Growth by Settlement Category Figure 3-2 Population Growth with Distribution of Settlement Category
Figure 3-3 Water Supply Coverage by Settlement Category Figure 3-4 Population and Population Served
Figure 3-5 Water Demand Growth by Water Use Category Figure 3-6 Water Demand Growth with Distribution of Water Use Category
Figure 3-7 Demand and Supply in Water Supply Development Plan for Facility Planning
4,427
5,049
5,749
6,500
7,305
0
1,000
2,000
3,000
4,000
5,000
6,000
7,000
8,000
2010 2015 2020 2025 2030
Total
Urban
S.U./S.T.
Rural
(x1,000)
504 574 651 733 820
2,138 2,432 2,761 3,113
3,488
1,784 2,043
2,337 2,654
2,997
4,427
5,049
5,749
6,500
7,305
0
1,000
2,000
3,000
4,000
5,000
6,000
7,000
8,000
2010 2015 2020 2025 2030
Rural
S.U./S.T.
Urban
Total
(x1,000)
4,427
5,049
5,749
6,500
7,305
2,660
3,704
4,983
6,500
7,305
0
1,000
2,000
3,000
4,000
5,000
6,000
7,000
8,000
2010 2015 2020 2025 2030
Total
PopulationServed
(x1,000)
224.5
308.4
411.2
533.9
605.5
0
100
200
300
400
500
600
700
2010 2015 2020 2025 2030
Total
Urban
S.U./S.T.
Rural
Commercial
Industry
MLD
71.2 86.8 105.1 125.7 140.6
107.8 151.2
204.2 266.8
299.0
20.3
35.9
55.6
79.6 89.9
224.5
308.4
411.2
533.9
605.5
0
100
200
300
400
500
600
700
2010 2015 2020 2025 2030
Industry
Commercial
Rural
S.U./S.T.
Urban
Total
MLD
-
100.0
200.0
300.0
400.0
500.0
600.0
700.0
2011 2012 2013 2014 2015 2016 2017 2018 2019 2020 2021 2022 2023 2024 2025 2026 2027 2028 2029
Newly Construction Scheme for Rural Water Supply(Installed Capacity, Groundwater)
Newly Construction Scheme for Urban/SU&ST WaterSupply (Installed Capacity, Groundwater)
Newly Construction Scheme for Urban/SU&ST WaterSupply (Installed Capacity, Surface Water)
Rehabilitation Scheme for Rural Water Supply(Operating Capacity, Groundwater)
Rehabilitation Scheme for Urban/SU&ST WaterSupply (Operating Capacity, Groundwater)
Rehabilitation Scheme for Urban/SU&ST WaterSupply (Operating Capacity, Surface Water)
Existing Rural Water Supply from 2010(Groundwater)
Existing Urban/SU&ST Water Supply from 2010(Groundwater)
Existing Urban/SU&ST Water Supply from 2010(Surface Water)
224.5
605.5
Water Demand
MP 1st Stage MP 2nd Stage MP 3rd StageMLD
60.1%
73.4%
86.7%
100.0% 100.0%
0%
20%
40%
60%
80%
100%
2010 2015 2020 2025 2030
Total
Urban
S.U./S.T.
Rural
The Project for Review and Update of Nigeria National Water Resources Master Plan
Volume-5, SR5 (SR5-23)
Source: JICA Project Team
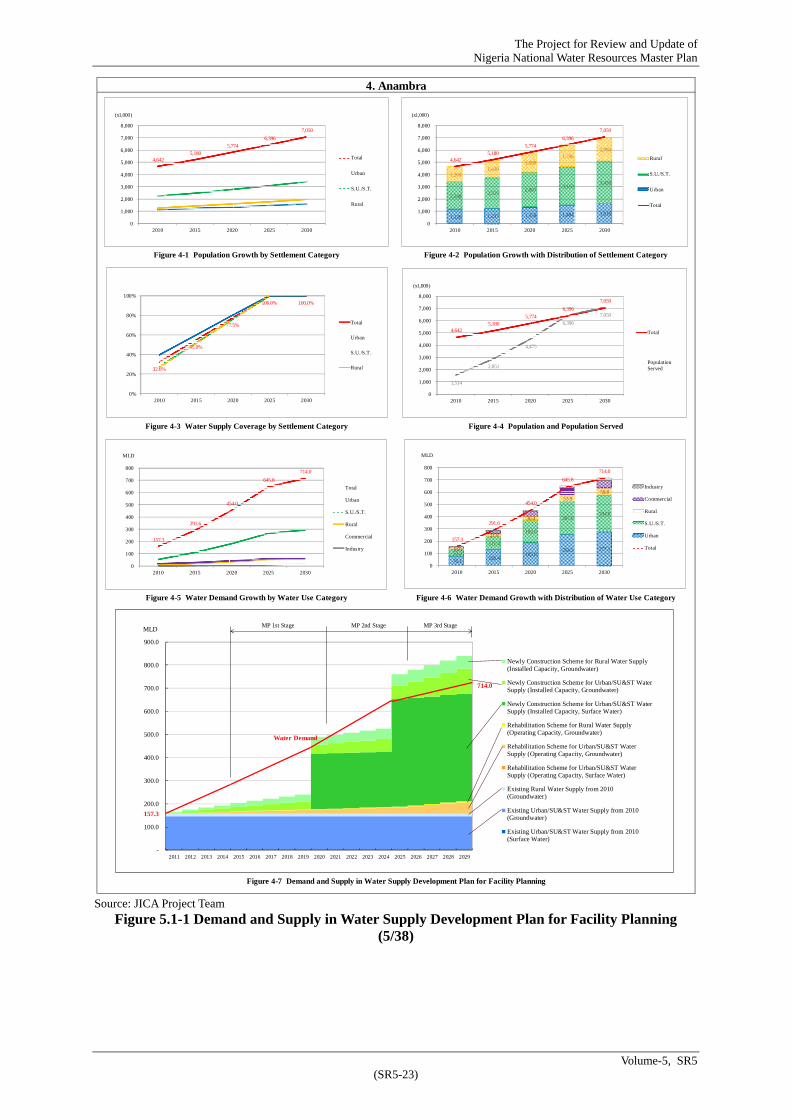
Figure 5.1-1 Demand and Supply in Water Supply Development Plan for Facility Planning (5/38)
4. Anambra
Figure 4-1 Population Growth by Settlement Category Figure 4-2 Population Growth with Distribution of Settlement Category
Figure 4-3 Water Supply Coverage by Settlement Category Figure 4-4 Population and Population Served
Figure 4-5 Water Demand Growth by Water Use Category Figure 4-6 Water Demand Growth with Distribution of Water Use Category
Figure 4-7 Demand and Supply in Water Supply Development Plan for Facility Planning
4,642 5,180
5,774
6,396
7,050
0
1,000
2,000
3,000
4,000
5,000
6,000
7,000
8,000
2010 2015 2020 2025 2030
Total
Urban
S.U./S.T.
Rural
(x1,000)
1,126 1,237 1,358 1,484 1,616
2,248 2,513
2,807 3,115
3,439
1,268 1,430
1,608 1,796
1,994
4,642 5,180
5,774
6,396
7,050
0
1,000
2,000
3,000
4,000
5,000
6,000
7,000
8,000
2010 2015 2020 2025 2030
Rural
S.U./S.T.
Urban
Total
(x1,000)
4,642 5,180
5,774
6,396
7,050
1,514
2,851
4,475
6,396
7,050
0
1,000
2,000
3,000
4,000
5,000
6,000
7,000
8,000
2010 2015 2020 2025 2030
Total
PopulationServed
(x1,000)
76.1 126.4
185.8 254.5 277.1
53.2
111.4
182.6
267.0 294.8
10.0
21.8
36.4
53.9 59.8
157.3
291.6
454.0
645.8
714.0
0
100
200
300
400
500
600
700
800
2010 2015 2020 2025 2030
Industry
Commercial
Rural
S.U./S.T.
Urban
Total
MLD
157.3
291.6
454.0
645.8
714.0
0
100
200
300
400
500
600
700
800
2010 2015 2020 2025 2030
Total
Urban
S.U./S.T.
Rural
Commercial
Industry
MLD
-
100.0
200.0
300.0
400.0
500.0
600.0
700.0
800.0
900.0
2011 2012 2013 2014 2015 2016 2017 2018 2019 2020 2021 2022 2023 2024 2025 2026 2027 2028 2029
Newly Construction Scheme for Rural Water Supply(Installed Capacity, Groundwater)
Newly Construction Scheme for Urban/SU&ST WaterSupply (Installed Capacity, Groundwater)
Newly Construction Scheme for Urban/SU&ST WaterSupply (Installed Capacity, Surface Water)
Rehabilitation Scheme for Rural Water Supply(Operating Capacity, Groundwater)
Rehabilitation Scheme for Urban/SU&ST WaterSupply (Operating Capacity, Groundwater)
Rehabilitation Scheme for Urban/SU&ST WaterSupply (Operating Capacity, Surface Water)
Existing Rural Water Supply from 2010(Groundwater)
Existing Urban/SU&ST Water Supply from 2010(Groundwater)
Existing Urban/SU&ST Water Supply from 2010(Surface Water)
157.3
714.0
Water Demand
MP 1st Stage MP 2nd Stage MP 3rd StageMLD
32.6%
55.0%
77.5%
100.0% 100.0%
0%
20%
40%
60%
80%
100%
2010 2015 2020 2025 2030
Total
Urban
S.U./S.T.
Rural
The Project for Review and Update of Nigeria National Water Resources Master Plan
Volume-5, SR5 (SR5-24)
Source: JICA Project Team
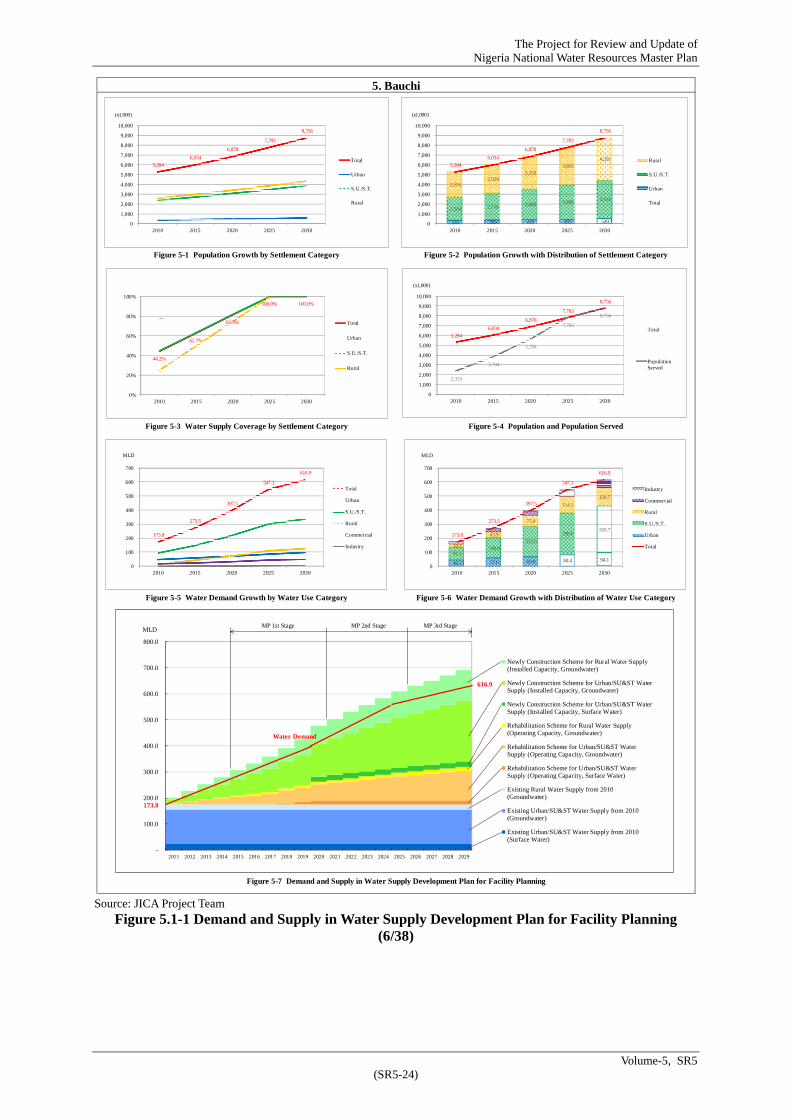
Figure 5.1-1 Demand and Supply in Water Supply Development Plan for Facility Planning (6/38)
5. Bauchi
Figure 5-1 Population Growth by Settlement Category Figure 5-2 Population Growth with Distribution of Settlement Category
Figure 5-3 Water Supply Coverage by Settlement Category Figure 5-4 Population and Population Served
Figure 5-5 Water Demand Growth by Water Use Category Figure 5-6 Water Demand Growth with Distribution of Water Use Category
Figure 5-7 Demand and Supply in Water Supply Development Plan for Facility Planning
5,284 6,034
6,878
7,783
8,756
0
1,000
2,000
3,000
4,000
5,000
6,000
7,000
8,000
9,000
10,000
2010 2015 2020 2025 2030
Total
Urban
S.U./S.T.
Rural
(x1,000)
345 389 439 493 549
2,384 2,716 3,089 3,488 3,916
2,555 2,929
3,350 3,803
4,291 5,284
6,034
6,878
7,783
8,756
0
1,000
2,000
3,000
4,000
5,000
6,000
7,000
8,000
9,000
10,000
2010 2015 2020 2025 2030
Rural
S.U./S.T.
Urban
Total
(x1,000)
5,284 6,034
6,878
7,783
8,756
2,333
3,784
5,594
7,783
8,756
0
1,000
2,000
3,000
4,000
5,000
6,000
7,000
8,000
9,000
10,000
2010 2015 2020 2025 2030
Total
PopulationServed
(x1,000)
173.8
273.5
397.5
547.1
616.9
0
100
200
300
400
500
600
700
2010 2015 2020 2025 2030
Total
Urban
S.U./S.T.
Rural
Commercial
Industry
MLD
46.2 57.0 69.8 84.4 94.1 91.1
146.8 215.9
299.0 335.7
19.2
43.9
75.4
114.1
128.7
173.8
273.5
397.5
547.1
616.9
0
100
200
300
400
500
600
700
2010 2015 2020 2025 2030
Industry
Commercial
Rural
S.U./S.T.
Urban
Total
MLD
-
100.0
200.0
300.0
400.0
500.0
600.0
700.0
800.0
2011 2012 2013 2014 2015 2016 2017 2018 2019 2020 2021 2022 2023 2024 2025 2026 2027 2028 2029
Newly Construction Scheme for Rural Water Supply(Installed Capacity, Groundwater)
Newly Construction Scheme for Urban/SU&ST WaterSupply (Installed Capacity, Groundwater)
Newly Construction Scheme for Urban/SU&ST WaterSupply (Installed Capacity, Surface Water)
Rehabilitation Scheme for Rural Water Supply(Operating Capacity, Groundwater)
Rehabilitation Scheme for Urban/SU&ST WaterSupply (Operating Capacity, Groundwater)
Rehabilitation Scheme for Urban/SU&ST WaterSupply (Operating Capacity, Surface Water)
Existing Rural Water Supply from 2010(Groundwater)
Existing Urban/SU&ST Water Supply from 2010(Groundwater)
Existing Urban/SU&ST Water Supply from 2010(Surface Water)
173.8
616.9
Water Demand
MP 1st Stage MP 2nd Stage MP 3rd StageMLD
44.2%
62.7%
81.3%
100.0% 100.0%
0%
20%
40%
60%
80%
100%
2010 2015 2020 2025 2030
Total
Urban
S.U./S.T.
Rural

The Project for Review and Update of Nigeria National Water Resources Master Plan
Volume-5, SR5 (SR5-25)
Source: JICA Project Team
Figure 5.1-1 Demand and Supply in Water Supply Development Plan for Facility Planning (7/38)
6. Bayelsa
Figure 6-1 Population Growth by Settlement Category Figure 6-2 Population Growth with Distribution of Settlement Category
Figure 6-3 Water Supply Coverage by Settlement Category Figure 6-4 Population and Population Served
Figure 6-5 Water Demand Growth by Water Use Category Figure 6-6 Water Demand Growth with Distribution of Water Use Category
Figure 6-7 Demand and Supply in Water Supply Development Plan for Facility Planning
1,902 2,133
2,388
2,656
2,940
0
500
1,000
1,500
2,000
2,500
3,000
3,500
2010 2015 2020 2025 2030
Total
Urban
S.U./S.T.
Rural
(x1,000)
288 335 388 445 507
998 1,128
1,274 1,428
1,593
616 670
726 783
840
1,902 2,133
2,388
2,656
2,940
0
500
1,000
1,500
2,000
2,500
3,000
3,500
2010 2015 2020 2025 2030
Rural
S.U./S.T.
Urban
Total
(x1,000)
1,902 2,133
2,388
2,656
2,940
126 802
1,642
2,656
2,940
0
500
1,000
1,500
2,000
2,500
3,000
3,500
2010 2015 2020 2025 2030
Total
PopulationServed
(x1,000)
8.8
70.5
148.7
245.2
274.9
0
50
100
150
200
250
300
2010 2015 2020 2025 2030
Total
Urban
S.U./S.T.
Rural
Commercial
Industry
MLD
0.9 19.9
44.8 76.3 86.9
1.5
33.4
73.4
122.4 136.5
5.7
10.9
16.8
23.5
25.2
8.8
70.5
148.7
245.2
274.9
0
50
100
150
200
250
300
2010 2015 2020 2025 2030
Industry
Commercial
Rural
S.U./S.T.
Urban
Total
MLD
-
50.0
100.0
150.0
200.0
250.0
300.0
350.0
400.0
2011 2012 2013 2014 2015 2016 2017 2018 2019 2020 2021 2022 2023 2024 2025 2026 2027 2028 2029
Newly Construction Scheme for Rural Water Supply(Installed Capacity, Groundwater)
Newly Construction Scheme for Urban/SU&ST WaterSupply (Installed Capacity, Groundwater)
Newly Construction Scheme for Urban/SU&ST WaterSupply (Installed Capacity, Surface Water)
Rehabilitation Scheme for Rural Water Supply(Operating Capacity, Groundwater)
Rehabilitation Scheme for Urban/SU&ST WaterSupply (Operating Capacity, Groundwater)
Rehabilitation Scheme for Urban/SU&ST WaterSupply (Operating Capacity, Surface Water)
Existing Rural Water Supply from 2010(Groundwater)
Existing Urban/SU&ST Water Supply from 2010(Groundwater)
Existing Urban/SU&ST Water Supply from 2010(Surface Water)
8.8
274.9
Water Demand
MP 1st Stage MP 2nd Stage MP 3rd StageMLD
6.6%
37.6%
68.7%
100.0% 100.0%
0%
20%
40%
60%
80%
100%
2010 2015 2020 2025 2030
Total
Urban
S.U./S.T.
Rural

The Project for Review and Update of Nigeria National Water Resources Master Plan
Volume-5, SR5 (SR5-26)
Source: JICA Project Team
Figure 5.1-1 Demand and Supply in Water Supply Development Plan for Facility Planning (8/38)
7. Benue
Figure 7-1 Population Growth by Settlement Category Figure 7-2 Population Growth with Distribution of Settlement Category
Figure 7-3 Water Supply Coverage by Settlement Category Figure 7-4 Population and Population Served
Figure 7-5 Water Demand Growth by Water Use Category Figure 7-6 Water Demand Growth with Distribution of Water Use Category
Figure 7-7 Demand and Supply in Water Supply Development Plan for Facility Planning
4,767 5,370
6,038
6,746
7,497
0
1,000
2,000
3,000
4,000
5,000
6,000
7,000
8,000
2010 2015 2020 2025 2030
Total
Urban
S.U./S.T.
Rural
(x1,000)
436 481 530 581 634
1,949 2,195 2,469 2,758 3,066
2,383 2,694
3,040 3,407
3,797 4,767
5,370
6,038
6,746
7,497
0
1,000
2,000
3,000
4,000
5,000
6,000
7,000
8,000
2010 2015 2020 2025 2030
Rural
S.U./S.T.
Urban
Total
(x1,000)
4,767 5,370
6,038
6,746
7,497
2,663
3,787
5,147
6,746
7,497
0
1,000
2,000
3,000
4,000
5,000
6,000
7,000
8,000
2010 2015 2020 2025 2030
Total
PopulationServed
(x1,000)
201.9
281.7
378.3
492.3
551.9
0
100
200
300
400
500
600
2010 2015 2020 2025 2030
Total
Urban
S.U./S.T.
Rural
Commercial
Industry
MLD
49.0 63.5 80.4 99.6 108.7
103.2 140.2
184.7 236.4
262.8
27.9
48.0
72.6
102.2 113.9
201.9
281.7
378.3
492.3
551.9
0
100
200
300
400
500
600
2010 2015 2020 2025 2030
Industry
Commercial
Rural
S.U./S.T.
Urban
Total
MLD
-
100.0
200.0
300.0
400.0
500.0
600.0
700.0
2011 2012 2013 2014 2015 2016 2017 2018 2019 2020 2021 2022 2023 2024 2025 2026 2027 2028 2029
Newly Construction Scheme for Rural Water Supply(Installed Capacity, Groundwater)
Newly Construction Scheme for Urban/SU&ST WaterSupply (Installed Capacity, Groundwater)
Newly Construction Scheme for Urban/SU&ST WaterSupply (Installed Capacity, Surface Water)
Rehabilitation Scheme for Rural Water Supply(Operating Capacity, Groundwater)
Rehabilitation Scheme for Urban/SU&ST WaterSupply (Operating Capacity, Groundwater)
Rehabilitation Scheme for Urban/SU&ST WaterSupply (Operating Capacity, Surface Water)
Existing Rural Water Supply from 2010(Groundwater)
Existing Urban/SU&ST Water Supply from 2010(Groundwater)
Existing Urban/SU&ST Water Supply from 2010(Surface Water)
201.9
551.9
Water Demand
MP 1st Stage MP 2nd Stage MP 3rd StageMLD
55.9%
70.5%
85.2%
100.0% 100.0%
0%
20%
40%
60%
80%
100%
2010 2015 2020 2025 2030
Total
Urban
S.U./S.T.
Rural

The Project for Review and Update of Nigeria National Water Resources Master Plan
Volume-5, SR5 (SR5-27)
Source: JICA Project Team
Figure 5.1-1 Demand and Supply in Water Supply Development Plan for Facility Planning (9/38)
8. Borno
Figure 8-1 Population Growth by Settlement Category Figure 8-2 Population Growth with Distribution of Settlement Category
Figure 8-3 Water Supply Coverage by Settlement Category Figure 8-4 Population and Population Served
Figure 8-5 Water Demand Growth by Water Use Category Figure 8-6 Water Demand Growth with Distribution of Water Use Category
Figure 8-7 Demand and Supply in Water Supply Development Plan for Facility Planning
4,751
5,442
6,222
7,062
7,966
0
1,000
2,000
3,000
4,000
5,000
6,000
7,000
8,000
9,000
2010 2015 2020 2025 2030
Total
Urban
S.U./S.T.
Rural
(x1,000)
406 448 493 542 593
2,496 2,841 3,230 3,646 4,093
1,850 2,153
2,499 2,874
3,280
4,751
5,442
6,222
7,062
7,966
0
1,000
2,000
3,000
4,000
5,000
6,000
7,000
8,000
9,000
2010 2015 2020 2025 2030
Rural
S.U./S.T.
Urban
Total
(x1,000)
4,751
5,442
6,222
7,062
7,966
2,433
3,669
5,207
7,062
7,966
0
1,000
2,000
3,000
4,000
5,000
6,000
7,000
8,000
9,000
2010 2015 2020 2025 2030
Total
PopulationServed
(x1,000)
199.2
292.6
407.4
544.7
613.2
0
100
200
300
400
500
600
700
2010 2015 2020 2025 2030
Total
Urban
S.U./S.T.
Rural
Commercial
Industry
MLD
30.7 48.1 68.8 92.9 101.7 132.0
181.4 241.5
312.5 350.8
16.1
34.1
57.2
86.2 98.4
199.2
292.6
407.4
544.7
613.2
0
100
200
300
400
500
600
700
2010 2015 2020 2025 2030
Industry
Commercial
Rural
S.U./S.T.
Urban
Total
MLD
-
100.0
200.0
300.0
400.0
500.0
600.0
700.0
800.0
2011 2012 2013 2014 2015 2016 2017 2018 2019 2020 2021 2022 2023 2024 2025 2026 2027 2028 2029
Newly Construction Scheme for Rural Water Supply(Installed Capacity, Groundwater)
Newly Construction Scheme for Urban/SU&ST WaterSupply (Installed Capacity, Groundwater)
Newly Construction Scheme for Urban/SU&ST WaterSupply (Installed Capacity, Surface Water)
Rehabilitation Scheme for Rural Water Supply(Operating Capacity, Groundwater)
Rehabilitation Scheme for Urban/SU&ST WaterSupply (Operating Capacity, Groundwater)
Rehabilitation Scheme for Urban/SU&ST WaterSupply (Operating Capacity, Surface Water)
Existing Rural Water Supply from 2010(Groundwater)
Existing Urban/SU&ST Water Supply from 2010(Groundwater)
Existing Urban/SU&ST Water Supply from 2010(Surface Water)
199.2
613.2
Water Demand
MP 1st Stage MP 2nd Stage MP 3rd StageMLD
51.2%
67.4%
83.7%
100.0% 100.0%
0%
20%
40%
60%
80%
100%
2010 2015 2020 2025 2030
Total
Urban
S.U./S.T.
Rural

The Project for Review and Update of Nigeria National Water Resources Master Plan
Volume-5, SR5 (SR5-28)
Source: JICA Project Team
Figure 5.1-1 Demand and Supply in Water Supply Development Plan for Facility Planning (10/38)
9. Cross River
Figure 9-1 Population Growth by Settlement Category Figure 9-2 Population Growth with Distribution of Settlement Category
Figure 9-3 Water Supply Coverage by Settlement Category Figure 9-4 Population and Population Served
Figure 9-5 Water Demand Growth by Water Use Category Figure 9-6 Water Demand Growth with Distribution of Water Use Category
Figure 9-7 Demand and Supply in Water Supply Development Plan for Facility Planning
3,225 3,612
4,040
4,490
4,965
1,259
2,136
3,211
4,490
4,965
0
1,000
2,000
3,000
4,000
5,000
6,000
2010 2015 2020 2025 2030
Total
PopulationServed
(x1,000)
106.8
173.0
253.4
348.5
386.0
0
50
100
150
200
250
300
350
400
450
2010 2015 2020 2025 2030
Total
Urban
S.U./S.T.
Rural
Commercial
Industry
MLD
45.8 57.9 71.8 87.2 93.6 42.7
75.5
115.4
162.6 179.6
6.0
21.0
39.8
62.6 69.7
106.8
173.0
253.4
348.5
386.0
0
50
100
150
200
250
300
350
400
450
2010 2015 2020 2025 2030
Industry
Commercial
Rural
S.U./S.T.
Urban
Total
MLD
-
50.0
100.0
150.0
200.0
250.0
300.0
350.0
400.0
450.0
2011 2012 2013 2014 2015 2016 2017 2018 2019 2020 2021 2022 2023 2024 2025 2026 2027 2028 2029
Newly Construction Scheme for Rural Water Supply(Installed Capacity, Groundwater)
Newly Construction Scheme for Urban/SU&ST WaterSupply (Installed Capacity, Groundwater)
Newly Construction Scheme for Urban/SU&ST WaterSupply (Installed Capacity, Surface Water)
Rehabilitation Scheme for Rural Water Supply(Operating Capacity, Groundwater)
Rehabilitation Scheme for Urban/SU&ST WaterSupply (Operating Capacity, Groundwater)
Rehabilitation Scheme for Urban/SU&ST WaterSupply (Operating Capacity, Surface Water)
Existing Rural Water Supply from 2010(Groundwater)
Existing Urban/SU&ST Water Supply from 2010(Groundwater)
Existing Urban/SU&ST Water Supply from 2010(Surface Water)
106.8
386.0
Water Demand
MP 1st Stage MP 2nd Stage MP 3rd StageMLD
39.0%
59.1%
79.5%
100.0% 100.0%
0%
20%
40%
60%
80%
100%
2010 2015 2020 2025 2030
Total
Urban
S.U./S.T.
Rural
3,225 3,612
4,040 4,490
4,965
0
1,000
2,000
3,000
4,000
5,000
6,000
2010 2015 2020 2025 2030
Total
Urban
S.U./S.T.
Rural
(x1,000)
403 436 472 509 546
1,365 1,528 1,708 1,897 2,095
1,457 1,648
1,860 2,085
2,324 3,225 3,612
4,040 4,490
4,965
0
1,000
2,000
3,000
4,000
5,000
6,000
2010 2015 2020 2025 2030
Rural
S.U./S.T.
Urban
Total
(x1,000)
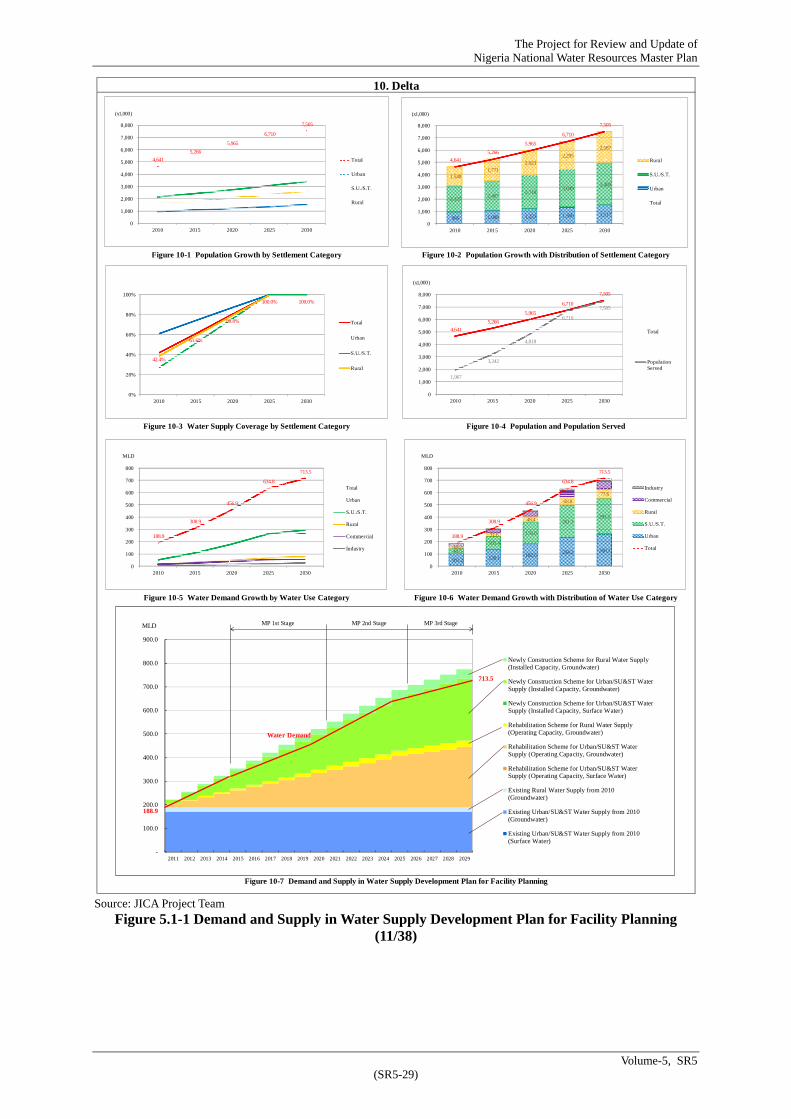
The Project for Review and Update of Nigeria National Water Resources Master Plan
Volume-5, SR5 (SR5-29)
Source: JICA Project Team
Figure 5.1-1 Demand and Supply in Water Supply Development Plan for Facility Planning (11/38)
10. Delta
Figure 10-1 Population Growth by Settlement Category Figure 10-2 Population Growth with Distribution of Settlement Category
Figure 10-3 Water Supply Coverage by Settlement Category Figure 10-4 Population and Population Served
Figure 10-5 Water Demand Growth by Water Use Category Figure 10-6 Water Demand Growth with Distribution of Water Use Category
Figure 10-7 Demand and Supply in Water Supply Development Plan for Facility Planning
4,641
5,266
5,965
6,710
7,505
1,967
3,242
4,818
6,710
7,505
0
1,000
2,000
3,000
4,000
5,000
6,000
7,000
8,000
2010 2015 2020 2025 2030
Total
PopulationServed
(x1,000)
4,641
5,266
5,965
6,710
7,505
0
1,000
2,000
3,000
4,000
5,000
6,000
7,000
8,000
2010 2015 2020 2025 2030
Total
Urban
S.U./S.T.
Rural
(x1,000)
966 1,088 1,223 1,366 1,517
2,127 2,407
2,718 3,049
3,400
1,548 1,771
2,023
2,295
2,587
4,641
5,266
5,965
6,710
7,505
0
1,000
2,000
3,000
4,000
5,000
6,000
7,000
8,000
2010 2015 2020 2025 2030
Rural
S.U./S.T.
Urban
Total
(x1,000)
188.9
308.9
456.9
634.8
713.5
0
100
200
300
400
500
600
700
800
2010 2015 2020 2025 2030
Total
Urban
S.U./S.T.
Rural
Commercial
Industry
MLD
101.2 138.1 182.5 234.2 260.1 48.5
105.4
176.0
261.3 291.5
18.2
31.6
48.4
68.8 77.6
188.9
308.9
456.9
634.8
713.5
0
100
200
300
400
500
600
700
800
2010 2015 2020 2025 2030
Industry
Commercial
Rural
S.U./S.T.
Urban
Total
MLD
-
100.0
200.0
300.0
400.0
500.0
600.0
700.0
800.0
900.0
2011 2012 2013 2014 2015 2016 2017 2018 2019 2020 2021 2022 2023 2024 2025 2026 2027 2028 2029
Newly Construction Scheme for Rural Water Supply(Installed Capacity, Groundwater)
Newly Construction Scheme for Urban/SU&ST WaterSupply (Installed Capacity, Groundwater)
Newly Construction Scheme for Urban/SU&ST WaterSupply (Installed Capacity, Surface Water)
Rehabilitation Scheme for Rural Water Supply(Operating Capacity, Groundwater)
Rehabilitation Scheme for Urban/SU&ST WaterSupply (Operating Capacity, Groundwater)
Rehabilitation Scheme for Urban/SU&ST WaterSupply (Operating Capacity, Surface Water)
Existing Rural Water Supply from 2010(Groundwater)
Existing Urban/SU&ST Water Supply from 2010(Groundwater)
Existing Urban/SU&ST Water Supply from 2010(Surface Water)
188.9
713.5
Water Demand
MP 1st Stage MP 2nd Stage MP 3rd StageMLD
42.4%
61.6%
80.8%
100.0% 100.0%
0%
20%
40%
60%
80%
100%
2010 2015 2020 2025 2030
Total
Urban
S.U./S.T.
Rural

The Project for Review and Update of Nigeria National Water Resources Master Plan
Volume-5, SR5 (SR5-30)
Source: JICA Project Team
Figure 5.1-1 Demand and Supply in Water Supply Development Plan for Facility Planning (12/38)
11. Ebonyi
Figure 11-1 Population Growth by Settlement Category Figure 11-2 Population Growth with Distribution of Settlement Category
Figure 11-3 Water Supply Coverage by Settlement Category Figure 11-4 Population and Population Served
Figure 11-5 Water Demand Growth by Water Use Category Figure 11-6 Water Demand Growth with Distribution of Water Use Category
Figure 11-7 Demand and Supply in Water Supply Development Plan for Facility Planning
2,420 2,703
3,014
3,341
3,684
0
500
1,000
1,500
2,000
2,500
3,000
3,500
4,000
2010 2015 2020 2025 2030
Total
Urban
S.U./S.T.
Rural
(x1,000)
189 209 229 251 274
1,049 1,171 1,306 1,447 1,596
1,182 1,324
1,479 1,643
1,814 2,420 2,703
3,014
3,341
3,684
0
500
1,000
1,500
2,000
2,500
3,000
3,500
4,000
2010 2015 2020 2025 2030
Rural
S.U./S.T.
Urban
Total
(x1,000)
2,420 2,703
3,014
3,341
3,684
1,183
1,781
2,500
3,341
3,684
0
500
1,000
1,500
2,000
2,500
3,000
3,500
4,000
2010 2015 2020 2025 2030
Total
PopulationServed
(x1,000)
88.4
130.9
182.1
242.3
269.7
0
50
100
150
200
250
300
2010 2015 2020 2025 2030
Total
Urban
S.U./S.T.
Rural
Commercial
Industry
MLD
21.1 27.4 34.7 43.0 46.9 44.7
66.7 93.1
124.1 136.8
13.2
23.1
35.1
49.3 54.4
88.4
130.9
182.1
242.3
269.7
0
50
100
150
200
250
300
2010 2015 2020 2025 2030
Industry
Commercial
Rural
S.U./S.T.
Urban
Total
MLD
-
50.0
100.0
150.0
200.0
250.0
300.0
350.0
2011 2012 2013 2014 2015 2016 2017 2018 2019 2020 2021 2022 2023 2024 2025 2026 2027 2028 2029
Newly Construction Scheme for Rural Water Supply(Installed Capacity, Groundwater)
Newly Construction Scheme for Urban/SU&ST WaterSupply (Installed Capacity, Groundwater)
Newly Construction Scheme for Urban/SU&ST WaterSupply (Installed Capacity, Surface Water)
Rehabilitation Scheme for Rural Water Supply(Operating Capacity, Groundwater)
Rehabilitation Scheme for Urban/SU&ST WaterSupply (Operating Capacity, Groundwater)
Rehabilitation Scheme for Urban/SU&ST WaterSupply (Operating Capacity, Surface Water)
Existing Rural Water Supply from 2010(Groundwater)
Existing Urban/SU&ST Water Supply from 2010(Groundwater)
Existing Urban/SU&ST Water Supply from 2010(Surface Water)
88.4
269.7
Water Demand
MP 1st Stage MP 2nd Stage MP 3rd StageMLD
48.9%
65.9%
82.9%
100.0% 100.0%
0%
20%
40%
60%
80%
100%
2010 2015 2020 2025 2030
Total
Urban
S.U./S.T.
Rural
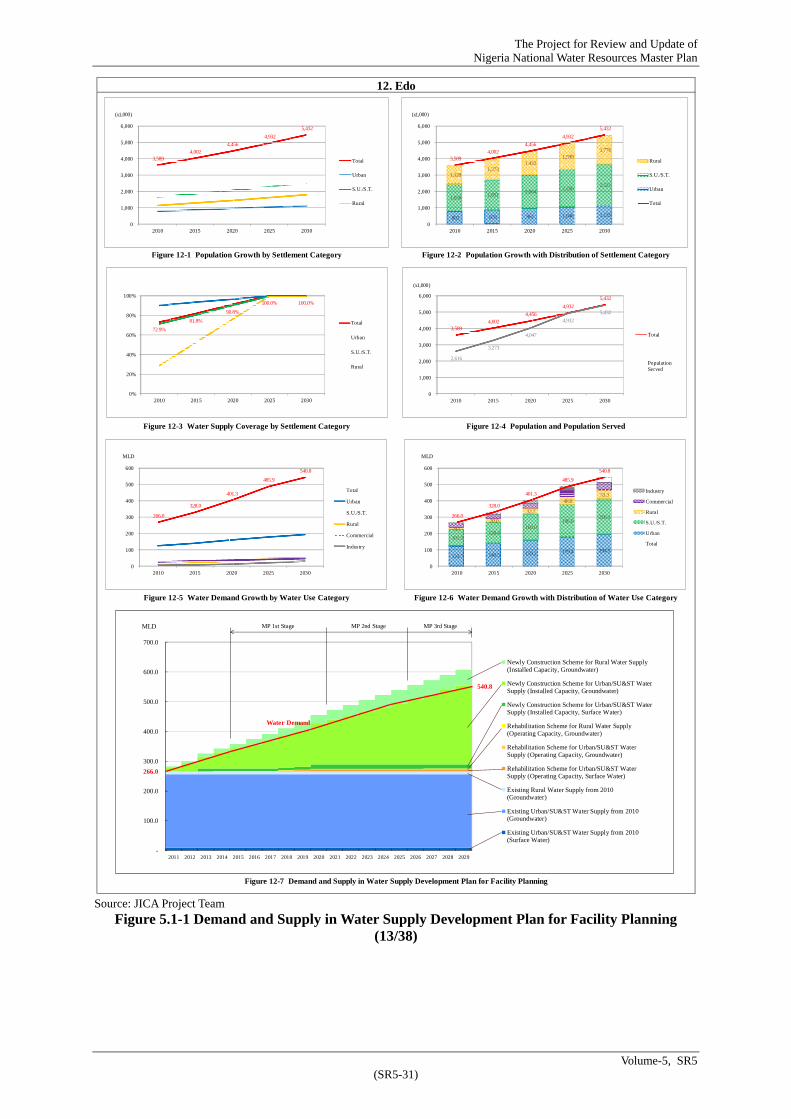
The Project for Review and Update of Nigeria National Water Resources Master Plan
Volume-5, SR5 (SR5-31)
Source: JICA Project Team
Figure 5.1-1 Demand and Supply in Water Supply Development Plan for Facility Planning (13/38)
12. Edo
Figure 12-1 Population Growth by Settlement Category Figure 12-2 Population Growth with Distribution of Settlement Category
Figure 12-3 Water Supply Coverage by Settlement Category Figure 12-4 Population and Population Served
Figure 12-5 Water Demand Growth by Water Use Category Figure 12-6 Water Demand Growth with Distribution of Water Use Category
Figure 12-7 Demand and Supply in Water Supply Development Plan for Facility Planning
3,589 4,002
4,456
4,932
5,432
0
1,000
2,000
3,000
4,000
5,000
6,000
2010 2015 2020 2025 2030
Total
Urban
S.U./S.T.
Rural
(x1,000)
802 878 961 1,046 1,135
1,658 1,851 2,064
2,286 2,521
1,129 1,273
1,432 1,599
1,776
3,589 4,002
4,456
4,932
5,432
0
1,000
2,000
3,000
4,000
5,000
6,000
2010 2015 2020 2025 2030
Rural
S.U./S.T.
Urban
Total
(x1,000)
3,589 4,002
4,456
4,932
5,432
2,616
3,273
4,047
4,932
5,432
0
1,000
2,000
3,000
4,000
5,000
6,000
2010 2015 2020 2025 2030
Total
PopulationServed
(x1,000)
266.0
328.0
401.3
485.9
540.8
0
100
200
300
400
500
600
2010 2015 2020 2025 2030
Total
Urban
S.U./S.T.
Rural
Commercial
Industry
MLD
123.7 140.5 159.2 179.4 194.5
101.5 128.4
160.0 196.0
216.1
9.7
20.0
32.7
48.0 53.3
266.0
328.0
401.3
485.9
540.8
0
100
200
300
400
500
600
2010 2015 2020 2025 2030
Industry
Commercial
Rural
S.U./S.T.
Urban
Total
MLD
-
100.0
200.0
300.0
400.0
500.0
600.0
700.0
2011 2012 2013 2014 2015 2016 2017 2018 2019 2020 2021 2022 2023 2024 2025 2026 2027 2028 2029
Newly Construction Scheme for Rural Water Supply(Installed Capacity, Groundwater)
Newly Construction Scheme for Urban/SU&ST WaterSupply (Installed Capacity, Groundwater)
Newly Construction Scheme for Urban/SU&ST WaterSupply (Installed Capacity, Surface Water)
Rehabilitation Scheme for Rural Water Supply(Operating Capacity, Groundwater)
Rehabilitation Scheme for Urban/SU&ST WaterSupply (Operating Capacity, Groundwater)
Rehabilitation Scheme for Urban/SU&ST WaterSupply (Operating Capacity, Surface Water)
Existing Rural Water Supply from 2010(Groundwater)
Existing Urban/SU&ST Water Supply from 2010(Groundwater)
Existing Urban/SU&ST Water Supply from 2010(Surface Water)
266.0
540.8
Water Demand
MP 1st Stage MP 2nd Stage MP 3rd StageMLD
72.9%
81.8%
90.8%
100.0% 100.0%
0%
20%
40%
60%
80%
100%
2010 2015 2020 2025 2030
Total
Urban
S.U./S.T.
Rural

The Project for Review and Update of Nigeria National Water Resources Master Plan
Volume-5, SR5 (SR5-32)
Source: JICA Project Team
Figure 5.1-1 Demand and Supply in Water Supply Development Plan for Facility Planning (14/38)
13. Ekiti
Figure 13-1 Population Growth by Settlement Category Figure 13-2 Population Growth with Distribution of Settlement Category
Figure 13-3 Water Supply Coverage by Settlement Category Figure 13-4 Population and Population Served
Figure 13-5 Water Demand Growth by Water Use Category Figure 13-6 Water Demand Growth with Distribution of Water Use Category
Figure 13-7 Demand and Supply in Water Supply Development Plan for Facility Planning
2,696 3,046
3,435
3,848
4,288
0
500
1,000
1,500
2,000
2,500
3,000
3,500
4,000
4,500
5,000
2010 2015 2020 2025 2030
Total
Urban
S.U./S.T.
Rural
(x1,000)
408 465 528 594 666
1,291 1,459 1,645
1,844 2,056
997 1,123
1,262 1,410
1,567
2,696 3,046
3,435
3,848
4,288
0
500
1,000
1,500
2,000
2,500
3,000
3,500
4,000
4,500
5,000
2010 2015 2020 2025 2030
Rural
S.U./S.T.
Urban
Total
(x1,000)
2,696 3,046
3,435
3,848
4,288
1,687
2,287
3,007
3,848
4,288
0
500
1,000
1,500
2,000
2,500
3,000
3,500
4,000
4,500
5,000
2010 2015 2020 2025 2030
Total
PopulationServed
(x1,000)
149.7
202.8
267.2
343.3
387.9
0
50
100
150
200
250
300
350
400
450
2010 2015 2020 2025 2030
Total
Urban
S.U./S.T.
Rural
Commercial
Industry
MLD
49.2 63.9 81.5 101.9 114.1 68.3
93.1 123.0
158.0 176.2
15.6
22.9
31.8
42.3 47.0
149.7
202.8
267.2
343.3
387.9
0
50
100
150
200
250
300
350
400
450
2010 2015 2020 2025 2030
Industry
Commercial
Rural
S.U./S.T.
Urban
Total
MLD
-
50.0
100.0
150.0
200.0
250.0
300.0
350.0
400.0
450.0
2011 2012 2013 2014 2015 2016 2017 2018 2019 2020 2021 2022 2023 2024 2025 2026 2027 2028 2029
Newly Construction Scheme for Rural Water Supply(Installed Capacity, Groundwater)
Newly Construction Scheme for Urban/SU&ST WaterSupply (Installed Capacity, Groundwater)
Newly Construction Scheme for Urban/SU&ST WaterSupply (Installed Capacity, Surface Water)
Rehabilitation Scheme for Rural Water Supply(Operating Capacity, Groundwater)
Rehabilitation Scheme for Urban/SU&ST WaterSupply (Operating Capacity, Groundwater)
Rehabilitation Scheme for Urban/SU&ST WaterSupply (Operating Capacity, Surface Water)
Existing Rural Water Supply from 2010(Groundwater)
Existing Urban/SU&ST Water Supply from 2010(Groundwater)
Existing Urban/SU&ST Water Supply from 2010(Surface Water)
149.7
387.9
Water Demand
MP 1st Stage MP 2nd Stage MP 3rd StageMLD
62.6%
75.1%
87.5%
100.0% 100.0%
0%
20%
40%
60%
80%
100%
2010 2015 2020 2025 2030
Total
Urban
S.U./S.T.
Rural
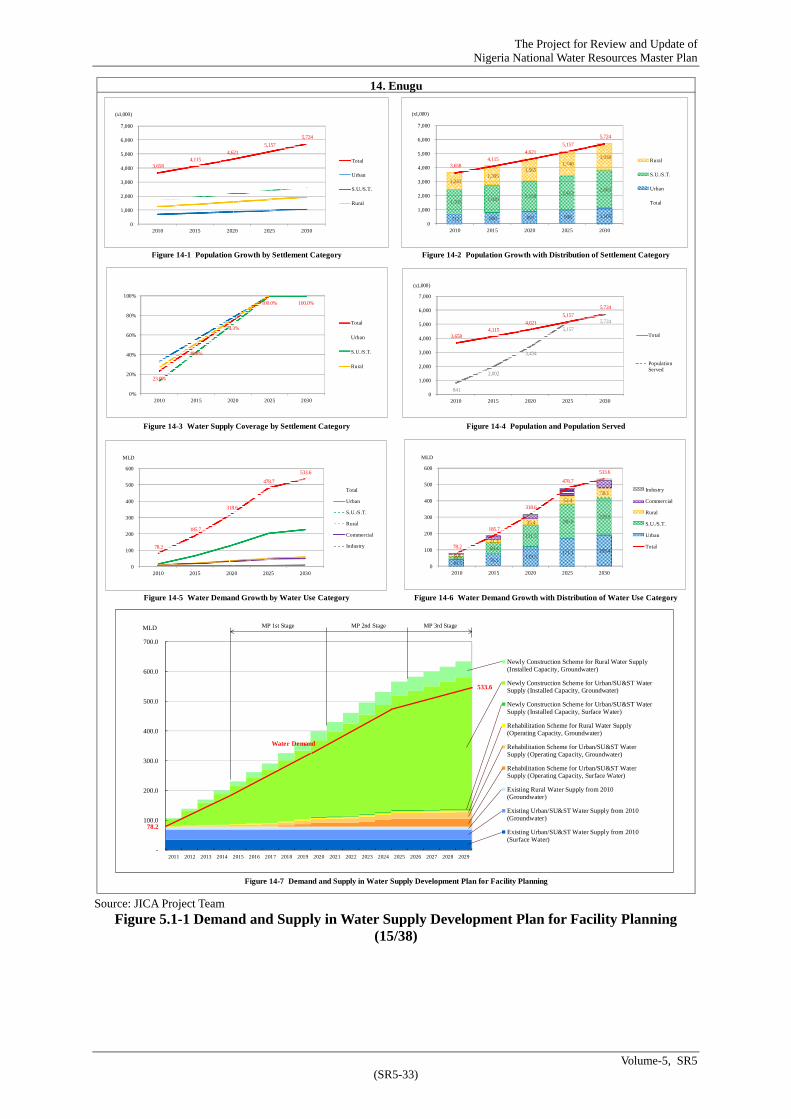
The Project for Review and Update of Nigeria National Water Resources Master Plan
Volume-5, SR5 (SR5-33)
Source: JICA Project Team
Figure 5.1-1 Demand and Supply in Water Supply Development Plan for Facility Planning (15/38)
14. Enugu
Figure 14-1 Population Growth by Settlement Category Figure 14-2 Population Growth with Distribution of Settlement Category
Figure 14-3 Water Supply Coverage by Settlement Category Figure 14-4 Population and Population Served
Figure 14-5 Water Demand Growth by Water Use Category Figure 14-6 Water Demand Growth with Distribution of Water Use Category
Figure 14-7 Demand and Supply in Water Supply Development Plan for Facility Planning
3,658 4,115
4,621
5,157
5,724
0
1,000
2,000
3,000
4,000
5,000
6,000
7,000
2010 2015 2020 2025 2030
Total
Urban
S.U./S.T.
Rural
(x1,000)
712 800 897 998 1,105
1,705 1,920 2,159
2,413 2,682
1,241 1,395
1,565 1,746
1,938
3,658 4,115
4,621
5,157
5,724
0
1,000
2,000
3,000
4,000
5,000
6,000
7,000
2010 2015 2020 2025 2030
Rural
S.U./S.T.
Urban
Total
(x1,000)
3,658 4,115
4,621
5,157
5,724
841
2,002
3,434
5,157
5,724
0
1,000
2,000
3,000
4,000
5,000
6,000
7,000
2010 2015 2020 2025 2030
Total
PopulationServed
(x1,000)
78.2
185.7
318.6
478.7
533.6
0
100
200
300
400
500
600
2010 2015 2020 2025 2030
Total
Urban
S.U./S.T.
Rural
Commercial
Industry
MLD
40.5 76.1 119.5
171.1 189.4 19.3
69.4
131.5
206.8 229.9
9.8
21.3
35.4
52.4 58.1
78.2
185.7
318.6
478.7
533.6
0
100
200
300
400
500
600
2010 2015 2020 2025 2030
Industry
Commercial
Rural
S.U./S.T.
Urban
Total
MLD
-
100.0
200.0
300.0
400.0
500.0
600.0
700.0
2011 2012 2013 2014 2015 2016 2017 2018 2019 2020 2021 2022 2023 2024 2025 2026 2027 2028 2029
Newly Construction Scheme for Rural Water Supply(Installed Capacity, Groundwater)
Newly Construction Scheme for Urban/SU&ST WaterSupply (Installed Capacity, Groundwater)
Newly Construction Scheme for Urban/SU&ST WaterSupply (Installed Capacity, Surface Water)
Rehabilitation Scheme for Rural Water Supply(Operating Capacity, Groundwater)
Rehabilitation Scheme for Urban/SU&ST WaterSupply (Operating Capacity, Groundwater)
Rehabilitation Scheme for Urban/SU&ST WaterSupply (Operating Capacity, Surface Water)
Existing Rural Water Supply from 2010(Groundwater)
Existing Urban/SU&ST Water Supply from 2010(Groundwater)
Existing Urban/SU&ST Water Supply from 2010(Surface Water)
78.2
533.6
Water Demand
MP 1st Stage MP 2nd Stage MP 3rd StageMLD
23.0%
48.6%
74.3%
100.0% 100.0%
0%
20%
40%
60%
80%
100%
2010 2015 2020 2025 2030
Total
Urban
S.U./S.T.
Rural

The Project for Review and Update of Nigeria National Water Resources Master Plan
Volume-5, SR5 (SR5-34)
Source: JICA Project Team
Figure 5.1-1 Demand and Supply in Water Supply Development Plan for Facility Planning (16/38)
15. Gombe
Figure 15-1 Population Growth by Settlement Category Figure 15-2 Population Growth with Distribution of Settlement Category
Figure 15-3 Water Supply Coverage by Settlement Category Figure 15-4 Population and Population Served
Figure 15-5 Water Demand Growth by Water Use Category Figure 15-6 Water Demand Growth with Distribution of Water Use Category
Figure 15-7 Demand and Supply in Water Supply Development Plan for Facility Planning
2,670 3,029
3,431
3,860
4,318
0
500
1,000
1,500
2,000
2,500
3,000
3,500
4,000
4,500
5,000
2010 2015 2020 2025 2030
Total
Urban
S.U./S.T.
Rural
(x1,000)
190 215 243 272 303
1,305 1,479 1,674 1,880 2,101
1,175 1,335
1,515 1,708
1,915 2,670
3,029
3,431
3,860
4,318
0
500
1,000
1,500
2,000
2,500
3,000
3,500
4,000
4,500
5,000
2010 2015 2020 2025 2030
Rural
S.U./S.T.
Urban
Total
(x1,000)
2,670 3,029
3,431
3,860
4,318
874
1,670
2,661
3,860
4,318
0
500
1,000
1,500
2,000
2,500
3,000
3,500
4,000
4,500
5,000
2010 2015 2020 2025 2030
Total
PopulationServed
(x1,000)
67.1
125.3
197.5
284.8
319.3
0
50
100
150
200
250
300
350
2010 2015 2020 2025 2030
Total
Urban
S.U./S.T.
Rural
Commercial
Industry
MLD
12.8 21.9 33.2 46.6 51.9 39.9 72.4
112.7
161.2 180.0
7.8
19.2
33.6
51.2
57.4
67.1
125.3
197.5
284.8
319.3
0
50
100
150
200
250
300
350
2010 2015 2020 2025 2030
Industry
Commercial
Rural
S.U./S.T.
Urban
Total
MLD
-
50.0
100.0
150.0
200.0
250.0
300.0
350.0
400.0
2011 2012 2013 2014 2015 2016 2017 2018 2019 2020 2021 2022 2023 2024 2025 2026 2027 2028 2029
Newly Construction Scheme for Rural Water Supply(Installed Capacity, Groundwater)
Newly Construction Scheme for Urban/SU&ST WaterSupply (Installed Capacity, Groundwater)
Newly Construction Scheme for Urban/SU&ST WaterSupply (Installed Capacity, Surface Water)
Rehabilitation Scheme for Rural Water Supply(Operating Capacity, Groundwater)
Rehabilitation Scheme for Urban/SU&ST WaterSupply (Operating Capacity, Groundwater)
Rehabilitation Scheme for Urban/SU&ST WaterSupply (Operating Capacity, Surface Water)
Existing Rural Water Supply from 2010(Groundwater)
Existing Urban/SU&ST Water Supply from 2010(Groundwater)
Existing Urban/SU&ST Water Supply from 2010(Surface Water)
67.1
319.3
Water Demand
MP 1st Stage MP 2nd Stage MP 3rd StageMLD
32.7%
55.1%
77.6%
100.0% 100.0%
0%
20%
40%
60%
80%
100%
2010 2015 2020 2025 2030
Total
Urban
S.U./S.T.
Rural
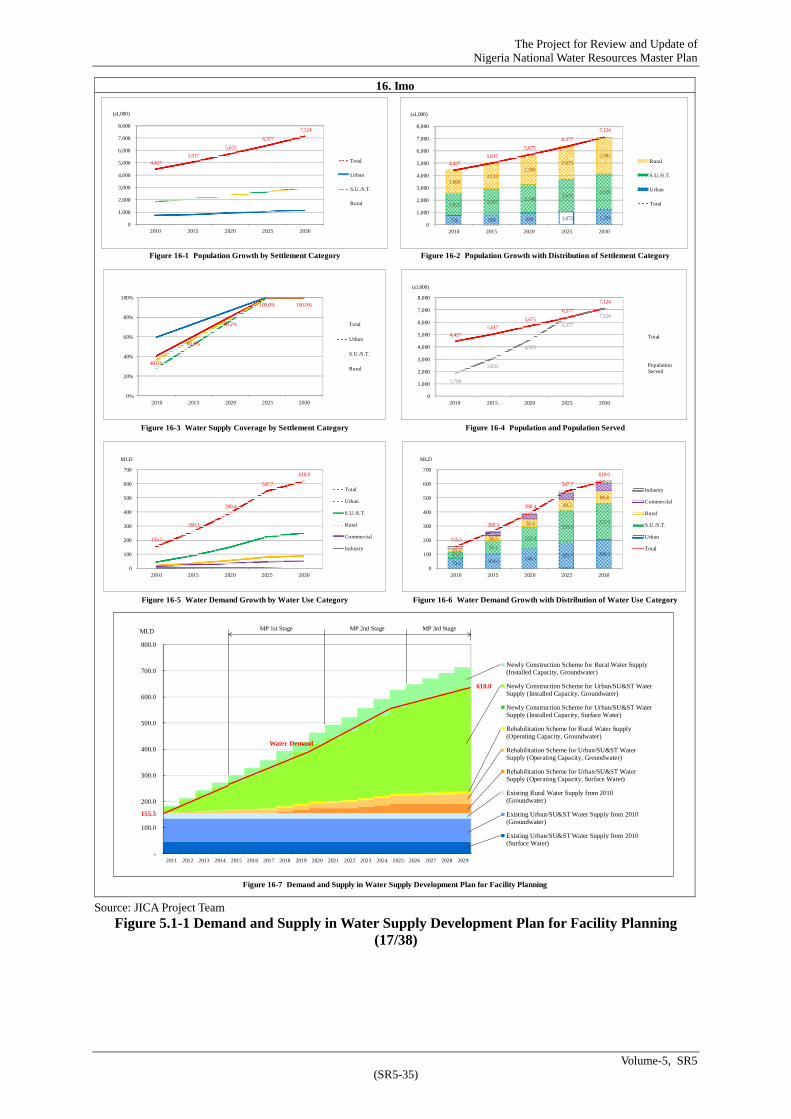
The Project for Review and Update of Nigeria National Water Resources Master Plan
Volume-5, SR5 (SR5-35)
Source: JICA Project Team
Figure 5.1-1 Demand and Supply in Water Supply Development Plan for Facility Planning (17/38)
16. Imo
Figure 16-1 Population Growth by Settlement Category Figure 16-2 Population Growth with Distribution of Settlement Category
Figure 16-3 Water Supply Coverage by Settlement Category Figure 16-4 Population and Population Served
Figure 16-5 Water Demand Growth by Water Use Category Figure 16-6 Water Demand Growth with Distribution of Water Use Category
Figure 16-7 Demand and Supply in Water Supply Development Plan for Facility Planning
4,427 5,017
5,675
6,377
7,124
0
1,000
2,000
3,000
4,000
5,000
6,000
7,000
8,000
2010 2015 2020 2025 2030
Total
Urban
S.U./S.T.
Rural
(x1,000)
736 836 949 1,072 1,204
1,823 2,067 2,340
2,631 2,939
1,868 2,113
2,386 2,675
2,981
4,427 5,017
5,675
6,377
7,124
0
1,000
2,000
3,000
4,000
5,000
6,000
7,000
8,000
2010 2015 2020 2025 2030
Rural
S.U./S.T.
Urban
Total
(x1,000)
4,427 5,017
5,675
6,377
7,124
1,799
3,032
4,553
6,377
7,124
0
1,000
2,000
3,000
4,000
5,000
6,000
7,000
8,000
2010 2015 2020 2025 2030
Total
PopulationServed
(x1,000)
155.5
260.3
390.4
547.7
618.0
0
100
200
300
400
500
600
700
2010 2015 2020 2025 2030
Total
Urban
S.U./S.T.
Rural
Commercial
Industry
MLD
74.4 104.2 140.5 183.7 206.3 43.8
92.1
152.4
225.5 252.0
20.4
36.5
56.4
80.2
89.4
155.5
260.3
390.4
547.7
618.0
0
100
200
300
400
500
600
700
2010 2015 2020 2025 2030
Industry
Commercial
Rural
S.U./S.T.
Urban
Total
MLD
-
100.0
200.0
300.0
400.0
500.0
600.0
700.0
800.0
2011 2012 2013 2014 2015 2016 2017 2018 2019 2020 2021 2022 2023 2024 2025 2026 2027 2028 2029
Newly Construction Scheme for Rural Water Supply(Installed Capacity, Groundwater)
Newly Construction Scheme for Urban/SU&ST WaterSupply (Installed Capacity, Groundwater)
Newly Construction Scheme for Urban/SU&ST WaterSupply (Installed Capacity, Surface Water)
Rehabilitation Scheme for Rural Water Supply(Operating Capacity, Groundwater)
Rehabilitation Scheme for Urban/SU&ST WaterSupply (Operating Capacity, Groundwater)
Rehabilitation Scheme for Urban/SU&ST WaterSupply (Operating Capacity, Surface Water)
Existing Rural Water Supply from 2010(Groundwater)
Existing Urban/SU&ST Water Supply from 2010(Groundwater)
Existing Urban/SU&ST Water Supply from 2010(Surface Water)
155.5
618.0
Water Demand
MP 1st Stage MP 2nd Stage MP 3rd StageMLD
40.6%
60.4%
80.2%
100.0% 100.0%
0%
20%
40%
60%
80%
100%
2010 2015 2020 2025 2030
Total
Urban
S.U./S.T.
Rural

The Project for Review and Update of Nigeria National Water Resources Master Plan
Volume-5, SR5 (SR5-36)
Source: JICA Project Team
Figure 5.1-1 Demand and Supply in Water Supply Development Plan for Facility Planning (18/38)
17. Jigawa
Figure 17-1 Population Growth by Settlement Category Figure 17-2 Population Growth with Distribution of Settlement Category
Figure 17-3 Water Supply Coverage by Settlement Category Figure 17-4 Population and Population Served
Figure 17-5 Water Demand Growth by Water Use Category Figure 17-6 Water Demand Growth with Distribution of Water Use Category
Figure 17-7 Demand and Supply in Water Supply Development Plan for Facility Planning
4,864 5,451
6,100
6,783
7,504
0
1,000
2,000
3,000
4,000
5,000
6,000
7,000
8,000
2010 2015 2020 2025 2030
Total
Urban
S.U./S.T.
Rural
(x1,000)
391 444 503 566 632
2,304 2,584 2,894 3,221 3,566
2,169 2,423
2,703 2,996
3,305 4,864
5,451
6,100
6,783
7,504
0
1,000
2,000
3,000
4,000
5,000
6,000
7,000
8,000
2010 2015 2020 2025 2030
Rural
S.U./S.T.
Urban
Total
(x1,000)
4,864 5,451
6,100
6,783
7,504
3,498
4,431
5,530
6,783
7,504
0
1,000
2,000
3,000
4,000
5,000
6,000
7,000
8,000
2010 2015 2020 2025 2030
Total
PopulationServed
(x1,000)
264.6
335.2
419.0
515.5
575.9
0
100
200
300
400
500
600
700
2010 2015 2020 2025 2030
Total
Urban
S.U./S.T.
Rural
Commercial
Industry
MLD
51.5 64.4 79.6 97.0 108.4
146.5 183.4
226.7 276.1
305.7 41.3
55.0
71.2
89.9 99.2
264.6
335.2
419.0
515.5
575.9
0
100
200
300
400
500
600
700
2010 2015 2020 2025 2030
Industry
Commercial
Rural
S.U./S.T.
Urban
Total
MLD
-
100.0
200.0
300.0
400.0
500.0
600.0
700.0
2011 2012 2013 2014 2015 2016 2017 2018 2019 2020 2021 2022 2023 2024 2025 2026 2027 2028 2029
Newly Construction Scheme for Rural Water Supply(Installed Capacity, Groundwater)
Newly Construction Scheme for Urban/SU&ST WaterSupply (Installed Capacity, Groundwater)
Newly Construction Scheme for Urban/SU&ST WaterSupply (Installed Capacity, Surface Water)
Rehabilitation Scheme for Rural Water Supply(Operating Capacity, Groundwater)
Rehabilitation Scheme for Urban/SU&ST WaterSupply (Operating Capacity, Groundwater)
Rehabilitation Scheme for Urban/SU&ST WaterSupply (Operating Capacity, Surface Water)
Existing Rural Water Supply from 2010(Groundwater)
Existing Urban/SU&ST Water Supply from 2010(Groundwater)
Existing Urban/SU&ST Water Supply from 2010(Surface Water)
264.6
575.9
Water Demand
MP 1st Stage MP 2nd Stage MP 3rd StageMLD
71.9%
81.3%
90.6%
100.0% 100.0%
0%
20%
40%
60%
80%
100%
2010 2015 2020 2025 2030
Total
Urban
S.U./S.T.
Rural
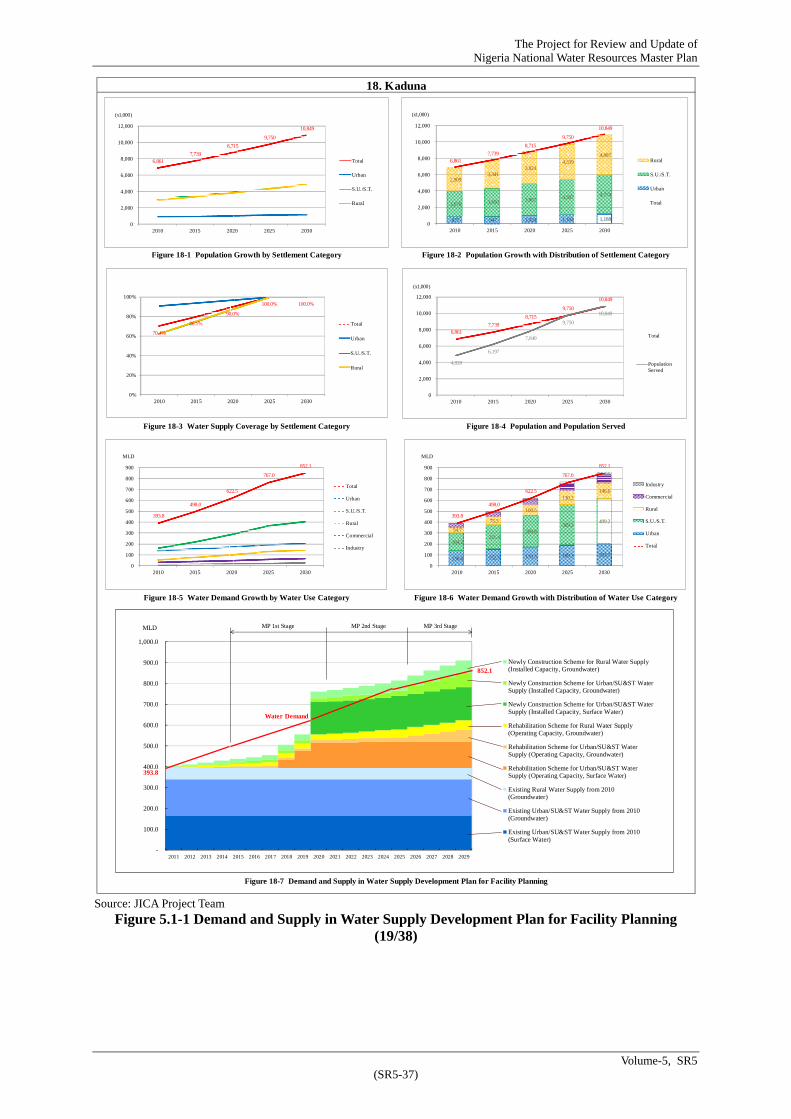
The Project for Review and Update of Nigeria National Water Resources Master Plan
Volume-5, SR5 (SR5-37)
Source: JICA Project Team
Figure 5.1-1 Demand and Supply in Water Supply Development Plan for Facility Planning (19/38)
18. Kaduna
Figure 18-1 Population Growth by Settlement Category Figure 18-2 Population Growth with Distribution of Settlement Category
Figure 18-3 Water Supply Coverage by Settlement Category Figure 18-4 Population and Population Served
Figure 18-5 Water Demand Growth by Water Use Category Figure 18-6 Water Demand Growth with Distribution of Water Use Category
Figure 18-7 Demand and Supply in Water Supply Development Plan for Facility Planning
6,861 7,739
8,715
9,750
10,849
0
2,000
4,000
6,000
8,000
10,000
12,000
2010 2015 2020 2025 2030
Total
Urban
S.U./S.T.
Rural
(x1,000)
877 947 1,024 1,104 1,188
3,076 3,450 3,867 4,307 4,774
2,909 3,341
3,824 4,339
4,887 6,861
7,739
8,715
9,750
10,849
0
2,000
4,000
6,000
8,000
10,000
12,000
2010 2015 2020 2025 2030
Rural
S.U./S.T.
Urban
Total
(x1,000)
6,861 7,739
8,715
9,750
10,849
4,828
6,197
7,840
9,750
10,849
0
2,000
4,000
6,000
8,000
10,000
12,000
2010 2015 2020 2025 2030
Total
PopulationServed
(x1,000)
393.8
498.0
622.5
767.0
852.1
0
100
200
300
400
500
600
700
800
900
2010 2015 2020 2025 2030
Total
Urban
S.U./S.T.
Rural
Commercial
Industry
MLD
136.6 152.5 170.3 189.3 203.7
164.2 221.4
289.8 369.2
409.2
54.7
75.3
100.5
130.2 146.6
393.8
498.0
622.5
767.0
852.1
0
100
200
300
400
500
600
700
800
900
2010 2015 2020 2025 2030
Industry
Commercial
Rural
S.U./S.T.
Urban
Total
MLD
-
100.0
200.0
300.0
400.0
500.0
600.0
700.0
800.0
900.0
1,000.0
2011 2012 2013 2014 2015 2016 2017 2018 2019 2020 2021 2022 2023 2024 2025 2026 2027 2028 2029
Newly Construction Scheme for Rural Water Supply(Installed Capacity, Groundwater)
Newly Construction Scheme for Urban/SU&ST WaterSupply (Installed Capacity, Groundwater)
Newly Construction Scheme for Urban/SU&ST WaterSupply (Installed Capacity, Surface Water)
Rehabilitation Scheme for Rural Water Supply(Operating Capacity, Groundwater)
Rehabilitation Scheme for Urban/SU&ST WaterSupply (Operating Capacity, Groundwater)
Rehabilitation Scheme for Urban/SU&ST WaterSupply (Operating Capacity, Surface Water)
Existing Rural Water Supply from 2010(Groundwater)
Existing Urban/SU&ST Water Supply from 2010(Groundwater)
Existing Urban/SU&ST Water Supply from 2010(Surface Water)
393.8
852.1
Water Demand
MP 1st Stage MP 2nd Stage MP 3rd StageMLD
70.4%
80.1%
90.0%
100.0% 100.0%
0%
20%
40%
60%
80%
100%
2010 2015 2020 2025 2030
Total
Urban
S.U./S.T.
Rural

The Project for Review and Update of Nigeria National Water Resources Master Plan
Volume-5, SR5 (SR5-38)
Source: JICA Project Team
Figure 5.1-1 Demand and Supply in Water Supply Development Plan for Facility Planning (20/38)
19. Kano
Figure 19-1 Population Growth by Settlement Category Figure 19-2 Population Growth with Distribution of Settlement Category
Figure 19-3 Water Supply Coverage by Settlement Category Figure 19-4 Population and Population Served
Figure 19-5 Water Demand Growth by Water Use Category Figure 19-6 Water Demand Growth with Distribution of Water Use Category
Figure 19-7 Demand and Supply in Water Supply Development Plan for Facility Planning
10,663 12,160
13,843
15,646
17,581
0
2,000
4,000
6,000
8,000
10,000
12,000
14,000
16,000
18,000
20,000
2010 2015 2020 2025 2030
Total
Urban
S.U./S.T.
Rural
(x1,000)
1,238 1,408 1,598 1,801 2,018
5,576 6,351 7,221
8,151 9,149
3,849 4,401
5,024 5,694
6,414
10,663 12,160
13,843
15,646
17,581
0
2,000
4,000
6,000
8,000
10,000
12,000
14,000
16,000
18,000
20,000
2010 2015 2020 2025 2030
Rural
S.U./S.T.
Urban
Total
(x1,000)
10,663 12,160
13,843
15,646
17,581
6,314
8,852
11,959
15,646
17,581
0
2,000
4,000
6,000
8,000
10,000
12,000
14,000
16,000
18,000
20,000
2010 2015 2020 2025 2030
Total
PopulationServed
(x1,000)
628.7
868.5
1,164.6
1,520.7
1,741.3
0
200
400
600
800
1,000
1,200
1,400
1,600
1,800
2,000
2010 2015 2020 2025 2030
Total
Urban
S.U./S.T.
Rural
Commercial
Industry
MLD
126.1 176.0 236.9 308.8 346.0 324.1
427.5 552.5
698.7 784.2
39.4
74.0
117.6
170.8 192.4
628.7
868.5
1,164.6
1,520.7
1,741.3
0
200
400
600
800
1,000
1,200
1,400
1,600
1,800
2,000
2010 2015 2020 2025 2030
Industry
Commercial
Rural
S.U./S.T.
Urban
Total
MLD
-
200.0
400.0
600.0
800.0
1,000.0
1,200.0
1,400.0
1,600.0
1,800.0
2,000.0
2011 2012 2013 2014 2015 2016 2017 2018 2019 2020 2021 2022 2023 2024 2025 2026 2027 2028 2029
Newly Construction Scheme for Rural Water Supply(Installed Capacity, Groundwater)
Newly Construction Scheme for Urban/SU&ST WaterSupply (Installed Capacity, Groundwater)
Newly Construction Scheme for Urban/SU&ST WaterSupply (Installed Capacity, Surface Water)
Rehabilitation Scheme for Rural Water Supply(Operating Capacity, Groundwater)
Rehabilitation Scheme for Urban/SU&ST WaterSupply (Operating Capacity, Groundwater)
Rehabilitation Scheme for Urban/SU&ST WaterSupply (Operating Capacity, Surface Water)
Existing Rural Water Supply from 2010(Groundwater)
Existing Urban/SU&ST Water Supply from 2010(Groundwater)
Existing Urban/SU&ST Water Supply from 2010(Surface Water)
628.7
1,741.3
Water Demand
MP 1st Stage MP 2nd Stage MP 3rd StageMLD
59.2%
72.8%
86.4%
100.0% 100.0%
0%
20%
40%
60%
80%
100%
2010 2015 2020 2025 2030
Total
Urban
S.U./S.T.
Rural

The Project for Review and Update of Nigeria National Water Resources Master Plan
Volume-5, SR5 (SR5-39)
Source: JICA Project Team
Figure 5.1-1 Demand and Supply in Water Supply Development Plan for Facility Planning (21/38)
20. Katsina
Figure 20-1 Population Growth by Settlement Category Figure 20-2 Population Growth with Distribution of Settlement Category
Figure 20-3 Water Supply Coverage by Settlement Category Figure 20-4 Population and Population Served
Figure 20-5 Water Demand Growth by Water Use Category Figure 20-6 Water Demand Growth with Distribution of Water Use Category
Figure 20-7 Demand and Supply in Water Supply Development Plan for Facility Planning
6,503 7,326
8,239
9,205
10,231
0
2,000
4,000
6,000
8,000
10,000
12,000
2010 2015 2020 2025 2030
Total
Urban
S.U./S.T.
Rural
(x1,000)
530 601 680 766 858
3,062 3,448 3,876 4,328 4,808
2,911 3,277
3,683 4,112
4,566 6,503
7,326
8,239
9,205
10,231
0
2,000
4,000
6,000
8,000
10,000
12,000
2010 2015 2020 2025 2030
Rural
S.U./S.T.
Urban
Total
(x1,000)
6,503 7,326
8,239
9,205
10,231
2,491
4,315
6,547
9,205
10,231
0
2,000
4,000
6,000
8,000
10,000
12,000
2010 2015 2020 2025 2030
Total
PopulationServed
(x1,000)
186.3
322.3
489.3
689.2
770.0
0
100
200
300
400
500
600
700
800
900
2010 2015 2020 2025 2030
Total
Urban
S.U./S.T.
Rural
Commercial
Industry
MLD
56.9 77.3 102.1 131.3 147.0 78.7 157.6
254.7
371.0 412.1
33.3
57.7
87.7
123.3 137.0
186.3
322.3
489.3
689.2
770.0
0
100
200
300
400
500
600
700
800
900
2010 2015 2020 2025 2030
Industry
Commercial
Rural
S.U./S.T.
Urban
Total
MLD
-
100.0
200.0
300.0
400.0
500.0
600.0
700.0
800.0
900.0
1,000.0
2011 2012 2013 2014 2015 2016 2017 2018 2019 2020 2021 2022 2023 2024 2025 2026 2027 2028 2029
Newly Construction Scheme for Rural Water Supply(Installed Capacity, Groundwater)
Newly Construction Scheme for Urban/SU&ST WaterSupply (Installed Capacity, Groundwater)
Newly Construction Scheme for Urban/SU&ST WaterSupply (Installed Capacity, Surface Water)
Rehabilitation Scheme for Rural Water Supply(Operating Capacity, Groundwater)
Rehabilitation Scheme for Urban/SU&ST WaterSupply (Operating Capacity, Groundwater)
Rehabilitation Scheme for Urban/SU&ST WaterSupply (Operating Capacity, Surface Water)
Existing Rural Water Supply from 2010(Groundwater)
Existing Urban/SU&ST Water Supply from 2010(Groundwater)
Existing Urban/SU&ST Water Supply from 2010(Surface Water)
186.3
770.0
Water Demand
MP 1st Stage MP 2nd Stage MP 3rd StageMLD
38.3%
58.9%
79.5%
100.0% 100.0%
0%
20%
40%
60%
80%
100%
2010 2015 2020 2025 2030
Total
Urban
S.U./S.T.
Rural

The Project for Review and Update of Nigeria National Water Resources Master Plan
Volume-5, SR5 (SR5-40)
Source: JICA Project Team
Figure 5.1-1 Demand and Supply in Water Supply Development Plan for Facility Planning (22/38)
21. Kebbi
Figure 21-1 Population Growth by Settlement Category Figure 21-2 Population Growth with Distribution of Settlement Category
Figure 21-3 Water Supply Coverage by Settlement Category Figure 21-4 Population and Population Served
Figure 21-5 Water Demand Growth by Water Use Category Figure 21-6 Water Demand Growth with Distribution of Water Use Category
Figure 21-7 Demand and Supply in Water Supply Development Plan for Facility Planning
3,668 4,152
4,692
5,267
5,880
0
1,000
2,000
3,000
4,000
5,000
6,000
7,000
2010 2015 2020 2025 2030
Total
Urban
S.U./S.T.
Rural
(x1,000)
247 282 320 361 406
1,588 1,800 2,037 2,290 2,559
1,833 2,070
2,335 2,616
2,915 3,668
4,152
4,692
5,267
5,880
0
1,000
2,000
3,000
4,000
5,000
6,000
7,000
2010 2015 2020 2025 2030
Rural
S.U./S.T.
Urban
Total
(x1,000)
3,668 4,152
4,692
5,267
5,880
1,587
2,582
3,805
5,267
5,880
0
1,000
2,000
3,000
4,000
5,000
6,000
7,000
2010 2015 2020 2025 2030
Total
PopulationServed
(x1,000)
113.8
182.9
268.0
370.2
415.6
0
50
100
150
200
250
300
350
400
450
2010 2015 2020 2025 2030
Total
Urban
S.U./S.T.
Rural
Commercial
Industry
MLD
25.0 35.0 47.4 61.9 69.5 59.2
96.2
141.7
196.3 219.4
18.9
34.9
54.7
78.5
87.5
113.8
182.9
268.0
370.2
415.6
0
50
100
150
200
250
300
350
400
450
2010 2015 2020 2025 2030
Industry
Commercial
Rural
S.U./S.T.
Urban
Total
MLD
-
50.0
100.0
150.0
200.0
250.0
300.0
350.0
400.0
450.0
500.0
2011 2012 2013 2014 2015 2016 2017 2018 2019 2020 2021 2022 2023 2024 2025 2026 2027 2028 2029
Newly Construction Scheme for Rural Water Supply(Installed Capacity, Groundwater)
Newly Construction Scheme for Urban/SU&ST WaterSupply (Installed Capacity, Groundwater)
Newly Construction Scheme for Urban/SU&ST WaterSupply (Installed Capacity, Surface Water)
Rehabilitation Scheme for Rural Water Supply(Operating Capacity, Groundwater)
Rehabilitation Scheme for Urban/SU&ST WaterSupply (Operating Capacity, Groundwater)
Rehabilitation Scheme for Urban/SU&ST WaterSupply (Operating Capacity, Surface Water)
Existing Rural Water Supply from 2010(Groundwater)
Existing Urban/SU&ST Water Supply from 2010(Groundwater)
Existing Urban/SU&ST Water Supply from 2010(Surface Water)
113.8
415.6
Water Demand
MP 1st Stage MP 2nd Stage MP 3rd StageMLD
43.3%
62.2%
81.1%
100.0% 100.0%
0%
20%
40%
60%
80%
100%
2010 2015 2020 2025 2030
Total
Urban
S.U./S.T.
Rural

The Project for Review and Update of Nigeria National Water Resources Master Plan
Volume-5, SR5 (SR5-41)
Source: JICA Project Team
Figure 5.1-1 Demand and Supply in Water Supply Development Plan for Facility Planning (23/38)
22. Kogi
Figure 22-1 Population Growth by Settlement Category Figure 22-2 Population Growth with Distribution of Settlement Category
Figure 22-3 Water Supply Coverage by Settlement Category Figure 22-4 Population and Population Served
Figure 22-5 Water Demand Growth by Water Use Category Figure 22-6 Water Demand Growth with Distribution of Water Use Category
Figure 22-7 Demand and Supply in Water Supply Development Plan for Facility Planning
3,713 4,181
4,699
5,248
5,831
0
1,000
2,000
3,000
4,000
5,000
6,000
7,000
2010 2015 2020 2025 2030
Total
Urban
S.U./S.T.
Rural
(x1,000)
359 405 457 512 572
1,894 2,129 2,388 2,662 2,952
1,460 1,647
1,855 2,074
2,307 3,713
4,181 4,699
5,248
5,831
0
1,000
2,000
3,000
4,000
5,000
6,000
7,000
2010 2015 2020 2025 2030
Rural
S.U./S.T.
Urban
Total
(x1,000)
3,713 4,181
4,699
5,248
5,831
1,353
2,409
3,704
5,248
5,831
0
1,000
2,000
3,000
4,000
5,000
6,000
7,000
2010 2015 2020 2025 2030
Total
PopulationServed
(x1,000)
110.6
194.8
298.3
422.4
473.0
0
50
100
150
200
250
300
350
400
450
500
2010 2015 2020 2025 2030
Total
Urban
S.U./S.T.
Rural
Commercial
Industry
MLD
32.0 47.2 65.8 87.8 98.1 52.8
100.3
158.6
228.2 253.1
13.8
26.8
42.9
62.2
69.2
110.6
194.8
298.3
422.4
473.0
0
50
100
150
200
250
300
350
400
450
500
2010 2015 2020 2025 2030
Industry
Commercial
Rural
S.U./S.T.
Urban
Total
MLD
-
100.0
200.0
300.0
400.0
500.0
600.0
2011 2012 2013 2014 2015 2016 2017 2018 2019 2020 2021 2022 2023 2024 2025 2026 2027 2028 2029
Newly Construction Scheme for Rural Water Supply(Installed Capacity, Groundwater)
Newly Construction Scheme for Urban/SU&ST WaterSupply (Installed Capacity, Groundwater)
Newly Construction Scheme for Urban/SU&ST WaterSupply (Installed Capacity, Surface Water)
Rehabilitation Scheme for Rural Water Supply(Operating Capacity, Groundwater)
Rehabilitation Scheme for Urban/SU&ST WaterSupply (Operating Capacity, Groundwater)
Rehabilitation Scheme for Urban/SU&ST WaterSupply (Operating Capacity, Surface Water)
Existing Rural Water Supply from 2010(Groundwater)
Existing Urban/SU&ST Water Supply from 2010(Groundwater)
Existing Urban/SU&ST Water Supply from 2010(Surface Water)
110.6
473.0
Water Demand
MP 1st Stage MP 2nd Stage MP 3rd StageMLD
36.4%
57.6%
78.8%
100.0% 100.0%
0%
20%
40%
60%
80%
100%
2010 2015 2020 2025 2030
Total
Urban
S.U./S.T.
Rural

The Project for Review and Update of Nigeria National Water Resources Master Plan
Volume-5, SR5 (SR5-42)
Source: JICA Project Team
Figure 5.1-1 Demand and Supply in Water Supply Development Plan for Facility Planning (24/38)
23. Kwara
Figure 23-1 Population Growth by Settlement Category Figure 23-2 Population Growth with Distribution of Settlement Category
Figure 23-3 Water Supply Coverage by Settlement Category Figure 23-4 Population and Population Served
Figure 23-5 Water Demand Growth by Water Use Category Figure 23-6 Water Demand Growth with Distribution of Water Use Category
Figure 23-7 Demand and Supply in Water Supply Development Plan for Facility Planning
2,643 2,968
3,327
3,707
4,108
0
500
1,000
1,500
2,000
2,500
3,000
3,500
4,000
4,500
2010 2015 2020 2025 2030
Total
Urban
S.U./S.T.
Rural
(x1,000)
377 412 449 487 526
1,402 1,561 1,735 1,918 2,110
864 995
1,143 1,301
1,471
2,643 2,968
3,327
3,707
4,108
0
500
1,000
1,500
2,000
2,500
3,000
3,500
4,000
4,500
2010 2015 2020 2025 2030
Rural
S.U./S.T.
Urban
Total
(x1,000)
2,643 2,968
3,327
3,707
4,108
1,678
2,243
2,920
3,707
4,108
0
500
1,000
1,500
2,000
2,500
3,000
3,500
4,000
4,500
2010 2015 2020 2025 2030
Total
PopulationServed
(x1,000)
150.9
200.0
258.5
326.8
363.8
0
50
100
150
200
250
300
350
400
2010 2015 2020 2025 2030
Total
Urban
S.U./S.T.
Rural
Commercial
Industry
MLD
52.9 62.1 72.3 83.5 90.2
65.6 93.3
126.2 164.4
180.9
15.6
22.0
29.7
39.0 44.1
150.9
200.0
258.5
326.8
363.8
0
50
100
150
200
250
300
350
400
2010 2015 2020 2025 2030
Industry
Commercial
Rural
S.U./S.T.
Urban
Total
MLD
-
50.0
100.0
150.0
200.0
250.0
300.0
350.0
400.0
450.0
2011 2012 2013 2014 2015 2016 2017 2018 2019 2020 2021 2022 2023 2024 2025 2026 2027 2028 2029
Newly Construction Scheme for Rural Water Supply(Installed Capacity, Groundwater)
Newly Construction Scheme for Urban/SU&ST WaterSupply (Installed Capacity, Groundwater)
Newly Construction Scheme for Urban/SU&ST WaterSupply (Installed Capacity, Surface Water)
Rehabilitation Scheme for Rural Water Supply(Operating Capacity, Groundwater)
Rehabilitation Scheme for Urban/SU&ST WaterSupply (Operating Capacity, Groundwater)
Rehabilitation Scheme for Urban/SU&ST WaterSupply (Operating Capacity, Surface Water)
Existing Rural Water Supply from 2010(Groundwater)
Existing Urban/SU&ST Water Supply from 2010(Groundwater)
Existing Urban/SU&ST Water Supply from 2010(Surface Water)
150.9
363.8
Water Demand
MP 1st Stage MP 2nd Stage MP 3rd StageMLD
63.5%
75.6%
87.8%
100.0% 100.0%
0%
20%
40%
60%
80%
100%
2010 2015 2020 2025 2030
Total
Urban
S.U./S.T.
Rural

The Project for Review and Update of Nigeria National Water Resources Master Plan
Volume-5, SR5 (SR5-43)
Source: JICA Project Team
Figure 5.1-1 Demand and Supply in Water Supply Development Plan for Facility Planning (25/38)
24. Lagos
Figure 24-1 Population Growth by Settlement Category Figure 24-2 Population Growth with Distribution of Settlement Category
Figure 24-3 Water Supply Coverage by Settlement Category Figure 24-4 Population and Population Served
Figure 24-5 Water Demand Growth by Water Use Category Figure 24-6 Water Demand Growth with Distribution of Water Use Category
Figure 24-7 Demand and Supply in Water Supply Development Plan for Facility Planning
10,293
11,687
13,247
14,912
16,690
0
2,000
4,000
6,000
8,000
10,000
12,000
14,000
16,000
18,000
2010 2015 2020 2025 2030
Total
Urban
S.U./S.T.
Rural
(x1,000)
5,314 5,999 6,762 7,573 8,438
4,452 5,136
5,907 6,737
7,627
528
553
578
602
625
10,293
11,687
13,247
14,912
16,690
0
2,000
4,000
6,000
8,000
10,000
12,000
14,000
16,000
18,000
2010 2015 2020 2025 2030
Rural
S.U./S.T.
Urban
Total
(x1,000)
10,293
11,687
13,247
14,912
16,690
8,434
10,275
12,444
14,912
16,690
0
2,000
4,000
6,000
8,000
10,000
12,000
14,000
16,000
18,000
2010 2015 2020 2025 2030
Total
PopulationServed
(x1,000)
1,397.3
1,716.4
2,101.6
2,555.5
2,933.9
0
500
1,000
1,500
2,000
2,500
3,000
3,500
2010 2015 2020 2025 2030
Total
Urban
S.U./S.T.
Rural
Commercial
Industry
MLD
813.4 955.0 1,117.8 1,298.2 1,446.4 252.6
341.0 449.3
577.5 653.8
8.1 11.2
14.5
18.1 18.8
1,397.3
1,716.4
2,101.6
2,555.5
2,933.9
0
500
1,000
1,500
2,000
2,500
3,000
3,500
2010 2015 2020 2025 2030
Industry
Commercial
Rural
S.U./S.T.
Urban
Total
MLD
-
500.0
1,000.0
1,500.0
2,000.0
2,500.0
3,000.0
3,500.0
2011 2012 2013 2014 2015 2016 2017 2018 2019 2020 2021 2022 2023 2024 2025 2026 2027 2028 2029
Newly Construction Scheme for Rural Water Supply(Installed Capacity, Groundwater)
Newly Construction Scheme for Urban/SU&ST WaterSupply (Installed Capacity, Groundwater)
Newly Construction Scheme for Urban/SU&ST WaterSupply (Installed Capacity, Surface Water)
Rehabilitation Scheme for Rural Water Supply(Operating Capacity, Groundwater)
Rehabilitation Scheme for Urban/SU&ST WaterSupply (Operating Capacity, Groundwater)
Rehabilitation Scheme for Urban/SU&ST WaterSupply (Operating Capacity, Surface Water)
Existing Rural Water Supply from 2010(Groundwater)
Existing Urban/SU&ST Water Supply from 2010(Groundwater)
Existing Urban/SU&ST Water Supply from 2010(Surface Water)
1,397.3
2,933.9
Water Demand
MP 1st Stage MP 2nd Stage MP 3rd StageMLD
81.9%87.9%
93.9%100.0% 100.0%
0%
20%
40%
60%
80%
100%
2010 2015 2020 2025 2030
Total
Urban
S.U./S.T.
Rural
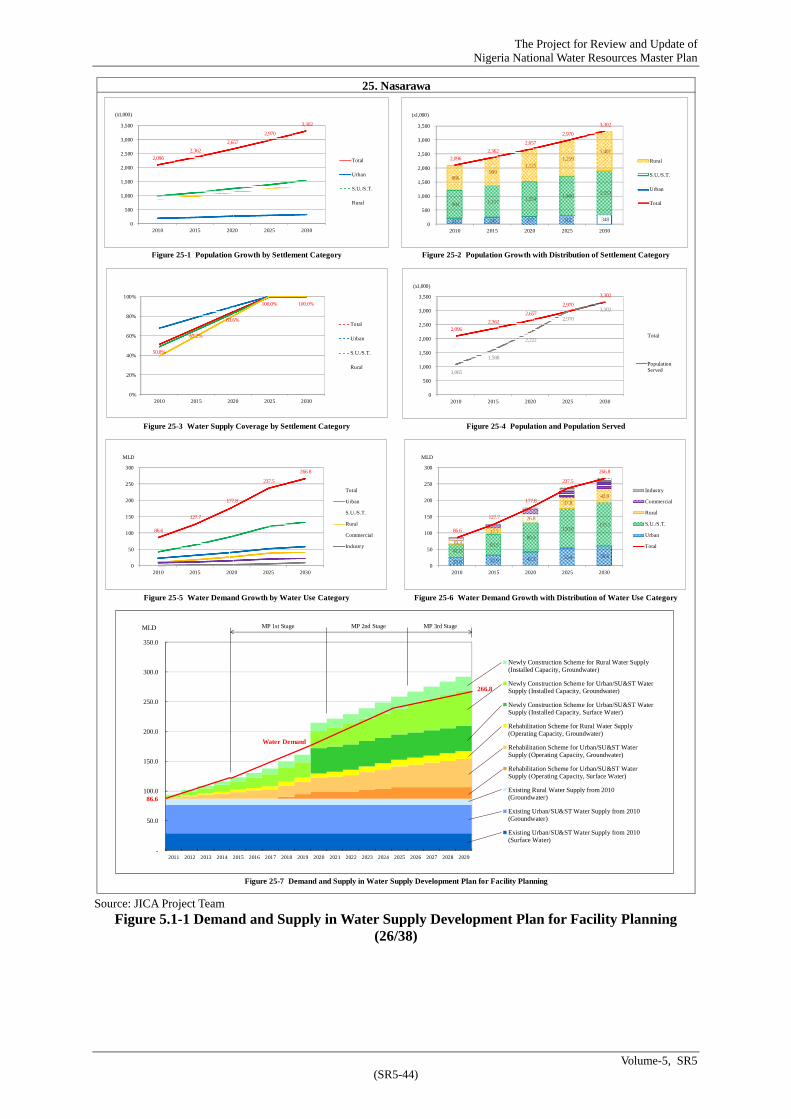
The Project for Review and Update of Nigeria National Water Resources Master Plan
Volume-5, SR5 (SR5-44)
Source: JICA Project Team
Figure 5.1-1 Demand and Supply in Water Supply Development Plan for Facility Planning (26/38)
25. Nasarawa
Figure 25-1 Population Growth by Settlement Category Figure 25-2 Population Growth with Distribution of Settlement Category
Figure 25-3 Water Supply Coverage by Settlement Category Figure 25-4 Population and Population Served
Figure 25-5 Water Demand Growth by Water Use Category Figure 25-6 Water Demand Growth with Distribution of Water Use Category
Figure 25-7 Demand and Supply in Water Supply Development Plan for Facility Planning
217 245 277 312 348
994 1,117 1,254 1,400 1,553
886 999
1,125 1,259
1,401 2,096
2,362
2,657
2,970
3,302
0
500
1,000
1,500
2,000
2,500
3,000
3,500
2010 2015 2020 2025 2030
Rural
S.U./S.T.
Urban
Total
(x1,000)
2,096
2,362
2,657
2,970
3,302
0
500
1,000
1,500
2,000
2,500
3,000
3,500
2010 2015 2020 2025 2030
Total
Urban
S.U./S.T.
Rural
(x1,000)
2,096 2,362
2,657
2,970
3,302
1,065
1,588
2,222
2,970
3,302
0
500
1,000
1,500
2,000
2,500
3,000
3,500
2010 2015 2020 2025 2030
Total
PopulationServed
(x1,000)
86.6
127.7
177.8
237.5
266.8
0
50
100
150
200
250
300
2010 2015 2020 2025 2030
Total
Urban
S.U./S.T.
Rural
Commercial
Industry
MLD
25.0 32.9 42.3 53.4 59.6 41.8
63.3 89.3
120.0 133.1
10.3
17.7
26.8
37.8 42.0
86.6
127.7
177.8
237.5
266.8
0
50
100
150
200
250
300
2010 2015 2020 2025 2030
Industry
Commercial
Rural
S.U./S.T.
Urban
Total
MLD
-
50.0
100.0
150.0
200.0
250.0
300.0
350.0
2011 2012 2013 2014 2015 2016 2017 2018 2019 2020 2021 2022 2023 2024 2025 2026 2027 2028 2029
Newly Construction Scheme for Rural Water Supply(Installed Capacity, Groundwater)
Newly Construction Scheme for Urban/SU&ST WaterSupply (Installed Capacity, Groundwater)
Newly Construction Scheme for Urban/SU&ST WaterSupply (Installed Capacity, Surface Water)
Rehabilitation Scheme for Rural Water Supply(Operating Capacity, Groundwater)
Rehabilitation Scheme for Urban/SU&ST WaterSupply (Operating Capacity, Groundwater)
Rehabilitation Scheme for Urban/SU&ST WaterSupply (Operating Capacity, Surface Water)
Existing Rural Water Supply from 2010(Groundwater)
Existing Urban/SU&ST Water Supply from 2010(Groundwater)
Existing Urban/SU&ST Water Supply from 2010(Surface Water)
86.6
266.8
Water Demand
MP 1st Stage MP 2nd Stage MP 3rd StageMLD
50.8%
67.2%
83.6%
100.0% 100.0%
0%
20%
40%
60%
80%
100%
2010 2015 2020 2025 2030
Total
Urban
S.U./S.T.
Rural

The Project for Review and Update of Nigeria National Water Resources Master Plan
Volume-5, SR5 (SR5-45)
Source: JICA Project Team
Figure 5.1-1 Demand and Supply in Water Supply Development Plan for Facility Planning (27/38)
26. Niger
Figure 26-1 Population Growth by Settlement Category Figure 26-2 Population Growth with Distribution of Settlement Category
Figure 26-3 Water Supply Coverage by Settlement Category Figure 26-4 Population and Population Served
Figure 26-5 Water Demand Growth by Water Use Category Figure 26-6 Water Demand Growth with Distribution of Water Use Category
Figure 26-7 Demand and Supply in Water Supply Development Plan for Facility Planning
4,496
5,141
5,866
6,646
7,484
0
1,000
2,000
3,000
4,000
5,000
6,000
7,000
8,000
2010 2015 2020 2025 2030
Total
Urban
S.U./S.T.
Rural
(x1,000)
475 540 612 688 768
2,097 2,399 2,740 3,105
3,498
1,924 2,201
2,514
2,853
3,218
4,496
5,141
5,866
6,646
7,484
0
1,000
2,000
3,000
4,000
5,000
6,000
7,000
8,000
2010 2015 2020 2025 2030
Rural
S.U./S.T.
Urban
Total
(x1,000)
4,496
5,141
5,866
6,646
7,484
3,159
4,121
5,284
6,646
7,484
0
1,000
2,000
3,000
4,000
5,000
6,000
7,000
8,000
2010 2015 2020 2025 2030
Total
PopulationServed
(x1,000)
253.1
327.4
417.3
522.8
591.7
0
100
200
300
400
500
600
700
2010 2015 2020 2025 2030
Total
Urban
S.U./S.T.
Rural
Commercial
Industry
MLD
67.4 81.9 98.9 118.0 131.7
129.6 167.4
213.0 266.2
299.8
31.2
45.8
63.9
85.6 96.5
253.1
327.4
417.3
522.8
591.7
0
100
200
300
400
500
600
700
2010 2015 2020 2025 2030
Industry
Commercial
Rural
S.U./S.T.
Urban
Total
MLD
-
100.0
200.0
300.0
400.0
500.0
600.0
700.0
2011 2012 2013 2014 2015 2016 2017 2018 2019 2020 2021 2022 2023 2024 2025 2026 2027 2028 2029
Newly Construction Scheme for Rural Water Supply(Installed Capacity, Groundwater)
Newly Construction Scheme for Urban/SU&ST WaterSupply (Installed Capacity, Groundwater)
Newly Construction Scheme for Urban/SU&ST WaterSupply (Installed Capacity, Surface Water)
Rehabilitation Scheme for Rural Water Supply(Operating Capacity, Groundwater)
Rehabilitation Scheme for Urban/SU&ST WaterSupply (Operating Capacity, Groundwater)
Rehabilitation Scheme for Urban/SU&ST WaterSupply (Operating Capacity, Surface Water)
Existing Rural Water Supply from 2010(Groundwater)
Existing Urban/SU&ST Water Supply from 2010(Groundwater)
Existing Urban/SU&ST Water Supply from 2010(Surface Water)
253.1
591.7
Water Demand
MP 1st Stage MP 2nd Stage MP 3rd StageMLD
70.3%
80.2%
90.1%
100.0% 100.0%
0%
20%
40%
60%
80%
100%
2010 2015 2020 2025 2030
Total
Urban
S.U./S.T.
Rural
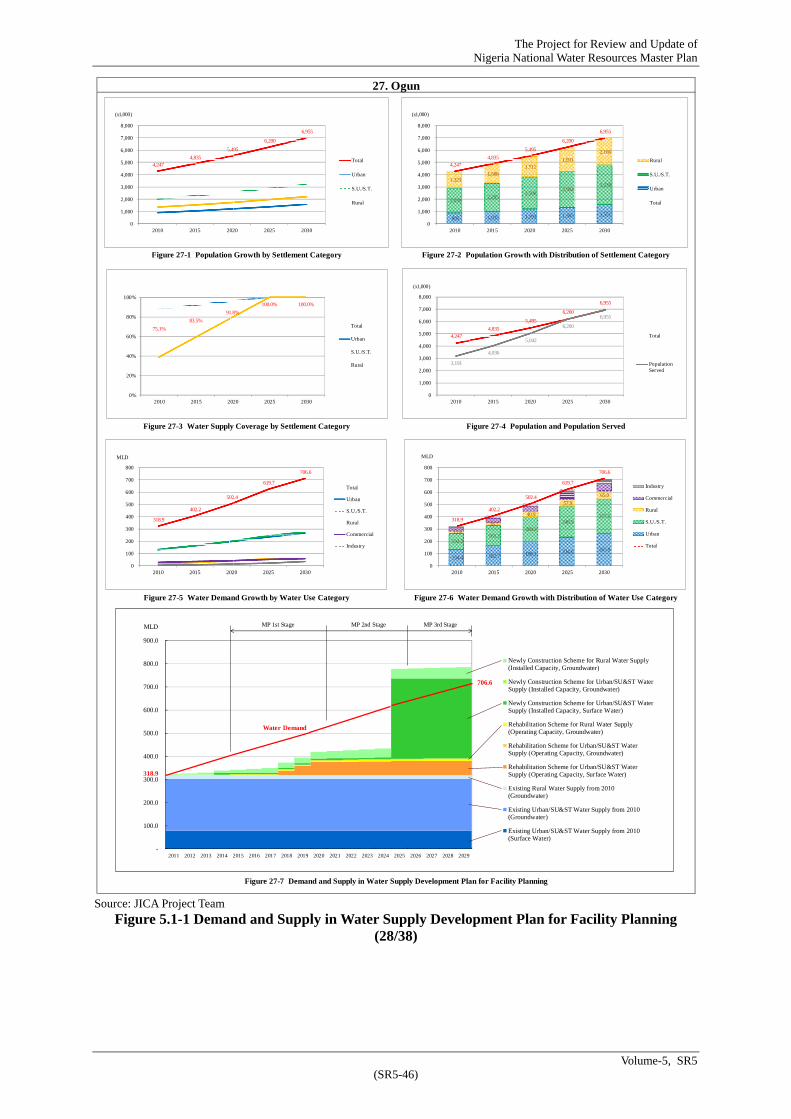
The Project for Review and Update of Nigeria National Water Resources Master Plan
Volume-5, SR5 (SR5-46)
Source: JICA Project Team
Figure 5.1-1 Demand and Supply in Water Supply Development Plan for Facility Planning (28/38)
27. Ogun
Figure 27-1 Population Growth by Settlement Category Figure 27-2 Population Growth with Distribution of Settlement Category
Figure 27-3 Water Supply Coverage by Settlement Category Figure 27-4 Population and Population Served
Figure 27-5 Water Demand Growth by Water Use Category Figure 27-6 Water Demand Growth with Distribution of Water Use Category
Figure 27-7 Demand and Supply in Water Supply Development Plan for Facility Planning
4,247 4,835
5,495
6,200
6,955
0
1,000
2,000
3,000
4,000
5,000
6,000
7,000
8,000
2010 2015 2020 2025 2030
Total
Urban
S.U./S.T.
Rural
(x1,000)
895 1,035 1,193 1,365 1,551
2,030 2,295
2,590 2,904
3,238 1,323
1,506 1,711
1,931
2,166
4,247 4,835
5,495
6,200
6,955
0
1,000
2,000
3,000
4,000
5,000
6,000
7,000
8,000
2010 2015 2020 2025 2030
Rural
S.U./S.T.
Urban
Total
(x1,000)
4,247 4,835
5,495
6,200
6,955
3,191
4,036
5,042
6,200
6,955
0
1,000
2,000
3,000
4,000
5,000
6,000
7,000
8,000
2010 2015 2020 2025 2030
Total
PopulationServed
(x1,000)
318.9
402.2
502.4
619.7
706.6
0
100
200
300
400
500
600
700
800
2010 2015 2020 2025 2030
Total
Urban
S.U./S.T.
Rural
Commercial
Industry
MLD
134.4 162.7 196.1 234.0 265.9
132.2 165.2
204.2 248.9
277.5
15.4
26.7
40.9
57.9
65.0
318.9
402.2
502.4
619.7
706.6
0
100
200
300
400
500
600
700
800
2010 2015 2020 2025 2030
Industry
Commercial
Rural
S.U./S.T.
Urban
Total
MLD
-
100.0
200.0
300.0
400.0
500.0
600.0
700.0
800.0
900.0
2011 2012 2013 2014 2015 2016 2017 2018 2019 2020 2021 2022 2023 2024 2025 2026 2027 2028 2029
Newly Construction Scheme for Rural Water Supply(Installed Capacity, Groundwater)
Newly Construction Scheme for Urban/SU&ST WaterSupply (Installed Capacity, Groundwater)
Newly Construction Scheme for Urban/SU&ST WaterSupply (Installed Capacity, Surface Water)
Rehabilitation Scheme for Rural Water Supply(Operating Capacity, Groundwater)
Rehabilitation Scheme for Urban/SU&ST WaterSupply (Operating Capacity, Groundwater)
Rehabilitation Scheme for Urban/SU&ST WaterSupply (Operating Capacity, Surface Water)
Existing Rural Water Supply from 2010(Groundwater)
Existing Urban/SU&ST Water Supply from 2010(Groundwater)
Existing Urban/SU&ST Water Supply from 2010(Surface Water)
318.9
706.6
Water Demand
MP 1st Stage MP 2nd Stage MP 3rd StageMLD
75.1%
83.5%
91.8%
100.0% 100.0%
0%
20%
40%
60%
80%
100%
2010 2015 2020 2025 2030
Total
Urban
S.U./S.T.
Rural
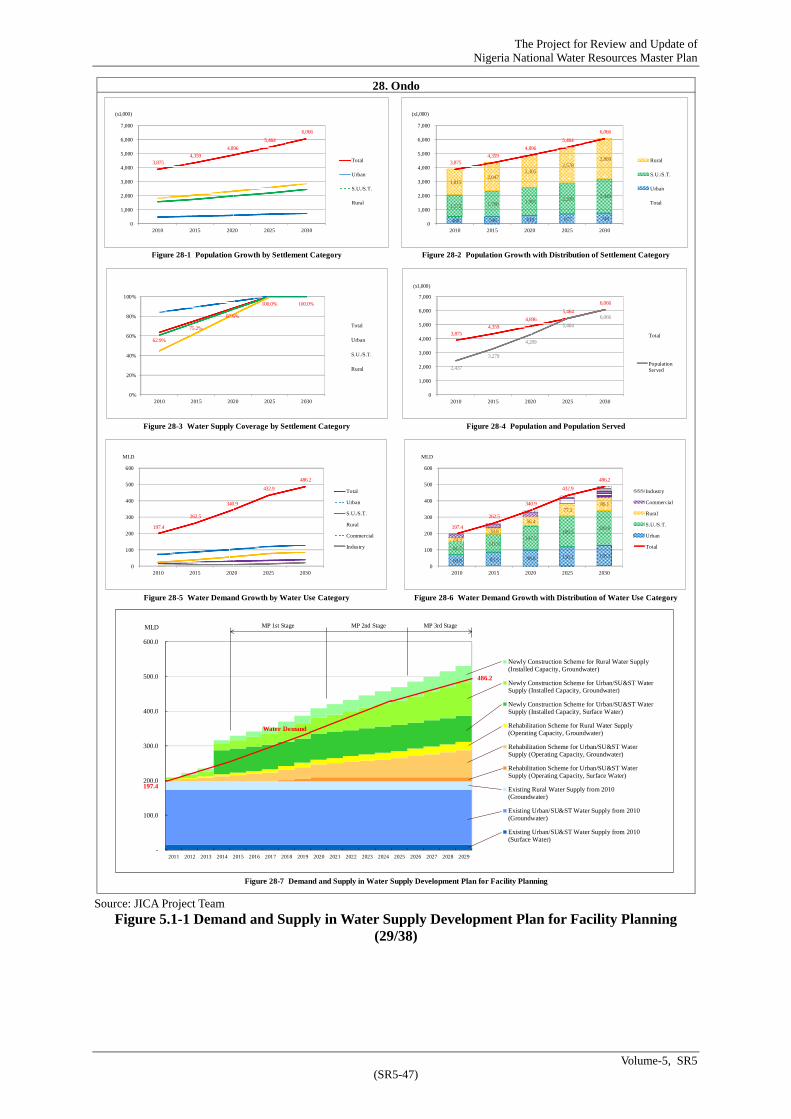
The Project for Review and Update of Nigeria National Water Resources Master Plan
Volume-5, SR5 (SR5-47)
Source: JICA Project Team
Figure 5.1-1 Demand and Supply in Water Supply Development Plan for Facility Planning (29/38)
28. Ondo
Figure 28-1 Population Growth by Settlement Category Figure 28-2 Population Growth with Distribution of Settlement Category
Figure 28-3 Water Supply Coverage by Settlement Category Figure 28-4 Population and Population Served
Figure 28-5 Water Demand Growth by Water Use Category Figure 28-6 Water Demand Growth with Distribution of Water Use Category
Figure 28-7 Demand and Supply in Water Supply Development Plan for Facility Planning
3,875 4,359
4,896
5,464
6,066
0
1,000
2,000
3,000
4,000
5,000
6,000
7,000
2010 2015 2020 2025 2030
Total
Urban
S.U./S.T.
Rural
(x1,000)
488 546 610 677 748
1,572 1,766 1,981 2,209 2,449
1,815 2,047
2,305 2,578
2,869 3,875
4,359
4,896
5,464
6,066
0
1,000
2,000
3,000
4,000
5,000
6,000
7,000
2010 2015 2020 2025 2030
Rural
S.U./S.T.
Urban
Total
(x1,000)
3,875 4,359
4,896
5,464
6,066
2,437
3,279
4,289
5,464
6,066
0
1,000
2,000
3,000
4,000
5,000
6,000
7,000
2010 2015 2020 2025 2030
Total
PopulationServed
(x1,000)
197.4
262.5
340.9
432.9
486.2
0
100
200
300
400
500
600
2010 2015 2020 2025 2030
Total
Urban
S.U./S.T.
Rural
Commercial
Industry
MLD
69.8 83.3 98.8 116.1 128.3
81.7 111.6
147.5 189.3
209.9
24.3
38.8
56.4
77.3 86.1
197.4
262.5
340.9
432.9
486.2
0
100
200
300
400
500
600
2010 2015 2020 2025 2030
Industry
Commercial
Rural
S.U./S.T.
Urban
Total
MLD
-
100.0
200.0
300.0
400.0
500.0
600.0
2011 2012 2013 2014 2015 2016 2017 2018 2019 2020 2021 2022 2023 2024 2025 2026 2027 2028 2029
Newly Construction Scheme for Rural Water Supply(Installed Capacity, Groundwater)
Newly Construction Scheme for Urban/SU&ST WaterSupply (Installed Capacity, Groundwater)
Newly Construction Scheme for Urban/SU&ST WaterSupply (Installed Capacity, Surface Water)
Rehabilitation Scheme for Rural Water Supply(Operating Capacity, Groundwater)
Rehabilitation Scheme for Urban/SU&ST WaterSupply (Operating Capacity, Groundwater)
Rehabilitation Scheme for Urban/SU&ST WaterSupply (Operating Capacity, Surface Water)
Existing Rural Water Supply from 2010(Groundwater)
Existing Urban/SU&ST Water Supply from 2010(Groundwater)
Existing Urban/SU&ST Water Supply from 2010(Surface Water)
197.4
486.2
Water Demand
MP 1st Stage MP 2nd Stage MP 3rd StageMLD
62.9%
75.2%
87.6%
100.0% 100.0%
0%
20%
40%
60%
80%
100%
2010 2015 2020 2025 2030
Total
Urban
S.U./S.T.
Rural

The Project for Review and Update of Nigeria National Water Resources Master Plan
Volume-5, SR5 (SR5-48)
Source: JICA Project Team
Figure 5.1-1 Demand and Supply in Water Supply Development Plan for Facility Planning (30/38)
29. Osun
Figure 29-1 Population Growth by Settlement Category Figure 29-2 Population Growth with Distribution of Settlement Category
Figure 29-3 Water Supply Coverage by Settlement Category Figure 29-4 Population and Population Served
Figure 29-5 Water Demand Growth by Water Use Category Figure 29-6 Water Demand Growth with Distribution of Water Use Category
Figure 29-7 Demand and Supply in Water Supply Development Plan for Facility Planning
3,854 4,369
4,946
5,559
6,214
0
1,000
2,000
3,000
4,000
5,000
6,000
7,000
2010 2015 2020 2025 2030
Total
Urban
S.U./S.T.
Rural
(x1,000)
621 700 789 883 983
1,585 1,791 2,021 2,266
2,528
1,649 1,878
2,136 2,410
2,703 3,854
4,369
4,946
5,559
6,214
0
1,000
2,000
3,000
4,000
5,000
6,000
7,000
2010 2015 2020 2025 2030
Rural
S.U./S.T.
Urban
Total
(x1,000)
3,854 4,369
4,946
5,559
6,214
3,003
3,725
4,581
5,559
6,214
0
1,000
2,000
3,000
4,000
5,000
6,000
7,000
2010 2015 2020 2025 2030
Total
PopulationServed
(x1,000)
257.7
319.0
392.4
477.5
541.0
0
100
200
300
400
500
600
2010 2015 2020 2025 2030
Total
Urban
S.U./S.T.
Rural
Commercial
Industry
MLD
86.4 105.0 126.8 151.3 168.4
110.1 134.1
162.4 194.3
216.7
33.1
43.9
57.0
72.3 81.1
257.7
319.0
392.4
477.5
541.0
0
100
200
300
400
500
600
2010 2015 2020 2025 2030
Industry
Commercial
Rural
S.U./S.T.
Urban
Total
MLD
-
100.0
200.0
300.0
400.0
500.0
600.0
2011 2012 2013 2014 2015 2016 2017 2018 2019 2020 2021 2022 2023 2024 2025 2026 2027 2028 2029
Newly Construction Scheme for Rural Water Supply(Installed Capacity, Groundwater)
Newly Construction Scheme for Urban/SU&ST WaterSupply (Installed Capacity, Groundwater)
Newly Construction Scheme for Urban/SU&ST WaterSupply (Installed Capacity, Surface Water)
Rehabilitation Scheme for Rural Water Supply(Operating Capacity, Groundwater)
Rehabilitation Scheme for Urban/SU&ST WaterSupply (Operating Capacity, Groundwater)
Rehabilitation Scheme for Urban/SU&ST WaterSupply (Operating Capacity, Surface Water)
Existing Rural Water Supply from 2010(Groundwater)
Existing Urban/SU&ST Water Supply from 2010(Groundwater)
Existing Urban/SU&ST Water Supply from 2010(Surface Water)
257.7
541.0
Water Demand
MP 1st Stage MP 2nd Stage MP 3rd StageMLD
77.9%85.3%
92.6%100.0% 100.0%
0%
20%
40%
60%
80%
100%
2010 2015 2020 2025 2030
Total
Urban
S.U./S.T.
Rural

The Project for Review and Update of Nigeria National Water Resources Master Plan
Volume-5, SR5 (SR5-49)
Source: JICA Project Team
Figure 5.1-1 Demand and Supply in Water Supply Development Plan for Facility Planning (31/38)
30. Oyo
Figure 30-1 Population Growth by Settlement Category Figure 30-2 Population Growth with Distribution of Settlement Category
Figure 30-3 Water Supply Coverage by Settlement Category Figure 30-4 Population and Population Served
Figure 30-5 Water Demand Growth by Water Use Category Figure 30-6 Water Demand Growth with Distribution of Water Use Category
Figure 30-7 Demand and Supply in Water Supply Development Plan for Facility Planning
6,328 7,215
8,211
9,278
10,423
0
2,000
4,000
6,000
8,000
10,000
12,000
2010 2015 2020 2025 2030
Total
Urban
S.U./S.T.
Rural
(x1,000)
1,226 1,365 1,521 1,689 1,867
2,834 3,187 3,581 4,002
4,451
2,268 2,663
3,109 3,588
4,105
6,328 7,215
8,211
9,278
10,423
0
2,000
4,000
6,000
8,000
10,000
12,000
2010 2015 2020 2025 2030
Rural
S.U./S.T.
Urban
Total
(x1,000)
6,328 7,215
8,211
9,278
10,423
4,900
6,124
7,587
9,278
10,423
0
2,000
4,000
6,000
8,000
10,000
12,000
2010 2015 2020 2025 2030
Total
PopulationServed
(x1,000)
457.7
565.9
695.7
847.5
958.6
0
200
400
600
800
1,000
1,200
2010 2015 2020 2025 2030
Total
Urban
S.U./S.T.
Rural
Commercial
Industry
MLD
179.4 211.3 248.1 289.5 320.1
182.0 227.5
281.3 343.0
381.5
45.2 62.0
82.8
107.6 123.1
457.7
565.9
695.7
847.5
958.6
0
200
400
600
800
1,000
1,200
2010 2015 2020 2025 2030
Industry
Commercial
Rural
S.U./S.T.
Urban
Total
MLD
-
200.0
400.0
600.0
800.0
1,000.0
1,200.0
2011 2012 2013 2014 2015 2016 2017 2018 2019 2020 2021 2022 2023 2024 2025 2026 2027 2028 2029
Newly Construction Scheme for Rural Water Supply(Installed Capacity, Groundwater)
Newly Construction Scheme for Urban/SU&ST WaterSupply (Installed Capacity, Groundwater)
Newly Construction Scheme for Urban/SU&ST WaterSupply (Installed Capacity, Surface Water)
Rehabilitation Scheme for Rural Water Supply(Operating Capacity, Groundwater)
Rehabilitation Scheme for Urban/SU&ST WaterSupply (Operating Capacity, Groundwater)
Rehabilitation Scheme for Urban/SU&ST WaterSupply (Operating Capacity, Surface Water)
Existing Rural Water Supply from 2010(Groundwater)
Existing Urban/SU&ST Water Supply from 2010(Groundwater)
Existing Urban/SU&ST Water Supply from 2010(Surface Water)
457.7
958.6
Water Demand
MP 1st Stage MP 2nd Stage MP 3rd StageMLD
77.4%84.9%
92.4%100.0% 100.0%
0%
20%
40%
60%
80%
100%
2010 2015 2020 2025 2030
Total
Urban
S.U./S.T.
Rural

The Project for Review and Update of Nigeria National Water Resources Master Plan
Volume-5, SR5 (SR5-50)
Source: JICA Project Team
Figure 5.1-1 Demand and Supply in Water Supply Development Plan for Facility Planning (32/38)
31. Plateau
Figure 31-1 Population Growth by Settlement Category Figure 31-2 Population Growth with Distribution of Settlement Category
Figure 31-3 Water Supply Coverage by Settlement Category Figure 31-4 Population and Population Served
Figure 31-5 Water Demand Growth by Water Use Category Figure 31-6 Water Demand Growth with Distribution of Water Use Category
Figure 31-7 Demand and Supply in Water Supply Development Plan for Facility Planning
3,581 4,018
4,501
5,011
5,550
0
1,000
2,000
3,000
4,000
5,000
6,000
2010 2015 2020 2025 2030
Total
Urban
S.U./S.T.
Rural
(x1,000)
388 424 463 504 546
1,626 1,811 2,015 2,229 2,455
1,567 1,783
2,023 2,278
2,549 3,581
4,018
4,501
5,011
5,550
0
1,000
2,000
3,000
4,000
5,000
6,000
2010 2015 2020 2025 2030
Rural
S.U./S.T.
Urban
Total
(x1,000)
3,581 4,018
4,501
5,011
5,550
1,501
2,454
3,620
5,011
5,550
0
1,000
2,000
3,000
4,000
5,000
6,000
2010 2015 2020 2025 2030
Total
PopulationServed
(x1,000)
123.3
194.2
280.0
381.5
421.7
0
50
100
150
200
250
300
350
400
450
2010 2015 2020 2025 2030
Total
Urban
S.U./S.T.
Rural
Commercial
Industry
MLD
54.5 64.0 74.6 86.3 93.5 47.1
86.7
134.6
191.1 210.5
9.0
24.6
44.3
68.4 76.5
123.3
194.2
280.0
381.5
421.7
0
50
100
150
200
250
300
350
400
450
2010 2015 2020 2025 2030
Industry
Commercial
Rural
S.U./S.T.
Urban
Total
MLD
-
100.0
200.0
300.0
400.0
500.0
600.0
2011 2012 2013 2014 2015 2016 2017 2018 2019 2020 2021 2022 2023 2024 2025 2026 2027 2028 2029
Newly Construction Scheme for Rural Water Supply(Installed Capacity, Groundwater)
Newly Construction Scheme for Urban/SU&ST WaterSupply (Installed Capacity, Groundwater)
Newly Construction Scheme for Urban/SU&ST WaterSupply (Installed Capacity, Surface Water)
Rehabilitation Scheme for Rural Water Supply(Operating Capacity, Groundwater)
Rehabilitation Scheme for Urban/SU&ST WaterSupply (Operating Capacity, Groundwater)
Rehabilitation Scheme for Urban/SU&ST WaterSupply (Operating Capacity, Surface Water)
Existing Rural Water Supply from 2010(Groundwater)
Existing Urban/SU&ST Water Supply from 2010(Groundwater)
Existing Urban/SU&ST Water Supply from 2010(Surface Water)
123.4
421.7
Water Demand
MP 1st Stage MP 2nd Stage MP 3rd StageMLD
41.9%
61.1%
80.4%
100.0% 100.0%
0%
20%
40%
60%
80%
100%
2010 2015 2020 2025 2030
Total
Urban
S.U./S.T.
Rural

The Project for Review and Update of Nigeria National Water Resources Master Plan
Volume-5, SR5 (SR5-51)
Source: JICA Project Team
Figure 5.1-1 Demand and Supply in Water Supply Development Plan for Facility Planning (33/38)
32. Rivers
Figure 32-1 Population Growth by Settlement Category Figure 32-2 Population Growth with Distribution of Settlement Category
Figure 32-3 Water Supply Coverage by Settlement Category Figure 32-4 Population and Population Served
Figure 32-5 Water Demand Growth by Water Use Category Figure 32-6 Water Demand Growth with Distribution of Water Use Category
Figure 32-7 Demand and Supply in Water Supply Development Plan for Facility Planning
-
200.0
400.0
600.0
800.0
1,000.0
1,200.0
2011 2012 2013 2014 2015 2016 2017 2018 2019 2020 2021 2022 2023 2024 2025 2026 2027 2028 2029
Newly Construction Scheme for Rural Water Supply(Installed Capacity, Groundwater)
Newly Construction Scheme for Urban/SU&ST WaterSupply (Installed Capacity, Groundwater)
Newly Construction Scheme for Urban/SU&ST WaterSupply (Installed Capacity, Surface Water)
Rehabilitation Scheme for Rural Water Supply(Operating Capacity, Groundwater)
Rehabilitation Scheme for Urban/SU&ST WaterSupply (Operating Capacity, Groundwater)
Rehabilitation Scheme for Urban/SU&ST WaterSupply (Operating Capacity, Surface Water)
Existing Rural Water Supply from 2010(Groundwater)
Existing Urban/SU&ST Water Supply from 2010(Groundwater)
Existing Urban/SU&ST Water Supply from 2010(Surface Water)
354.7
1,014.3
Water Demand
MP 1st Stage MP 2nd Stage MP 3rd StageMLD
5,908 6,752
7,703
8,723
9,821
0
2,000
4,000
6,000
8,000
10,000
12,000
2010 2015 2020 2025 2030
Total
Urban
S.U./S.T.
Rural
(x1,000)
1,642 1,874 2,136 2,418 2,724
2,298 2,601
2,938 3,296
3,677 1,968 2,277
2,629 3,009
3,420
5,908 6,752
7,703
8,723
9,821
0
2,000
4,000
6,000
8,000
10,000
12,000
2010 2015 2020 2025 2030
Rural
S.U./S.T.
Urban
Total
(x1,000)
5,908 6,752
7,703
8,723
9,821
3,417
4,854
6,621
8,723
9,821
0
2,000
4,000
6,000
8,000
10,000
12,000
2010 2015 2020 2025 2030
Total
PopulationServed
(x1,000)
354.7
500.0
679.0
893.2
1,014.3
0
200
400
600
800
1,000
1,200
2010 2015 2020 2025 2030
Total
Urban
S.U./S.T.
Rural
Commercial
Industry
MLD
192.5 253.5 327.6
414.6 466.9 95.7 146.5
208.7
282.5 315.2
26.1
42.9
64.2
90.3 102.6
354.7
500.0
679.0
893.2
1,014.3
0
200
400
600
800
1,000
1,200
2010 2015 2020 2025 2030
Industry
Commercial
Rural
S.U./S.T.
Urban
Total
MLD
57.8%
71.9%
85.9%
100.0% 100.0%
0%
20%
40%
60%
80%
100%
2010 2015 2020 2025 2030
Total
Urban
S.U./S.T.
Rural

The Project for Review and Update of Nigeria National Water Resources Master Plan
Volume-5, SR5 (SR5-52)
Source: JICA Project Team
Figure 5.1-1 Demand and Supply in Water Supply Development Plan for Facility Planning (34/38)
33. Sokoto
Figure 33-1 Population Growth by Settlement Category Figure 33-2 Population Growth with Distribution of Settlement Category
Figure 33-3 Water Supply Coverage by Settlement Category Figure 33-4 Population and Population Served
Figure 33-5 Water Demand Growth by Water Use Category Figure 33-6 Water Demand Growth with Distribution of Water Use Category
Figure 33-7 Demand and Supply in Water Supply Development Plan for Facility Planning
4,150 4,674
5,255
5,871
6,524
0
1,000
2,000
3,000
4,000
5,000
6,000
7,000
2010 2015 2020 2025 2030
Total
Urban
S.U./S.T.
Rural
(x1,000)
444 497 555 616 679
1,843 2,076 2,334 2,607 2,897
1,863 2,101
2,366 2,648
2,947 4,150
4,674
5,255
5,871
6,524
0
1,000
2,000
3,000
4,000
5,000
6,000
7,000
2010 2015 2020 2025 2030
Rural
S.U./S.T.
Urban
Total
(x1,000)
4,150 4,674
5,255
5,871
6,524
2,496
3,431
4,556
5,871
6,524
0
1,000
2,000
3,000
4,000
5,000
6,000
7,000
2010 2015 2020 2025 2030
Total
PopulationServed
(x1,000)
197.3
268.1
353.3
453.2
506.0
0
100
200
300
400
500
600
2010 2015 2020 2025 2030
Total
Urban
S.U./S.T.
Rural
Commercial
Industry
MLD
62.0 74.6 89.2 105.5 116.5
90.5 127.3
171.6 223.5
248.3
25.4
40.1
58.1
79.4 88.4
197.3
268.1
353.3
453.2
506.0
0
100
200
300
400
500
600
2010 2015 2020 2025 2030
Industry
Commercial
Rural
S.U./S.T.
Urban
Total
MLD
-
100.0
200.0
300.0
400.0
500.0
600.0
2011 2012 2013 2014 2015 2016 2017 2018 2019 2020 2021 2022 2023 2024 2025 2026 2027 2028 2029
Newly Construction Scheme for Rural Water Supply(Installed Capacity, Groundwater)
Newly Construction Scheme for Urban/SU&ST WaterSupply (Installed Capacity, Groundwater)
Newly Construction Scheme for Urban/SU&ST WaterSupply (Installed Capacity, Surface Water)
Rehabilitation Scheme for Rural Water Supply(Operating Capacity, Groundwater)
Rehabilitation Scheme for Urban/SU&ST WaterSupply (Operating Capacity, Groundwater)
Rehabilitation Scheme for Urban/SU&ST WaterSupply (Operating Capacity, Surface Water)
Existing Rural Water Supply from 2010(Groundwater)
Existing Urban/SU&ST Water Supply from 2010(Groundwater)
Existing Urban/SU&ST Water Supply from 2010(Surface Water)
197.3
506.0
Water Demand
MP 1st Stage MP 2nd Stage MP 3rd StageMLD
60.1%
73.4%
86.7%
100.0% 100.0%
0%
20%
40%
60%
80%
100%
2010 2015 2020 2025 2030
Total
Urban
S.U./S.T.
Rural

The Project for Review and Update of Nigeria National Water Resources Master Plan
Volume-5, SR5 (SR5-53)
Source: JICA Project Team
Figure 5.1-1 Demand and Supply in Water Supply Development Plan for Facility Planning (35/38)
34. Taraba
Figure 34-1 Population Growth by Settlement Category Figure 34-2 Population Growth with Distribution of Settlement Category
Figure 34-3 Water Supply Coverage by Settlement Category Figure 34-4 Population and Population Served
Figure 34-5 Water Demand Growth by Water Use Category Figure 34-6 Water Demand Growth with Distribution of Water Use Category
Figure 34-7 Demand and Supply in Water Supply Development Plan for Facility Planning
2,560 2,869
3,211
3,572
3,952
0
500
1,000
1,500
2,000
2,500
3,000
3,500
4,000
4,500
2010 2015 2020 2025 2030
Total
Urban
S.U./S.T.
Rural
(x1,000)
219 249 283 320 359
1,080 1,212 1,359 1,515 1,679
1,262 1,408
1,568 1,737
1,913 2,560 2,869
3,211
3,572
3,952
0
500
1,000
1,500
2,000
2,500
3,000
3,500
4,000
4,500
2010 2015 2020 2025 2030
Rural
S.U./S.T.
Urban
Total
(x1,000)
2,560 2,869
3,211
3,572
3,952
527
1,351
2,362
3,572
3,952
0
500
1,000
1,500
2,000
2,500
3,000
3,500
4,000
4,500
2010 2015 2020 2025 2030
Total
PopulationServed
(x1,000)
39.3
98.7
172.1
260.6
290.8
0
50
100
150
200
250
300
350
2010 2015 2020 2025 2030
Total
Urban
S.U./S.T.
Rural
Commercial
Industry
MLD
11.9 23.3 37.5 54.8 61.6 16.8 47.2
84.8
129.9 143.9
6.4
18.8
34.0
52.1 57.4
39.3
98.7
172.1
260.6
290.8
0
50
100
150
200
250
300
350
2010 2015 2020 2025 2030
Industry
Commercial
Rural
S.U./S.T.
Urban
Total
MLD
-
50.0
100.0
150.0
200.0
250.0
300.0
350.0
400.0
2011 2012 2013 2014 2015 2016 2017 2018 2019 2020 2021 2022 2023 2024 2025 2026 2027 2028 2029
Newly Construction Scheme for Rural Water Supply(Installed Capacity, Groundwater)
Newly Construction Scheme for Urban/SU&ST WaterSupply (Installed Capacity, Groundwater)
Newly Construction Scheme for Urban/SU&ST WaterSupply (Installed Capacity, Surface Water)
Rehabilitation Scheme for Rural Water Supply(Operating Capacity, Groundwater)
Rehabilitation Scheme for Urban/SU&ST WaterSupply (Operating Capacity, Groundwater)
Rehabilitation Scheme for Urban/SU&ST WaterSupply (Operating Capacity, Surface Water)
Existing Rural Water Supply from 2010(Groundwater)
Existing Urban/SU&ST Water Supply from 2010(Groundwater)
Existing Urban/SU&ST Water Supply from 2010(Surface Water)
39.3
290.8
Water Demand
MP 1st Stage MP 2nd Stage MP 3rd StageMLD
20.6%
47.1%
73.6%
100.0% 100.0%
0%
20%
40%
60%
80%
100%
2010 2015 2020 2025 2030
Total
Urban
S.U./S.T.
Rural

The Project for Review and Update of Nigeria National Water Resources Master Plan
Volume-5, SR5 (SR5-54)
Source: JICA Project Team
Figure 5.1-1 Demand and Supply in Water Supply Development Plan for Facility Planning (36/38)
35. Yobe
Figure 35-1 Population Growth by Settlement Category Figure 35-2 Population Growth with Distribution of Settlement Category
Figure 35-3 Water Supply Coverage by Settlement Category Figure 35-4 Population and Population Served
Figure 35-5 Water Demand Growth by Water Use Category Figure 35-6 Water Demand Growth with Distribution of Water Use Category
Figure 35-7 Demand and Supply in Water Supply Development Plan for Facility Planning
2,650
3,042
3,486
3,964
4,481
0
500
1,000
1,500
2,000
2,500
3,000
3,500
4,000
4,500
5,000
2010 2015 2020 2025 2030
Total
Urban
S.U./S.T.
Rural
(x1,000)
181 205 231 259 289
1,291 1,477 1,688 1,915 2,160
1,179 1,360
1,567 1,790
2,032
2,650
3,042
3,486
3,964
4,481
0
500
1,000
1,500
2,000
2,500
3,000
3,500
4,000
4,500
5,000
2010 2015 2020 2025 2030
Rural
S.U./S.T.
Urban
Total
(x1,000)
2,650
3,042
3,486
3,964
4,481
1,118
1,869
2,814
3,964
4,481
0
500
1,000
1,500
2,000
2,500
3,000
3,500
4,000
4,500
5,000
2010 2015 2020 2025 2030
Total
PopulationServed
(x1,000)
83.5
137.9
206.1
288.9
326.9
0
50
100
150
200
250
300
350
2010 2015 2020 2025 2030
Total
Urban
S.U./S.T.
Rural
Commercial
Industry
MLD
15.6 23.5 33.0 44.4 49.6 47.0
78.1
117.0
164.1 185.1
12.9
23.5
37.1
53.7
61.0
83.5
137.9
206.1
288.9
326.9
0
50
100
150
200
250
300
350
2010 2015 2020 2025 2030
Industry
Commercial
Rural
S.U./S.T.
Urban
Total
MLD
-
50.0
100.0
150.0
200.0
250.0
300.0
350.0
400.0
2011 2012 2013 2014 2015 2016 2017 2018 2019 2020 2021 2022 2023 2024 2025 2026 2027 2028 2029
Newly Construction Scheme for Rural Water Supply(Installed Capacity, Groundwater)
Newly Construction Scheme for Urban/SU&ST WaterSupply (Installed Capacity, Groundwater)
Newly Construction Scheme for Urban/SU&ST WaterSupply (Installed Capacity, Surface Water)
Rehabilitation Scheme for Rural Water Supply(Operating Capacity, Groundwater)
Rehabilitation Scheme for Urban/SU&ST WaterSupply (Operating Capacity, Groundwater)
Rehabilitation Scheme for Urban/SU&ST WaterSupply (Operating Capacity, Surface Water)
Existing Rural Water Supply from 2010(Groundwater)
Existing Urban/SU&ST Water Supply from 2010(Groundwater)
Existing Urban/SU&ST Water Supply from 2010(Surface Water)
83.5
326.9
Water Demand
MP 1st Stage MP 2nd Stage MP 3rd StageMLD
42.2%
61.4%
80.7%
100.0% 100.0%
0%
20%
40%
60%
80%
100%
2010 2015 2020 2025 2030
Total
Urban
S.U./S.T.
Rural

The Project for Review and Update of Nigeria National Water Resources Master Plan
Volume-5, SR5 (SR5-55)
Source: JICA Project Team
Figure 5.1-1 Demand and Supply in Water Supply Development Plan for Facility Planning (37/38)
36. Zamfara
Figure 36-1 Population Growth by Settlement Category Figure 36-2 Population Growth with Distribution of Settlement Category
Figure 36-3 Water Supply Coverage by Settlement Category Figure 36-4 Population and Population Served
Figure 36-5 Water Demand Growth by Water Use Category Figure 36-6 Water Demand Growth with Distribution of Water Use Category
Figure 36-7 Demand and Supply in Water Supply Development Plan for Facility Planning
3,697 4,190
4,742
5,329
5,955
0
1,000
2,000
3,000
4,000
5,000
6,000
7,000
2010 2015 2020 2025 2030
Total
Urban
S.U./S.T.
Rural
(x1,000)
223 252 285 320 357
1,660 1,879 2,124 2,384 2,661
1,814 2,059
2,333 2,625
2,936 3,697
4,190
4,742
5,329
5,955
0
1,000
2,000
3,000
4,000
5,000
6,000
7,000
2010 2015 2020 2025 2030
Rural
S.U./S.T.
Urban
Total
(x1,000)
3,697 4,190
4,742
5,329
5,955
2,355
3,176
4,168
5,329
5,955
0
1,000
2,000
3,000
4,000
5,000
6,000
7,000
2010 2015 2020 2025 2030
Total
PopulationServed
(x1,000)
170.6
226.6
294.4
373.9
420.3
0
50
100
150
200
250
300
350
400
450
2010 2015 2020 2025 2030
Total
Urban
S.U./S.T.
Rural
Commercial
Industry
MLD
27.5 35.1 44.3 54.9 61.2
102.3 130.9
165.0 204.4
228.1 24.3
39.0
57.1
78.7
88.1
170.6
226.6
294.4
373.9
420.3
0
50
100
150
200
250
300
350
400
450
2010 2015 2020 2025 2030
Industry
Commercial
Rural
S.U./S.T.
Urban
Total
MLD
-
50.0
100.0
150.0
200.0
250.0
300.0
350.0
400.0
450.0
500.0
2011 2012 2013 2014 2015 2016 2017 2018 2019 2020 2021 2022 2023 2024 2025 2026 2027 2028 2029
Newly Construction Scheme for Rural Water Supply(Installed Capacity, Groundwater)
Newly Construction Scheme for Urban/SU&ST WaterSupply (Installed Capacity, Groundwater)
Newly Construction Scheme for Urban/SU&ST WaterSupply (Installed Capacity, Surface Water)
Rehabilitation Scheme for Rural Water Supply(Operating Capacity, Groundwater)
Rehabilitation Scheme for Urban/SU&ST WaterSupply (Operating Capacity, Groundwater)
Rehabilitation Scheme for Urban/SU&ST WaterSupply (Operating Capacity, Surface Water)
Existing Rural Water Supply from 2010(Groundwater)
Existing Urban/SU&ST Water Supply from 2010(Groundwater)
Existing Urban/SU&ST Water Supply from 2010(Surface Water)
170.6
420.3
Water Demand
MP 1st Stage MP 2nd Stage MP 3rd StageMLD
63.7%
75.8%
87.9%
100.0% 100.0%
0%
20%
40%
60%
80%
100%
2010 2015 2020 2025 2030
Total
Urban
S.U./S.T.
Rural

The Project for Review and Update of Nigeria National Water Resources Master Plan
Volume-5, SR5 (SR5-56)
Source: JICA Project Team
Figure 5.1-1 Demand and Supply in Water Supply Development Plan for Facility Planning (38/38)
37. FCT Abuja
Figure 37-1 Population Growth by Settlement Category Figure 37-2 Population Growth with Distribution of Settlement Category
Figure 37-3 Water Supply Coverage by Settlement Category Figure 37-4 Population and Population Served
Figure 37-5 Water Demand Growth by Water Use Category Figure 37-6 Water Demand Growth with Distribution of Water Use Category
Figure 37-7 Demand and Supply in Water Supply Development Plan for Facility Planning
1,974
2,816
3,998
5,569
7,639
0
1,000
2,000
3,000
4,000
5,000
6,000
7,000
8,000
9,000
2010 2015 2020 2025 2030
Total
Urban
S.U./S.T.
Rural
(x1,000)
919 1,334 1,926
2,720 3,777
831 1,180
1,666
2,308
3,147
225
302
406
541
715
1,974
2,816
3,998
5,569
7,639
0
1,000
2,000
3,000
4,000
5,000
6,000
7,000
8,000
9,000
2010 2015 2020 2025 2030
Rural
S.U./S.T.
Urban
Total
(x1,000)
1,974
2,816
3,998
5,569
7,639
859
1,757
3,248
5,569
7,639
0
1,000
2,000
3,000
4,000
5,000
6,000
7,000
8,000
9,000
2010 2015 2020 2025 2030
Total
PopulationServed
(x1,000)
130.4
267.3
496.4
855.5
1,181.6
0
200
400
600
800
1,000
1,200
1,400
2010 2015 2020 2025 2030
Total
Urban
S.U./S.T.
Rural
Commercial
Industry
MLD
77.8 151.6 274.4
466.4 647.6
22.4 54.9
110.2
197.8
269.7
2.4
5.2
9.6
16.2
21.4
130.4
267.3
496.4
855.5
1,181.6
0
200
400
600
800
1,000
1,200
1,400
2010 2015 2020 2025 2030
Industry
Commercial
Rural
S.U./S.T.
Urban
Total
MLD
-
200.0
400.0
600.0
800.0
1,000.0
1,200.0
1,400.0
1,600.0
2011 2012 2013 2014 2015 2016 2017 2018 2019 2020 2021 2022 2023 2024 2025 2026 2027 2028 2029
Newly Construction Scheme for Rural Water Supply(Installed Capacity, Groundwater)
Newly Construction Scheme for Urban/SU&ST WaterSupply (Installed Capacity, Groundwater)
Newly Construction Scheme for Urban/SU&ST WaterSupply (Installed Capacity, Surface Water)
Rehabilitation Scheme for Rural Water Supply(Operating Capacity, Groundwater)
Rehabilitation Scheme for Urban/SU&ST WaterSupply (Operating Capacity, Groundwater)
Rehabilitation Scheme for Urban/SU&ST WaterSupply (Operating Capacity, Surface Water)
Existing Rural Water Supply from 2010(Groundwater)
Existing Urban/SU&ST Water Supply from 2010(Groundwater)
Existing Urban/SU&ST Water Supply from 2010(Surface Water)
130.4
1,181.6
Water Demand
MP 1st Stage MP 2nd Stage MP 3rd StageMLD
43.5%
62.4%
81.2%
100.0% 100.0%
0%
20%
40%
60%
80%
100%
2010 2015 2020 2025 2030
Total
Urban
S.U./S.T.
Rural
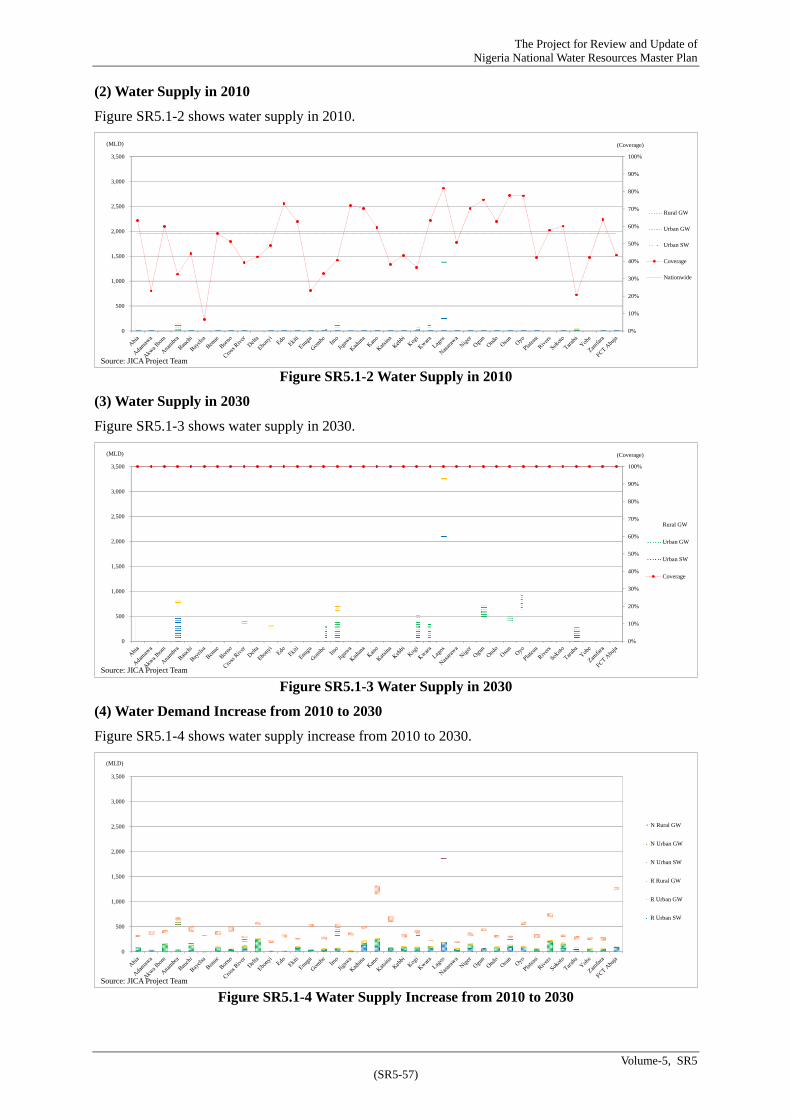
The Project for Review and Update of Nigeria National Water Resources Master Plan
Volume-5, SR5 (SR5-57)
(2) Water Supply in 2010
Figure SR5.1-2 shows water supply in 2010.
Figure SR5.1-2 Water Supply in 2010
(3) Water Supply in 2030
Figure SR5.1-3 shows water supply in 2030.
Figure SR5.1-3 Water Supply in 2030
(4) Water Demand Increase from 2010 to 2030
Figure SR5.1-4 shows water supply increase from 2010 to 2030.
Figure SR5.1-4 Water Supply Increase from 2010 to 2030
0%
10%
20%
30%
40%
50%
60%
70%
80%
90%
100%
0
500
1,000
1,500
2,000
2,500
3,000
3,500
Rural GW
Urban GW
Urban SW
Coverage
Nationwide
(MLD) (Coverage)
0%
10%
20%
30%
40%
50%
60%
70%
80%
90%
100%
0
500
1,000
1,500
2,000
2,500
3,000
3,500
Rural GW
Urban GW
Urban SW
Coverage
(MLD) (Coverage)
0
500
1,000
1,500
2,000
2,500
3,000
3,500
N Rural GW
N Urban GW
N Urban SW
R Rural GW
R Urban GW
R Urban SW
(MLD)
Source: JICA Project Team
Source: JICA Project Team
Source: JICA Project Team

The Project for Review and Update of Nigeria National Water Resources Master Plan
Volume-5, SR5 (SR5-58)
(5) Water Supply Increase Ratio
Figure SR5.1-5 shows water supply increase (2030/2010) ratio.
Figure SR5.1-5 Water Supply Increase (2030/2010) Ratio
(6) Deviation Score of Water Supply Increase
Figure SR5.1-6 shows deviation score of water supply increase from 2010 to 2030 among states for reference.
Figure SR5.1-6 Deviation Score of Water Supply Increase from 2010 to 2030
SR5.1.3 Sanitation Development Plan
(1) Sanitation Development Plan of All States
To meet the future sanitation demand projected in the Project, the Project calculates state-wise sanitation development in the target year 2030, as shown in Table SR5.1-6.
On the other hand, the Project estimates required development of domestic sanitation facilities (toilet or latrine) in the target period of sanitation development plan from 2015 to 2030, as shown in Table SR5.1-7 and SR5.1-8.
0
5
10
15
20
25
30
35
40
45
0
500
1,000
1,500
2,000
2,500
3,000
3,500
N Rural GW
N Urban GW
N Urban SW
R Rural GW
R Urban GW
R Urban SW
Supply in 2010
2030/2010
Nationwide
(MLD) (2030/2010 Rate)
0
50
100Abia
AdamawaAkwa Ibom
Anambra
Bauchi
Bayelsa
Benue
Borno
Cross River
Delta
Ebonyi
Edo
Ekiti
Enugu
Gombe
Imo
JigawaKaduna
KanoKatsinaKebbi
Kogi
Kwara
Lagos
Nasarawa
Niger
Ogun
Ondo
Osun
Oyo
Plateau
Rivers
Sokoto
Taraba
Yobe
ZamfaraFCT Abuja
R Urban SW
R Urban GW
R Rural GW
N Urban SW
N Urban GW
N Rural GW
Total
Source: JICA Project Team
Source: JICA Project Team

The Project for Review and Update of Nigeria National Water Resources Master Plan
Volume-5, SR5 (SR5-59)
Sani
tati
on D
evel
opm
ent
Pre
-MP
Per
iod
(201
0-20
14)
Sani
tati
on D
evel
opm
ent
MP
Per
iod
(201
5-20
30)
Tot
al S
anit
atio
n D
evel
opm
ent
unti
l 203
0P
ublic
Toi
let
(Nos
)F
inal
Sep
tage
Se
war
age
Hy
gien
e P
rom
otio
n (f
or H
H)
Pub
lic T
oile
t (N
os)
Fin
al S
epta
ge
Sew
arag
eH
ygi
ene
Pro
mot
ion
(for
HH
)P
ublic
Toi
let
(Nos
)F
inal
Sep
tage
Se
war
age
Hy
gien
e P
rom
otio
n (f
or H
H)
Urb
anSU
/ST
Fac
ility
/Sit
e (f
or H
H)
Syst
em (
m3)
SU/S
TR
ural
Urb
anSU
/ST
Fac
ility
/Sit
e (f
or H
H)
Syst
em (
m3)
SU/S
TR
ural
Urb
anSU
/ST
Fac
ility
/Sit
e (f
or H
H)
Syst
em (
m3)
SU/S
TR
ural
1A
bia
-
-
-
-
70
,250
53,8
34
24
4
20
2
32
0,55
3
-
32
8,70
4
252,
680
24
4
20
2
32
0,55
3
-
39
8,95
3
306,
514
2
Ada
maw
a-
-
-
-
65,9
73
64
,998
83
25
2
69
,150
-
293,
810
29
8,58
1
83
25
2
69
,150
-
359,
783
36
3,57
9
3A
kwa
Ibom
-
-
-
-
89
,193
75,6
49
16
5
34
9
16
0,79
4
-
43
1,16
3
375,
587
16
5
34
9
16
0,79
4
-
52
0,35
5
451,
236
4
Ana
mbr
a-
-
-
-
97,5
60
56
,307
324
344
359,
144
-
450,
992
26
5,12
7
324
344
359,
144
-
548,
553
32
1,43
4
5B
auch
i-
-
-
-
86,1
94
93
,374
110
392
80,7
50
-
41
1,89
4
454,
184
11
0
39
2
80
,750
-
498,
088
54
7,55
7
6B
ayel
sa-
-
-
-
55,8
85
32
,941
102
160
103,
449
-
256,
731
13
0,90
0
102
160
103,
449
-
312,
616
16
3,84
1
7B
enue
-
-
-
-
81
,944
100,
730
12
7
30
7
10
3,97
5
-
37
4,30
2
465,
104
12
7
30
7
10
3,97
5
-
45
6,24
6
565,
834
8
Bor
no-
-
-
-
112,
570
86
,921
119
410
111,
962
-
539,
145
44
2,54
6
119
410
111,
962
-
651,
715
52
9,46
8
9C
ross
Riv
er-
-
-
-
87,5
74
94
,767
110
210
133,
195
-
389,
870
43
6,05
9
110
210
133,
195
-
477,
444
53
0,82
6
10D
elta
-
-
-
-
14
4,07
6
106,
833
30
4
34
1
42
1,43
1
-
67
1,66
4
518,
159
30
4
34
1
42
1,43
1
-
81
5,74
1
624,
991
11
Ebo
nyi
-
-
-
-
50
,673
57,3
36
55
160
51,6
42
-
22
4,55
3
255,
756
55
160
51,6
42
-
27
5,22
6
313,
092
12
Edo
-
-
-
-
96
,705
67,2
14
22
7
25
3
27
3,57
2
48,5
43
43
6,21
7
311,
417
22
7
25
3
27
3,57
2
48,5
43
53
2,92
2
378,
631
13
Eki
ti-
-
-
-
102,
183
78
,504
134
206
208,
000
-
472,
802
35
9,10
8
134
206
208,
000
-
574,
985
43
7,61
2
14E
nugu
-
-
-
-
10
5,64
9
76,6
34
22
1
26
9
27
6,15
0
-
48
4,65
2
349,
444
22
1
26
9
27
6,15
0
-
59
0,30
1
426,
078
15
Gom
be-
-
-
-
44,1
36
40
,003
61
21
1
51
,280
-
212,
783
19
5,37
0
61
21
1
51
,280
-
256,
919
23
5,37
3
16Im
o-
-
-
-
74,7
78
76
,045
241
294
267,
478
-
365,
333
36
8,01
7
241
294
2 67,
478
-
440,
111
44
4,06
2
17Ji
gaw
a-
-
-
-
85,1
21
79
,565
127
357
97,3
00
-
38
6,29
8
356,
174
12
7
35
7
97
,300
-
471,
419
43
5,74
0
18K
adun
a-
-
-
-
66,8
15
66
,243
238
478
114,
231
-
306,
735
32
2,85
1
238
478
114,
231
-
373,
550
38
9,09
4
19K
ano
-
-
-
-
14
2,94
5
100,
307
40
4
91
5
31
0,48
5
-
72
1,50
4
511,
708
40
4
91
5
31
0,48
5
-
86
4,44
9
612,
015
20
Kat
sina
-
-
-
-
97
,727
92,8
69
17
2
48
1
14
2,91
7
-
46
3,68
9
440,
064
17
2
48
1
14
2,91
7
-
56
1,41
5
532,
934
21
Keb
bi-
-
-
-
30,9
32
35
,398
82
25
6
37
,206
-
148,
063
16
7,65
3
82
25
6
37
,206
-
178,
995
20
3,05
1
22K
ogi
-
-
-
-
12
2,28
8
94,8
36
11
5
29
6
14
6,71
8
-
55
5,06
9
435,
183
11
5
29
6
14
6,71
8
-
67
7,35
7
530,
020
23
Kw
ara
-
-
-
-
87
,556
56,3
53
10
6
21
2
12
5,32
1
-
38
2,87
9
274,
186
10
6
21
2
12
5,32
1
-
47
0,43
5
330,
539
24
Lag
os-
-
-
-
290,
879
28
,873
1,68
8
763
2,09
2,65
8
23
9,27
3
1,
437,
537
102,
557
1,
688
76
3
2,
092,
658
239,
273
1,72
8,41
6
13
1,43
0
25N
asar
awa
-
-
-
-
36
,319
32,6
44
70
156
60,9
82
-
16
9,55
2
153,
854
70
156
60,9
82
-
20
5,87
2
186,
498
26
Nig
er-
-
-
-
107,
664
98
,764
154
350
160,
094
-
521,
053
47
9,77
6
154
350
160,
094
-
628,
718
57
8,53
9
27O
gun
-
-
-
-
16
6,05
0
109,
226
31
1
32
4
48
4,78
1
-
76
6,51
3
515,
919
31
1
32
4
48
4,78
1
-
93
2,56
3
625,
145
28
Ond
o-
-
-
-
108,
393
12
5,83
7
150
245
202,
216
-
491,
010
57
7,42
6
150
245
202,
216
-
599,
404
70
3,26
3
29O
sun
-
-
-
-
10
5,65
6
111,
159
19
7
25
3
24
4,85
9
11,0
42
48
8,50
1
525,
804
19
7
25
3
24
4,85
9
11,0
42
59
4,15
7
636,
962
30
Oy
o-
-
-
-
191,
761
16
1,65
3
374
446
462,
706
34
,109
870,
682
82
4,23
9
374
446
462,
706
34
,109
1,06
2,44
3
98
5,89
2
31P
late
au-
-
-
-
72,3
66
71
,924
110
246
95,7
37
-
31
9,03
8
337,
324
11
0
24
6
95
,737
-
391,
404
40
9,24
9
32R
iver
s-
-
-
-
129,
643
11
5,09
0
545
368
619,
000
-
603,
678
57
4,59
5
545
368
619,
000
-
733,
321
68
9,68
5
33So
koto
-
-
-
-
63
,682
64,6
87
13
6
29
0
13
5,86
7
-
30
7,58
2
314,
209
13
6
29
0
13
5,86
7
-
37
1,26
4
378,
896
34
Tar
aba
-
-
-
-
54
,058
62,6
45
72
168
67,8
11
-
24
3,44
6
275,
733
72
168
67,8
11
-
29
7,50
4
338,
378
35
Yob
e-
-
-
-
55,8
72
51
,810
58
21
6
52
,555
-
272,
474
25
9,00
8
58
21
6
52
,555
-
328,
346
31
0,81
8
36Z
amfa
ra-
-
-
-
70,2
59
77
,154
72
26
7
64
,955
-
330,
637
36
6,01
6
72
26
7
64
,955
-
400,
896
44
3,16
9
37F
CT
Abu
ja-
-
-
-
58,2
81
14
,179
756
315
614,
821
14
0,30
0
52
0,16
0
114,
488
75
6
31
5
61
4,82
1
140,
300
578,
440
12
8,66
7
Tot
al-
-
-
-
3,50
9,60
8
2,
813,
306
8,56
4
11,7
62
9,
325,
745
473,
266
16,6
50,7
16
13
,406
,807
8,56
4
11,7
62
9,
325,
745
473,
266
20,1
60,3
24
16
,220
,113
Tabl
e SR
5.1-
6 Sa
nita
tion
Dev
elop
men
t Pla
n
Sou
rce:
JIC
A P
roje
ct T
eam

The Project for Review and Update of Nigeria National Water Resources Master Plan
Volume-5, SR5 (SR5-60)
Pop
ulat
ion
by S
ette
men
t C
ateg
ory
in 2
010
Pop
ulat
ion
wit
h Im
prov
ed S
anit
atio
n in
201
0P
op
. wit
h I
mpr
ov
ed S
ani.
in P
re-M
P P
erio
d (
201
1-1
4)
Pop
. wit
h Im
prov
ed S
ani.
in M
P P
erio
d (2
015-
30)
Tot
al P
opul
atio
n w
ith
Impr
oved
San
itat
ion
in 2
030
Urb
anSU
/ST
Rur
alT
otal
Urb
anSU
/ST
Rur
alT
otal
Urb
anSU
/ST
Rur
alT
otal
Urb
anSU
/ST
Rur
alT
otal
Urb
anSU
/ST
Rur
alT
otal
1A
bia
903
1,27
9
974
3,15
7
350
495
377
1,22
2
169
267
205
640
700
1,24
9
960
2,90
9
1,21
8
2,01
1
1,54
2
4,77
1
2A
dam
awa
280
1,65
6
1,60
6
3,54
3
60
353
342
755
66
396
390
852
289
1,76
3
1,79
1
3,84
3
415
2,51
1
2,52
4
5,45
0
3A
kwa
Ibom
504
2,13
8
1,78
4
4,42
7
197
834
696
1,72
7
107
455
386
948
516
2,19
9
1,91
5
4,63
0
820
3,48
8
2,99
7
7,30
5
4A
nam
bra
1,12
6
2,24
8
1,26
8
4,64
2
486
971
548
2,00
5
209
439
253
901
921
2,02
9
1,19
3
4,14
3
1,61
6
3,43
9
1,99
4
7,05
0
5B
auch
i34
5
2,
384
2,
555
5,
284
77
52
9
56
7
1,
173
84
58
6
63
5
1,
305
38
9
2,
801
3,
088
6,
278
54
9
3,
916
4,
291
8,
756
6B
ayel
sa28
8
99
8
61
6
1,
902
18
61
38
11
6
82
27
4
16
1
51
7
40
8
1,
258
64
1
2,
307
50
7
1,
593
84
0
2,
940
7B
enue
436
1,94
9
2,38
3
4,76
7
63
283
346
691
108
500
614
1,22
3
463
2,28
3
2,83
7
5,58
3
634
3,06
6
3,79
7
7,49
7
8B
orn
o40
6
2,
496
1,
850
4,
751
10
4
63
9
47
3
1,
216
91
59
7
46
1
1,
149
39
8
2,
857
2,
345
5,
601
59
3
4,
093
3,
280
7,
966
9C
ross
Riv
er40
3
1,
365
1,
457
3,
225
41
13
8
14
7
32
6
10
1
35
9
38
9
84
9
40
4
1,
598
1,
788
3,
790
54
6
2,
095
2,
324
4,
965
10D
elta
966
2,12
7
1,54
8
4,64
1
211
464
337
1,01
2
234
519
385
1,13
7
1,07
3
2,41
8
1,86
5
5,35
6
1,51
7
3,40
0
2,58
7
7,50
5
11E
bony
i18
9
1,
049
1,
182
2,
420
25
13
7
15
5
31
7
48
26
9
30
4
62
0
20
1
1,
190
1,
356
2,
747
27
4
1,
596
1,
814
3,
684
12E
do80
2
1,
658
1,
129
3,
589
24
0
49
6
33
8
1,
073
17
1
36
7
25
5
79
4
72
4
1,
658
1,
183
3,
565
1,
135
2,
521
1,
776
5,
432
13E
kiti
408
1,29
1
997
2,69
6
68
216
167
450
105
327
251
683
493
1,51
3
1,14
9
3,15
5
666
2,05
6
1,56
7
4,28
8
14E
nugu
712
1,70
5
1,24
1
3,65
8
134
321
233
688
176
423
307
905
795
1,93
9
1,39
8
4,13
1
1,10
5
2,68
2
1,93
8
5,72
4
15G
ombe
190
1,30
5
1,17
5
2,67
0
85
585
526
1,19
6
38
260
236
534
180
1,25
5
1,15
3
2,58
8
303
2,10
1
1,91
5
4,31
8
16Im
o73
6
1,
823
1,
868
4,
427
38
7
95
9
98
3
2,
329
13
7
33
7
34
2
81
6
68
0
1,
644
1,
656
3,
980
1,
204
2,
939
2,
981
7,
124
17Ji
gaw
a39
1
2,
304
2,
169
4,
864
85
50
2
47
3
1,
060
96
55
3
51
7
1,
166
45
1
2,
511
2,
315
5,
277
63
2
3,
566
3,
305
7,
504
18K
adun
a87
7
3,
076
2,
909
6,
861
25
3
88
9
84
1
1,
983
18
3
69
5
68
9
1,
567
75
1
3,
190
3,
358
7,
299
1,
188
4,
774
4,
887
10
,849
19K
ano
1,23
8
5,57
6
3,84
9
10,6
63
78
4
3,
530
2,
436
6,
750
20
5
92
9
65
2
1,
786
1,
029
4,
690
3,
326
9,
045
2,
018
9,
149
6,
414
17
,581
20K
atsi
na53
0
3,
062
2,
911
6,
503
24
9
1,
439
1,
368
3,
056
10
4
58
6
55
7
1,
247
50
5
2,
782
2,
640
5,
927
85
8
4,
808
4,
566
10
,231
21K
ebbi
247
1,58
8
1,83
3
3,66
8
95
608
702
1,40
5
53
337
386
776
258
1,61
4
1,82
7
3,69
9
406
2,55
9
2,91
5
5,88
0
22K
ogi
359
1,89
4
1,46
0
3,71
3
59
311
239
609
91
477
370
938
422
2,16
5
1,69
7
4,28
4
572
2,95
2
2,30
7
5,83
1
23K
war
a37
7
1,
402
86
4
2,
643
36
13
5
83
25
4
96
36
8
23
7
70
1
39
4
1,
608
1,
152
3,
153
52
6
2,
110
1,
471
4,
108
24L
ago
s5,
314
4,
452
52
8
10
,293
1,26
5
1,05
9
126
2,45
0
1,26
9
1,10
5
110
2,48
4
5,90
4
5,46
3
390
11,7
56
8,
438
7,
627
62
5
16
,690
25N
asar
awa
217
994
886
2,09
6
83
380
338
801
46
207
186
439
219
966
877
2,06
2
348
1,55
3
1,40
1
3,30
2
26N
iger
475
2,09
7
1,92
4
4,49
6
109
480
441
1,03
0
116
517
474
1,10
7
544
2,50
1
2,30
3
5,34
8
768
3,49
8
3,21
8
7,48
4
27O
gun
895
2,03
0
1,32
3
4,24
7
112
254
165
531
242
531
350
1,12
3
1,19
8
2,45
3
1,65
1
5,30
2
1,55
1
3,23
8
2,16
6
6,95
5
28O
ndo
488
1,57
2
1,81
5
3,87
5
72
231
267
570
124
401
466
990
553
1,81
7
2,13
6
4,50
6
748
2,44
9
2,86
9
6,06
6
29O
sun
621
1,58
5
1,64
9
3,85
4
83
211
219
513
161
412
434
1,00
7
739
1,90
5
2,05
1
4,69
5
983
2,
528
2,
703
6,
214
30O
yo1,
226
2,
834
2,
268
6,
328
87
20
1
16
1
44
9
32
8
76
7
64
7
1,
742
1,
452
3,
483
3,
297
8,
232
1,
867
4,
451
4,
105
10
,423
31P
late
au38
8
1,
626
1,
567
3,
581
54
22
4
21
6
49
4
96
41
2
41
0
91
8
39
6
1,
819
1,
923
4,
138
54
6
2,
455
2,
549
5,
550
32R
iver
s1,
642
2,
298
1,
968
5,
908
32
2
45
0
38
6
1,
158
41
3
57
0
50
6
1,
490
1,
989
2,
656
2,
528
7,
173
2,
724
3,
677
3,
420
9,
821
33So
koto
444
1,84
3
1,86
3
4,15
0
251
1,04
1
1,05
3
2,34
5
75
318
323
717
353
1,53
8
1,57
1
3,46
2
679
2,89
7
2,94
7
6,52
4
34T
arab
a21
9
1,
080
1,
262
2,
560
21
10
3
12
0
24
3
59
28
7
33
2
67
8
28
0
1,
290
1,
461
3,
031
35
9
1,
679
1,
913
3,
952
35Y
obe
181
1,29
1
1,17
9
2,65
0
50
354
323
726
42
307
285
634
197
1,49
9
1,42
5
3,12
1
289
2,16
0
2,03
2
4,48
1
36Z
amfa
ra22
3
1,
660
1,
814
3,
697
61
45
6
49
9
1,
017
52
38
6
42
4
86
3
24
4
1,
819
2,
013
4,
076
35
7
2,
661
2,
936
5,
955
37FC
T A
buja
919
831
225
1,97
4
345
312
84
742
329
286
69
684
3,10
3
2,54
9
561
6,21
2
3,77
7
3,14
7
715
7,63
9
Tota
l (x1
,000
)25
,964
72,5
62
59
,897
158,
423
7,01
8
20,6
49
16
,812
44,4
79
6,
105
16
,827
13,9
97
36
,928
29,6
14
79
,971
66,8
23
17
6,40
7
42
,736
117,
447
97,6
32
25
7,81
5
Tabl
e SR
5.1-
7 R
equi
red
Dev
elop
men
t of D
omes
tic S
anita
tion
Faci
litie
s (Po
pula
tion-
Bas
is)
Sou
rce:
JIC
A P
roje
ct T
eam
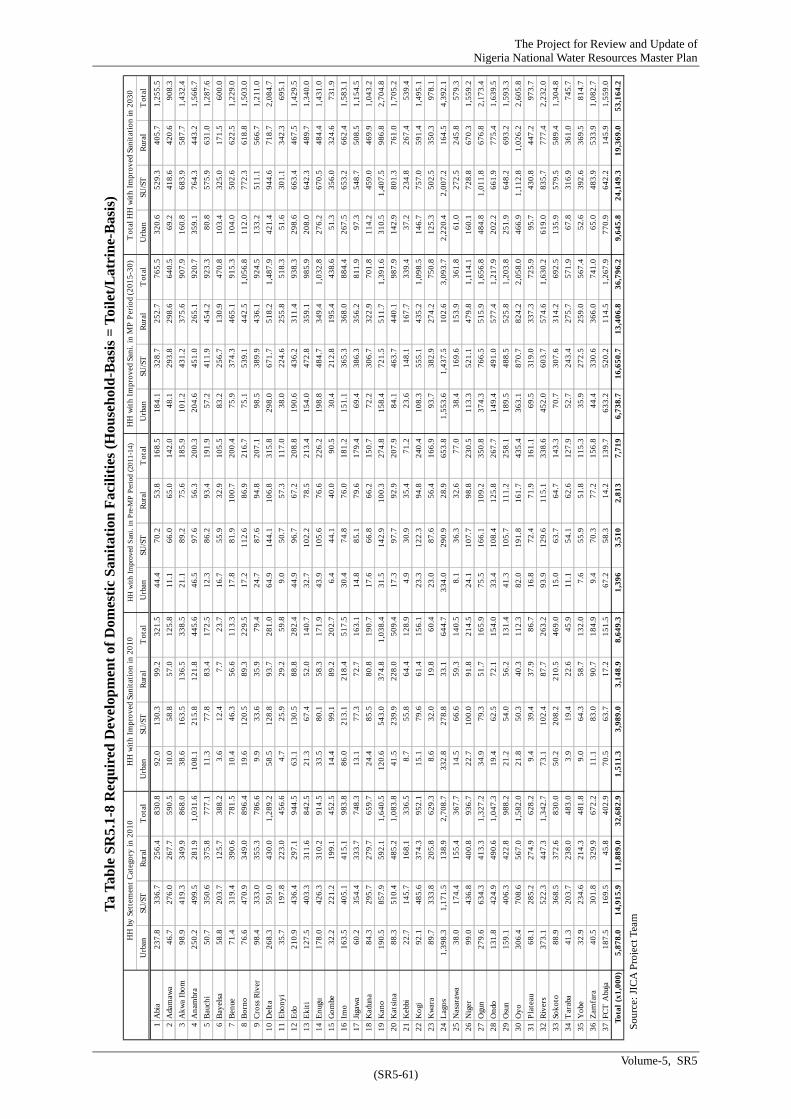
The Project for Review and Update of Nigeria National Water Resources Master Plan
Volume-5, SR5 (SR5-61)
HH
by
Sett
emen
t C
ateg
ory
in 2
010
HH
wit
h I
mpr
ove
d Sa
nita
tion
in 2
010
HH
wit
h Im
prov
ed S
ani.
in
Pre
-MP
Per
iod
(201
1-14
)H
H w
ith
Impr
oved
San
i. in
MP
Per
iod
(201
5-30
)T
otal
HH
wit
h Im
prov
ed S
anit
atio
n in
203
0
Urb
anSU
/ST
Rur
alT
otal
Urb
anSU
/ST
Rur
alT
otal
Urb
anSU
/ST
Rur
alT
ota
lU
rban
SU/S
TR
ural
Tot
alU
rban
SU/S
TR
ural
Tot
al
1A
bia
237.
8
336.
7
256.
4
830.
8
92.0
130.
3
99.2
321.
5
44.4
70.2
53.
8
16
8.5
18
4.1
32
8.7
25
2.7
76
5.5
32
0.6
52
9.3
40
5.7
1,
255.
5
2A
dam
awa
46.7
276.
0
267.
7
590.
5
10.0
58.8
57.0
125.
8
11.1
66.0
65.
0
14
2.0
4
8.1
293.
8
298
.6
640.
5
69.2
418
.6
420.
6
908.
3
3A
kwa
Ibom
98.9
419.
3
349.
9
868.
0
38.6
163.
5
136.
5
338.
5
21.1
89.2
75.
6
18
5.9
10
1.2
43
1.2
37
5.6
90
7.9
16
0.8
68
3.9
58
7.7
1,
432.
4
4A
nam
bra
250.
2
499.
5
281.
9
1,03
1.6
108
.1
215.
8
121.
8
445.
6
46.5
97.6
56.
3
20
0.3
20
4.6
45
1.0
26
5.1
92
0.7
35
9.1
76
4.3
44
3.2
1,
566.
7
5B
auch
i50
.7
35
0.6
37
5.8
77
7.1
11
.3
77
.8
83
.4
17
2.5
12
.3
86
.2
9
3.4
191.
9
57.
2
41
1.9
45
4.2
92
3.3
80
.8
57
5.9
63
1.0
1,
287.
6
6B
ayel
sa58
.8
20
3.7
12
5.7
38
8.2
3
.6
12
.4
7.
7
2
3.7
16.7
55.9
32.
9
10
5.5
8
3.2
256.
7
130
.9
470.
8
103.
4
325
.0
171.
5
600.
0
7B
enue
71.4
319.
4
390.
6
781.
5
10.4
46.3
56.6
113.
3
17.8
81.9
100.
7
200.
4
75.
9
37
4.3
46
5.1
91
5.3
10
4.0
50
2.6
62
2.5
1,
229.
0
8B
orno
76.6
470.
9
349.
0
896.
4
19.6
120.
5
89.3
229.
5
17.2
112.
6
86.
9
21
6.7
7
5.1
539.
1
442
.5
1,05
6.8
112.
0
772
.3
618.
8
1,50
3.0
9C
ross
Riv
er98
.4
33
3.0
35
5.3
78
6.6
9
.9
33
.6
35
.9
7
9.4
24.7
87.6
94.
8
20
7.1
9
8.5
389.
9
436
.1
924.
5
133.
2
511
.1
566.
7
1,21
1.0
10D
elta
268.
3
591.
0
430.
0
1,28
9.2
58.5
128.
8
93.7
281.
0
64.9
144.
1
106.
8
315.
8
298.
0
671.
7
518
.2
1,48
7.9
421.
4
944
.6
718.
7
2,08
4.7
11E
bony
i35
.7
19
7.8
22
3.0
45
6.6
4
.7
25
.9
29
.2
5
9.8
9.0
50.7
57.
3
11
7.0
3
8.0
224.
6
255
.8
518.
3
51.6
301
.1
342.
3
695.
1
12E
do21
0.9
43
6.4
29
7.1
94
4.5
63
.1
13
0.5
88
.8
28
2.4
44
.9
96
.7
6
7.2
208.
8
190.
6
436.
2
311
.4
938.
3
298.
6
663
.4
467.
5
1,42
9.5
13E
kiti
127.
5
403.
3
311.
6
842.
5
21.3
67.4
52.0
140.
7
32.7
102.
2
78.
5
21
3.4
15
4.0
47
2.8
35
9.1
98
5.9
20
8.0
64
2.3
48
9.7
1,
340.
0
14E
nugu
178.
0
426.
3
310.
2
914.
5
33.5
80.1
58.3
171.
9
43.9
105.
6
76.
6
22
6.2
19
8.8
48
4.7
34
9.4
1,
032.
8
27
6.2
67
0.5
48
4.4
1,
431.
0
15G
ombe
32.2
221.
2
199.
1
452.
5
14.4
99.1
89.2
202.
7
6.4
44.1
40.
0
90
.5
3
0.4
212.
8
195
.4
438.
6
51.3
356
.0
324.
6
731.
9
16Im
o16
3.5
40
5.1
41
5.1
98
3.8
86
.0
21
3.1
21
8.4
51
7.5
30
.4
74
.8
7
6.0
181.
2
151.
1
365.
3
368
.0
884.
4
267.
5
653
.2
662.
4
1,58
3.1
17Ji
gaw
a60
.2
35
4.4
33
3.7
74
8.3
13
.1
77
.3
72
.7
16
3.1
14
.8
85
.1
7
9.6
179.
4
69.
4
38
6.3
35
6.2
81
1.9
97
.3
54
8.7
50
8.5
1,
154.
5
18K
adun
a84
.3
29
5.7
27
9.7
65
9.7
24
.4
85
.5
80
.8
19
0.7
17
.6
66
.8
6
6.2
150.
7
72.
2
30
6.7
32
2.9
70
1.8
11
4.2
45
9.0
46
9.9
1,
043.
2
19K
ano
190.
5
857.
9
592.
1
1,64
0.5
120
.6
543.
0
374.
8
1,03
8.4
31.5
142.
9
100.
3
274.
8
158.
4
721.
5
511
.7
1,39
1.6
310.
5
1,4
07.5
986.
8
2,70
4.8
20K
atsi
na88
.3
51
0.4
48
5.2
1,
083.
8
41
.5
23
9.9
22
8.0
50
9.4
17
.3
97
.7
9
2.9
207.
9
84.
1
46
3.7
44
0.1
98
7.9
14
2.9
80
1.3
76
1.0
1,
705.
2
21K
ebbi
22.7
145.
7
168.
1
336.
5
8.7
55.8
64.4
128.
9
4.9
30.9
35.
4
71
.2
2
3.6
148.
1
167
.7
339.
4
37.2
234
.8
267.
4
539.
4
22K
ogi
92.1
485.
6
374.
3
952.
1
15.1
79.6
61.4
156.
1
23.3
122.
3
94.
8
24
0.4
10
8.3
55
5.1
43
5.2
1,
098.
5
14
6.7
75
7.0
59
1.4
1,
495.
1
23K
war
a89
.7
33
3.8
20
5.8
62
9.3
8
.6
32
.0
19
.8
6
0.4
23.0
87.6
56.
4
16
6.9
9
3.7
382.
9
274
.2
750.
8
125.
3
502
.5
350.
3
978.
1
24L
agos
1,39
8.3
1,17
1.5
138.
9
2,70
8.7
332
.8
278.
8
33.1
644.
7
334.
0
290.
9
28.
9
65
3.8
1,
553.
6
1,
437.
5
10
2.6
3,
093.
7
2,
220.
4
2
,007
.2
16
4.5
4,
392.
1
25N
asar
awa
38.0
174.
4
155.
4
367.
7
14.5
66.6
59.3
140.
5
8.1
36.3
32.
6
77
.0
3
8.4
169.
6
153
.9
361.
8
61.0
272
.5
245.
8
579.
3
26N
iger
99.0
436.
8
400.
8
936.
7
22.7
100.
0
91.8
214.
5
24.1
107.
7
98.
8
23
0.5
11
3.3
52
1.1
47
9.8
1,
114.
1
16
0.1
72
8.8
67
0.3
1,
559.
2
27O
gun
279.
6
634.
3
413.
3
1,32
7.2
34.9
79.3
51.7
165.
9
75.5
166.
1
109.
2
350.
8
374.
3
766.
5
515
.9
1,65
6.8
484.
8
1,0
11.8
676.
8
2,17
3.4
28O
ndo
131.
8
424.
9
490.
6
1,04
7.3
19.4
62.5
72.1
154.
0
33.4
108.
4
125.
8
267.
7
149.
4
491.
0
577
.4
1,21
7.9
202.
2
661
.9
775.
4
1,63
9.5
29O
sun
159.
1
406.
3
422.
8
988.
2
21.2
54.0
56.2
131.
4
41.3
105.
7
111.
2
258.
1
189.
5
488.
5
525
.8
1,20
3.8
251.
9
648
.2
693.
2
1,59
3.3
30O
yo30
6.4
70
8.6
56
7.0
1,
582.
0
21
.8
50
.3
40
.3
11
2.3
82
.0
19
1.8
16
1.7
43
5.4
36
3.1
87
0.7
82
4.2
2,
058.
0
46
6.9
1
,112
.8
1,
026.
2
2,
605.
8
31P
late
au68
.1
28
5.2
27
4.9
62
8.2
9
.4
39
.4
37
.9
8
6.7
16.8
72.4
71.
9
16
1.1
6
9.5
319.
0
337
.3
725.
9
95.7
430
.8
447.
2
973.
7
32R
iver
s37
3.1
52
2.3
44
7.3
1,
342.
7
73
.1
10
2.4
87
.7
26
3.2
93
.9
12
9.6
11
5.1
33
8.6
45
2.0
60
3.7
57
4.6
1,
630.
2
61
9.0
83
5.7
77
7.4
2,
232.
0
33So
koto
88.9
368.
5
372.
6
830.
0
50.2
208.
2
210.
5
469.
0
15.0
63.7
64.
7
14
3.3
7
0.7
307.
6
314
.2
692.
5
135.
9
579
.5
589.
4
1,30
4.8
34T
arab
a41
.3
20
3.7
23
8.0
48
3.0
3
.9
19
.4
22
.6
4
5.9
11.1
54.1
62.
6
12
7.9
5
2.7
243.
4
275
.7
571.
9
67.8
316
.9
361.
0
745.
7
35Y
obe
32.9
234.
6
214.
3
481.
8
9.0
64.3
58.7
132.
0
7.6
55.9
51.
8
11
5.3
3
5.9
272.
5
259
.0
567.
4
52.6
392
.6
369.
5
814.
7
36Z
amfa
ra40
.5
30
1.8
32
9.9
67
2.2
11
.1
83
.0
90
.7
18
4.9
9.
4
70
.3
7
7.2
156.
8
44.
4
33
0.6
36
6.0
74
1.0
65
.0
48
3.9
53
3.9
1,
082.
7
37FC
T A
buja
187.
5
169.
5
45.
8
40
2.9
70
.5
63
.7
17
.2
15
1.5
67
.2
58
.3
1
4.2
139.
7
633.
2
520.
2
114
.5
1,26
7.9
770.
9
642
.2
145.
9
1,55
9.0
Tota
l (x1
,000
)5,
878.
0
14
,915
.9
11,8
89.0
32
,682
.9
1,51
1.3
3,98
9.0
3,14
8.9
8,64
9.3
1,39
6
3,51
0
2,81
3
7,71
9
6,73
8.7
16,6
50.7
13
,406
.8
36,7
96.2
9,
645.
8
24
,149
.3
19,3
69.0
53
,164
.2
Ta T
able
SR
5.1-
8 R
equi
red
Dev
elop
men
t of D
omes
tic S
anita
tion
Faci
litie
s (H
ouse
hold
-Bas
is =
Toi
let/L
atri
ne-B
asis
)
Sou
rce:
JIC
A P
roje
ct T
eam

The Project for Review and Update of Nigeria National Water Resources Master Plan
Volume-5, SR5 (SR5-62)
(2) Household with Imprioved Sanitation in 2010
Figure SR5.1-7 shows household with improved sanitation (number of toilet/latrine) in 2010.
Figure SR5.1-7 Household with Improved Sanitation in 2010
(3) Household with Imprioved Sanitation in 2030
Figure SR5.1-8 shows household with improved sanitation (number of toilet/latrine) in 2030.
Figure SR5.1-8 Household with Improved Sanitation in 2030
(4) Increase in Improved Sanitation from 2010 to 2030
Figure SR5.1-9 shows increase in improved saniation (toilet/latrine) from 2010 to 2030.
Figure SR5.1-9 Increase in Improved Sanitation from 2010 to 2030
0%
10%
20%
30%
40%
50%
60%
70%
80%
90%
100%
0
500
1,000
1,500
2,000
2,500
3,000
3,500
4,000
4,500
5,000
Rural
S.U./S.T.
Urban
Coverage
Nationwide
(x1,000) (Coverage)
0%
10%
20%
30%
40%
50%
60%
70%
80%
90%
100%
0
500
1,000
1,500
2,000
2,500
3,000
3,500
4,000
4,500
5,000
Rural
S.U./S.T.
Urban
Coverage
(x1,000) (Coverage)
0
500
1,000
1,500
2,000
2,500
3,000
3,500
4,000
4,500
5,000
Rural
S.U./S.T.
Urban
(x1,000)
Source: JICA Project Team
Source: JICA Project Team
Source: JICA Project Team

The Project for Review and Update of Nigeria National Water Resources Master Plan
Volume-5, SR5 (SR5-63)
(5) Increase Ratio of Improved Sanitation
Figure SR5.1-10 shows increase (2030/2010) ratio of improved sanitation (toilet/latrine).
Figure SR5.1-10 Increase (2030/2010) Ratio of Improved Sanitation
(6) Deviation Score of Increase in Improved Sanitation
Figure SR5.1-11 shows deviation score of increase in improved sanitation (toilet/latrine) from 2010 to 2030 among states for reference.
Figure SR5.1-11 Deviation Score of Increase in Improved Sanitation from 2010 to 2030
0
5
10
15
20
25
30
0
500
1,000
1,500
2,000
2,500
3,000
3,500
4,000
4,500
5,000
Rural
S.U./S.T.
Urban
Served in 2010
2030/2010
Nationwide
(x1,000) (2030/2010 Rate)
0
50
100Abia
AdamawaAkwa Ibom
Anambra
Bauchi
Bayelsa
Benue
Borno
Cross River
Delta
Ebonyi
Edo
Ekiti
Enugu
Gombe
Imo
JigawaKaduna
KanoKatsinaKebbi
Kogi
Kwara
Lagos
Nasarawa
Niger
Ogun
Ondo
Osun
Oyo
Plateau
Rivers
Sokoto
Taraba
Yobe
ZamfaraFCT Abuja
Urban
S.U./S.T.
Rural
Total
Source: JICA Project Team
Source: JICA Project Team

The Project for Review and Update of Nigeria National Water Resources Master Plan
Volume-5, SR5 (SR5-64)
SR5.2 Irrigation and Drainage Development Plan
SR5.2.1 Existing Public Irrigation Scheme
Table SR5.2-1 Area of Existing Public Irrigation Scheme 1.1 Large Scale: Planned Area of Existing Irrigation Project
1.2 Large Scale: System Developed Area of Existing Irrigation Project
1.3 Large Scale: Service Area of Existing Irrigation Project
2.1 Medium and Small Scale: Planned Area of Existing Irrigation Project
2.2 Medium and Small Scale: System Developed Area of Existing Irrigation Project
2.3 Medium and Small Scale: Service Area of Existing Irrigation Project
3.1 Compiled: Planned Area of Existing Irrigation Project
3.2 Compiled: System Developed Area of Existing Irrigation Project
HA HA-1 HA-2 HA-3 HA-4 HA-5 HA-6 HA-7 HA-8 TotalPublic RBDA 43,800 21,900 24,810 18,037 26,860 38,700 10,545 166,800 351,452 State 7,500 15,660 6,700 1,000 1,000 1,300 6,100 22,692 61,952
Sub-total 51,300 37,560 31,510 19,037 27,860 40,000 16,645 189,492 413,404 Private Company 9,000 16,200 25,200 Total 51,300 46,560 47,710 19,037 27,860 40,000 16,645 189,492 438,604
HA HA-1 HA-2 HA-3 HA-4 HA-5 HA-6 HA-7 HA-8 TotalPublic RBDA 27,988 4,245 1,160 4,327 8,783 2,984 1,331 46,608 97,426 State 2,250 3,498 500 0 315 1,300 1,075 7,000 15,938
Sub-total 30,238 7,743 1,660 4,327 9,098 4,284 2,406 53,608 113,364 Private Company 5,600 7,109 12,709 Total 30,238 13,343 8,769 4,327 9,098 4,284 2,406 53,608 126,073
HA HA-1 HA-2 HA-3 HA-4 HA-5 HA-6 HA-7 HA-8 Total Public RBDA 12,388 3,580 683 2,110 1,716 1,588 1,285 24,658 48,008 State 1,800 2,268 100 0 315 0 825 5,710 11,018
Sub-total 14,188 5,848 783 2,110 2,031 1,588 2,110 30,368 59,026 Private Company 609 609 Total 14,188 5,848 1,392 2,110 2,031 1,588 2,110 30,368 59,635
HA HA-1 HA-2 HA-3 HA-4 HA-5 HA-6 HA-7 HA-8 Total Public RBDA 940 1,255 1,050 100 830 3,074 2,609 800 10,658 State 1,680 5,421 470 1,150 600 670 3,740 3,060 16,791
Sub-total 2,620 6,676 1,520 1,250 1,430 3,744 6,349 3,860 27,449 Private Company 300 300 Total 2,620 6,676 1,820 1,250 1,430 3,744 6,349 3,860 27,749
HA HA-1 HA-2 HA-3 HA-4 HA-5 HA-6 HA-7 HA-8 Total Public RBDA 940 552 365 20 363 1,113 1,681 492 5,526 State 971 2,973 470 650 570 350 1,975 1,248 9,207
Sub-total 1,911 3,525 835 670 933 1,463 3,656 1,740 14,733 Private Company 300 300 Total 1,911 3,525 1,135 670 933 1,463 3,656 1,740 15,033
HA HA-1 HA-2 HA-3 HA-4 HA-5 HA-6 HA-7 HA-8 Total Public RBDA 720 429 170 20 318 992 1,126 472 4,247 State 621 1,300 20 130 90 100 830 688 3,779
Sub-total 1,341 1,729 190 150 408 1,092 1,956 1,160 8,026 Private Company 300 300 Total 1,341 1,729 490 150 408 1,092 1,956 1,160 8,326
HA HA-1 HA-2 HA-3 HA-4 HA-5 HA-6 HA-7 HA-8 Total Public RBDA 44,740 23,155 25,860 18,137 27,690 41,774 13,154 167,600 362,110 State 9,180 21,081 7,170 2,150 1,600 1,970 9,840 25,752 78,743
Sub-total 53,920 44,236 33,030 20,287 29,290 43,744 22,994 193,352 440,853 Private Company 9,000 16,500 25,500 Total 53,920 53,236 49,530 20,287 29,290 43,744 22,994 193,352 466,353
HA HA-1 HA-2 HA-3 HA-4 HA-5 HA-6 HA-7 HA-8 Total Public RBDA 28,928 4,797 1,525 4,347 9,146 4,097 3,012 47,100 102,952

The Project for Review and Update of Nigeria National Water Resources Master Plan
Volume-5, SR5 (SR5-65)
3.3 Compiled: Service Area of Existing Irrigation Project
Irrigation (Classification by Federal Department of Irrigation and Drainage)
Large Irrigation - Planning Area > =500ha Medium Irrigation - 50ha =< Planning Area < 500ha Small Irrigation - Planning Area < 50ha
Amount of Irrigation Scheme Location by HA (Unit: site)
HA Large Scale Medium and Small Scale Total 1 12 16 28 2 27 49 76 3 12 (14) 8 (9) 20 (23) 4 15 11 26 5 12 9 21 6 17 21 38 7 15 27 42 8 27 23 50
Total 137 (139) 164 (165) 301 (304) Note: The figure shown ( ) is included the Private Company Irrigation Scheme Future Irrigation Area without Private Company
Future irrigation area means irrigable area subject to the proposed cropping pattern and safety level for water supply (1/5 years safety level)
State 3,221 6,471 970 650 885 1,650 3,050 8,248 25,145 Sub-total 32,149 11,268 2,495 4,997 10,031 5,747 6,062 55,348 128,097
Private Company 5,600 7,409 13,009 Total 32,149 16,868 9,904 4,997 10,031 5,747 6,062 55,348 141,106
HA HA-1 HA-2 HA-3 HA-4 HA-5 HA-6 HA-7 HA-8 Total Public RBDA 13,108 4,009 853 2,130 2,034 2,580 2,411 25,130 52,255 State 2,421 3,568 120 130 405 100 1,655 6,398 14,797
Sub-total 15,529 7,577 973 2,260 2,439 2,680 4,066 31,528 67,052 Private Company 909 909 Total 15,529 7,577 1,882 2,260 2,439 2,680 4,066 31,528 67,961

Existing P
Existing P
Existing P
PlanninFuture SystemIrrigate
HA 1 2 3 4 5 6 7 8
Total
HA 1 2 3 4 5 6 7 8
Total
HA 1 2 3 4 5 6 7 8
Total
Table SRPublic Large S
Public Medium
Public Irrigatio
ng area Irrigation are
m Developed aed Service are
Future Irri
Future Irri
Future Irri
R5.2-2 FuturScale Irrigation
m and Small Sc
on Project (A)
: Potea : Potarea : Devea : Act
igation Area (ha321112
822
igation Area (ha
1
igation Area (ha422112
824
re Irrigationn Project (A)
cale Irrigation
+ (B)
tential area of tential area of veloped area atual cropped a
a) Sys9,130 2,563 9,210 1,824 6,320 6,854 3,131 2,800 1,832
a) Sys1,911 4,383 1,055
670 1,380 2,544 5,279 1,798 9,020
a) Sys1,041 6,946 0,265 2,494 7,700 9,398 8,410 4,598 0,852
(SR5-66)
n Area of Ex
Project (B)
f irrigation spef irrigation estialready constrarea facilitated
stem developed
1
stem developed
stem developed
1
Niger
xisting Publ
ecified by RBDimated from sructed major id farm canal, e
(ha) S30,238
7,743 1,660 4,327 9,098 4,284 2,406
53,608 113,364
(ha) S1,911 3,525
835 670 933
1,463 3,656 1,740
14,733
(ha) S32,149 11,268 2,495 4,997
10,031 5,747 6,062
55,348 128,097
The Project ia National Wat
ic Irrigation
DAs and Stateurface water brrigation systeetc
Service Area (ha14
5
2212
3059
Service Area (ha11
1118
Service Area (ha15
7
2224
3167
for Review andater Resources M
Volu
n Scheme
e agency by JPT em
a) Inten4,188 5,848
783 2,110 2,031 1,588 2,110 0,368 9,026
a) Inten1,341 1,729
190 150 408
1,092 1,956 1,160 8,026
a) Inten5,529 7,577
973 2,260 2,439 2,680 4,066 1,528 7,052
d Update of Master Plan
me-5, SR5
nsity (%) 36 26
4 18 12
6 67 37 27
nsity (%) 70 39 18 22 30 43 37 65 42
nsity (%) 38 28
5 18 14
9 48 37 28

The Project for Review and Update of Nigeria National Water Resources Master Plan
Volume-5, SR5 (SR5-67)
Table SR5.2-3 Existing Large Scale Irrigation Project (HA-1) (1/2)
Table SR5.2-3 Existing Large Scale Irrigation Project (HA-1) (2/2)
Table SR5.2-4 Existing Large Scale Irrigation Project (HA-2) (1/2)
SN
No.
HA
On-
goin
g
Reh
abil
itat
ion
Exp
ansi
on
Project Name State
Lon
gitu
de
Eas
t
Lat
itud
e N
orth
River SHA Agency
1 1 1 ○ Jibiya Katsina 7.26175 13.07776 1060861_i2 SRRBDA 2 2 1 ○ E Zobe Katsina 7.45318 12.34264 Karaduwa 1060881 SRRBDA3 3 1 Bakolori Zamfara 6.06297 12.59716 Sokoto 106091 SRRBDA4 4 1 ○ E Middle Rima Valley Sokoto 5.86027 13.51345 Rima 106083 SRRBDA 5 5 1 E Swashi Valley Niger 4.29965 10.39572 Swashi 101 LNRBDA6 6 1 ○ Sabke Katsina 8.15723 13.06457 106082_i2 SRRBDA Sub-total 7 7 1 Ajiwa Katsina 7.75159 12.96556 106082_i2 MANR8 8 1 R E Wurno Sokoto 5.45506 13.30017 Rima 106081_i MANR 9 9 1 Wara Kebbi 4.62645 10.23562 Kainji Lake 101 MANR
10 10 1 R E Kware Sokoto 5.29017 13.20146 Rima 106081_i MANR11 11 1 R Kalmalo Sokoto 5.24706 13.70759 kalmalo 106081_i MANR 12 12 1 R Gafara Niger 4.46507 10.58322 Kainji Lake 101 MANR
Sub-total Total
SN
No.
Project Name
Wat
er S
ourc
e W
orks
Name of
Source
Irrigation Area (ha)
Irrigation Service Area
(ha)
Remarks Source
Fut
ure
Irri
gati
on A
rea
in
2030
(ha
)
Pla
nned
Are
a
Are
a w
ith
Rel
iabl
e W
ater
S
uppl
y (*
1)
Sys
tem
D
evel
oped
Ser
vice
Are
a
Inte
nsity
(%
)
1 1 Jibiya Dam Jibiya 3,500 2,300 3,000 3,000 86 ROPISIN, Faithline
2,300
2 2 Zobe Dam Zobe 8,200 2,000 60 0 0 Under Construction UNRF, 2020M/S 2,000 3 3 Bakolori Dam Bakolori 23,000 23,000 23,000 8,000 35 2020M/s,
ROPISIN 23,000
4 4 Middle Rima Valley
Dam Goronyo 5,000 5,000 1,188 1,188 24 ROPISIN, DID 5,000
5 5 Swashi Valley Dam Kubil & Swashi
2,900 2,900 200 200 7 Rice, vegetable, maize
ROPISIN 2,900
6 6 Sabke Dam Sabke 1,200 130 540 0 0 Under construction UNRF, DID, 130 Sub-total 43,800 35,330 27,988 12,388 28 35,330 7 7 Ajiwa Dam Ajiwa 1,900 0 500 500 26 Vegetable, maize 2020M/S, 95M/S 0 8 8 Wurno Dam Rima R. 1,500 1,500 700 600 40 2020M/S,
Faithline 1,500
9 9 Wara Dam Kainji 2,000 2,000 200 200 10 Rice, wheat 2020M/S, 95M/S 200 10 10 Kware Rima R. 800 800 300 120 15 2020M/S, 95M/S 800 11 11 Kalmalo Pump Natural
Lake 800 800 400 230 29 2020M/S, 95M/S 800
12 12 Gafara Dam Kainji 500 500 150 150 30 2020M/S, 95M/S 500 Sub-total Jibiya 7,500 5,600 2,250 1,800 24 3,800 Total 51,300 40,930 30,238 14,188 28 39,130
SN
No.
HA
On-
goin
g
Reh
abil
i-
tatio
n
Exp
ansi
on
Project Name State
Lon
gitu
de
Eas
t
Lat
itud
e N
orth
River SHA Agency
13 1 2 Kontagora Niger 4.74271 10.00910 Kontagora 218 UNRBDA14 2 2 Omu-Aran Kwara 5.09142 8.11812 Areja 209 UNRBDA 15 3 2 Tada Shonga Kwara 5.16253 9.07954 Niger 209 UNRBDA16 4 2 Kpada Kwara 6.10515 8.61126 Kampe 20401 UNRBDA17 5 2 ○ Kampe/Omi Kogi 5.66320 8.25268 Kampe 20401 UNRBDA 18 6 2 Ikale Kwara 6.04446 8.59783 Kampe 20401 UNRBDA19 7 2 Oke Oyi Kwara 4.77037 8.61897 Oshin 209 LNRBDA20 8 2 Oloru Kwara 4.57321 8.65264 Awun 212 LNRBDA 21 9 2 Gerinyan Kogi 6.72473 8.24065 Gurara 20201 LNRBDA22 10 2 Oro-Ago Kwara 5.20395 8.33839 Oro 209 LNRBDA23 11 2 R Tungan Kowa Niger 6.09618 9.66456 Ubandawaki 20805 LNRBDA 24 12 2 Duro-Gakpan Kwara 6.16621 8.71231 Niger 207 LNRBDA25 13 2 R Agaie/ Lapai Niger 6.29707 9.01396 Gbako 206 UNRBDA 26 14 2 Adorun Kogi Oweh 20401 LNRBDA
Sub-total 27 15 2 ○ Duku-Lade Kwara 5.62888 8.78878 Duke 209 MANR28 16 2 Rabba Niger 5.05775 9.19502 Niger 209 MANR 29 17 2 Guzan Niger 5.73551 9.28297 Yiko 20801 MANR30 18 2 R E Kangimi Kaduna 7.58661 10.62797 Kano 20813 MANR31 19 2 E E.Lapai Niger 6.56830 9.20140 Estan 206 MANR

The Project for Review and Update of Nigeria National Water Resources Master Plan
Volume-5, SR5 (SR5-68)
Table SR5.2-4 Existing Large Scale Irrigation Project (HA-2) (2/2)
32 20 2 E Bakogi Niger 6.15492 8.85605 Bakogi 206 MANR 33 21 2 Bagoma Niger 6.51539 10.64066 Kusheriki 20804 MANR34 22 2 Zara Niger 6.39019 10.50190 Zara 20804 MANR35 23 2 Tubo Kaduna 7.44529 10.96279 Tubo 20812 MANR 36 24 2 E Galma Kaduna 7.74056 11.07472 Galma 20814 MANR37 25 2 Manta Niger 6.42407 9.86577 Kaduna 20805 MANR38 26 2 R Badeggi Niger 6.10586 9.07567 Musa 206 NSADP 39 27 2 Otibe Kogi Okwo 201 MANR
Sub-total 40 28 2 Bacita Niger 4.96639 9.07718 Niger 209 NSC(private)
Sub-total Total
SN
No.
Project Name
Wat
er S
ourc
e W
orks
Name of
Source
Irrigation Area (ha)
Irrigation Service Area
(ha)
Remarks Source
Fut
ure
Irri
gati
on A
rea
in 2
030
(ha)
Pla
nned
Are
a
Are
a w
ith
Rel
iabl
e W
ater
S
uppl
y (*
1)
Sys
tem
D
evel
oped
Ser
vice
Are
a
Inte
nsity
(%
)
13 1 Kontagora Dam Kontagora (Auna)
2,000 2,000 250 250 13 UNRF, 2020M/S 2,000
14 2 Omu-Aran Dam Omu-Aran 1,300 0 400 230 18 vegetable 2020M/S, 95M/S 0 15 3 Tada Shonga Pump Niger R. 4,100 4,100 435 435 11 2020M/S,
ROPISIN 4,100
16 4 Kpada Kampe R. 1,500 1,500 150 150 10 95M/S 150 17 5 Kampe/Omi Dam Omi 4,000 4,000 1,000 1,000 25 vegetable, maize,
cowpea UNRF, ROPISIN 4,000
18 6 Ikale Intake Kampe R. 2,700 2,700 420 420 16 2020M/S, Faithline
420
19 7 Oke Oyi Weir NF 500 60 100 25 5 vegetable. maize, corpea
UNFR, ROPISIN 60
20 8 Oloru Weir NF 500 0 20 0 0 UNFR, ROPISIN 0 21 9 Gerinyan Pump Gurura R. 2,000 2,000 400 400 20 vegetable, maize,
tobacco UNFR, ROPISIN 400
22 10 Oro-Ago Pump NF 500 10 80 80 16 2020M/S, 95M/S 10 23 11 Tungan Kowa Dam Tungan
Kowa 800 800 800 400 50 2020M/S, 95M/S 800
24 12 Duro-Gakpan Pump Niger R. 500 500 90 90 18 95M/S 90 25 13 Agaie/ Lapai NF 1,000 1,000 20 20 2 UNRF 1,000 26 14 Adorun Intake NF 500 80 80 80 16 2020M/S-Annex4 80 Sub-total 21,900 18,750 4,245 3,580 16 13,110
27 15 Duku-Lade Weir NF 2,000 1,200 200 50 3 UNRF, 2020M/S, 1,200 28 16 Rabba Pump Niger R. 2,000 2,000 110 110 6 rice 2020M/S, 95M/S 110 29 17 Guzan NF 1,500 0 400 400 27 rice 2020M/S, 95M/S 0 30 18 Kangimi Dam Kangimi 1,600 1,600 1,200 120 8 wheat, maize,
tomato 2020M/S, 95M/S 1,600
31 19 E.Lapai Dam Bakajeba 2,000 2,000 100 100 5 rice 2020M/S, 95M/S 2,000 32 20 Bakogi Pump NF 2,000 2,000 100 100 5 2020M/S, 95M/S 2,000 33 21 Bagoma Dam Bagoma 500 500 50 50 10 95M/S 500 34 22 Zara Pump NF 500 0 50 50 10 95M/S 0 35 23 Tubo Dam Kerawa 620 600 100 100 16 wheat, vegetable 2020M/S, 95M/S 600 36 24 Galma Pump Galma R 610 610 55 55 9 rice, wheat,
vegetable, maiz 2020M/S 610
37 25 Manta Pump Kaduna R. 500 0 300 300 60 95M/S 0 38 26 Badeggi Pump NF 830 830 830 830 100 rice 2020M/S, 95M/S 830 39 27 Otibe Pump NF 1,000 3 3 3 0 vegetable, maize 2020M/S-Annex4 3 Sub-total 15,660 11,343 3,498 2,268 14 9,453
40 28 Bacita Pump Niger R. 9,000 9,000 5,600 0 0 Private Sugar company
ROPISIN, 95M/S 9,000
Sub-total Dam Kontagora (Auna)
9,000 9,000 5,600 0 0 9,000
Total Dam Omu-Aran 46,560 39,093 13,343 5,848 13 31,563

The Project for Review and Update of Nigeria National Water Resources Master Plan
Volume-5, SR5 (SR5-69)
Table SR5.2-5 Existing Large Scale Irrigation Project (HA-3) (1/2)
Table SR5.2-5 Existing Large Scale Irrigation Project (HA-3) (2/2)
SN
No.
HA
On-
goin
g
Reh
abil
i-
tatio
n
Exp
ansi
on
Project Name State
Lon
gitu
de
Eas
t
Lat
itud
e N
orth
River SHA Agency
41 1 3 R Lake Geriyo Adamawa 12.43901 9.29489 Benue 317 UBRBDA 42 2 3 Ngalda Yobe 11.37291 11.09015 Gongola 31409 CBDA43 3 3 ○ E Dadin Kowa Gombe 11.50922 10.28757 Gongola 31405 UBRBDA44 4 3 ○ E Lower Taraba (Gassol) Taraba 10.41873 8.56283 Taraba 30601 UBRBDA
45 5 3 Kushimaga Borno 11.77152 10.25149 Gongola 31405 UBRBDA46 6 3 Gari Abdullahi Yobe 11.53307 10.91496 Gongola 31407 UBRBDA 47 7 3 Wase Plateau 9.95512 9.10821 Wase 304 LBRBDA48 8 3 ○ E Chouchi Adamawa 12.54112 9.21993 Benue 317 UBRBDA49 9 3 Gora Borno Gongola 31405 CBDA 50 10 3 Bagal Bauchi 9.78133 9.98581 Bagal 31409 UBRBDA
Sub-total 51 11 3 R Balanga Gombe 11.59497 9.94130 Balonga 31405 MANR 52 12 3 Kaititingo Bauchi 11.33712 9.84249 kaltungo 31405 MANR Sub-total 53 13 3 Savannah Sugar Adamawa 11.95182 9.62440 Gongola 311 SSC(Private54 14 3 Savannah Integrated Farm Gombe Gongola 31405 SIF(Private) Sub-total Total
SN
No.
Project Name
Wat
er S
ourc
e W
orks
Name of
Source
Irrigation Area (ha)
Irrigation Service Area
(ha)
Remarks Source
Fut
ure
Irri
gati
on A
rea
in
2030
(ha
)
Pla
nned
Are
a
Are
a w
ith
Rel
iabl
e W
ater
S
uppl
y (*
1)
Sys
tem
D
evel
oped
Ser
vice
Are
a
Inte
nsity
(%
)
41 1 Lake Geriyo Pump Benue R. 4,000 4,000 320 320 8 Rice(150),vegetable, Maize
ROPISIN, UBRBDA
4,000
42 2 Ngalda Pump NF 500 500 200 30 6 Wheat, Vegetable Inventory, Faithline
200
43 3 Dadin Kowa Dam DadinKowa 6,660 6,660 250 70 1 rice, vegetable, maize
ROPISIN, UBRBDA
6,660
44 4 Lower Taraba (Gassol)
Pump Taraba R. 3,000 3,000 30 3 0 vegetable UNRF, UBRBDA
3,000
45 5 Kushimaga Pump Gongola R. 500 500 200 200 40 95M/S 200 46 6 Gari
Abdullahi Pump Gongola R. 750 750 0 0 0 2020M/S, 95M/S 0
47 7 Wase Pump Gongola R. 500 90 100 0 0 vegetable, maize 2020M/S, 95M/S 90 48 8 Chouchi Pump Benue R. 1,200 1,200 0 0 0 Under construction ROPISIN, DID 1,200 49 9 Gora Pump Gongola R. 2,000 2,000 50 50 3 rice Inventory 50 50 10 Bagal Pump NF 5,700 760 10 10 0 2020M/S-Annex4 10
Sub-total 24,810 19,460 1,160 683 3 15,410 51 11 Balanga Dam Balanga 4,400 3,800 500 100 2 rice, okura,
vegetable ROPISIN 3,800
52 12 Kaititingo NF 2,300 0 0 0 0 2020M/S-Annex4 0 Sub-total 6,700 3,800 500 100 1 3,800 53 13 Savannah
Sugar Dam Kiri 12,200 12,200 7,000 500 4 sugar cane ROPISIN 12,200
54 14 Savannah Integrated Farm
Pump Gongola R. 4,000 4,000 109 109 3 Private company ROPISIN 4,000
Sub-total 16,200 16,200 7,109 609 4 16,200 Total 47,710 39,460 8,769 1,392 3 35,410

The Project for Review and Update of Nigeria National Water Resources Master Plan
Volume-5, SR5 (SR5-70)
Table SR5.2-6 Existing Large Scale Irrigation Project (HA-4) (1/2)
Table SR5.2-6 Existing Large Scale Irrigation Project (HA-4) (2/2)
SN
No.
HA
On-
goin
g
Reh
abil
i-
tatio
n
Exp
ansi
on
Project Name State
Lon
gitu
de
Eas
t
Lat
itud
e N
orth
River SHA Agency
55 1 4 Obagaji Benue Benue 407 LBRBDA 56 2 4 Shendam(1) Plateau 9.53020 8.88567 410 LBRBDA57 3 4 ○ R Longkat Plateau 9.36357 9.14690 Shemankar 410 LBRBDA58 4 4 R E Dep Nasarawa 8.95781 8.62384 Dep 408 LBRBDA
59 5 4 R E Katsina-Ala Benue 9.29313 7.12941 Katsina-Ala 406_i LBRBDA60 6 4 R E Makurdi Benue 8.64787 7.71592 Benue 405 LBRBDA61 7 4 E Doma Nasarawa 8.29273 8.36183 Doma 404 LBRBDA 62 8 4 E Awe Nasarawa 9.12771 8.10529 407 LBRBDA63 9 4 Umogidi Benue 7.97974 7.44722 Ogabakpa 405 LBRBDA64 10 4 E Oguma Kogi 7.05580 7.90464 Nyimowa-Iteme 401 LBRBDA 65 11 4 E Jato-Aka Benue 9.61047 6.88722 Katsina-Ala 406_i LBRBDA66 12 4 Bokkos Plateau 8.97962 9.32152 Bokkos 408 LBRBDA67 13 4 Wuse Nasarawa 9.31127 8.35523 Dep 408 LBRBDA 68 14 4 Kiroki Benue Oyimora 405 LBRBDA Sub-total 69 15 4 Adi Benue 9.25383 7.19089 Katsina-Ala 406_i MANR Sub-total Total
SN
No.
Project Name
Wat
er S
ourc
e W
orks
Name of
Source
Irrigation Area (ha)
Irrigation Service Area
(ha)
Remarks Source
Fut
ure
Irri
gati
on A
rea
in
2030
(ha
)
Pla
nned
Are
a
Are
a w
ith
Rel
iabl
e W
ater
S
uppl
y (*
1)
Sys
tem
D
evel
oped
Ser
vice
Are
a
Inte
nsity
(%
)
55 1 Obagaji Pump Benue R. 1,000 1,000 500 500 50 2020F/S, 95M/S
500
56 2 Shendam(1) Dam Shendam 1,000 1,000 500 500 50 95M/S 1,000 57 3 Longkat Pump Pankisin 2,000 1,100 800 800 40 rice, tomato, pepper ROPISIN,
Faithline 1,100
58 4 Dep Pump NF 2,000 2,000 300 100 5 rice,maize,vegetable,sugar
UNRF, ROPISIN
2,000
59 5 Katsina-Ala Pump Katsina-Ala R.
2,000 2,000 200 3 0 hot pepper, maize,okura 2020M/S, ROPISIN:
2,000
60 6 Makurdi Pump Benue R. 1,000 1,000 200 0 0 rice, vegetable, maize 2020M/S, ROPISIN
1,000
61 7 Doma Dam Doma 2,037 2,037 1,600 0 0 Melon, okura ROPISIN 2,037 62 8 Awe Pump NF 500 80 0 0 0 Faithline 110 63 9 Umogidi Dam Umogodi 1,500 580 0 0 0 95M/S,
Fauthline 0
64 10 Oguma Pump NF 1,000 1,000 100 100 10 rice,vegetable,sugar cane
ROPISIN 1,000
65 11 Jato-Aka Pump Katsina-Ala R.
1,000 1,000 20 0 0 Flood, deterioration ROPISIN 1,000
66 12 Bokkos Dam Bokkos(2) 1,000 360 18 18 2 poteto, vegetable UNRF, ROPISIN
18
67 13 Wuse Pump NF 1,000 1,000 50 50 5 Faithline 50 68 14 Kiroki Pump NF 1,000 15 15 15 2 rice, vegetable, sugar
cane 2020M/S-Annex4
15
Sub-total 18,037 14,172 4,303 2,086 12 11,800 69 15 Adi Pump Katsina-Ala
. R 1,000 1,000 24 24 2 rice, vegetable, maize 2020M/S-An
nex4 24
Sub-total 1,000 1,000 24 24 2 24 Total 19,037 15,172 4,327 2,110 11 11,824

The Project for Review and Update of Nigeria National Water Resources Master Plan
Volume-5, SR5 (SR5-71)
Table SR5.2-7 Existing Large Scale Irrigation Project (HA-5) (1/2)
Table SR5.2-7 Existing Large Scale Irrigation Project (HA-5) (2/2)
SN
No.
HA
On-
goin
g
Reh
abil
i-
tatio
n
Exp
ansi
on
Project Name State
Lon
gitu
de
Eas
t
Lat
itud
e N
orth
River SHA Agency
70 1 5 ○ R Lower Anambra Anambra 6.98647 6.51946 Anambra 50402 AIRBDA 71 2 5 Ewu Delta 6.25511 5.23819 Forcados 500 NDBDA72 3 5 Adoru Kogi 7.14490 6.99972 Oweh 50402 LBRBDA73 4 5 E Ilush-Ega Edo 6.63080 6.65990 Niger 50403 BORBDA
74 5 5 ○ E Isampou Rice Delta 5.86888 5.05052 Bomadi 500 NDBDA75 6 5 ○ R Peremabiri Rice Bayelsa 6.09887 4.63576 Nun 500 NDBDA76 7 5 ○ E Kolo Rice Bayelsa 6.26613 4.86799 Orashi 500 NDBDA 77 8 5 ○ E Ejule Ojebe Kogi 7.01792 7.36571 Ota Lake 50402 LBRBDA78 9 5 Ofarachi Kogi 6.88333 7.10000 Ofu Imabolo 50402 LBRBDA79 10 5 Illahi Ebuh Delta 6.66701 6.45086 Niger 50403 BORBDA 80 11 5 ○ R E Ada-Rice Enugu 7.03273 6.71501 50402 AIRBDA Sub-total 81 12 5 Uzo Uwani Enugu 7.03670 6.69972 Obina 50402 MANR Sub-total Total
SN
No.
Project Name
Wat
er S
ourc
e W
orks
Name of
Source
Irrigation Area (ha)
Irrigation Service Area
(ha)
Remarks Source
Fut
ure
Irri
gati
on A
rea
in
2030
(ha
)
Pla
nned
Are
a
Are
a w
ith
Rel
iabl
e W
ater
S
uppl
y (*
1)
Sys
tem
D
evel
oped
Ser
vice
Are
a
Inte
nsity
(%
) 70 1 Lower
Anambra Pump NF 5,000 5,000 3,850 0 0 rice ROPISIN 5,000
71 2 Ewu Pump Niger R. 1,500 1,500 100 100 7 rice, vegetable 95M/S 100 72 3 Adoru Intake NF 500 500 100 80 16 95M/S 100 73 4 Ilush-Ega Pump Niger R. 5,000 5,000 3,000 300 6 rice 2020M/S,
ROPISIN 5,000
74 5 Isampou Rice
Pump Niger R. 1,280 1,280 110 70 5 rice UNRF, POPISIN,
1,280
75 6 Peremabiri Rice
Pump Niger R. 1,280 1,280 348 26 2 rice 2020M/S, POPISIN
1,280
76 7 Kolo Rice Pump Niger R. 1,300 1,300 140 140 11 rice UNRF, POPISIN
1,300
77 8 Ejule Ojebe Pump NF 2,000 1,100 25 0 0 rice,okura,maize UNRF, ROPISIN
1,100
78 9 Ofarachi Pump NF 1,000 520 10 0 0 maize, spinach, okura ROPISIN 10 79 10 Illahi Ebuh Pump Niger R. 3,000 3,000 100 0 0 yam,cassava,poteto UNRF,
ROPISIN 100
80 11 Ada-Rice Weir NF 5,000 1,000 1,000 1,000 20 rice DID 1,000 Sub-total 26,860 21,480 8,783 1,716 67 16,270 81 12 Uzo Uwani Weir NF 1,000 50 315 315 32 rice 2020M/S 50 Sub-total 1,000 50 315 315 32 50
Total 27,860 21,530 9,098 2,031 7 16,320

The Project for Review and Update of Nigeria National Water Resources Master Plan
Volume-5, SR5 (SR5-72)
Table SR5.2-8 Existing Large Scale Irrigation Project (HA-6) (1/2)
Table SR5.2-8 Existing Large Scale Irrigation Project (HA-6) (2/2)
SN
No.
HA
On-
goin
g
Reh
abil
i-
tatio
n
Exp
ansi
on
Project Name State
Lon
gitu
de
Eas
t
Lat
itud
e N
orth
River SHA Agency
82 1 6 Upper Ogun Oyo 3.30205 8.21856 Ofiki 604023_i OORBDA 83 2 6 Ofiki(A) Oyo 3.33872 8.46834 Ofiki 604023_i OORBDA84 3 6 ○ E Middle Ogun (I.G) Oyo 3.72541 7.85447 Ogun 60403 OORBDA85 4 6 Sepeteri(A) Oyo 3.65260 8.57964 Owutu 60405 OORBDA 86 5 6
○ E Lower Ogun (Mokoloki)
Ogun 3.34892 6.92784 Ogun 60401 OORBDA
87 6 6 E Iwo Osun 4.16447 7.74451 Orufu 608 OORBDA 88 7 6 E Ilero Oyo 3.32113 8.01052 604023_i OORBDA89 8 6 Otta Ogun 3.23946 6.65463 Ore 603 OORBDA90 9 6 Eyinwa Ogun 3.80940 6.79970 Ondo 606 OORBDA 91 10 6 Oke-Odan Ogun 2.90442 6.72066 Yelwa 602_i OORBDA92 11 6 R E Asa Oyo 4.19306 8.16333 Oba 608 OORBDA93 12 6 R E Okuku Osun 4.67570 7.99350 608 OORBDA 94 13 6 Igbonla Lagos 4.05585 6.63502 Osun 608 OORBDA95 14 6 E Owena Ondo 4.99806 7.29811 Owena 612 BORBDA96 15 6 Oye Ekiti 5.34462 7.77780 614 BORBDA Sub-total
97 16 6 R E Esa Odo Dam Osun 4.81272 7.74642 608 MANR98 17 6 R E New Erinle Osun 4.52171 7.85328 608 MANR Sub-total Total
SN
No.
Project Name
Wat
er S
ourc
e W
orks
Name of
Source
Irrigation Area (ha)
Irrigation Service Area
(ha)
Remarks Source
Fut
ure
Irri
gati
on A
rea
in
2030
(ha
)
Pla
nned
Are
a
Are
a w
ith
Rel
iabl
e W
ater
S
uppl
y (*
1)
Sys
tem
D
evel
oped
Ser
vice
Are
a
Inte
nsity
(%
)
82 1 Upper Ogun Dam Igbojaye 2,000 600 10 5 0
OORBDA, 2020M/S
10
83 2 Ofiki(A) Dam Ofiki(A) 2,000 60 24 24 1 yam,maize,cassava OORBDA 24 84 3 Middle Ogun
(I.G) Pump Ogun R. 12,000 12,000 750 520 4 Under construction
OORBDA, UNRF
12,000
85 4 Sepeteri(A) Dam Sepeteri(A) 2,000 30 80 80 4 yam,maize,cassava
OORBDA, UNRF
30
86 5 Lower Ogun (Mokoloki)
Dam Oyan 12,000 12,000 500 200 2 maize,water melon,cucumber
OORBDA, UNRF
12,000
87 6 Iwo Wier NF 1,000 0 0 0 0 OORBDA 0 88 7 Ilero Dam Okeho 2,000 70 0 0 0 OORBDA 70 89 8 Otta Pump NF 1,000 0 340 300 30 2020M/S 0 90 9 Eyinwa Intake NF 1,000 10 300 300 30 2020M/S 10 91 10
Oke-Odan Dam Oke-Odan 600 400 250 59 10 maize, cassava 2020M/S, ROPISIN
250
92 11 Asa Dam Oba 500 500 0 0 0 OORBDA 500 93 12 Okuku Dam Okuku 600 30 0 0 0 OORBDA 30 94 13
Igbonla Intake Osun R. 1,000 130 130 0 0 rice OORBDA, 2020M/S
130
95 14 Owena Dam
Owena Multipurpo
se 500 500 500 0 0
Inventry, 95M/S, BORBDA
500
96 15 Oye NF 500 0 100 100 20 UNRF 0 Sub-total 38,700 26,330 2,984 1,588 4 25,554 97 16 Esa Odo Dam Dam Esa-Odo 800 800 800 0 0 2020M/S 800 98 17 New Erinle Dam Erinle 500 500 500 0 0 2020M/S 500 Sub-total 1,300 1,300 1,300 0 0 1,300
Total 40,000 27,630 4,284 1,588 4 26,854

The Project for Review and Update of Nigeria National Water Resources Master Plan
Volume-5, SR5 (SR5-73)
Table SR5.2-9 Existing Large Scale Irrigation Project (HA-7) (1/2)
Table SR5.2-9 Existing Large Scale Irrigation Project (HA-7) (2/2)
SN
No.
HA
On-
goin
g
Reh
abil
i-
tatio
n
Exp
ansi
on
Project Name State
Lon
gitu
de
Eas
t
Lat
itud
e N
orth
River SHA Agency
99 1 7 Nkari Akwa Ibom 7.76340 5.39992 Quaiboe 70401 CRBDA 100 2 7 Ijegu Yala Cross River 8.69115 6.77246 Okupuka 704042 CRBDA101 3 7 ○ Abakaliki/ Iwa Ebonyi 8.13925 6.32519 70403 CRBDA102 4 7 ○ R E Imo (Igwu and Ibu) Imo 7.28360 5.78011 Ibu, Imo, Igwu 702 AIRBDA
103 5 7 Itu Cross River 7.96650 5.21643 Cross 70401 CRBDA104 6 7 Bausara Cross River 8.55503 6.45474 704042 CRBDA105 7 7 Isi-Uzo Enugu 7.72541 6.75080 Evonyi 70402 AIRBDA 106 8 7 Itogodi Cross River 705 CRBDA
Sub-total 107 9 7 E Igbere Abia 7.68882 5.65215 Igwu 70401 MANR 108 10 7 R Ekoi Akwa Ibom 7.73864 5.41865 Enyang 70401 MANR109 11 7 R Adim Rice Cross River 8.03971 5.73041 stream 70401 MANR110 12 7 Idomi Cross River 8.10910 5.75634 stream 70401 MANR 111 13 7 Ukum Cross River 8.65743 6.52613 Aya 704042 MANR112 14 7 Ofodun Cross River 8.22112 5.94336 stream 70403 MANR113 15 7 R E Mbiabet Akwa Ibom 7.96517 5.25826 Cross 70401 MANR
Sub-total Total
SN
No.
Project Name
Wat
er S
ourc
e W
orks
Name of
Source
Irrigation Area (ha)
Irrigation Service Area
(ha)
Remarks Source
Fut
ure
Irri
gati
on A
rea
in
2030
(ha
)
Pla
nned
Are
a
Are
a w
ith
Rel
iabl
e W
ater
S
uppl
y (*
1)
Sys
tem
D
evel
oped
Ser
vice
Are
a
Inte
nsity
(%
)
99 1 Nkari Dam Nkari 2,080 610 0 0 0 Faithline 0 100 2 Ijegu Yala NF 2,000 910 80 80 4 Inventry, ROPISIN 80 101 3 Abakaliki/
Iwa NF 1,000 1,000 1,000 1,000 100 rice UNRF 1,000
102 4 Imo (Igwu and Ibu)
Pump Lokpanta 1,200 0 80 80 7 rice,maize,tam,cassava
UNRF, ROPISIN 0
103 5 Itu Cross R. 1,265 1,265 100 100 8 rice, vegetable, maize Inventry, UNRF 100 104 6 Bausara NF 2,000 2,000 0 0 0 rice UNRF 0 105 7 Isi-Uzo Pump NF 500 360 71 25 5 UNRF, ROPISIN 71 106 8 Itogodi NF 500 0 0 0 0 rice UNRF 0
Sub-total 10,545 6,145 1,331 1,285 12 1,251 107 9 Igbere NF 1,300 440 250 50 4 rice 2020M/S,Faithline 440 108 10 Ekoi Pump NF 500 500 80 30 6 2020M/S, 95M/S 500 109 11 Adim
Rice Weir NF 1,000 340 545 545 55 rice 2020M/S.
Faithline 340
110 12 Idomi NF 1,000 530 100 100 10 rice 2020M/S, Faithline
100
111 13 Ukum NF 1,000 1,000 0 0 0 rice 2020M/S-Annex4 0 112 14 Ofodun Pump NF 800 800 0 0 0 rice 2020M/S-Annex4 0 113 15 Mbiabet Pump Cross R. 500 500 100 100 20 rice, vegetable, maize 2020M/S, 95M/S 500 Sub-total 6,100 4,110 1,075 825 94 1,880
Total 16,645 10,255 2,406 2,110 13 3,131
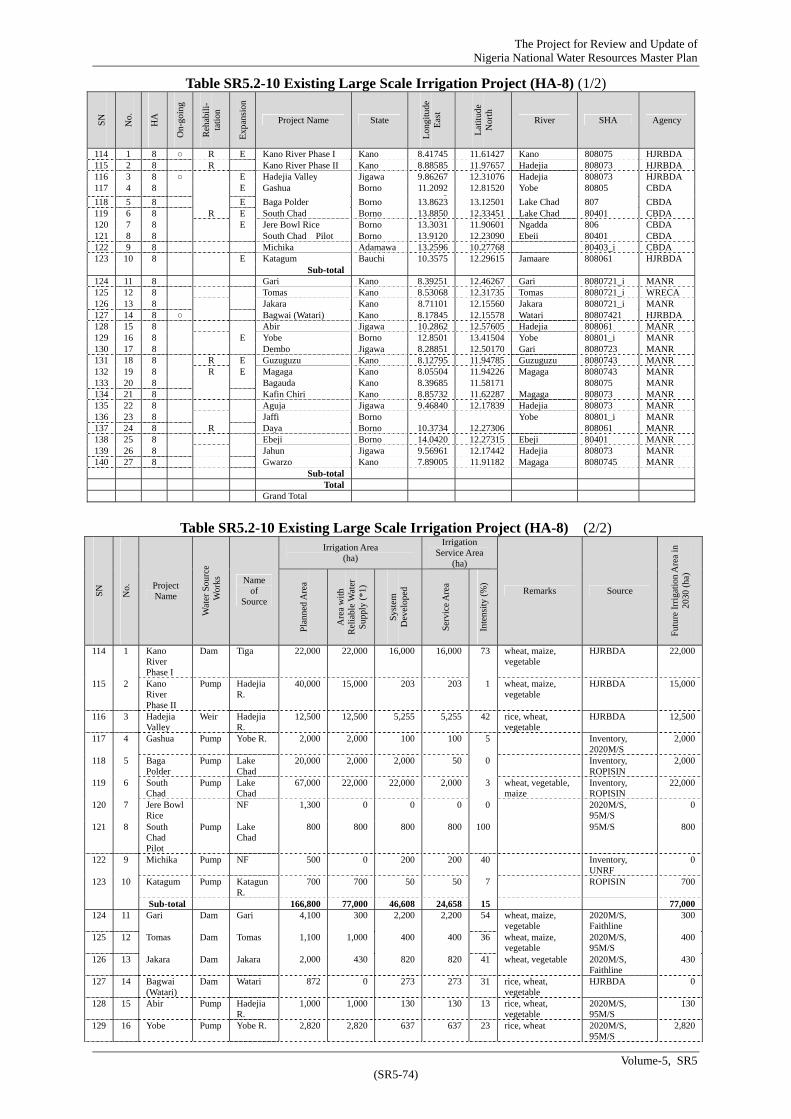
The Project for Review and Update of Nigeria National Water Resources Master Plan
Volume-5, SR5 (SR5-74)
Table SR5.2-10 Existing Large Scale Irrigation Project (HA-8) (1/2)
Table SR5.2-10 Existing Large Scale Irrigation Project (HA-8) (2/2)
SN
No.
HA
On-
goin
g
Reh
abil
i-
tatio
n
Exp
ansi
on
Project Name State
Lon
gitu
de
Eas
t
Lat
itud
e N
orth
River SHA Agency
114 1 8 ○ R E Kano River Phase I Kano 8.41745 11.61427 Kano 808075 HJRBDA 115 2 8 R Kano River Phase II Kano 8.88585 11.97657 Hadejia 808073 HJRBDA116 3 8 ○ E Hadejia Valley Jigawa 9.86267 12.31076 Hadejia 808073 HJRBDA117 4 8 E Gashua Borno 11.2092
212.81520 Yobe 80805 CBDA
118 5 8 E Baga Polder Borno 13.8623 13.12501 Lake Chad 807 CBDA119 6 8 R E South Chad Borno 13.8850 12.33451 Lake Chad 80401 CBDA120 7 8 E Jere Bowl Rice Borno 13.3031 11.90601 Ngadda 806 CBDA 121 8 8 South Chad Pilot Borno 13.9120 12.23090 Ebeii 80401 CBDA122 9 8 Michika Adamawa 13.2596 10.27768 80403_i CBDA123 10 8 E Katagum Bauchi 10.3575 12.29615 Jamaare 808061 HJRBDA Sub-total 124 11 8 Gari Kano 8.39251 12.46267 Gari 8080721_i MANR125 12 8 Tomas Kano 8.53068 12.31735 Tomas 8080721_i WRECA 126 13 8 Jakara Kano 8.71101 12.15560 Jakara 8080721_i MANR127 14 8 ○ Bagwai (Watari) Kano 8.17845 12.15578 Watari 80807421 HJRBDA128 15 8 Abir Jigawa 10.2862 12.57605 Hadejia 808061 MANR 129 16 8 E Yobe Borno 12.8501 13.41504 Yobe 80801_i MANR130 17 8 Dembo Jigawa 8.28851 12.50170 Gari 8080723 MANR131 18 8 R E Guzuguzu Kano 8.12795 11.94785 Guzuguzu 8080743 MANR 132 19 8 R E Magaga Kano 8.05504 11.94226 Magaga 8080743 MANR133 20 8 Bagauda Kano 8.39685 11.58171 808075 MANR134 21 8 Kafin Chiri Kano 8.85732 11.62287 Magaga 808073 MANR 135 22 8 Aguja Jigawa 9.46840 12.17839 Hadejia 808073 MANR136 23 8 Jaffi Borno Yobe 80801_i MANR137 24 8 R Daya Borno 10.3734 12.27306 808061 MANR 138 25 8 Ebeji Borno 14.0420 12.27315 Ebeji 80401 MANR139 26 8 Jahun Jigawa 9.56961 12.17442 Hadejia 808073 MANR140 27 8 Gwarzo Kano 7.89005 11.91182 Magaga 8080745 MANR
Sub-total Total Grand Total
SN
No.
Project Name
Wat
er S
ourc
e W
orks
Name of
Source
Irrigation Area (ha)
Irrigation Service Area
(ha)
Remarks Source
Fut
ure
Irri
gati
on A
rea
in
2030
(ha
)
Pla
nned
Are
a
Are
a w
ith
Rel
iabl
e W
ater
S
uppl
y (*
1)
Sys
tem
D
evel
oped
Ser
vice
Are
a
Inte
nsity
(%
)
114 1 Kano River Phase I
Dam Tiga 22,000 22,000 16,000 16,000 73 wheat, maize, vegetable
HJRBDA 22,000
115 2 Kano River Phase II
Pump Hadejia R.
40,000 15,000 203 203 1 wheat, maize, vegetable
HJRBDA 15,000
116 3 Hadejia Valley
Weir Hadejia R.
12,500 12,500 5,255 5,255 42 rice, wheat, vegetable
HJRBDA 12,500
117 4 Gashua Pump Yobe R. 2,000 2,000 100 100 5 Inventory, 2020M/S
2,000
118 5 Baga Polder
Pump Lake Chad
20,000 2,000 2,000 50 0 Inventory, ROPISIN
2,000
119 6 South Chad
Pump Lake Chad
67,000 22,000 22,000 2,000 3 wheat, vegetable, maize
Inventory, ROPISIN
22,000
120 7 Jere Bowl Rice
NF 1,300 0 0 0 0 2020M/S, 95M/S
0
121 8 South Chad Pilot
Pump Lake Chad
800 800 800 800 100 95M/S 800
122 9 Michika Pump NF 500 0 200 200 40 Inventory, UNRF
0
123 10 Katagum Pump Katagun R.
700 700 50 50 7 ROPISIN 700
Sub-total 166,800 77,000 46,608 24,658 15 77,000 124 11 Gari Dam Gari 4,100 300 2,200 2,200 54 wheat, maize,
vegetable 2020M/S, Faithline
300
125 12 Tomas Dam Tomas 1,100 1,000 400 400 36 wheat, maize, vegetable
2020M/S, 95M/S
400
126 13 Jakara Dam Jakara 2,000 430 820 820 41 wheat, vegetable 2020M/S, Faithline
430
127 14 Bagwai (Watari)
Dam Watari 872 0 273 273 31 rice, wheat, vegetable
HJRBDA 0
128 15 Abir Pump Hadejia R.
1,000 1,000 130 130 13 rice, wheat, vegetable
2020M/S, 95M/S
130
129 16 Yobe Pump Yobe R. 2,820 2,820 637 637 23 rice, wheat 2020M/S, 95M/S
2,820

The Project for Review and Update of Nigeria National Water Resources Master Plan
Volume-5, SR5 (SR5-75)
Sources:
95M/S: The Study on The National Water Resources Master Plan (NWRMP), JICA, March 1995 ROPISIN: Review of The Public Irrigation Sector In Nigeria (ROPISIN), ENPLAN DROUP, November 2004 Faithline: Inventory of Water Infrastructure Projects in Nigeria and Water Audit for Niger central Hydrological Basin
(Hydorological Area II), FAITHLINE LIMITED, November 2010 DID: HANDOVERNOTE May 2011, Department of Irrigation and Drainage, FMWR
HJRBDA: Breif on Hadejia Valley Irrigation Project, HIRBDA, December 2010 BORBDA: List of Dams and Irrigation Projects by Benin Owena RBDA, November 2011 UBRBDA: List of Irrigation Projects by Upper Benue RBDA, December 2011and May 2012 LBRBDA: Annual Report, Lower Benue RBDA, December 2009 NDRBDA: List of Irrigation Projects by Niger Delta RBDA, May 2012
2020M/S: Masterplan for Irrigation and Dam Development for 2009-2020, FMAWR UNFR: Utilization of Natural Resources Fund for Water Resources and Agricultural Development A jiont presentation
to the National Economic Council, FMWR/ FMARD Inventory : Inventry Survey and response from RBDA in this time Master Plan study
Indentified Irrigation Projects and Crops for Transformation Agwngda Priority Irrigation and Drainage Projects for Special Intervention Note: (*1) Evaluated by JICA Project Team with 1/5 Safety Level of Water Supply under the Assumed Cropping Pattern as well as
Water Use Condition in Other Purpose such as Municipal Water Supply in 2030
130 17 Dembo Dam Gari 700 0 60 60 9 95M/S 0 131 18 Guzuguzu Dam Guzugzu 530 0 530 0 0 2020M/S,
95M/S 0
132 19 Magaga Dam Magaga 600 70 300 100 17 rice, wheat, vegetable, maize
2020M/S, 95M/S
70
133 20 Bagauda Dam Bagauda 610 410 300 300 49 95M/S 300 134 21 Kafin
Chiri Dam Kafin
Chiri 600 200 0 0 0 2020M/S,
95M/S 0
135 22 Aguja Pump Hadejia R.
700 700 120 120 17 rice, wheat, vegetable
2020,M/S, 95M/S
120
136 23 Jaffi Pump Yobe R. 800 800 30 30 4 2020M/S, 95M/S
30
137 24 Daya Pump Yobe R. 960 960 960 400 42 95M/S 960 138 25 Ebeji Pump Lake
Chad 4,000 140 140 140 4 wheat 2020M/S-Anne
x4 140
139 26 Jahun Pump Hadejia R.
700 700 100 100 14 rice, wheat, vegetable
2020M/S-Annex4
100
140 27 Gwarzo Dam Pada 600 0 0 0 0 2020M/S-Annex4
0
Sub-total 22,692 9,530 7,000 5,710 25 5,800 Total 189,492 86,530 53,608 30,368 16 82,800
Grand Total
430,604 280,600 126,073 59,635 14 247,032
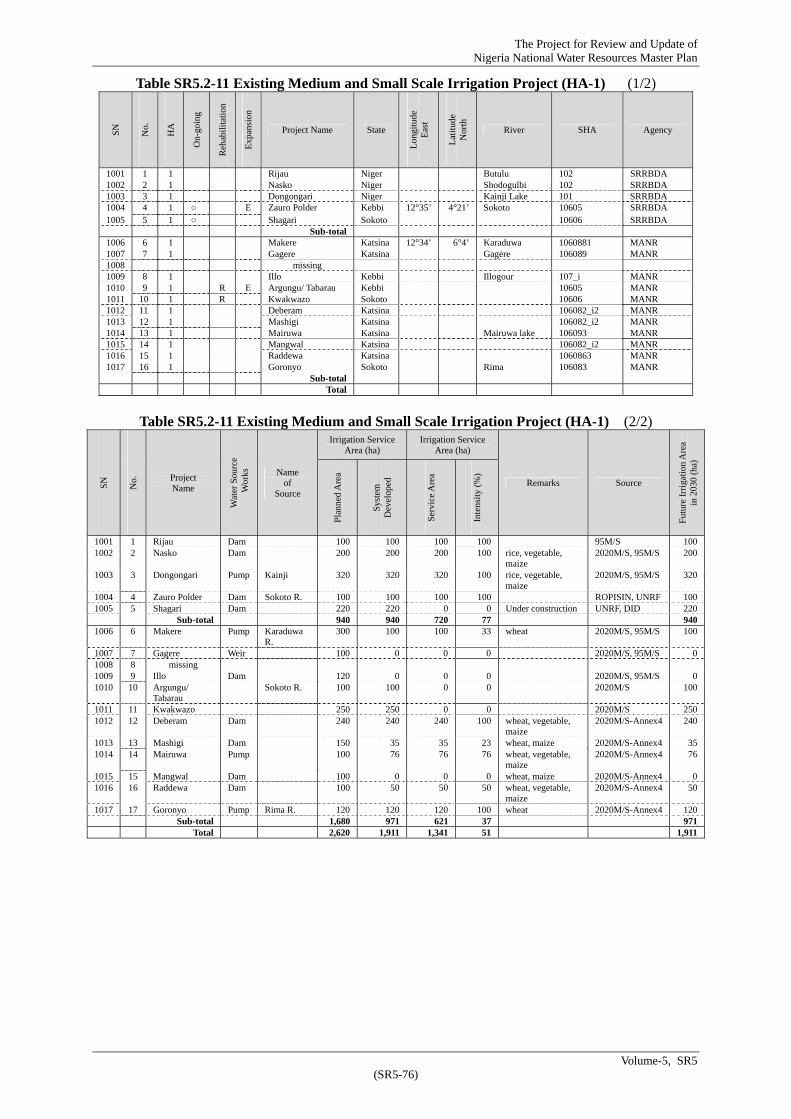
The Project for Review and Update of Nigeria National Water Resources Master Plan
Volume-5, SR5 (SR5-76)
Table SR5.2-11 Existing Medium and Small Scale Irrigation Project (HA-1) (1/2)
Table SR5.2-11 Existing Medium and Small Scale Irrigation Project (HA-1) (2/2)
SN
No.
HA
On-
goin
g
Reh
abil
itat
ion
Exp
ansi
on
Project Name State
Lon
gitu
de
Eas
t
Lat
itud
e N
orth
River SHA Agency
1001 1 1 Rijau Niger Butulu 102 SRRBDA 1002 2 1 Nasko Niger Shodogulbi 102 SRRBDA1003 3 1 Dongongari Niger Kainji Lake 101 SRRBDA1004 4 1 ○ E Zauro Polder Kebbi 12°35’ 4°21’ Sokoto 10605 SRRBDA 1005 5 1 ○ Shagari Sokoto 10606 SRRBDA
Sub-total 1006 6 1 Makere Katsina 12°34’ 6°4’ Karaduwa 1060881 MANR 1007 7 1 Gagere Katsina Gagere 106089 MANR1008 missing 1009 8 1 Illo Kebbi Illogour 107_i MANR 1010 9 1 R E Argungu/ Tabarau Kebbi 10605 MANR1011 10 1 R Kwakwazo Sokoto 10606 MANR1012 11 1 Deberam Katsina 106082_i2 MANR 1013 12 1 Mashigi Katsina 106082_i2 MANR1014 13 1 Mairuwa Katsina Mairuwa lake 106093 MANR1015 14 1 Mangwal Katsina 106082_i2 MANR 1016 15 1 Raddewa Katsina 1060863 MANR1017 16 1 Goronyo Sokoto Rima 106083 MANR
Sub-total Total
SN
No.
Project Name
Wat
er S
ourc
e W
orks
Name of
Source
Irrigation Service Area (ha)
Irrigation Service Area (ha)
Remarks Source
Fut
ure
Irri
gati
on A
rea
in 2
030
(ha)
Pla
nned
Are
a
Sys
tem
D
evel
oped
Ser
vice
Are
a
Inte
nsity
(%
)
1001 1 Rijau Dam 100 100 100 100 95M/S 100 1002 2 Nasko Dam 200 200 200 100 rice, vegetable,
maize 2020M/S, 95M/S 200
1003 3 Dongongari Pump Kainji 320 320 320 100 rice, vegetable, maize
2020M/S, 95M/S 320
1004 4 Zauro Polder Dam Sokoto R. 100 100 100 100 ROPISIN, UNRF 100 1005 5 Shagari Dam 220 220 0 0 Under construction UNRF, DID 220 Sub-total 940 940 720 77 940 1006 6 Makere Pump Karaduwa
R. 300 100 100 33 wheat 2020M/S, 95M/S 100
1007 7 Gagere Weir 100 0 0 0 2020M/S, 95M/S 0 1008 8 missing 1009 9 Illo Dam 120 0 0 0 2020M/S, 95M/S 0 1010 10 Argungu/
Tabarau Sokoto R. 100 100 0 0 2020M/S 100
1011 11 Kwakwazo 250 250 0 0 2020M/S 250 1012 12 Deberam Dam 240 240 240 100 wheat, vegetable,
maize 2020M/S-Annex4 240
1013 13 Mashigi Dam 150 35 35 23 wheat, maize 2020M/S-Annex4 351014 14 Mairuwa Pump 100 76 76 76 wheat, vegetable,
maize 2020M/S-Annex4 76
1015 15 Mangwal Dam 100 0 0 0 wheat, maize 2020M/S-Annex4 0 1016 16 Raddewa Dam 100 50 50 50 wheat, vegetable,
maize 2020M/S-Annex4 50
1017 17 Goronyo Pump Rima R. 120 120 120 100 wheat 2020M/S-Annex4 120 Sub-total 1,680 971 621 37 971
Total 2,620 1,911 1,341 51 1,911
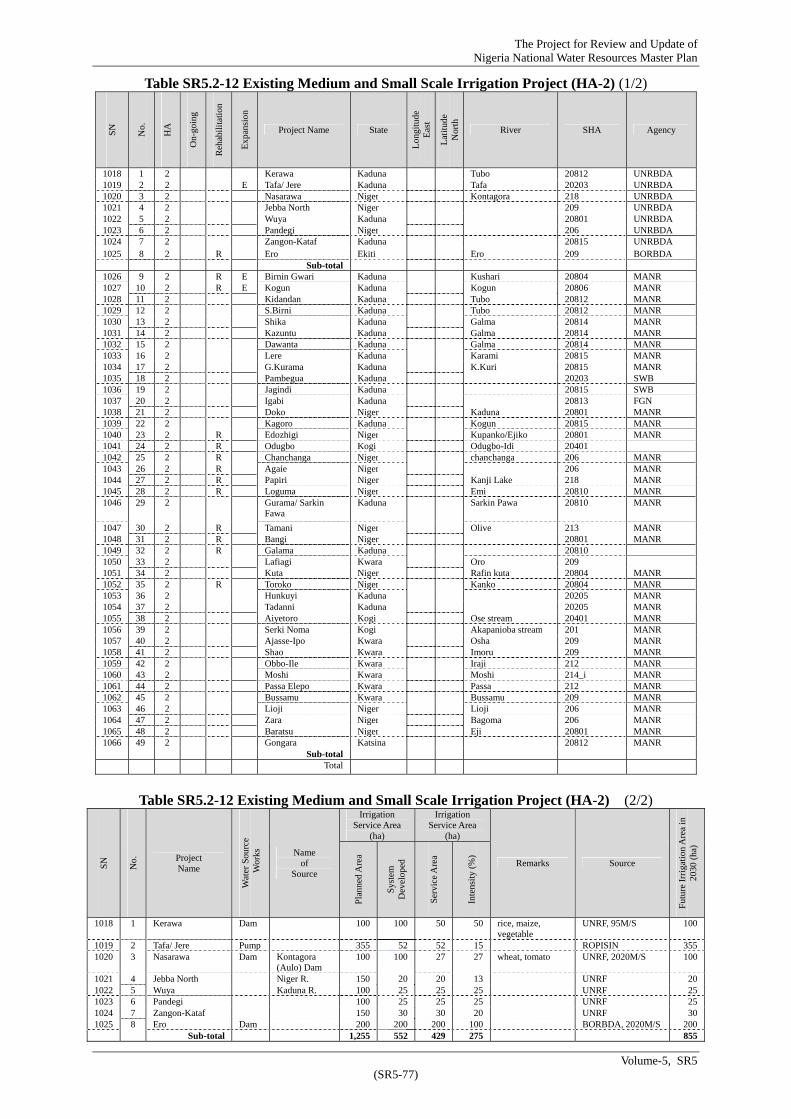
The Project for Review and Update of Nigeria National Water Resources Master Plan
Volume-5, SR5 (SR5-77)
Table SR5.2-12 Existing Medium and Small Scale Irrigation Project (HA-2) (1/2)
Table SR5.2-12 Existing Medium and Small Scale Irrigation Project (HA-2) (2/2)
SN
No.
HA
On-
goin
g
Reh
abil
itat
ion
Exp
ansi
on
Project Name State
Lon
gitu
de
Eas
t
Lat
itud
e N
orth
River SHA Agency
1018 1 2 Kerawa Kaduna Tubo 20812 UNRBDA 1019 2 2 E Tafa/ Jere Kaduna Tafa 20203 UNRBDA1020 3 2 Nasarawa Niger Kontagora 218 UNRBDA1021 4 2 Jebba North Niger 209 UNRBDA 1022 5 2 Wuya Kaduna 20801 UNRBDA1023 6 2 Pandegi Niger 206 UNRBDA1024 7 2 Zangon-Kataf Kaduna 20815 UNRBDA 1025 8 2 R Ero Ekiti Ero 209 BORBDA
Sub-total 1026 9 2 R E Birnin Gwari Kaduna Kushari 20804 MANR 1027 10 2 R E Kogun Kaduna Kogun 20806 MANR1028 11 2 Kidandan Kaduna Tubo 20812 MANR1029 12 2 S.Birni Kaduna Tubo 20812 MANR 1030 13 2 Shika Kaduna Galma 20814 MANR1031 14 2 Kazuntu Kaduna Galma 20814 MANR1032 15 2 Dawanta Kaduna Galma 20814 MANR 1033 16 2 Lere Kaduna Karami 20815 MANR1034 17 2 G.Kurama Kaduna K.Kuri 20815 MANR1035 18 2 Pambegua Kaduna 20203 SWB 1036 19 2 Jagindi Kaduna 20815 SWB 1037 20 2 Igabi Kaduna 20813 FGN 1038 21 2 Doko Niger Kaduna 20801 MANR 1039 22 2 Kagoro Kaduna Kogun 20815 MANR1040 23 2 R Edozhigi Niger Kupanko/Ejiko 20801 MANR1041 24 2 R Odugbo Kogi Odugbo-Idi 20401 1042 25 2 R Chanchanga Niger chanchanga 206 MANR1043 26 2 R Agaie Niger 206 MANR1044 27 2 R Papiri Niger Kanji Lake 218 MANR 1045 28 2 R Loguma Niger Emi 20810 MANR1046 29 2 Gurama/ Sarkin
Fawa Kaduna Sarkin Pawa 20810 MANR
1047 30 2 R Tamani Niger Olive 213 MANR1048 31 2 R Bangi Niger 20801 MANR 1049 32 2 R Galama Kaduna 20810 1050 33 2 Lafiagi Kwara Oro 209 1051 34 2 Kuta Niger Rafin kuta 20804 MANR 1052 35 2 R Toroko Niger Kanko 20804 MANR1053 36 2 Hunkuyi Kaduna 20205 MANR1054 37 2 Tadanni Kaduna 20205 MANR 1055 38 2 Aiyetoro Kogi Ose stream 20401 MANR1056 39 2 Serki Noma Kogi Akapanioba stream 201 MANR1057 40 2 Ajasse-Ipo Kwara Osha 209 MANR 1058 41 2 Shao Kwara Imoru 209 MANR1059 42 2 Obbo-Ile Kwara Iraji 212 MANR1060 43 2 Moshi Kwara Moshi 214_i MANR 1061 44 2 Passa Elepo Kwara Passa 212 MANR1062 45 2 Bussamu Kwara Bussamu 209 MANR1063 46 2 Lioji Niger Lioji 206 MANR 1064 47 2 Zara Niger Bagoma 206 MANR1065 48 2 Baratsu Niger Eji 20801 MANR1066 49 2 Gongara Katsina 20812 MANR
Sub-total Total
SN
No.
Project Name
Wat
er S
ourc
e W
orks
Name of
Source
Irrigation Service Area
(ha)
Irrigation Service Area
(ha)
Remarks Source
Fut
ure
Irri
gati
on A
rea
in
2030
(ha
)
Pla
nned
Are
a
Sys
tem
D
evel
oped
Ser
vice
Are
a
Inte
nsity
(%
)
1018 1 Kerawa Dam 100 100 50 50 rice, maize, vegetable
UNRF, 95M/S 100
1019 2 Tafa/ Jere Pump 355 52 52 15 ROPISIN 355 1020 3 Nasarawa Dam Kontagora
(Aulo) Dam 100 100 27 27 wheat, tomato UNRF, 2020M/S 100
1021 4 Jebba North Niger R. 150 20 20 13 UNRF 20 1022 5 Wuya Kaduna R. 100 25 25 25 UNRF 25 1023 6 Pandegi 100 25 25 25 UNRF 25 1024 7 Zangon-Kataf 150 30 30 20 UNRF 30 1025 8 Ero Dam 200 200 200 100 BORBDA, 2020M/S 200
Sub-total 1,255 552 429 275 855

The Project for Review and Update of Nigeria National Water Resources Master Plan
Volume-5, SR5 (SR5-78)
1026 9 Birnin Gwari Dam 430 200 50 12 wheat, maize, vegetable
2020M/S, 95M/S 430
1027 10 Kogun Pump 400 150 50 13 2020M/S, 95M/S 400 1028 11 Kidandan Dam 200 40 40 20 wheat, maize,
vegetable 2020M/S, 95M/S 40
1029 12 S.Birni Intake 200 40 40 20 95M/S 40 1030 13 Shika Dam Galma R. 100 80 40 40 tomato 2020M/S, 95M/S 80 1031 14 Kazuntu Pump Galma R. 80 65 40 50 vegetable 2020M/S, 95M/S 65 1032 15 Dawanta Weir Galma R. 100 40 40 40 95M/S 40 1033 16 Lere Weir 200 40 40 20 2020M/S, 95M/S 40 1034 17 G.Kurama Dam 200 40 40 20 2020M/S, 95M/S 40 1035 18 Pambegua Dam 65 60 40 62 UNRF, Faithline 60 1036 19 Jagindi Dam 100 100 10 10 UNRF, Faithline 100 1037 20 Igabi Dam 120 120 30 25 UNRF, Faithline 120 1038 21 Doko Pump Kaduna R. 400 400 400 100 rice, vegetable,
maize UNRF, 2020M/S 400
1039 22 Kagoro Intake 120 100 100 83 rice, vegetable UNRF, 2020M/S 100 1040 23 Edozhigi Intake 100 100 100 100 rice UNRF, 95M/S 100 1041 24 Odugbo 150 100 0 0 2020M/S 150 1042 25 Chanchanga Pump 302 302 0 0 vegetable 2020M/S 302 1043 26 Agaie 76 76 0 0 2020M/S 76 1044 27 Papiri Pump Kainji 80 80 0 0 cowpea, vegetable 2020M/S 80 1045 28 Loguma Weir 125 100 0 0 2020M/S 125 1046 29 Gurama/ Sarkin
Fawa Pump 300 60 0 0 wheat, maize,
vegetable 2020M/S 60
1047 30 Tamani Pump 10 10 0 0 vegetable 2020M/S 10 1048 31 Bangi 50 50 0 0 2020M/S 50 1049 32 Galama 300 300 0 0 2020M/S 300 1050 33 Lafiagi Pump 20 5 5 25 vegetable 2020M/S, 95M/S 5 1051 34 Kuta Dam 150 30 30 20 vegetable, maize 2020F/S, UNRF 30 1052 35 Toroko Weir 80 80 0 0 rice 2020M/S 80 1053 36 Hunkuyi 60 40 40 67 vegetable 2020M/S-Annex4 40 1054 37 Tadanni 60 4 4 7 ver, maize 2020M/S-Annex4 4 1055 38 Aiyetoro Dam 50 3 3 6 vegetable, maize 2020M/S-Annex4 3 1056 39 Serki Noma Weir 50 20 20 40 rice 2020M/S-Annex4 20 1057 40 Ajasse-Ipo Pump 100 3 3 3 vegetable, Citrus 2020M/S-Annex4 3 1058 41 Shao Pump 50 3 3 6 vegetable 2020M/S-Annex4 3 1059 42 Obbo-Ile Pump 90 12 12 13 vegetable, maize,
citrus 2020M/S-Annex4 12
1060 43 Moshi Pump 50 5 5 10 vegetable, maize, sugar cane
2020M/S-Annex4 5
1061 44 Passa Elepo Dam 60 17 17 28 vegetable, maize 2020M/S-Annex4 17 1062 45 Bussamu Dam 60 9 9 15 vegetable, maize,
cowpea 2020M/S-Annex4 9
1063 46 Lioji Pump 80 40 40 50 rice, vegetable 2020M/S-Annex4 40 1064 47 Zara Weir 80 0 0 0 rice, wheat,
vegetable, maize 2020M/S-Annex4 0
1065 48 Baratsu Weir 73 49 49 67 rice 2020M/S-Annex4 49 1066 49 Gongara Dam 100 0 0 0 wheat, vegetable 2020M/S-Annex4 0 Sub-total 5,421 2,973 1,300 24 3,528
Total 6,676 3,525 1,729 26 4,383
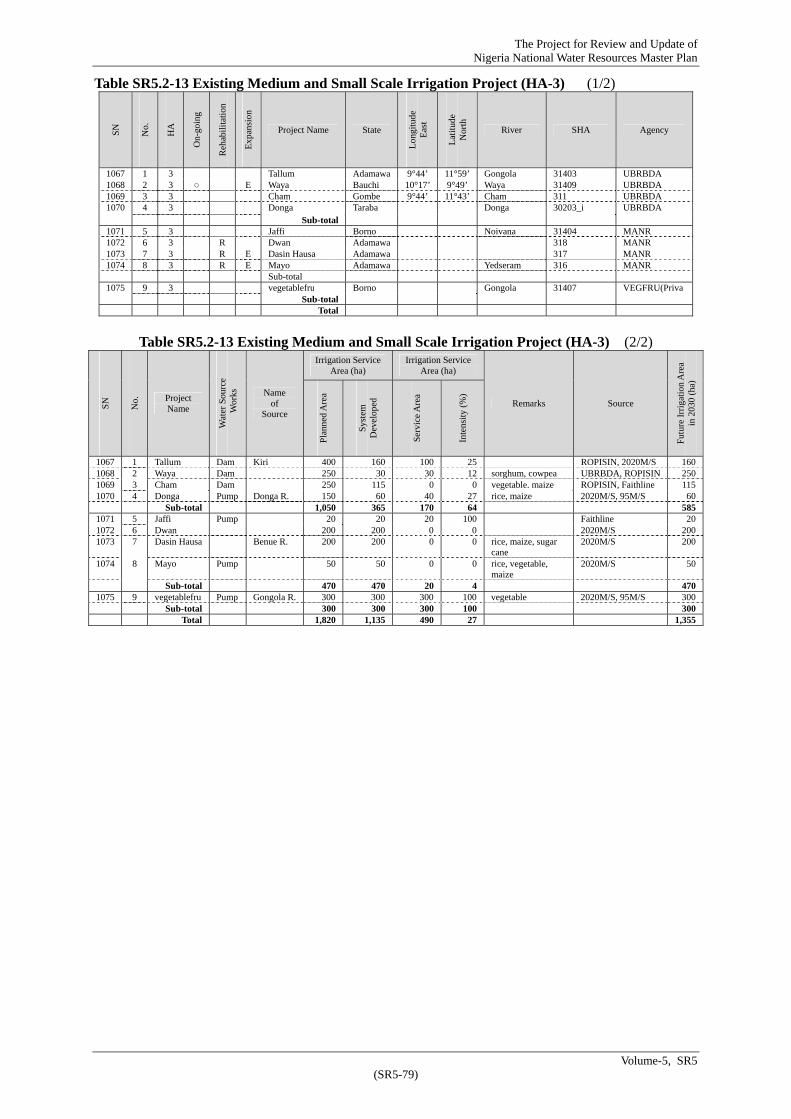
The Project for Review and Update of Nigeria National Water Resources Master Plan
Volume-5, SR5 (SR5-79)
Table SR5.2-13 Existing Medium and Small Scale Irrigation Project (HA-3) (1/2)
Table SR5.2-13 Existing Medium and Small Scale Irrigation Project (HA-3) (2/2)
SN
No.
HA
On-
goin
g
Reh
abil
itat
ion
Exp
ansi
on
Project Name State
Lon
gitu
de
Eas
t
Lat
itud
e N
orth
River SHA Agency
1067 1 3 Tallum Adamawa 9°44’ 11°59’ Gongola 31403 UBRBDA 1068 2 3 ○ E Waya Bauchi 10°17’ 9°49’ Waya 31409 UBRBDA1069 3 3 Cham Gombe 9°44’ 11°43’ Cham 311 UBRBDA1070 4 3 Donga Taraba Donga 30203_i UBRBDA
Sub-total 1071 5 3 Jaffi Borno Noivana 31404 MANR 1072 6 3 R Dwan Adamawa 318 MANR 1073 7 3 R E Dasin Hausa Adamawa 317 MANR 1074 8 3 R E Mayo Adamawa Yedseram 316 MANR
Sub-total 1075 9 3 vegetablefru Borno Gongola 31407 VEGFRU(Priva
Sub-total Total
SN
No.
Project Name
Wat
er S
ourc
e W
orks
Name of
Source
Irrigation Service Area (ha)
Irrigation Service Area (ha)
Remarks Source
Fut
ure
Irri
gati
on A
rea
in 2
030
(ha)
Pla
nned
Are
a
Sys
tem
D
evel
oped
Ser
vice
Are
a
Inte
nsity
(%
) 1067 1 Tallum Dam Kiri 400 160 100 25 ROPISIN, 2020M/S 160 1068 2 Waya Dam 250 30 30 12 sorghum, cowpea UBRBDA, ROPISIN 250 1069 3 Cham Dam 250 115 0 0 vegetable. maize ROPISIN, Faithline 115 1070 4 Donga Pump Donga R. 150 60 40 27 rice, maize 2020M/S, 95M/S 60
Sub-total 1,050 365 170 64 585 1071 5 Jaffi Pump 20 20 20 100 Faithline 20 1072 6 Dwan 200 200 0 0 2020M/S 200 1073 7 Dasin Hausa Benue R. 200 200 0 0 rice, maize, sugar
cane 2020M/S 200
1074 8 Mayo Pump 50 50 0 0 rice, vegetable, maize
2020M/S 50
Sub-total 470 470 20 4 470 1075 9 vegetablefru Pump Gongola R. 300 300 300 100 vegetable 2020M/S, 95M/S 300 Sub-total 300 300 300 100 300
Total 1,820 1,135 490 27 1,355

The Project for Review and Update of Nigeria National Water Resources Master Plan
Volume-5, SR5 (SR5-80)
Table SR5.2-14 Existing Medium and Small Scale Irrigation Project (HA-4) (1/2)
Table SR5.2-14 Existing Medium and Small Scale Irrigation Project (HA-4) (2/2)
SN
No.
HA
On-
goin
g
Reh
abil
itat
ion
Exp
ansi
on
Project Name State
Lon
gitu
de
Eas
t
Lat
itud
e N
orth
River SHA Agency
1076 1 4 Naka Benue 7°44’ 7°33’ Ana 405 LBRBDA Sub-total
1077 2 4 Gidan Adamu Plateau Yashi 408 MANR1078 3 4 Awuma Plateau Awuma 407 MANR 1079 4 4 Akata Benue Katsin-Ala 406_i MANR 1080 5 4 Mu Benue Mu 405 MANR1081 6 4 R E Rutu Nasarawa 404 MANR 1081 7 4 R Loko Nasarawa 403 MANR1083 8 4 R Allam Benue Okpo Kira 405 MANR1084 9 4 R Sabon Gida Nasarawa 404 MANR 1085 10 4 R Bassa Nasarawa 404 MANR1086 11 4 Ganauri Plateau Gwasai 404 MANR
Sub-total Total
SN
No.
Project Name
Wat
er S
ourc
e W
orks
Name of
Source
Irrigation Service Area (ha)
Irrigation Service Area (ha)
Remarks Source
Fut
ure
Irri
gati
on A
rea
in 2
030
(ha)
Pla
nned
Are
a
Sys
tem
D
evel
oped
Ser
vice
Are
a
Inte
nsity
(%
)
1076 1 Naka Dam 100 20 20 20 ROPISIN, LBRBDA 20 Sub-total 100 20 20 20 20
1077 2 Gidan Adamu
Pump 100 30 20 20 vegetable, maize 2020M/S, 95M/S 30
1078 3 Awuma Pump 70 20 20 29 2020M/S, 95M/S 20 1079 4 Akata Pump Katsina-Ala
R. 80 10 10 13 95M/S 10
1080 5 Mu Pump 100 60 60 60 rice, vegetable 2020M/S, 95M/S 60 1081 6 Rutu 50 50 0 0 2020M/S 50 1081 7 Loko 50 50 0 0 vegetable, maize 2020M/S 50 1083 8 Allam Pump 50 50 0 0 Rcce, maize,
vegetable 2020M/S 50
1084 9 Sabon Gida
200 200 0 0 2020M/S 200
1085 10 Bassa 50 50 0 0 2020M/S 50 1086 11 Ganauri Pump 400 130 20 5 rice,wheat,
vegetable, maize 2020M/S, 95M/S 130
Sub-total 1,150 650 130 11 650 Total 1,250 670 150 12 670

The Project for Review and Update of Nigeria National Water Resources Master Plan
Volume-5, SR5 (SR5-81)
Table SR5.2-15 Existing Medium and Small Scale Irrigation Project (HA-5) (1/2)
Table SR5.2-15 Existing Medium and Small Scale Irrigation Project (HA-5) ¥ (2/2)
SN
No.
HA
On-
goin
g
Reh
abil
itat
ion
Exp
ansi
on
Project Name State
Lon
gitu
de
Eas
t
Lat
itud
e N
orth
River SHA Agency
1087 1 5 ○ R Ukhun/ Erah Edo Erah 50403 BORBDA 1088 2 5 Egume Kogi Eruku 50402 LBRBDA1089 3 5 ○ Anyama-Ogbia Rivers Nun 500 NDBDA1090 4 5 E Otuokpoti Rivers Nun 500 NDBDA 1091 5 5 Ewulu Delta Umomi 500 BORBDA 1092 6 5 ○ Kpong Rivers 4°37’ 7°23’ Andori 500 NDBDA
Sub-total 1093 7 5 Ifite Ogwari Anambra Anambra 50402 MANR 1094 8 5 R E Enugu abor Enugu Mamu 50402 MANR 1095 9 5 R Ogboji Anambra Mamu 50402 MANR
Sub-total Total
SN
No.
Project Name
Wat
er S
ourc
e W
orks
Name of
Source
Irrigation Service Area
(ha)
Irrigation Service Area
(ha)
Remarks Source
Fut
ure
Irri
gati
on A
rea
in
2030
(ha
)
Pla
nned
Are
a
Sys
tem
D
evel
oped
Ser
vice
Are
a
Inte
nsity
(%
) 1087 1 Ukhun/ Erah Dam 250 50 25 10 rice, maize 2020M/S, ROPISIN 250 1088 2 Egume Pump 100 100 100 100 Faithline 100 1089 3 Anyama-Ogbia Pump Niger R. 180 24 24 13 rice NDRBDA, 2020M/S 180 1090 4 Otuokpoti Pump Niger R. 100 50 50 50 rice 2020M/S, 95M/S 100 1091 5 Ewulu Pump 100 50 30 30 Pinapple, oil farm Inventry, ROPISIN 50 1092 6 Kpong Pump 100 89 89 89 fruits, vegetable NDBDA, ROPISIN 100
Sub-total 830 363 318 38 780 1093 7 Ifite Ogwari Intake 120 120 30 25 2020M/S, 95M/S 120 1094 8 Enugu abor Ufuwa Weir 350 350 30 9 rice 2020M/S, 95M/S 350 1095 9 Ogboji Intake 130 100 30 23 rice UNRF, 95M/S 130 Sub-total 600 570 90 15 600
Total 1,430 933 408 29 2020M/S, ROPISIN 1,380

The Project for Review and Update of Nigeria National Water Resources Master Plan
Volume-5, SR5 (SR5-82)
Table SR5.2-16 Existing Medium and Small Scale Irrigation Project (HA-6) (1/2)
Table SR5.2-16 Existing Medium and Small Scale Irrigation Project (HA-6) (2/2)
SN
No.
HA
On-
goin
g
Reh
abil
itat
ion
Exp
ansi
on
Project Name State
Lon
gitu
de
Eas
t
Lat
itud
e N
orth
River SHA Agency
1096 1 6 Ofiki(B) Oyo Ofiki 604023_i OORBDA 1097 2 6 Sepeteri(B) Oyo Agbado 60405 OORBDA1098 3 6 Eniosa Oyo Omi 606 OORBDA1099 4 6 E Ikere-Ogbese Ekiti Ogbese 614 BORBDA 1100 5 6 Obayantor Edo (boreholl) 614 BORBDA1101 6 6 Erusu Ondo 7°36’ 5°47’ Etigbese 614 BORBDA1102 7 6 Ayo-Kudun Ekiti 614 BORBDA 1103 8 6 Apariko Ekiti Apariko 614 BORBDA1104 9 6 Ado-Ekiti (Osin) Ekiti 614 BORBDA1105 10 6 Ukpok Edo 616 BORBDA 1106 11 6 Ilah-Ebu Delta 617 BORBDA1107 12 6 Ewule Delta 617 BORBDA1108 13 6 Iju-Itaogbolu Ondo 612 BORBDA 1109 14 6 Ijero Ekiti 614 BORBDA1110 15 6 ○ Owiwi Ogun 60401 OORBDA1111 16 6 ○ Itoikin Lagos Aye 606 OORBDA 1112 17 6 missing 1113 18 6 R E Oogi Osun Erinle 610 OORBDA1114 20 6 R Ipetu-Ijesha Osun 610 OORBDA
Sub-total 1115 19 6 Osun Ekiti Osun Awo 614 MANR 1116 21 6 R Orile Owu Osun 610 MANR 1117 22 6 R Old Erinle Dam Osun 608 MANR
Sub-total Total
SN
No.
Project Name
Wat
er S
ourc
e W
orks
Name of
Source
Irrigation Service Area
(ha)
Irrigation Service Area
(ha)
Remarks Source
Fut
ure
Irri
gati
on A
rea
in
2030
(ha
)
Pla
nned
Are
a
Sys
tem
D
evel
oped
Ser
vice
Are
a
Inte
nsity
(%
)
1096 1 Ofiki(B) Dam 100 10 10 10 OORBDA, 95M/S 10 1097 2 Sepeteri(B) Dam 400 0 0 0 OORBDA, 95M/S 0 1098 3 Eniosa Dam 250 10 10 4 vegetable, maize OORBDA, 2020M/S 10 1099 4 Ikere-Ogbese Pump 32 32 11 34 maize okura ROPISIN 32 1100 5 Obayantor Pump 100 100 0 0 oil palm ROPISIN 100 1101 6 Erusu Dam 250 0 0 0 ROPISIN 0 1102 7 Ayo-Kudun 300 300 300 100 BORBDA 300 1103 8 Apariko Dam 250 250 250 100 BORBDA 250 1104 9 Ado-Ekiti (Osin) Dam 50 0 0 0 Under construction BORBDA 0 1105 10 Ukpok 25 25 25 100 BORBDA 25 1106 11 Ilah-Ebu 50 50 50 100 BORBDA 50 1107 12 Ewule 50 50 50 100 BORBDA 50 1108 13 Iju-Itaogbolu 100 0 0 0 Inventory, BORBDA 0 1109 14 Ijero 100 100 100 100 BORBDA 100 1110 15 Owiwi Dam 302 45 45 15 OORDBA, DID 302 1111 16 Itoikin Intake NF 315 141 141 45 Rice OORBDA 3151112 17 missing 1113 18 Oogi Intake 400 0 0 0 OORBDA, 2020M/S 400 1114 20 Ipetu-Ijesha Intake 250 0 0 0 OORBDA, 95M/S 250
Sub-total 3,074 1,113 992 32 2,1941115 19 Osun Ekiti Intake 420 100 100 24 2020F/S, 95M/S 100 1116 21 Orile Owu 100 100 0 0 2020M/S 100 1117 22 Old Erinle Dam 150 150 0 0 2020M/S 150 Sub-total 670 350 100 15 350
Total 3,744 1,463 1,092 29 2,544

The Project for Review and Update of Nigeria National Water Resources Master Plan
Volume-5, SR5 (SR5-83)
Table SR5.2-17 Existing Medium and Small Scale Irrigation Project (HA-7) (1/2)
Table SR5.2-17 Existing Medium and Small Scale Irrigation Project (HA-7) (2/2)
SN
No.
HA
On-
goin
g
Reh
abil
itat
ion
Exp
ansi
on
Project Name State
Lon
gitu
de
Eas
t
Lat
itud
e N
orth
River SHA Agency
1118 1 7 R Ogoja Cross River 6°37’ 8°48’ Aya 704042 CRBDA 1119 2 7 Abak Akwa Ibom 4°57’ 7°48’ Abak 703 CRBDA1120 3 7 R Bende Abia Igwu 70401 AIRBDA1121 4 7 R Igwu-Ohafia Abia Igwu 70401 AIRBDA 1122 5 7 Utuma Cross River Cross 70401 CRBDA1123 6 7 Obudu Cross River 6°37’ 9°10’ Abeb 704042 CRBDA1124 7 7 R E Oniong Nung Nden Akwa Ibom 4°47’ 7°54’ Quo Ibou 703 CRBDA 1125 8 7 E Obubra Cross River Cross 70403 CRBDA1126 9 7 Amaeki Abam Cross River 70405_i CRBDA1127 10 7 Iboko Enugu Aboine 704043 AIRBDA 1128 11 7 Igwu-Ndiojo Oguwo Abia Igwu 70401 AIRBDA1129 12 7 Igwu-Ndiebe Abia Igwu 70401 AIRBDA
Sub-total 1130 13 7 Akaeze Abia Asu 70402 MANR1131 14 7 R E Ihitti-Uboma Imo 702 MANR1132 15 7 Umlopara Abia Imo 702 MANR 1133 16 7 R Nung Obong Akwa Ibom Abak 70401 MANR 1134 17 7 R Owutu Abia Asu 70402 MANR1135 18 7 Umuhu Abia Asu 70402 MANR 1136 19 7 Uzu Abam Abia Igwu 70401 MANR1137 20 7 Idim Abam Abia Igwu 70401 MANR1138 21 7 Ofiawu Abia Asu 70402 MANR 1139 22 7 Uwet Akwa Ibom Calabar 705 MANR1140 23 7 Ezamgbe Ebonyi 70402 MANR1141 24 7 E Ezeiyieku Esu Ebonyi 70402 MANR 1142 25 7 R E Ezillo Farm Ebonyi 70402 MANR1143 26 7 E Ozara Okangwu Ebonyi 70402 MANR1144 27 7 R E Item-Ikwo Enugu 70402 MANR
Sub-total
SN
No.
Project Name
Wat
er S
ourc
e W
orks
Name of
Source
Irrigation Service Area
(ha)
Irrigation Service Area
(ha)
Remarks Source
Fut
ure
Irri
gati
on A
rea
in
2030
(ha
)
Pla
nned
Are
a
Sys
tem
D
evel
oped
Ser
vice
Are
a
Inte
nsity
(%
)
1118 1 Ogoja Pump 125 125 125 100 vegetable, maize Inventry, ROPISIN 125 1119 2 Abak Pump 92 62 62 67 vegetable. maize UNRF, ROPISIN 62 1120 3 Bende Intake 300 150 20 7 rice 2020M/S, Faithline 300 1121 4 Igwu-Ohafia Intake 300 160 160 53 rice 2020F/S, Faithline 300 1122 5 Utuma Pump Cross R. 250 200 200 80 UNRF, 95M/S 200 1123 6 Obudu Dam 115 30 30 26 UNRF, ROPISIN 30 1124 7 Oniong Nung Nden Pump 400 177 177 44 ROPISIN, Faithline 400 1125 8 Obubra Pump Cross R. 315 315 102 32 UNRF, 95M/S 315 1126 9 Amaeki Abam Pump 62 62 0 0 rice 2020F/S, Faithline 62 1127 10 Iboko Intake 300 150 150 50 rice 2020F/S, Faithline 150 1128 11 Igwu-Ndiojo Oguwo Pump 150 150 100 67 rice 2020M/S, Faithline 150 1129 12 Igwu-Ndiebe Pump 200 100 0 0 rice 2020M/S, Faithline 100
Sub-total 2,609 1,681 1,126 43 2,194 1130 13 Akaeze Dam 200 200 100 50 rice 2020M/S, 95M/S 200 1131 14 Ihitti-Uboma Weir 310 200 40 13 rice 2020M/S, Faithline 310 1132 15 Umlopara Dam 300 210 50 17 rice 2020M/S, Faithline 210 1133 16 Nung Obong Pump 200 100 30 15 cowpea, ginger 2020M/S, Faithline 200 1134 17 Owutu Pump 480 280 280 58 rice 2020M/s, 95M/S 480 1135 18 Umuhu Pump 400 200 100 25 rice 2020M/S, Faithline 200 1136 19 Uzu Abam Pump 150 70 0 0 rice 2020M/S, Faithline 70 1137 20 Idim Abam Pump 200 200 30 15 rice 2020M/P, Faithline 200 1138 21 Ofiawu Intake 250 115 50 20 rice 2020,F/S, Faithline 115 1139 22 Uwet Pump 100 50 50 50 Faithline 50 1140 23 Ezamgbe 200 100 100 50 2020M/S, Faithline 100 1141 24 Ezeiyieku Esu 200 0 0 0 Faithline 200 1142 25 Ezillo Farm 150 150 0 0 2020M/S, Faithline 150 1143 26 Ozara Okangwu 300 0 0 0 Faithline 300 1144 27 Item-Ikwo 300 100 0 0 2020M/S 300
Sub-total 3,740 1,975 830 22 3,085 Total 6,349 3,656 1,956 31 5,279

The Project for Review and Update of Nigeria National Water Resources Master Plan
Volume-5, SR5 (SR5-84)
Table SR5.2-18 Existing Medium and Small Scale Irrigation Project (HA-8) (1/2)
Table SR5.2-18 Existing Medium and Small Scale Irrigation Project (HA-8) (2/2)
SN
No.
HA
On-
goin
g
Reh
abil
itat
ion
Exp
ansi
on
Project Name State
Lon
gitu
de
Eas
t
Lat
itud
e N
orth
River SHA Agency
1145 1 8 Gamboru Borno Ebeii 80401 CBDA 1146 2 8 Jamaare(Sewa Pilot) Bauchi 11°25’ 9°58’ Sewa lake 808063 HJRBDA1147 3 8 ○ Galala Bauchi Galala 808063 HJRBDA1148 4 8 Gunuar Kukaf Jigawa Hadejia 808073 HJRBDA 1149 5 8 Mai-alkama Jigawa Hadejia 808073 HJRBDA1150 6 8 Arawa Jigawa Hadejia 808073 HJRBDA
Sub-total 1151 7 8 Tudun Wada Kano Waina 808077 MANR1152 8 8 Diya Bauchi Lake Diya 808063 MANR1153 9 8 Maladumba Bauchi Lake Maladumba 808063 MANR 1154 10 8 K.Gana Jigawa Katagun 808062 MANR1155 11 8 Hantsu Jigawa Hadejia 808073 MANR1156 12 8 Warwada Jigawa Keffin Hausa 808061 MANR 1157 13 8 Damasak Borno Yobe 80801_i MANR1158 14 8 Yau Borno 80403_i MANR1159 15 8 Abadam Borno 80403_i MANR 1160 16 8 Ngabu Borno 80401 1161 17 8 Jakarade Jigawa Gari 8080721_i MANR1162 18 8 Yamidi Jigawa Warwade 808061 MANR 1163 19 8 Dambo Jigawa Gari 8080721_i MANR1164 20 8 Walu Kano Hadejia 808073 MANR1165 21 8 Tsuwa Kano Hadejia 808073 MANR 1166 22 8 Joda Kano Hadejia 808073 MANR1167 23 8 Mugura Yobe Yobe 80805 MANR
Sub-total Total
Grand Total
SN
No.
Project Name
Wat
er S
ourc
e W
orks
Name of
Source
Irrigation Service Area (ha)
Irrigation Service Area
(ha)
Remarks Source
Fut
ure
Irri
gati
on A
rea
in
2030
(ha
)
Pla
nned
Are
a
Sys
tem
D
evel
oped
Ser
vice
Are
a
Inte
nsity
(%
)
1145 1 Gamboru Pump 400 400 400 100 2020M/S, Faithline
400
1146 2 Jamaare(Sewa Pilot) Pump 50 20 0 0 wheat ROPISIN 20 1147 3 Galala Dam 130 72 72 55 HJRBDA 130 1148 4 Gunuar Kukaf Pump Hadejia R. 80 0 0 0 2020M/S-Annex4 0 1149 5 Mai-alkama Pump Hadejia R. 80 0 0 0 2020M/S-Annex4 0 1150 6 Arawa Pump Hadejia R. 60 0 0 0 2020M/S-Annex4 0
Sub-total 800 492 472 59 550 1151 7 Tudun Wada Dam 360 0 0 0 wheat,
vegetable 2020M/S, 95M/S 0
1152 8 Diya Lake 250 30 30 12 vegetable 2020M/S, 95M/S 30 1153 9 Maladumba Lake 250 20 20 8 vegetable 2020M/S, 95M/S 20 1154 10 K.Gana Dam 60 40 40 67 2020M/S, 95M/S 40 1155 11 Hantsu Pump Hadejia R. 200 30 30 15 rice,
vegetable 2020M/S, 95M/S 30
1156 12 Warwada Dam 80 40 40 50 2020M/S, 95M/S 40 1157 13 Damasak Pump Yobe R. 100 30 30 30 2020M/S, 95M/S 30 1158 14 Yau Pump 420 420 200 48 2020M/S, 95M/S 420 1159 15 Abadam Pump 260 260 120 46 2020M/S, 95M/S 260 1160 16 Ngabu 200 200 0 0 2020M/S 200 1161 17 Jakarade Dam Gari 100 100 100 100 rice, wheat,
vegetable 2020M/S, 95M/S 100
1162 18 Yamidi Dam 90 0 0 0 2020M/S-Annex4 0 1163 19 Dambo Dam Gari 200 0 0 0 rice, wheat,
vegetable 2020M/S-Annex4 0
1164 20 Walu Pump Hadejia R. 150 50 50 33 vegetable, wheat
2020M/S-Annex4 50
1165 21 Tsuwa Pump Hadejia R. 120 0 0 0 rice, wheat, vegetable
2020M/S-Annex4 0
1166 22 Joda Pump Hadejia R. 100 0 0 0 rice, wheat, vegetable
2020M/S-Annex4 0
1167 23 Mugura Pump Yobe R. 120 28 28 23 rice, wheat 2020M/S-Annex4 28 Sub-total 3,060 1,248 688 22 1,248 Total 3,860 1,740 1,160 30 1,798 Grand Total 27,749 15,033 8,326 30 19,320

The Project for Review and Update of Nigeria National Water Resources Master Plan
Volume-5, SR5 (SR5-85)
SR5.2.2 Supplementary Irrigation Scheme New development areas are 19,000 ha for HA-5 and 29,000 ha for HA-7 corresponding to the irrigation areas omitted at the dam selection stage on “2.2 Dam Irrigation Scheme”.
Table SR5.2-19 Supplementary Irrigation scheme HA-5: A=15,000ha
SHA Primary State Area
(km2) Suitable Area for Agric.(ha)
Rate (%)
Future Irrigation Area (ha)
Remark
500 Bayelsa, River 19,112 0 0 0 too large unsuitable area
502 Delta 3,157 3,157 10 1,800
50401 Delta 1,581 0 0 0 flood plain
50402 Anambra, Enugu, 14,105 14,105 42 8,100
50403 Edo, Kogi 11,821 11,821 36 6,700
506 Imo, Anambra 4,138 4,138 12 2,400
Total 53,914 33,221 100 19,000
HA-7: A=29,000ha
SHA Primary State Area
(km2) Suitable Area for Agric.(ha)
Rate (%)
Future Irrigation Area (ha)
Remark
702 Imo, Abia, River) 8,147 8,147 21 5,900
703 Akwa Ibom 4,319 4,319 11 3,200
70401 Cross River 6,055 0 0 0 too large unsuitable area
70402 Ebonyi, Enugu 7,091 7,091 18 5,200
70403 Ebonyi 3,625 3,625 9 2,700
704041 Ebonyi 1,236 1,236 3 900
704042 Benue, Cross River 7,703 7,703 19 5,700
704043 Benue 7,383 7,383 19 5,400
70405_i Cross River 6,028 0 0 0 too large unsuitable area
705 Cross River 5,854 0 0 0 too large unsuitable area
Total 57,440 39,504 100 29,000
SR5.2.3 Dam Irrigation Scheme Location of dam will be selected considering economy, possibility of suitable irrigation area at downstream of dam, dam efficiency, avoidance of competition among water supply and the existing irrigation scheme, and possibility of resettlement Economical Indicator on Project: 252 sites are proposed as Dam Irrigation scheme nationwide based on M/P1995 and revised 2013MP. Annual cost of each dam was roughly estimated. Considering the economical cost, the cost corresponding to one third of all, which was altogether ranked in the top 84 turns of all, was indicated at 185,000Naira/ha.

The Project for Review and Update of Nigeria National Water Resources Master Plan
Volume-5, SR5 (SR5-86)
Table SR5.2-20 Selection of dam Irrigation scheme (HA-1)
SN
-Dam
SH
A
Nam
e
Act
ive
Sto
rage
(M
CM
)
Che
ckin
g E
xist
ing
Wat
er
Use
Poi
nt
Irri
gabl
e A
rea
wit
h sa
fety
fa
ctor
(ha
)
Tur
n O
ver
Rat
e (-
)
Eff
icie
ncy
(ha/
MC
M)
Sup
plem
ent f
or E
xist
ing
Irri
gati
on
Sup
plem
ent f
or M
unic
ipal
W
ater
Sup
ply
Set
tlem
ent i
n re
serv
oir
area
Pos
sibl
e ir
riga
tion
are
a
Ann
ual C
ost /
Irri
gati
on
area
(N
aira
/ha)
1:ad
opti
on
0:di
squa
lifi
cati
on
2003 10602 Ka 90 18,295 204 Large 18,202 0
2006 104 Danzaki 43 5,674 132 Large 95,855 0
2011 101 Wata 45 4,736 106 Large 3000 98,439 0
2009 103 Kasanu 14 1,580 112 1500 147,488 1
2012 101 Utula 41 1,416 <1.0 34 282,152 0
2013 101 Shafaci 34 1,257 <1.0 37 282,688 0
2010 103 Bambiri 10 804 79 317,574 0
2005 104 Kotsu 10 853 84 Mid 325,308 0
2007 103 Wasa 27 823 <1.0 30 377,618 0
2008 103 Bakin Turu 10 154 <0.6 15 1,659,224 0
2004 105 K.Sakachi 17 185 <0.6 11 Large 1,744,249 0
2001 1060883 Karaduwa 83 14-Zobe NA <1.0 NA Large NA 0
2002 106089 Kaya 109 4-Goronyo NA NA NA 0
Table SR5.2-20 Selection of dam Irrigation scheme (HA-2)
SN
-Dam
SH
A
Nam
e
Act
ive
Sto
rage
(M
CM
)
Che
ckin
g E
xist
ing
Wat
er
Use
Poi
nt
Irri
gabl
e A
rea
wit
h sa
fety
fa
ctor
(ha
)
Tur
n O
ver
Rat
e (-
)
Eff
icie
ncy
(ha/
MC
M)
Sup
plem
ent f
or E
xist
ing
Irri
gati
on
Sup
plem
ent f
or M
unic
ipal
W
ater
Sup
ply
Set
tlem
ent i
n re
serv
oir
area
Pos
sibl
e ir
riga
tion
are
a
Ann
ual C
ost /
Irri
gati
on
area
(N
aira
/ha)
1:ad
opti
on
0:di
squa
lifi
cati
on
2077 203 Baro 227 15,916 70 5000 FP
27,199 0
2058 20815 Bakin kogi 51 7,408 146 Large 47,945 0
2082 20205 Chori 28 72-Kwoi 3,496 124 5014 0 66,670 0
2032 206 Yankpako 109 140-Bida 12,606 115 Large 78,367 0
2079 20203 Takara 27 3,901 143 0 91,061 0
2025 20814 Galma(3) 36 3,716 103 Large 107,535 0
2081 20205 Marasa 20 72-Kwoi 2,447 120 0 131,573 0
2080 20205 Kuda 23 22-Gurara 2,366 104 0 136,064 0
2015 212 Ajelanwa 66 3,651 55 Large 145,949 0
2026 206 Essan 30 143-Chanc
haga 2,730 92
Minna
146,394 0
2024 20814 Galma(2) 63 3,732 <1.0 60 Large 148,715 0
2039 20804 Ukusu 9 1,484 173 3000 172,041 1
2028 206 Agaie 34 25-Agaie/L
apai 2,501 73 25 173,110 0
2072 203 Kateha 20 1,688 83 0 190,674 0
2021 212 Okanle 30 1,435 48 Ilolin 193,360 0
2069 206 Bakoji 34 32-Bakogi 2,034 59 32 196,499 0
2057 20815 Gurza 31 2,242 72 3000 198,036 0
2018 212 Shao 21 20-Oloru 1,210 <1.0 57 0 220,184 0
2034 206 Faka 29 155-Bakaje
ba 2,015 70 220,299 0
2030 20805 Sanakpan 20 1,780 88 224,463 0
2017 212 Ala 38 2,197 <1.0 57 227,354 0
2020 212 Mogaji 42 34-Sobi 2,197 <1.0 52 Ilolin 242,511 0
2055 20815 Gambo 14 77-Samina
ka 1,777 126 243,605 0

The Project for Review and Update of Nigeria National Water Resources Master Plan
Volume-5, SR5 (SR5-87)
2051 20812 Gazare 20 1,285 63 250,556 0
2027 206 Eniko 15 140-Bida 1,332 90 258,425 0
2076 201 Koten karifi
28 2,018 72 1000 264,061 0
2053 20815 Karami 10 752 74 265,850 0
2041 20804 Kombou 12 1,163 99 267,144 0
2056 20815 Gora 14 1,329 94 267,327 0
2036 209 Elebu 22 1,286 <1.0 59 267,548 0
2050 20812 Kalegi 27 1,188 <1.0 43 271,070 0
2062 206 Maidna 14 140-Bida 1,049 75 275,230 0
2016 212 Yanku 37 1,872 <1.0 51 278,618 0
2045 209 Pategi 14 542 <1.0 39 286,481 0
2054 20815 Bishiwa 11 77-Samina
ka 1,214 111 292,679 0
2043 209 Lade 23 27-Duke-L
ade 1,219 <1.0 52 27 327,818 0
2060 20815 Atom 9 709 83 328,741 0
2074 203 Ebbo 17 1,074 <1.0 62 Large 330,867 0
2048 20812 M. dutse 27 1,029 <1.0 38 334,351 0
2066 206 Mussa 9 38-Badegg
i 860 100 38 335,589 0
2031 206 Jariga 25 155-Bakaje
ba 1,536 <1.0 61 339,609 0
2059 20815 Zonzon 7 843 120 342,303 0
2070 206 Yewar 10 139-Agaie 831 82 347,342 0
2049 20812 Jusawo 16 670 <1.0 43 347,656 0
2046 203 Sunawa 11 1,081 99 349,010 0
2052 20812 Maraku 24 921 <1.0 38 349,417 0
2065 206 Noayma 22 1,868 85 356,444 0
2040 20804 K. Chaaruma
5 715 131 357,121 0
2047 201 Kakanda 9 773 90 359,161 0
2073 20803 Kanko 17 751 <1.0 44 384,259 0
2078 203 Nugmagi 17 969 <1.0 56 423,946 0
2075 201 Ossen Seni 11 874 80 431,996 0
2044 209 Auge 23 839 <0.6 36 449,896 0
2014 212 Jokoro 10 710 70 469,303 0
2029 206 Tungawain 18 140-Bida 1,171 65 483,543 0
2063 206 Edndnade 9 140-Bida 604 70 533,088 0
2035 209 Igporin 26 1,193 46 558,268 0
2064 206 Kondi 10 140-Bida 620 61 573,261 0
2071 205 Anbero 12 146-Katch
a 549 47 586,068 0
2019 212 Oloye 10 524 <1.0 52 698,662 0
2037 209 Lasaki 11 605 <1.0 55 770,352 0
2038 209 Okunrun 9 21-Ero 299 <1.0 35 21 780,466 0
2061 206 Gadoko 5 140-Bida 337 62 856,784 0
2022 212 Okeoyi 10 20-Oloru 580 <1.0 57 899,792 0
2068 206 Esama 9 32-Bakogi 282 <0.6 30 1,142,280 0
2033 206 Nabi 20 143-Chanc
haga 600 30
Minna
1,147,116 0
2067 206 Emiziko 12 250 <0.6 21 5026 1,152,127 0
2023 212 Faloku 15 31-Oyun NA NA 31 Mid NA 0
2042 20801 Kaduna 191 #VALUE! 0
Note: SN-Dam 2077 and 2079 correspond to disqualification due to land-use condition.
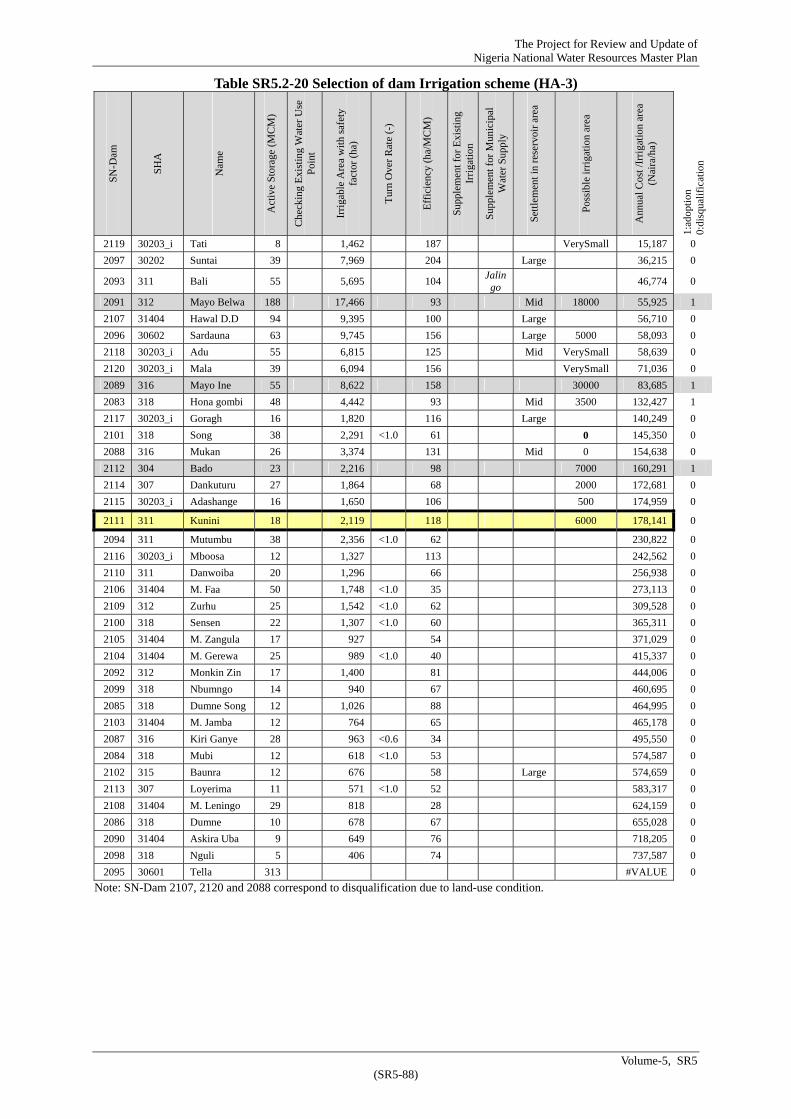
The Project for Review and Update of Nigeria National Water Resources Master Plan
Volume-5, SR5 (SR5-88)
Table SR5.2-20 Selection of dam Irrigation scheme (HA-3)
SN
-Dam
SH
A
Nam
e
Act
ive
Sto
rage
(M
CM
)
Che
ckin
g E
xist
ing
Wat
er U
se
Poi
nt
Irri
gabl
e A
rea
wit
h sa
fety
fa
ctor
(ha
)
Tur
n O
ver
Rat
e (-
)
Eff
icie
ncy
(ha/
MC
M)
Sup
plem
ent f
or E
xist
ing
Irri
gati
on
Sup
plem
ent f
or M
unic
ipal
W
ater
Sup
ply
Set
tlem
ent i
n re
serv
oir
area
Pos
sibl
e ir
riga
tion
are
a
Ann
ual C
ost /
Irri
gati
on a
rea
(Nai
ra/h
a)
1:ad
opti
on
0:di
squa
lifi
cati
on
2119 30203_i Tati 8 1,462 187 VerySmall 15,187 0
2097 30202 Suntai 39 7,969 204 Large 36,215 0
2093 311 Bali 55 5,695 104 Jalin
go 46,774 0
2091 312 Mayo Belwa 188 17,466 93 Mid 18000 55,925 1
2107 31404 Hawal D.D 94 9,395 100 Large 56,710 0
2096 30602 Sardauna 63 9,745 156 Large 5000 58,093 0
2118 30203_i Adu 55 6,815 125 Mid VerySmall 58,639 0
2120 30203_i Mala 39 6,094 156 VerySmall 71,036 0
2089 316 Mayo Ine 55 8,622 158 30000 83,685 1
2083 318 Hona gombi 48 4,442 93 Mid 3500 132,427 1
2117 30203_i Goragh 16 1,820 116 Large 140,249 0
2101 318 Song 38 2,291 <1.0 61 0 145,350 0
2088 316 Mukan 26 3,374 131 Mid 0 154,638 0
2112 304 Bado 23 2,216 98 7000 160,291 1
2114 307 Dankuturu 27 1,864 68 2000 172,681 0
2115 30203_i Adashange 16 1,650 106 500 174,959 0
2111 311 Kunini 18 2,119 118 6000 178,141 0
2094 311 Mutumbu 38 2,356 <1.0 62 230,822 0
2116 30203_i Mboosa 12 1,327 113 242,562 0
2110 311 Danwoiba 20 1,296 66 256,938 0
2106 31404 M. Faa 50 1,748 <1.0 35 273,113 0
2109 312 Zurhu 25 1,542 <1.0 62 309,528 0
2100 318 Sensen 22 1,307 <1.0 60 365,311 0
2105 31404 M. Zangula 17 927 54 371,029 0
2104 31404 M. Gerewa 25 989 <1.0 40 415,337 0
2092 312 Monkin Zin 17 1,400 81 444,006 0
2099 318 Nbumngo 14 940 67 460,695 0
2085 318 Dumne Song 12 1,026 88 464,995 0
2103 31404 M. Jamba 12 764 65 465,178 0
2087 316 Kiri Ganye 28 963 <0.6 34 495,550 0
2084 318 Mubi 12 618 <1.0 53 574,587 0
2102 315 Baunra 12 676 58 Large 574,659 0
2113 307 Loyerima 11 571 <1.0 52 583,317 0
2108 31404 M. Leningo 29 818 28 624,159 0
2086 318 Dumne 10 678 67 655,028 0
2090 31404 Askira Uba 9 649 76 718,205 0
2098 318 Nguli 5 406 74 737,587 0
2095 30601 Tella 313 #VALUE 0
Note: SN-Dam 2107, 2120 and 2088 correspond to disqualification due to land-use condition.

The Project for Review and Update of Nigeria National Water Resources Master Plan
Volume-5, SR5 (SR5-89)
Table SR5.2-20 Selection of dam Irrigation scheme (HA-4)
SN
-Dam
SH
A
Nam
e
Act
ive
Sto
rage
(M
CM
)
Che
ckin
g E
xist
ing
Wat
er
Use
Poi
nt
Irri
gabl
e A
rea
wit
h sa
fety
fa
ctor
(ha
)
Tur
n O
ver
Rat
e (-
)
Eff
icie
ncy
(ha/
MC
M)
Sup
plem
ent f
or E
xist
ing
Irri
gati
on
Sup
plem
ent f
or M
unic
ipal
W
ater
Sup
ply
Set
tlem
ent i
n re
serv
oir
area
Pos
sibl
e ir
riga
tion
are
a
Ann
ual C
ost /
Irri
gati
on a
rea
(Nai
ra/h
a)
1:ad
opti
on
0:di
squa
lifi
cati
on
2124 410 Shemankar 102 15,63
1 154 Mid 20000 42,607 1
2137 408 Tsorom 19 67-Wuse 2,667 142 Large 1000 49,950 0
2139 407 Aneri 51 6,293 124 15000 59,969 1
2155 406_i Ambighir 34 5,285 157 0 63,003 0
2172 404 Sanga 29 134-Keffi/Ma
da 5,598 194 1500 63,447 0
2169 404 Kwagiri 31 134-Keffi/Ma
da 4,134 132 0 91,283 0
2148 406_i Dula 20 3,279 161 2000 98,185 1
2142 405 Kereke 27 4,505 165 Mid 2000 98,557 1
2165 404 Leizi 17 3,082 179 0 115,240 0
2171 404 Kormi 14 134-Keffi/Ma
da 2,188 156 0 131,922 0
2161 405 Ogari(1) 17 2,975 173 Large 2000 134,299 0
2149 406_i Mishe 17 2,635 153 0 134,777 0
2153 406_i Yelen(2) 23 2,405 106 0 138,488 0
2134 408 Feteruwa 20 58-Dep 2,565 126 0 138,506 0
2166 404 Kyereku(1) 12 2,043 174 0 141,295 0
2167 404 Kyereku(2) 16 2,231 143 2000 144,302 0
2126 409 Riti 23 1,901 84 Mid 1500 145,944 0
2136 404 Katari 14 1,958 139 0 147,428 0
2162 405 Ogari(2) 16 1,927 123 0 149,737 0
2122 408 Dansak 6 58-Dep 1,741 312 3000 152,992 0
2145 407 Afiae 17 1,961 114 Large 158,472 0
2146 406_i Agbunko 10 1,470 145 10000 158,591 0
2170 404 Dongwa 20 134-Keffi/Ma
da 2,517 129 1000 172,019 0
2121 410 Shendam 23 3,158 135 Mid 4000 172,227 0
2154 406_i Amber 11 1,660 152 0 180,561 0
2132 408 gudi 25 138-Nasarawa
-Eggon 3,228 129 0 182,240 0
2123 410 Baushe 43 3,781 88 14000 184,974 0
2135 404 Ganye 17 1,883 110 0 188,628 0
2157 406_i Daudu 9 1,252 146 0 195,122 0
2160 405 Kpawaju 6 1,049 168 2000 201,130 0
2130 408 Karma(1) 14 58-Dep 2,276 162 209,735 0
2168 405 Ushongu 14 1,673 119 212,260 0
2129 406_i Ajiba 12 1,344 115 214,759 0
2163 402 Takwa 11 1,242 114 241,281 0
2159 405 Safuga 10 1,049 103 243,473 0
2144 405 Ube 10 947 93 246,242 0
2133 408 Ukon 11 58-Dep 1,385 127 256,537 0
2147 406_i Mnyande 7 1,111 158 259,856 0
2158 405 Kamken 10 1,159 114 277,693 0
2150 405 Uchi Mbako 9 752 87 Int
Dev 295,329 0
2141 406_i Vakugu 12 1,080 92 298,133 0
2152 406_i Yelen(1) 7 852 121 299,547 0
2140 406_i Tsemngo 9 970 113 320,295 0
2131 408 Karma(2) 11 58-Dep 1,338 122 356,747 0

The Project for Review and Update of Nigeria National Water Resources Master Plan
Volume-5, SR5 (SR5-90)
2156 406_i Ukwye 9 1,201 140 360,306 0
2151 406_i Dzer 9 973 113 365,172 0
2164 404 G. Shehu 11 1,414 129 376,761 0
2127 407 Uweyande 11 963 88 391,988 0
2138 407 Ovena 9 788 92 408,471 0
2128 407 Fofi 11 803 <1.0 73 511,409 0
2125 409 Ujany 10 646 <1.0 64 Mid 532,558 0
2143 405 Baa 13 684 55 600,146 0
Note: SN-Dam 2146, 2154 and 2132 correspond to disqualification due to land-use condition.
Table SR5.2-20 Selection of dam Irrigation scheme (HA-5)
SN
-Dam
SH
A
Nam
e
Act
ive
Sto
rage
(M
CM
)
Che
ckin
g E
xist
ing
Wat
er
Use
Poi
nt
Irri
gabl
e A
rea
wit
h sa
fety
fa
ctor
(ha
)
Tur
n O
ver
Rat
e (-
)
Eff
icie
ncy
(ha/
MC
M)
Sup
plem
ent f
or E
xist
ing
Irri
gati
on
Sup
plem
ent f
or M
unic
ipal
W
ater
Sup
ply
Set
tlem
ent i
n re
serv
oir
area
Pos
sibl
e ir
riga
tion
are
a
Ann
ual C
ost /
Irri
gati
on
area
(N
aira
/ha)
1:ad
opti
on
0:di
squa
lifi
cati
on
2175 50403 Obe 45 4,194 93 5000 89,979 1
2179 50402 Oforochi 16 78-Ofarachi 2,308 148 78 101,001 0
2182 50402 Ukwa, Abwa 17 2,300 134 0 106,169 0
2185 50402 Oji 14 3,091 220 5012 107,748 0
2178 50402 Nibo 43 81-Uzo Uwani
3,851 90 Large 141,231 0
2174 50403 Onado 34 2,444 71 Large 2000 168,038 0
2180 50401 Atapo 17 2,368 138 6000 173,401 0
2176 50403 Urhobo 18 2,407 134 1000 184,458 0
2181 50402 Umuleri 9 1,079 125 0 185,254 0
2177 50402 Okupo 14 80-Ada-Rice 1,282 91 190,491 0
2184 50402 Ugbio 9 985 115 236,671 0
2183 50402 Obibia 9 742 86 329,124 0
2173 50403 Ghagede 11 801 73 470,919 0
Note: SN-Dam 2182, 2178 and 2180 correspond to disqualification due to land-use condition.

The Project for Review and Update of Nigeria National Water Resources Master Plan
Volume-5, SR5 (SR5-91)
Table SR5.2-20 Selection of dam Irrigation scheme (HA-6)
SN
-Dam
SH
A
Nam
e
Act
ive
Sto
rage
(M
CM
)
Che
ckin
g ex
isti
ng W
ater
Use
P
oint
Irri
gabl
e A
rea
wit
h sa
fety
fa
ctor
(ha
)
Tur
n O
ver
Rat
e (-
)
Eff
icie
ncy
(ha/
MC
M)
Sup
plem
ent f
or E
xist
ing
Irri
gati
on
Sup
plem
ent f
or M
unic
ipal
W
ater
Sup
ply
Set
tlem
ent i
n re
serv
oir
area
Pos
sibl
e ir
riga
tion
are
a
Ann
ual C
ost /
Irri
gati
on a
rea
(Nai
ra/h
a) 1:
adop
tion
0:
disq
uali
fica
tion
2223 614 Ala 16 2,440 156 0 95,540 0
2224 614 Okhuo 22 3,473 159 1500 118,253 1
2222 612 Ofosun 35 2,296 65 0 145,046 0
2194 60403 Ohu 34 79-Opeki 1,859 55 0 202,981 0
2189 606 Omi 17 90-Eyniwa 1,473 86 203,513 0
2219 610 Oni 23 161-Okeigbo 2,097 93 0 206,423 0
2213 608 Ifeodan 22 59-Asajire 1,798 82 209,951 0
2211 608 Otamakun 28 59-Asajire 1,568 56 212,431 0
2205 605 Ibu 20 157-Shagamu 1,398 69 5033&5053 230,241 0
2215 608 Llobu 17 59-Asajire 1,378 80 257,741 0
2188 60403 Ose 23 1,818 78 305,359 0
2220 610 Oke Awo 10 161-Okeigbo 687 68 339,226 0
2198 60403 Aba 20 1,274 65 339,730 0
2221 614 Bolorunduro 10 810 80 Large 342,557 0
2190 604023_i
Adeniji 25 81-Oyan 941 <1.0 38 377,336 0
2191 604023_i
Egbebi 11 81-Oyan 765 70 391,881 0
2186 604023_i
Igangan 14 81-Oyan 702 50 395,480 0
2216 608 Isaki Igbc 17 66-Erinle(ED
E) 926 54 407,553 0
2210 608 Mobi 11 59-Asajire 758 69 439,118 0
2192 60403 Washinmi 20 79-Opeki 661 <1.0 34 453,579 0
2217 608 Edagun 10 59-Asajire 334 <0.6 33 465,800 0
2201 60403 Elesin 23 756 <1.0 33 469,587 0
2209 606 Opebi 23 90-Eyniwa 734 <0.6 32 514,252 0
2187 60403 Ilora 14 640 <1.0 45 538,031 0
2207 606 Ojo 11 90-Eyniwa 494 <1.0 45 606,277 0
2212 608 Ajekale 22 59-Asajire 743 <0.6 34 642,222 0
2203 60403 Atopa 11 524 48 677,490 0
2214 608 Ijimoba 9 59-Asajire 495 58 717,343 0
2206 606 Olobi 11 90-Eyniwa 549 50 788,160 0
2218 608 Adokanra 12 154-
Ijebu-Igbo/Apoje
291 <0.6 25 799,924 0
2208 606 Bale 11 90-Eyniwa 402 <1.0 37 828,453 0
2197 60403 Akinmorin 11 453 <1.0 41 Large 833,901 0
2204 60401 Cuta 20 300 <0.6 15 926,256 0
2193 60403 Oko 22 79-Opeki 470 <0.6 21 944,847 0
2202 60403 Oyebode 28 447 <0.6 16 1,067,668 0
2195 60403 Eketa 18 460 <0.6 26 1,181,383 0
2196 60403 Agida 11 297 <0.6 27 1,268,786 0
2200 60403 Are Ago 9 249 <0.6 29 1,424,213 0
2199 60403 Alapa 9 228 <0.6 27 1,654,424 0
Note: SN-Dam 2223 and 2222 correspond to disqualification due to land-use condition.

The Project for Review and Update of Nigeria National Water Resources Master Plan
Volume-5, SR5 (SR5-92)
Table SR5.2-20 Selection of dam Irrigation scheme (HA-7)
SN
-Dam
SH
A
Nam
e
Act
ive
Sto
rage
(M
CM
)
Che
ckin
g ex
isti
ng W
ater
Use
P
oint
Irri
gabl
e A
rea
wit
h sa
fety
fa
ctor
(ha
)
Tur
n O
ver
Rat
e (-
)
Eff
icie
ncy
(ha/
MC
M)
Sup
plem
ent f
or E
xist
ing
Irri
gati
on
Sup
plem
ent f
or M
unic
ipal
W
ater
Sup
ply
Set
tlem
ent i
n re
serv
oir
area
Pos
sibl
e ir
riga
tion
are
a
Ann
ual C
ost /
Irri
gati
on a
rea
(Nai
ra/h
a) 1:
adop
tion
0:
disq
uali
fica
tion
2226 70402 Ajide-Eko 52 4,702 91 0 40,129 0
2252 70401 Ubei 41 4,936 119 0 47,227 0
2227 70402 Emezu 70 53-Ishielu/
Ezzilo 8,929 127 5008 74,587 0
2239 704042 Uwebende 34 3,502 102 0 79,233 0
2229 704043 Ombi 27 3,249 119 2000 109,331 1
2250 70402 Ndeaboh 12 1012-Ivo 1,926 164 Ivo 2500 121,011 0
2245 704042 Monaya 9 52-Ogoja 1,466 171 5007 136,282 0
2240 704042 Konshisha 13 1,877 150 1500 153,742 1
2237 704043 Abe 10 1,274 125 1500 156,824 1
2244 704042 Moi 17 111-Ukum 2,288 133 1500 169,801 0
2231 704043 Ogege 17 2,365 138 1000 173,694 1
2247 70402 Ikem 12 105-Isi-Uzo 1,590 136 105 174,526 0
2234 70403 Ogwuawu 9 101-Abakaliki/
Iwa 877 102 1500 202,540 0
2248 70402 Agala 16 1,571 101 2000 204,935 0
2238 704042 Gbumacha 10 1,353 133 1500 205,128 0
2241 704042 Ukyoha 9 1,316 153 219,227 0
2236 70403 Ogbogbo(2) 10 101-Abakaliki/
Iwa 1,126 111 226,767 0
2232 704043 Adam East 12 1,108 95 230,405 0
2230 704043 Ugboba 10 1,086 107 235,004 0
2246 70402 Akpoga 10 105-Isi-Uzo 1,268 125 105 236,404 0
2225 704043 Okete 12 1022-Otukpo 1,259 107 238,039 0
2242 704042 Kaakya 9 1,022 119 271,501 0
2235 70403 Ogbogbo(1) 9 101-Abakaliki/
Iwa 1,019 119 272,322 0
2228 704043 Panbele 7 904 129 306,874 0
2249 70402 Okpoto 9 991 115 313,479 0
2233 704043 Ieheri 9 945 110 340,784 0
2243 704042 Adum 9 896 104 359,250 0
2251 70402 Eneagu 7 801 114 402,049 0
Note: SN-Dam 2247 corresponds to disqualification due to land-use condition.

The Project for Review and Update of Nigeria National Water Resources Master Plan
Volume-5, SR5 (SR5-93)
SR5.3 Other Sectors
SR5.3.1 Flood and Erosion Control and Inland Waterway Navigation
(1) River and Floodplain Features in Nigeria
(1-1) General
Major rivers in Nigeria flow through wide floodplain in a flat valley usually, it is cretaceous sedimentary basin. The river courses position in the lowest part of the flat valley. The floodplain has been formed by the river stage fluctuation provided by rainfall and runoff, as well as marine transgression.
The flow regime is quite seasonal because of the semi-arid or sub-tropical climate and its watershed size. Such characteristics are similar to those of the Nile valley, where traditional floodplain irrigation was popular for agriculture. Also in Nigeria there remained such traditional floodplain irrigation called Fadama along the Niger and Benue and its tributaries. It is understood that in Nigeria it reflects the Nile river civilization through the migration of the Hausa.
Due to the above said river characteristics; the irrigation on floodplain was comparatively easy to make use of river water by minimum structure, so that large scale mechanical irrigation system was not so developed until recently. This indicates a clear contract to the other areas such as the Mesopotamia and the Asian Monsoon in which large scale hydraulic irrigation and strong governance were required earlier.
In Nigeria, labor intensive irrigation has remained until recently due to the above background, and also local governance (government establishment) has only short history. Resultantly, in terms of river water usage as irrigation, engineering approach with large scale structure has not been so developed in local level while water use and land protection are depending on quite local needs in general.
The inland waterway transportation in Nigeria started as the European business in eighteenth century. It is assumed that cities in southeast region were developed recently mainly depending on a few kinds of trading between the European and the inland areas. This background is quite different from that of the Northern area.
In many countries as well as Nigeria, the relation between the river and people has a long history; however, one of the special things in Nigeria is the comparatively short history of the Government involvement in the river management.
(1-2) Main Features of the Rivers in Nigeria
The land of Nigeria is separated into the mountain-highland topography which was bordered by the Niger and Benue river system whose shape has been expressed as Y-shape, and the plain-lowland topography formed by erosion and fluvial sedimentation.
The river system can be categorized into the following three (3) groups.
The Niger river system coming from Niger country and receiving the Sokoto, Kaduna and Benue rivers and emptying the Gulf of Guinea.
The rivers such as the Hadejia-Jama'are and Yedseram rivers, flowing northward and emptying the Lake Chad.
The small scale rivers such as the Ogun, Osun, Ose and Cross rivers emptying the Atlantic Ocean.
The Niger and the Benue rivers are flowing with meandering shape produced by erosion and deposition due to fluvial forces on the flat area composed of sedimentation above the basement rocks.
Table SR5.3-1 shows the list of selected rivers whose longitudinal profiles were prepared in M/P1995 as the major rivers together with the information of the river name, the length in Nigeria and bed slope. Also the Table SR5.3-1 shows the name of HA which those rivers belong to. Their locations and bed slope distribution, which was calculated from SRTM3, are shown in Figure SR5.3-1.
Figure SR5.3-2 and Figure SR5.3-3 show the elevation relief and the prepared cross section lines in the Niger and the Benue rivers. The cross section diagrams are shown in Figure SR5.3-4 and Figure SR5.3-5 based on the SRTM3. In the Niger and Benue rivers, the steep bank lines are quite distinctive

The Project for Review and Update of Nigeria National Water Resources Master Plan
Volume-5, SR5 (SR5-94)
while the width between the exposed basement rocks is very wide such as 20-30 km. In the case of the Niger river (downstream of Jebba dam), the alignment of the rock seems to control the meandering of the channel. The Benue river in the upstream and downstream sections also has the similar tendency as that of the Niger, however the middle stream section has straight floodplain. In the wide floodplain, the area far from the normal river course has higher elevation like point bar (Ex: the right side of section N1 and N3 and the left side of section B3).
Table SR5.3-1 Features of Main Rivers in Nigeria
Figure SR5.3-1 Location of Major Rivers and their bed slope distribution
Internationality River Name connect to at BankLength of theRiver in Nigeria
River Bed Slope
km I II III IV V VI VII VIII
from Niger Niger Sea 1305 1/20,000-1/1,000 ● ● ●
from Cameroon Benue Niger Left 783 1/8,600-1/6,000 ● ●
from Niger(partially) Sokoto-Rima Niger Left 717 1/3,000-1/800 ●
Kaduna Niger Left 608 1/3,600-1/70 ●
Gurara Niger Left 220 1/2,500-1/250 ●
Kampe Niger Right 187 1/780-1/70 ●
Mada Benue Right 274 1/3,900-1/40 ●
Gangola Benue Right 572 1/2,400-1/600 ●
Donga Benue Left 411 1/3,700-1/200 ●
Taraba Benue Left 333 1/5,300-1/50 ●
Katsina Ala Benue Left 208 1/10,000-1/650 ●
Anambra Niger Left 181 1/7,500-1/300 ●
from Cameroon Cross River Sea 350 1/16,000-1/900 ●
Ogun Sea 328 1/1,700-1/400 ●
Oshun Sea 299 1/1,800-1/200 ●
Ofiki Oyan Left 205 1/650 ●
Osse Sea 280 1/2,300-1/320 ●
to Chad Hadejia-Kano Lake Chad Right 976 1/55,000-1/60 ●
to Chad Jama'are Lake Chad Right 1153 1/55,000-1/570 ●
Chalawa Hadejia 179 1/850 ●
to Chad Yedseram Lake Chad 340 1/55,000-1/125 ●
Remark:
HA
The above rivers were tabulated from "Profile of Main River Systems, Water Resources Database Maps , JICA M/P, 1995"The river length in Nigeria and river bed slope were based on the Profile of Main River Systems.
Source: JICA Project Team

The Project for Review and Update of Nigeria National Water Resources Master Plan
Volume-5, SR5 (SR5-95)
Source: JICA Project Team Figure SR5.3-2 Elevation Relief of the Niger (top) and the Benue downstream (bottom)

The Project for Review and Update of Nigeria National Water Resources Master Plan
Volume-5, SR5 (SR5-96)
Source: JICA Project Team Figure SR5.3-3 Elevation Relief of the Benue middle stream (top) and the Benue
upstream (bottom)

The Project for Review and Update of Nigeria National Water Resources Master Plan
Volume-5, SR5 (SR5-97)
Source: JICA Project Team Figure SR5.3-4 Cross Section of Floodplain of Niger River (looking downstream)
50
70
90
110
130
150
170
190
210
230
250
5000 10000 15000 20000 25000 30000 35000
Elevation(m)
Distance from Left Bank(m)
Niger River Cross Section (N1)
50
70
90
110
130
150
170
190
210
230
250
5000 10000 15000 20000 25000 30000 35000
Elevation (m)
Distance from Left Bank(m)
Niger River Cross Section (N2)
40
60
80
100
120
140
160
180
200
220
240
0 5000 10000 15000 20000 25000 30000
Elevation(m)
Distance from Left Bank(m)
Niger River Cross Section (N3)
100
120
140
160
180
200
220
240
260
280
300
0 5000 10000 15000 20000 25000 30000
Elevation(m)
Distance from Left Bank(m)
Benue River Cross Section (B1)

The Project for Review and Update of Nigeria National Water Resources Master Plan
Volume-5, SR5 (SR5-98)
Source: JICA Project Team Figure SR5.3-5 Cross Section of Floodplain of Benue River (looking downstream)
(1-3) Location of Urban Area in Nigeria
There are many Areas having Flat Topography (Figure SR5.3-6). The percentage of lowland whose elevation is below 100m above sea level is 12% of the Nigerian territory according to GIS analysis using SRTM3 (Figure SR5.3-7).
Population living below 10m above sea level is 6% of the total population1. In Nigeria, 70% of the total population is living in higher elevation area than 100 m above sea level (Figure SR5.3-7).
1 In Japan, 30 % of total population is living in below 10 m above sea level.
0
20
40
60
80
100
120
140
160
180
200
0 5000 10000 15000 20000 25000 30000
Elevation(m)
Distance from Left Bank(m)
Benue River Cross Section (B3)
0
20
40
60
80
100
120
140
160
180
200
0 5000 10000 15000 20000 25000 30000
Elevation(m)
Distance from Left Bank(m)
Benue River Cross Section (B5)
0
20
40
60
80
100
120
140
160
180
200
2000 7000 12000 17000 22000 27000 32000
Elevation(m)
Distance from Left Bank(m)
Benue River Cross Section (B7)

Figure S
Source: JIC
Nigeria hhistoricalocation in order
The typeType A: Type B:
Type C:
The folloand Deltlisted up
SR5.3-6
CA Project Tea
Figure SR5
has a vast teal backgrounfeatures, espto study the
e of location Located alonLocated on rivers
Located alon
owing table ta State, ther
p.
Source: JICA
Contour L100 m abo
am
5.3-7 Ver
erritory havinnd, cities arepecially on thdirection of
feature was ng the majorwatershed d
ng the river b
summarizesre are other s
A Project Team
Line of 200 ove sea level
rtical Distrib
ng of 930,00located sep
he distance fflood contro
considered ar river divide (SHA b
bank of the d
s the locationsubstantial m
m
(SR5-99)
m Interval l)
bution of La
00km2. And parated-evenlfrom river inol measures (
as follows,
boundary) an
delta.
n features fomajor cities w
Niger
in Nigeria (
and Area and
due to the coly. JICA Pro
n capital city (potential flo
nd/or higher
or each Statewithin the St
The Project ia National Wat
(The lowest
d Population
omparativelyoject Team tr
of each Statod problems
place with e
capital and tate, therefor
for Review andater Resources M
Volu
contour ele
n in Nigeria
y flat topogrried to categte and FCT ins) for each ci
enough dista
FCT. For Are totally 39
d Update of Master Plan
me-5, SR5
evation is
a
raphy and gorize the n Nigeria ity .
ance from
Abia State cities are
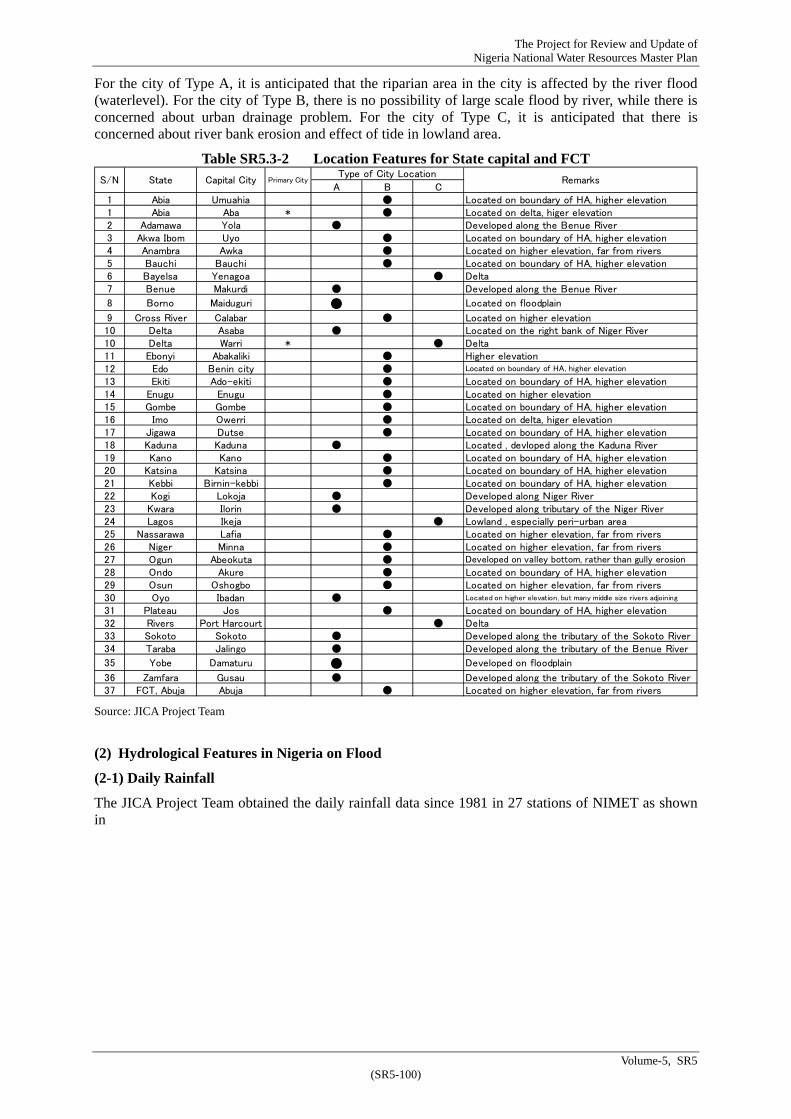
The Project for Review and Update of Nigeria National Water Resources Master Plan
Volume-5, SR5 (SR5-100)
For the city of Type A, it is anticipated that the riparian area in the city is affected by the river flood (waterlevel). For the city of Type B, there is no possibility of large scale flood by river, while there is concerned about urban drainage problem. For the city of Type C, it is anticipated that there is concerned about river bank erosion and effect of tide in lowland area.
Table SR5.3-2 Location Features for State capital and FCT
Source: JICA Project Team
(2) Hydrological Features in Nigeria on Flood
(2-1) Daily Rainfall
The JICA Project Team obtained the daily rainfall data since 1981 in 27 stations of NIMET as shown in
A B C1 Abia Umuahia ● Located on boundary of HA, higher elevation1 Abia Aba * ● Located on delta, higer elevation 2 Adamawa Yola ● Developed along the Benue River3 Akwa Ibom Uyo ● Located on boundary of HA, higher elevation4 Anambra Awka ● Located on higher elevation, far from rivers5 Bauchi Bauchi ● Located on boundary of HA, higher elevation6 Bayelsa Yenagoa ● Delta7 Benue Makurdi ● Developed along the Benue River
8 Borno Maiduguri ● Located on floodplain
9 Cross River Calabar ● Located on higher elevation10 Delta Asaba ● Located on the right bank of Niger River10 Delta Warri * ● Delta11 Ebonyi Abakaliki ● Higher elevation12 Edo Benin city ● Located on boundary of HA, higher elevation
13 Ekiti Ado-ekiti ● Located on boundary of HA, higher elevation14 Enugu Enugu ● Located on higher elevation15 Gombe Gombe ● Located on boundary of HA, higher elevation16 Imo Owerri ● Located on delta, higer elevation 17 Jigawa Dutse ● Located on boundary of HA, higher elevation18 Kaduna Kaduna ● Located , devloped along the Kaduna River19 Kano Kano ● Located on boundary of HA, higher elevation20 Katsina Katsina ● Located on boundary of HA, higher elevation21 Kebbi Birnin-kebbi ● Located on boundary of HA, higher elevation22 Kogi Lokoja ● Developed along Niger River23 Kwara Ilorin ● Developed along tributary of the Niger River24 Lagos Ikeja ● Lowland , especially peri-urban area25 Nassarawa Lafia ● Located on higher elevation, far from rivers26 Niger Minna ● Located on higher elevation, far from rivers27 Ogun Abeokuta ● Developed on valley bottom, rather than gully erosion
28 Ondo Akure ● Located on boundary of HA, higher elevation29 Osun Oshogbo ● Located on higher elevation, far from rivers30 Oyo Ibadan ● Located on higher elevation, but many middle size rivers adjoining
31 Plateau Jos ● Located on boundary of HA, higher elevation32 Rivers Port Harcourt ● Delta33 Sokoto Sokoto ● Developed along the tributary of the Sokoto River34 Taraba Jalingo ● Developed along the tributary of the Benue River
35 Yobe Damaturu ● Developed on floodplain
36 Zamfara Gusau ● Developed along the tributary of the Sokoto River37 FCT, Abuja Abuja ● Located on higher elevation, far from rivers
S/N State Capital City Primary CityType of City Location
Remarks

The Project for Review and Update of Nigeria National Water Resources Master Plan
Volume-5, SR5 (SR5-101)
Table SR5.3-3. The locations of those 27 stations are shown in Figure SR5.3-8.

The Project for Review and Update of Nigeria National Water Resources Master Plan
Volume-5, SR5 (SR5-102)
Table SR5.3-3 List of Collected Rainfall Station of NIMET and their Data Collected Period
Source: JICA Project Team
Source: JICA Project Team
Figure SR5.3-8 Location Map of NIMET Station
The JICA Project Team calculated probable rainfall amount for 1 day and 3 days rainfall for the 27 stations.
The applied probable distribution is as follows,
1. Exponential Distribution Exp 2. Gumbel Distribution Gumbel 3. Square root Exponential Maximum Distribution SqrtEt 4. Generalized Extreme Value Distribution Gev 5. Log Pearson Type III Distribution Real LP3Rs 6. Log Pearson Type III Distribution Log LogP3 7. Iwai Method 8. Ishihara Takase IshiTaka 9. Log Normal 3 parameters Quantile LN3Q
Station Name StateData Collected
PeriodNumber of
YearsStation Name State
Data CollectedPeriod
Number ofYears
1 Yola Adamawa 1981-2010 30 15 Katsina Katsina 1981-2010 302 Bauchi Bauchi 1981-2010 30 16 Yelwa Kebbi 1981-2010 303 Makurdi Benue 1981-2010 30 17 Lokoja Kogi 1981-2010 304 Maiduguri Borno 1981-2010 30 18 Ilorin Kwara 1981-2010 305 Calbar Cross River 1981-2010 30 19 Minna Niger 1981-2010 306 Ikom Cross River 1981-2010 30 20 Abeokuta Ogun 1981-2010 307 Ogoja Cross River 1981-2010 30 21 Akure Ondo 1980-2010 318 Warri Delta 1981-2010 30 22 Ibadan Oyo 1981-2010 309 Benin Edo 1981-2010 30 23 Jos Plateau 1981-2010 3010 Enugu Enugu 1981-2010 30 24 PHC Rivers 1981-2010 3011 Abuja FCT 1982-2010 29 25 Sokoto Sokoto 1981-2010 3012 Ikeja Lagos 1981-2010 30 26 Ibi Taraba 1981-2010 3013 Owerri Imo 1981-2010 30 27 Nguru Yobe 1981-2010 3014 Kaduna Kaduna 1981-2010 30
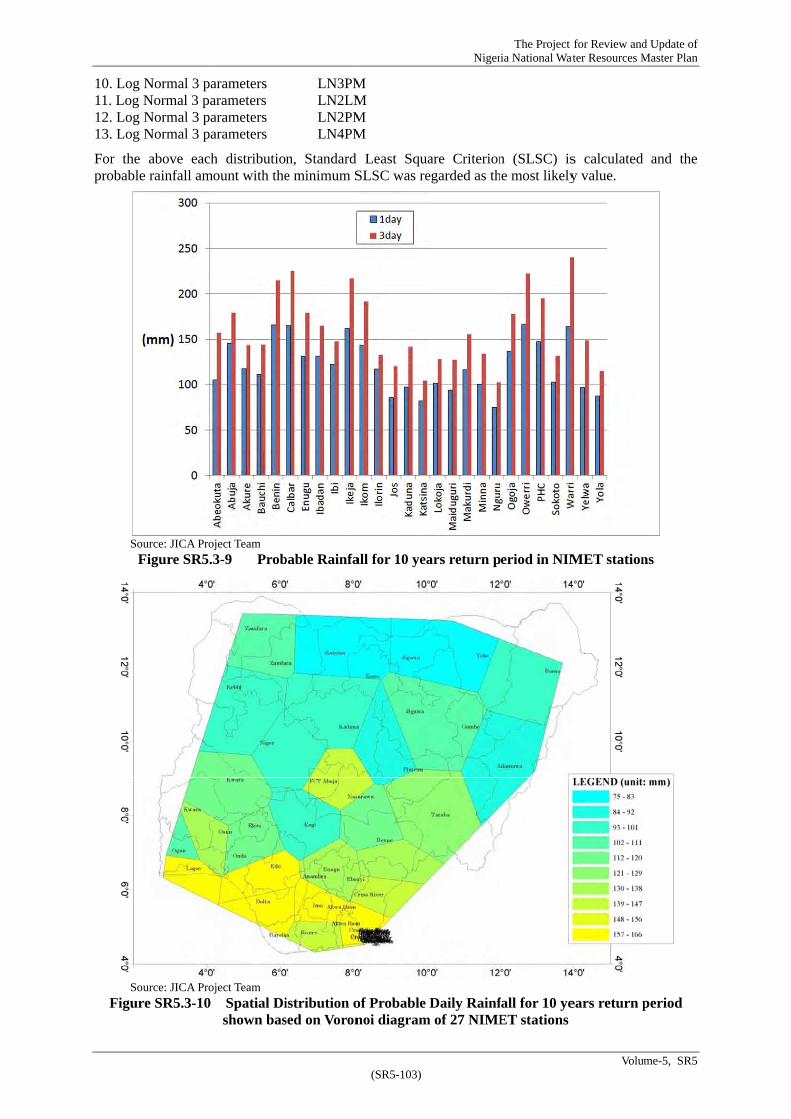
10. Log 11. Log N12. Log 13. Log
For the probable
SouF
SouFigur
Normal 3 paNormal 3 paNormal 3 paNormal 3 pa
above eache rainfall amo
urce: JICA ProjFigure SR5.3
urce: JICA Projre SR5.3-10
arameters arameters arameters arameters
h distributioount with the
ject Team 3-9 Prob
ject Team Spatial Dishown bas
LN3PMLN2LMLN2PMLN4PM
n, Standard e minimum S
bable Rainfa
istribution osed on Voron
(SR5-103)
M M M M
Least SquaSLSC was re
all for 10 yea
of Probable noi diagram
Niger
are Criterionegarded as th
ars return p
Daily Rainfm of 27 NIME
The Project ia National Wat
n (SLSC) ishe most likely
eriod in NIM
fall for 10 yeET stations
for Review andater Resources M
Volu
s calculated y value.
MET station
ears return p
d Update of Master Plan
me-5, SR5
and the
ns
period

The Project for Review and Update of Nigeria National Water Resources Master Plan
Volume-5, SR5 (SR5-104)
The 1 day and 3 days probable rainfall for 10 years return period of 27 stations are shown in Figure SR5.3-9. The spatial distribution in the case of 1 day rainfall for 10 years return period is illustrated in Figure SR5.3-10 based on Voronoi diagram. In general, the areas along the coastal line have high rainfall intensity. The States located in north of the Niger and Benue rivers have relatively low rainfall except FCT (Abuja).
Table SR5.3-4 Probable Rainfall Amount for 1-Day Rainfall in NIMET Stations
Source: JICA Project Team
Table SR5.3-5 Probable Rainfall Amount for 3-Day Rainfall in NIMET Stations
Source: JICA Project Team
(3) National Polices on Flood and Erosion Control and Inland Waterway Navigation
When the Federal Ministry of Environment was created, the role on erosion control and flood control of the Federal Ministry of Water Resources was transferred to FME with its department. Consequently the countermeasures of erosion and flood control which was proposed in M/P1995 has been mostly implemented by FME as the materialization of the National Policy on the Environment in 1998.
(3-1) Policy on Flood and Erosion Control (National and State)
National Policy on the Environment (1998)
The National Policy on the Environment (1998), there are over 2,000 sites of active gully erosion to be controlled properly. The policy states that the following interventions are necessary.
For flooding it will be necessary to
400 200 150 100 80 50 30 20 10 5 3 2 1.5 1.234 Abeokuta Ogun 1981 30 174.9 161.9 156.5 148.9 144.7 135.8 126.1 118.4 104.9 90.9 79.7 69.7 61.1 51.9 Gumbel 0.02318 Abuja FCT 1982 29 258.3 237.4 228.8 216.5 209.8 195.5 179.9 167.5 145.8 123.2 105.3 89.1 75.3 60.6 Gumbel 0.03836 Akure Ondo 1979 32 260.1 224.6 211.3 193.8 184.8 167.1 149.8 137.2 117.8 100.4 88.5 78.9 71.6 64.5 Gev 0.0365 Bauchi Bauchi 1941 70 188.0 173.8 167.9 159.5 154.9 145.2 134.6 126.1 111.3 95.9 83.7 72.7 63.2 53.2 Gumbel 0.023
15 Benin Edo 1942 69 325.4 292.1 278.7 260.4 250.5 230.2 209.0 192.7 165.8 139.8 120.5 104.3 91.2 78.1 SqrtEto 0.033
9 Calbar Cross River 1941 70 256.3 239.4 232.4 222.5 217.0 205.5 192.9 182.8 165.3 147.0 132.5 119.4 108.2 96.3 Gumbel 0.04517 Enugu Enugu 1941 70 226.2 206.9 199.1 188.3 182.5 170.5 157.8 147.9 131.3 114.8 102.2 91.3 82.2 72.8 Gev 0.03339 Ibadan Oyo 1907 104 470.3 364.6 328.5 284.3 262.8 223.3 187.8 164.3 131.6 106.1 90.7 79.6 71.8 65.0 Gev 0.03445 Ibi Taraba 1948 63 171.8 164.3 161.0 156.1 153.3 147.1 139.9 133.7 122.3 109.1 97.8 86.8 76.7 65.4 Gev 0.02220 Ikeja Lagos 1955 56 302.9 274.8 263.4 247.5 238.9 221.0 201.8 186.9 161.6 136.0 116.4 99.1 84.7 69.7 Gev 0.033
10 Ikom Cross River 1972 39 233.8 216.9 209.9 200.0 194.6 183.1 170.5 160.4 143.0 124.7 110.2 97.2 86.0 74.1 Gumbel 0.02329 Ilorin Kwara 1946 65 159.5 153.3 150.5 146.3 143.9 138.6 132.4 127.0 116.9 105.1 94.8 84.8 75.5 64.9 Gev 0.02442 Jos Plateau 1979 32 144.3 133.3 128.8 122.3 118.8 111.3 103.2 96.8 85.8 74.8 66.7 60.3 55.7 52.1 Exp 0.03023 Kaduna Kaduna 1941 70 179.7 164.3 157.9 148.9 144.0 133.5 122.1 113.1 97.7 82.3 70.9 61.9 55.5 50.5 Exp 0.03525 Katsina Katsina 1941 70 186.2 162.3 153.1 140.8 134.3 121.3 108.0 98.1 82.3 67.5 56.9 48.1 41.0 34.1 Gev 0.045
28 Lokoja Kogi 1942 69 142.0 135.1 132.2 128.0 125.7 120.6 114.8 110.1 101.6 92.4 84.8 77.7 71.4 64.5 Gev 0.0458 Maiduguri Borno 1951 60 161.5 148.9 143.7 136.3 132.3 123.7 114.3 106.8 93.8 80.2 69.4 59.7 51.4 42.6 Gumbel 0.0357 Makurdi Benue 1942 69 187.8 174.6 169.1 161.3 157.0 148.0 138.1 130.2 116.5 102.2 90.8 80.5 71.8 62.4 Gumbel 0.020
31 Minna Niger 1936 75 121.7 119.1 117.9 116.0 114.9 112.3 109.1 106.2 100.4 93.1 86.2 79.1 72.1 63.8 Gev 0.02646 Nguru Yobe 1969 42 178.6 152.9 143.3 130.7 124.1 111.3 98.6 89.3 75.0 62.2 53.3 46.2 40.7 35.4 Gev 0.032
11 Ogoja Cross River 1976 35 250.1 226.6 217.1 204.2 197.2 182.8 167.7 156.0 136.5 117.3 102.8 90.2 79.9 69.2 Gev 0.02421 Owerri Imo 1974 37 240.8 229.5 224.5 217.1 212.9 203.6 192.7 183.5 166.4 146.7 129.8 113.4 98.4 81.6 Gev 0.02443 PHC Rivers 1941 70 232.4 216.6 210.0 200.7 195.6 184.8 173.0 163.6 147.2 130.1 116.5 104.3 93.8 82.7 Gumbel 0.02444 Sokoto Sokoto 1943 68 211.3 187.1 177.7 164.9 158.1 144.4 130.4 119.8 102.7 86.4 74.4 64.4 56.4 48.3 Gev 0.02213 Warri Delta 1949 62 249.5 233.6 227.0 217.7 212.5 201.7 189.8 180.3 163.9 146.7 133.0 120.7 110.2 99.0 Gumbel 0.029
27 Yelwa Kebbi 1943 68 120.8 118.0 116.7 114.6 113.4 110.5 106.9 103.6 96.9 88.4 80.3 71.8 63.4 53.3 Gev 0.0263 Yola Adamawa 1942 69 138.2 128.7 124.8 119.2 116.2 109.7 102.6 97.0 87.2 76.9 68.8 61.4 55.1 48.5 Gumbel 0.045
StationNoReturn Period in Year
Dist. SLSCYear of
ExistenceYear of
EstablishmentState
400 200 150 100 80 50 30 20 10 5 3 2 1.5 1.234 Abeokuta Ogun 1981 30 362.4 312.1 293.1 268.1 255.1 229.6 204.3 185.9 157.2 131.3 113.2 98.8 87.5 76.6 Gev 0.03418 Abuja FCT 1982 29 281.1 263.6 256.2 245.5 239.5 226.6 212.1 200.2 178.8 155.7 136.5 118.8 103.1 86.0 Gev 0.02336 Akure Ondo 1979 32 189.8 182.7 179.6 175.0 172.3 166.5 159.8 154.1 143.5 131.4 121.0 111.0 101.9 91.6 Gev 0.0435 Bauchi Bauchi 1941 70 256.0 232.9 223.6 210.8 203.9 189.7 174.7 163.1 143.8 124.9 110.8 98.7 88.9 79.0 SqrtEto 0.026
15 Benin Edo 1942 69 290.5 279.6 274.7 267.4 263.2 253.8 242.6 233.0 214.6 193.1 174.1 155.3 137.9 117.9 Gev 0.027
9 Calbar Cross River 1941 70 294.0 283.7 279.1 272.4 268.5 260.0 250.0 241.5 225.5 207.2 191.2 175.8 161.6 145.6 Gev 0.03817 Enugu Enugu 1941 70 354.7 311.8 295.7 274.3 263.2 241.3 219.6 203.7 179.0 156.6 140.9 128.3 118.5 109.0 Gev 0.02139 Ibadan Oyo 1907 104 442.5 367.3 340.1 305.1 287.5 253.6 221.3 198.6 164.7 135.9 116.9 102.3 91.3 81.1 Gev 0.02945 Ibi Taraba 1948 63 236.2 219.7 212.9 203.2 197.9 186.6 174.3 164.5 147.4 129.6 115.4 102.6 91.7 80.1 Gumbel 0.04120 Ikeja Lagos 1955 56 449.4 398.9 379.0 351.9 337.5 308.1 277.8 254.7 216.9 180.5 153.6 130.8 112.3 93.6 Gev 0.024
10 Ikom Cross River 1972 39 265.9 254.2 249.1 241.6 237.3 228.0 217.3 208.3 191.8 173.3 157.4 142.4 128.8 113.7 Gev 0.03329 Ilorin Kwara 1946 65 156.7 154.0 152.8 150.7 149.5 146.6 142.9 139.5 132.5 123.3 114.3 104.7 95.1 83.3 Gev 0.03442 Jos Plateau 1979 32 204.7 186.3 179.1 169.2 164.0 153.4 142.4 134.0 120.3 107.2 97.5 89.2 82.6 75.8 Gev 0.02623 Kaduna Kaduna 1941 70 335.0 283.4 264.6 240.4 228.2 204.5 181.9 165.9 141.9 121.3 107.6 97.0 89.0 81.5 Gev 0.03325 Katsina Katsina 1941 70 221.2 196.5 186.7 173.1 165.9 151.1 135.6 123.8 104.4 85.8 72.1 60.8 51.7 42.8 SqrtEto 0.029
28 Lokoja Kogi 1942 69 189.9 178.5 173.7 167.0 163.3 155.5 146.9 140.1 128.2 115.8 106.0 97.1 89.5 81.5 Gumbel 0.0348 Maiduguri Borno 1951 60 246.0 222.2 212.6 199.3 192.1 177.1 161.1 148.7 127.6 106.5 90.2 76.1 64.2 51.9 Gev 0.0297 Makurdi Benue 1942 69 234.1 220.8 215.2 207.0 202.3 192.4 181.1 171.9 155.1 136.9 121.7 107.5 95.0 81.2 Gev 0.042
31 Minna Niger 1936 75 202.0 189.1 183.8 176.3 172.1 163.5 154.1 146.6 133.7 120.3 109.8 100.4 92.4 83.9 Gev 0.03446 Nguru Yobe 1969 42 223.9 196.5 185.9 171.6 164.0 148.8 133.3 121.6 102.8 85.1 72.2 61.4 52.8 44.3 Gev 0.021
11 Ogoja Cross River 1976 35 255.0 242.5 237.0 229.1 224.7 215.0 203.9 194.7 178.0 159.4 143.8 129.2 116.1 101.6 Gev 0.02221 Owerri Imo 1974 37 353.7 329.4 319.2 305.0 297.1 280.5 262.3 247.8 222.6 196.3 175.3 156.5 140.4 123.2 Gumbel 0.03243 PHC Rivers 1941 70 322.0 296.1 285.7 271.3 263.5 247.4 230.3 217.1 194.9 173.1 156.5 142.3 130.6 118.7 SqrtEto 0.03244 Sokoto Sokoto 1943 68 349.7 291.4 270.2 242.9 229.0 202.4 176.8 158.7 131.7 108.4 93.0 81.0 72.0 63.6 Gev 0.03613 Warri Delta 1949 62 327.3 313.7 307.8 299.0 294.1 283.1 270.5 259.8 240.1 217.7 198.6 180.3 163.6 145.0 Gev 0.032
27 Yelwa Kebbi 1943 68 315.7 277.9 263.2 243.4 233.0 212.0 190.7 174.6 148.9 124.6 107.0 92.4 80.8 69.1 Gev 0.0383 Yola Adamawa 1942 69 128.2 127.2 126.6 125.7 125.2 123.7 121.7 119.7 115.1 108.2 100.5 91.4 81.5 68.1 Gev 0.024
Dist. SLSCNo Station StateYear of
EstablishmentYear of
Existence
Return Period in Year

The Project for Review and Update of Nigeria National Water Resources Master Plan
Volume-5, SR5 (SR5-105)
Enforce compliance with planning/urban laws/edicts Build embankments and levees along rivers and coastline prone flood Establish rainstorm early warning system Establish and monitor weather stations, river and tidal gauges Ensure appropriate management of dams Ensure proper maintenance of existing urban drainage channels Enforce environmental sanitation laws in towns and cities
For soil and coastal erosion it will be necessary to
Prepare and implement a comprehensive national policy on soil and coastal erosion and flood control
Formulate and enforce regulations for soil and water conservation especially in erosion-prone areas
Carry put national watershed delineation and characterization for use as basis for development of an aggressive management and enforcement program me to protect and maintain the quality of the nation’s lands water and coastal resources and implement the programs
Prepare periodic master plan on the management of soil and coastline erosion and flood, and advise the Federal Government and the financial requirements for the implementation of such plans
Carry out feasibility and scientific studies on soil erosion and related flood problems for the design of appropriate integrated remedial control measures
Carry out public enlightenment campaigns on environmental degradation arising from poor land and water management practices
Provide and promote training on environmental issues as they relate to flood, erosion, land degradation and water conservation
Promote integrated ecosystem management with other agencies connected with agriculture, land use, soil and water conservation, rural development and coastal resources management including environmentally sound recreational use
Strengthen national capacity through personal development, provision of training facilities and research on combating climate-related ecological problems
Strengthen capacity of the Environmental Management Support System (EMSS) for Remote Sensing data gathering. GIS facilities and development of disaster environment data bank
Support agro-forestry and integrated Coastal Zone Management Encourage planted fallow in abandoned farmland using soil enriching species Promote conservation farming and use of organic fertilizer and soil conditioners. Establish viable contingency plans for tackling socio-economic and other problems resulting
from coastal and other erosional disasters.
Water Resources Strategy 2006 by Atkins describes about FLOOD MANAGEMENT in Nigeria as follows.
Article 1.37. It appears that floods in Nigeria are treated as “acts of God” seemingly even a collapse of a dam falling under such definition. The effects of human activities in causing such events have not been fully considered. A great deal can be done to prevent floods occurring or, in the event of them being unavoidable, mitigating the impact of the flooding. This is especially true if there are upstream dams that can be managed to absorb flood flows; but even if there are no dams, flood prevention through river training, the building of embankments and the prohibition of building on flood plains can minimize loss of life and property.
Vision 20: 2020 by National Planning Commission states as follows,
Flooding is becoming a more severe phenomenon in many parts of Nigeria, aggravated by human activities such as poor land use and watershed management practices, unplanned rapid urbanization, blockage of river/drainage channels, land clearing for agricultural purposes and deforestation. The most flood prone areas in Nigeria includes (I) low-lying coastal areas of southern Nigeria where annual rainfall is heavy, (ii) the floodplains of major rivers such as the Niger, Benue, Gongola, Sokoto, Hadejia, Katsina-Ala, Donga, Kaduna, Urara, Ogun and Anambra, etc, (iii) the flat, low-lying areas around Lake Chad. In addition many urban centers including Dutse, Enugu, Ibadan, Kaduna, Kano, Lagos, Maiduguri, Onitsha, Owerri, Port Harcourt, and Sokoto now experience more frequent floods.
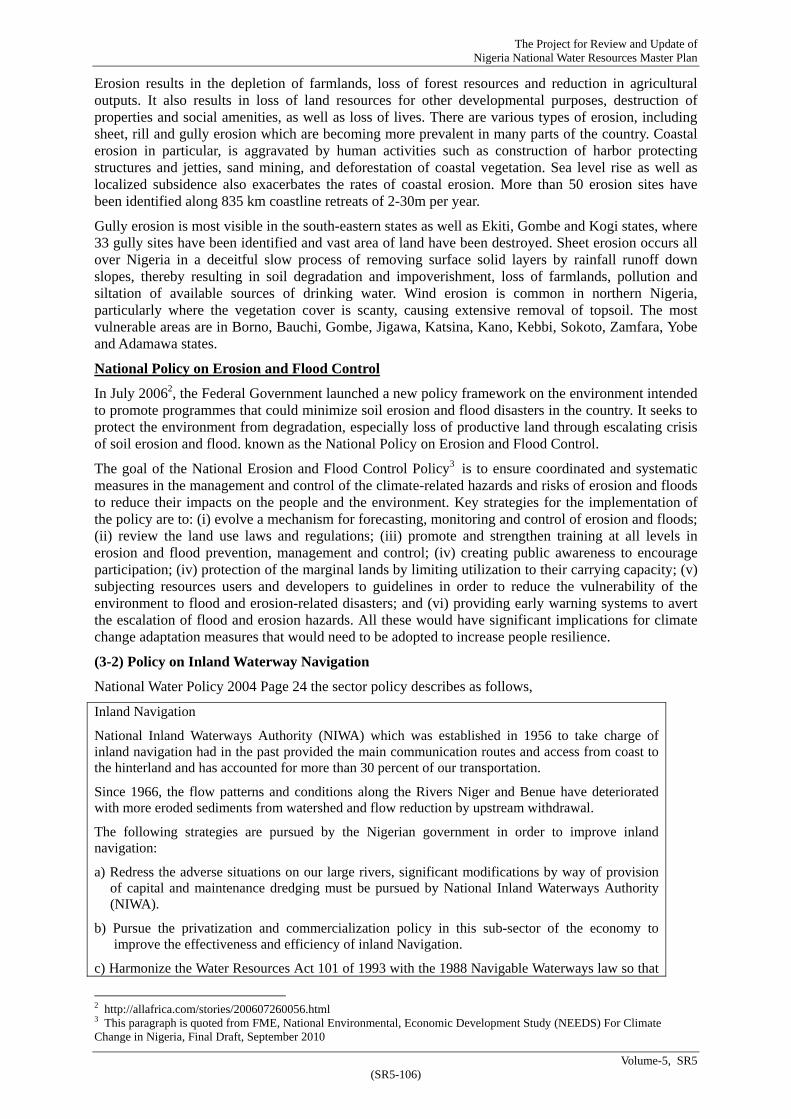
The Project for Review and Update of Nigeria National Water Resources Master Plan
Volume-5, SR5 (SR5-106)
Erosion results in the depletion of farmlands, loss of forest resources and reduction in agricultural outputs. It also results in loss of land resources for other developmental purposes, destruction of properties and social amenities, as well as loss of lives. There are various types of erosion, including sheet, rill and gully erosion which are becoming more prevalent in many parts of the country. Coastal erosion in particular, is aggravated by human activities such as construction of harbor protecting structures and jetties, sand mining, and deforestation of coastal vegetation. Sea level rise as well as localized subsidence also exacerbates the rates of coastal erosion. More than 50 erosion sites have been identified along 835 km coastline retreats of 2-30m per year.
Gully erosion is most visible in the south-eastern states as well as Ekiti, Gombe and Kogi states, where 33 gully sites have been identified and vast area of land have been destroyed. Sheet erosion occurs all over Nigeria in a deceitful slow process of removing surface solid layers by rainfall runoff down slopes, thereby resulting in soil degradation and impoverishment, loss of farmlands, pollution and siltation of available sources of drinking water. Wind erosion is common in northern Nigeria, particularly where the vegetation cover is scanty, causing extensive removal of topsoil. The most vulnerable areas are in Borno, Bauchi, Gombe, Jigawa, Katsina, Kano, Kebbi, Sokoto, Zamfara, Yobe and Adamawa states.
National Policy on Erosion and Flood Control
In July 20062, the Federal Government launched a new policy framework on the environment intended to promote programmes that could minimize soil erosion and flood disasters in the country. It seeks to protect the environment from degradation, especially loss of productive land through escalating crisis of soil erosion and flood. known as the National Policy on Erosion and Flood Control.
The goal of the National Erosion and Flood Control Policy3 is to ensure coordinated and systematic measures in the management and control of the climate-related hazards and risks of erosion and floods to reduce their impacts on the people and the environment. Key strategies for the implementation of the policy are to: (i) evolve a mechanism for forecasting, monitoring and control of erosion and floods; (ii) review the land use laws and regulations; (iii) promote and strengthen training at all levels in erosion and flood prevention, management and control; (iv) creating public awareness to encourage participation; (iv) protection of the marginal lands by limiting utilization to their carrying capacity; (v) subjecting resources users and developers to guidelines in order to reduce the vulnerability of the environment to flood and erosion-related disasters; and (vi) providing early warning systems to avert the escalation of flood and erosion hazards. All these would have significant implications for climate change adaptation measures that would need to be adopted to increase people resilience.
(3-2) Policy on Inland Waterway Navigation
National Water Policy 2004 Page 24 the sector policy describes as follows,
Inland Navigation
National Inland Waterways Authority (NIWA) which was established in 1956 to take charge of inland navigation had in the past provided the main communication routes and access from coast to the hinterland and has accounted for more than 30 percent of our transportation.
Since 1966, the flow patterns and conditions along the Rivers Niger and Benue have deteriorated with more eroded sediments from watershed and flow reduction by upstream withdrawal.
The following strategies are pursued by the Nigerian government in order to improve inland navigation:
a) Redress the adverse situations on our large rivers, significant modifications by way of provision of capital and maintenance dredging must be pursued by National Inland Waterways Authority (NIWA).
b) Pursue the privatization and commercialization policy in this sub-sector of the economy to improve the effectiveness and efficiency of inland Navigation.
c) Harmonize the Water Resources Act 101 of 1993 with the 1988 Navigable Waterways law so that
2 http://allafrica.com/stories/200607260056.html 3 This paragraph is quoted from FME, National Environmental, Economic Development Study (NEEDS) For Climate Change in Nigeria, Final Draft, September 2010

The Project for Review and Update of Nigeria National Water Resources Master Plan
Volume-5, SR5 (SR5-107)
there is no overlapping of responsibilities of Federal Ministry of Water Resources with those of NIWA.
d) Carry out studies on the Lower Niger River so as to provide barges for navigability of the Lower Niger Area.
e) Undertake River channel management including hydrological and morphological observation and study to a limited extent for the dredging of local critical parts and bed - regulations by groynes, training walls and bank stabilization for difficult crossings and flats.
f) Establish discharge regulations from Jebba and Shiroro dams, under the management of NEPA in cooperation with Federal Ministry of Water Resources.
(3-3) Institutional Arrangement on Flood and Erosion Control
The present institutional arrangement on flood and erosion control is shown in Table SR5.3-6. In reality, most and major activities of these sectors are implemented by Federal Ministry of Environment and State governments as urban environment improvement administration. FMWR is in charge of release of dam under her jurisdiction and flood/erosion control in related to her large scale irrigation projects. Figure SR5.3-11 is the schematic image on the present institutional arrangement on flood and erosion control.
Table SR5.3-6 Present Institutional Arrangement on Flood Control and Erosion Control Institution Flood Control Erosion Control
Federal Ministry of Environment
Main Ministry Development and operation of Flood Early Warning for local area
Implementation of nationwide program on erosion control as a part of watershed management Implementation of structure measures in some local areas
Federal Ministry of Water Resources
Main Ministry Operation of multi-purpose dam
RBDA Implementation of structure measures mainly related to agricultural facility
Implementation of structure measures mainly related to agricultural facility
NIHSA Hydrological Monitoring State Governments
Environmental Management section
Implementation of structure measures
Implementation of structure measures
Source: JICA Project Team
Figure SR5.3-11 Schematic Image on Present Institutional Arrangement on Flood Control and Erosion Control
Flood Control
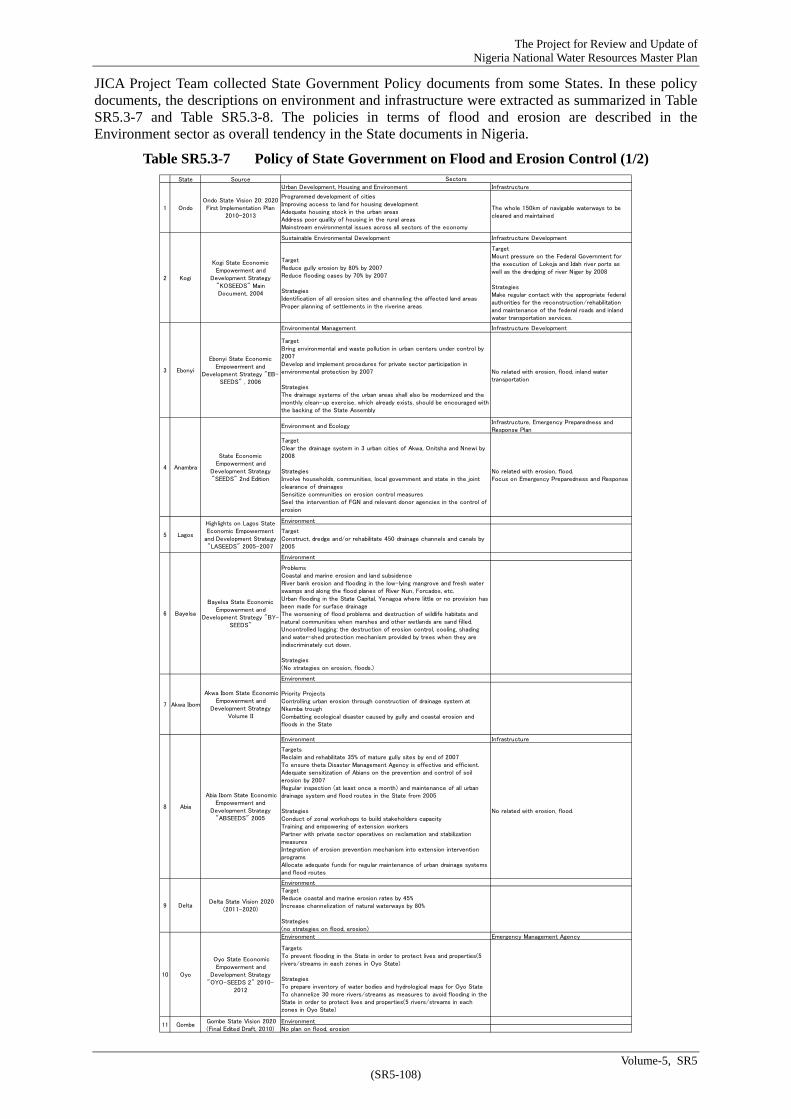
The Project for Review and Update of Nigeria National Water Resources Master Plan
Volume-5, SR5 (SR5-108)
JICA Project Team collected State Government Policy documents from some States. In these policy documents, the descriptions on environment and infrastructure were extracted as summarized in Table SR5.3-7 and Table SR5.3-8. The policies in terms of flood and erosion are described in the Environment sector as overall tendency in the State documents in Nigeria.
Table SR5.3-7 Policy of State Government on Flood and Erosion Control (1/2)
State SourceUrban Development, Housing and Environment Infrastructure
Programmed development of citiesImproving access to land for housing developmentAdequate housing stock in the urban areasAddress poor quality of housing in the rural areasMainstream environmental issues across all sectors of the economy
The whole 150km of navigable waterways to becleared and maintained
Sustainable Environmental Development Infrastructure Development
TargetReduce gully erosion by 80% by 2007Reduce flooding cases by 70% by 2007
StrategiesIdentification of all erosion sites and channeling the affected land areasProper planning of settlements in the riverine areas
TargetMount pressure on the Federal Government forthe execution of Lokoja and Idah river ports aswell as the dredging of river Niger by 2008
StrategiesMake regular contact with the appropriate federalauthorities for the reconstruction/rehabilitationand maintenance of the federal roads and inlandwater transportation services.
Environmental Management Infrastructure Development
TargetBring environmental and waste pollution in urban centers under control by2007Develop and implement procedures for private sector participation inenvironmental protection by 2007
StrategiesThe drainage systems of the urban areas shall also be modernized and themonthly clean-up exercise, which already exists, should be encouraged withthe backing of the State Assembly
No related with erosion, flood, inland watertransportation
Environment and EcologyInfrastructure, Emergency Preparedness andResponse Plan
TargetClear the drainage system in 3 urban cities of Akwa, Onitsha and Nnewi by2008
StrategiesInvolve households, communities, local government and state in the jointclearance of drainagesSensitize communities on erosion control measuresSeel the intervention of FGN and relevant donor agencies in the control oferosion
No related with erosion, flood.Focus on Emergency Preparedness and Response
Environment
TargetConstruct, dredge and/or rehabilitate 450 drainage channels and canals by2005
Environment
ProblemsCoastal and marine erosion and land subsidenceRiver bank erosion and flooding in the low-lying mangrove and fresh waterswamps and along the flood planes of River Nun, Forcados, etc.Urban flooding in the State Capital, Yenagoa where little or no provision hasbeen made for surface drainageThe worsening of flood problems and destruction of wildlife habitats andnatural communities when marshes and other wetlands are sand filled.Uncontrolled logging: the destruction of erosion control, cooling, shadingand water-shed protection mechanism provided by trees when they areindiscriminately cut down.
Strategies(No strategies on erosion, floods.)
Environment
Priority ProjectsControlling urban erosion through construction of drainage system atNkemba troughCombatting ecological disaster caused by gully and coastal erosion andfloods in the State
Environment Infrastructure
TargetsReclaim and rehabilitate 35% of mature gully sites by end of 2007To ensure theta Disaster Management Agency is effective and efficient.Adequate sensitization of Abians on the prevention and control of soilerosion by 2007Regular inspection (at least once a month) and maintenance of all urbandrainage system and flood routes in the State from 2005
StrategiesConduct of zonal workshops to build stakeholders capacityTraining and empowering of extension workersPartner with private sector operatives on reclamation and stabilizationmeasuresIntegration of erosion prevention mechanism into extension interventionprogramsAllocate adequate funds for regular maintenance of urban drainage systemsand flood routes
No related with erosion, flood.
EnvironmentTargetReduce coastal and marine erosion rates by 45%Increase channelization of natural waterways by 80%
Strategies(no strategies on flood, erosion)Environment Emergency Management Agency
TargetsTo prevent flooding in the State in order to protect lives and properties(5rivers/streams in each zones in Oyo State)
StrategiesTo prepare inventory of water bodies and hydrological maps for Oyo StateTo channelize 30 more rivers/streams as measures to avoid flooding in theState in order to protect lives and properties(5 rivers/streams in eachzones in Oyo State)
EnvironmentNo plan on flood, erosion
Sectors
OndoOndo State Vision 20: 2020First Implementation Plan
2010-2013
Kogi
Kogi State EconomicEmpowerment and
Development Strategy"KOSEEDS" MainDocument, 2004
Ebonyi
Ebonyi State EconomicEmpowerment and
Development Strategy "EB-SEEDS" , 2006
Anambra
State EconomicEmpowerment and
Development Strategy"SEEDS" 2nd Edition
Lagos
Highlights on Lagos StateEconomic Empowerment
and Development Strategy"LASEEDS" 2005-2007
Bayelsa
Bayelsa State EconomicEmpowerment and
Development Strategy "BY-SEEDS"
Akwa Ibom
Akwa Ibom State EconomicEmpowerment and
Development StrategyVolume II
Abia
Abia Ibom State EconomicEmpowerment and
Development Strategy"ABSEEDS" 2005
Delta Delta State Vision 2020
(2011-2020)
Oyo
Oyo State EconomicEmpowerment and
Development Strategy"OYO-SEEDS 2" 2010-
2012
Gombe Gombe State Vision 2020(Final Edited Draft, 2010)
1
2
3
4
5
6
7
8
9
10
11
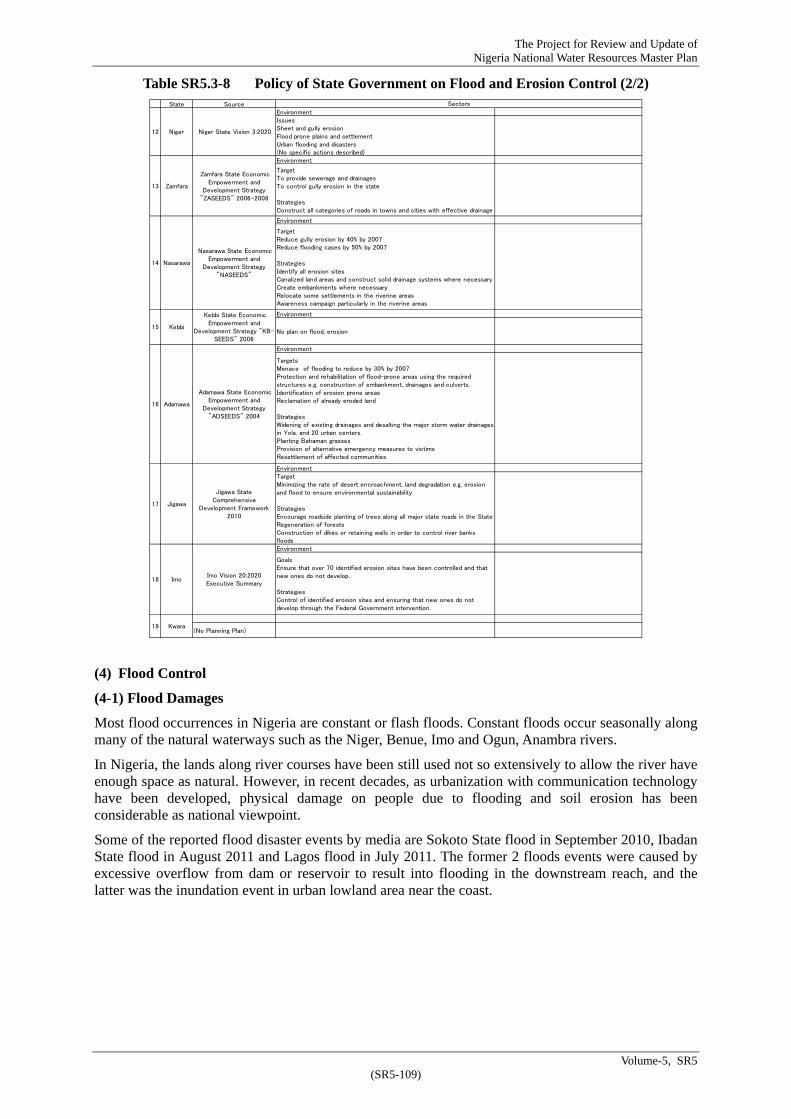
The Project for Review and Update of Nigeria National Water Resources Master Plan
Volume-5, SR5 (SR5-109)
Table SR5.3-8 Policy of State Government on Flood and Erosion Control (2/2)
(4) Flood Control
(4-1) Flood Damages
Most flood occurrences in Nigeria are constant or flash floods. Constant floods occur seasonally along many of the natural waterways such as the Niger, Benue, Imo and Ogun, Anambra rivers.
In Nigeria, the lands along river courses have been still used not so extensively to allow the river have enough space as natural. However, in recent decades, as urbanization with communication technology have been developed, physical damage on people due to flooding and soil erosion has been considerable as national viewpoint.
Some of the reported flood disaster events by media are Sokoto State flood in September 2010, Ibadan State flood in August 2011 and Lagos flood in July 2011. The former 2 floods events were caused by excessive overflow from dam or reservoir to result into flooding in the downstream reach, and the latter was the inundation event in urban lowland area near the coast.
State SourceEnvironmentIssuesSheet and gully erosionFlood prone plains and settlementUrban flooding and disasters(No specific actions described)Environment
TargetTo provide sewerage and drainagesTo control gully erosion in the state
StrategiesConstruct all categories of roads in towns and cities with effective drainage
Environment
TargetReduce gully erosion by 40% by 2007Reduce flooding cases by 50% by 2007
StrategiesIdentify all erosion sitesCanalized land areas and construct solid drainage systems where necessaryCreate embankments where necessaryRelocate some settlements in the riverine areasAwareness campaign particularly in the riverine areas
Environment
No plan on flood, erosion
Environment
TargetsMenace of flooding to reduce by 30% by 2007Protection and rehabilitation of flood-prone areas using the requiredstructures e.g. construction of embankment, drainages and culverts.Identification of erosion prone areasReclamation of already eroded land
StrategiesWidening of existing drainages and desalting the major storm water drainagesin Yola, and 20 urban centers.Planting Bahaman grassesProvision of alternative emergency measures to victimsResettlement of affected communities
EnvironmentTargetMinimizing the rate of desert encroachment, land degradation e.g. erosionand flood to ensure environmental sustainability
StrategiesEncourage roadside planting of trees along all major state roads in the StateRegeneration of forestsConstruction of dikes or retaining walls in order to control river banksfloodsEnvironment
GoalsEnsure that over 70 identified erosion sites have been controlled and thatnew ones do not develop.
StrategiesControl of identified erosion sites and ensuring that new ones do notdevelop through the Federal Government intervention.
(No Planning Plan)
Sectors
Niger Niger State Vision 3:2020
Zamfara
Zamfara State EconomicEmpowerment and
Development Strategy"ZASEEDS" 2006-2008
Nasarawa
Nasarawa State EconomicEmpowerment and
Development Strategy"NASEEDS"
Kebbi
Kebbi State EconomicEmpowerment and
Development Strategy "KB-SEEDS" 2006
Adamawa State EconomicEmpowerment and
Development Strategy"ADSEEDS" 2004
Jigawa
Jigawa StateComprehensive
Development Framework2010
ImoImo Vision 20:2020Executive Summary
12
13
14
15
16
17
18
19 Kwara
Adamawa

The Project for Review and Update of Nigeria National Water Resources Master Plan
Volume-5, SR5 (SR5-110)
Table SR5.3-9 Major Flood Disasters in Nigeria Year/Month State (City) / River Name Description of Cause and Damage
1980 Oyo(Ibadan) / Ogunpa R. 274.1mm rainfall in 12 hours, 100 people died and 50,000 people homeless.
1988 August Kano Bagauda dam failure, destroying 18,000 houses and leaving 200,000 and 23 people dead.
1999 September Kaduna / Kaduna and Niger R.
Killed 39 people, Submerged hundreds villages, affected 300,000 people. 23 people were killed.
2010 September 8th Sokoto, Kebbi / Sokoto , Rima R.
Heavy rainfall and Goronyo dam release.
2011 August Oyo(Ibadan) 120 people killed.
2011 July Lagos, Ogun, Oyo 25 people killed. Relentless rainfall on July 10 (Sunday).
2012 August-October 33 States, especially Kogi, Adamawa and Delta / Benue, Niger R.
363 people dead, 2.2 million people were displaced, damaged several thousand ha of cropland and destroyed houses and personal properties.
Source: JICA Project Team
Table SR5.3-10 List of Past Flood Incidents obtained from various sources
Source: JICA Project Team
Year Month(Period) State River Name Description Sources
1922 Sokotoupstream ofSokoto
U.Lalle, Dan Gerko Sokoto, Rima River History of Irrigation, pp.115
1954 Borno Chad Lake Chad LakeThe Chad lake level was highest in 40-50years on record.
History of Irrigation, pp.116
1960 Borno Chad Lake Chad Lake Similar flood with 1922 History of Irrigation, pp.116
1974 Kwara Niger River
rice project in Tada/Shonga submerged for3 months. There was a high release fromKainji Dam to accommodate the reservoirwaterlevel for upstream rice project.
History of Irrigation, pp.116
1980 August Edo Ogirami dam Akoko-Edo LGA History of Irrigation, pp.116
1980 Oyo Ibadan
Agbogbon, Adamasingba, Bode,Dugbe, Elizabeth Road, Feleye,Gbagi, Molete, Odo-Ona, Oke-Ayo,Omitowoju, Oredein, Osoba, TotalGarden, Salvation Army area
Ogunpa river274.1mm rainfall in 12 hours, 100 peopledied and 50,000 people homeless.
History of Irrigation, pp.117
1988 August KanoBagaudadam
Bagauda dam failure, destroying 18,000houses and leaving 200,000.23 people dead.
1.History of Irrigation, pp.1172.http://reliefweb.int/report/nigeria/nigeria-floodsdam-burst-aug-1988-undro-information-report-1
1999 Sep. KadunaKaduna River, NigerRiver
killed 39 people, Submerged hundredsvillages, affected 300,000 people. 23 peoplewere killed.
BBC news
1999,2001,2007
August JigawaYakasawa, Auramo, Dabi, Zangon,Kanya, Yan Duste, Gilima
Hadejia River(downstream of TigaDam and ChallawaGorge Dam)
High intensity rainfall, release from dams1 NIHSA handout on April 20122 NIHSA Hydronews Vol.2 No.1September 2010
2007,2008
Kwara Asa River Irolin News
2009 May Edo Benin City Owan LGA
2009 JuneFCT, Lagos, Kaduna,Gombe, Niger, Benue,Nasarawa, Jigawa
2009 July Lagos Lagos
2009 August Kebbi Dakingari village300 houses submerged, 3,000 peoplehomeless
NiHSA Hydro News Dec. 2009
2009 October FCT Abuja Kubwa
2010 Sep. 8 Sokoto, Kebbi Sokoto
heavy rainfall and Goronyo dam release.The annual rainfall is 550-600 mm inSokoto, but as of 9/13, 2010, theaccumulated rainfall reached 1,412.5mm.
2011 August Oyo Ibadan 120 people killed. BBC News
2011 July Lagos, Ogun, Oyo Lagos Ikoyi, Victoria Island, Apapa25 people killed. Relentless rainfall on July10 (Sunday).
Internet New "Voice"
Place

The Project for Review and Update of Nigeria National Water Resources Master Plan
Volume-5, SR5 (SR5-111)
(4-2) Past Major Floods
a) Flooding downstream of Dam
September 2010 flood in Sokoto State
The flooding in Sokoto state, Nigeria is a result of the Goronyo dam failing after heavy rainfall(it is said that the rainfall amount around Sokoto was 3 times as much as the normal year, according to NISHA, to be confirmed), washing away settlements and farmlands in nine local council areas; Binji, Gudu, Lllela, Silame, Tangaza, Kware, Gwadabawa, Gada and Goronyo. This flood has extended to Kebbi State which shares a common border with Sokoto; affecting Local Government Areas Augie, Argungu, Birnin Kebbi, Kalgo and Bunza. Figure SR5.3-12 is the flooded area map in this event, which is open in the web site of the International Charter.
Figure SR5.3-12 Flooding Area in Sokoto State in September 20104
b) Flooding in urban area
August 2011 flood in Ibadan State
This flood brought into inundation in urban area because of the overflow from Eleyele Lake in Ibadan State in August 2011. A devastating flood which resulted from an over spill from Lake Eleyele swept over communities in Ibadan, Nigeria. After the flood, the President visited the disaster area and media reported the event in large scale. The continues rainfall from August 26 to 27 in 2011 over 6 hours infilled the reservoir of Eleyele to result into the overflow in the midnight and flush flood like tsunami into the downstream urban areas (mostly illegal settlement). The number of evacuation was several thousand and the number of the victims was over 100. Figure SR5.3-13 is the flooded area map in this event, which is open in the web site of the International Charter.
4http://www.disasterscharter.org/web/charter/activation_details?p_r_p_1415474252_assetId=ACT-324

The Project for Review and Update of Nigeria National Water Resources Master Plan
Volume-5, SR5 (SR5-112)
Figure SR5.3-13 Flooding Area in Ibadan State in August 2011 by overflow
from Eleyele Dam5
Oyo State Government organized the “Oyo State Task Force on Flood Prevention and Management” in September 2011 in order to address the causes and effects of the August 2011 flood. According to the Task Force Report dated on November 2011, the recorded rainfall amount at IITA (International Institute of Tropical Agriculture) was 187.5 mm from 16:40 to 20:00 in August 26, 2011 that includes 140.63 mm within 70 minutes). If this 187.5 mm of rainfall is regarded as the daily rainfall, it can be evaluated as 30 years return period according to Table SR5.3-4.
According to the Task Force Report, the major areas affected are Odo-Ona, Odo-Ona Elewe, Orogun, Agbowo, Apata, Ajibode, University of Ibadan, Ogbere-Babanla, Ogbere Moradeyo, Onipepeye and Eleyele Dam/Water Works. The number of affected LGA is 11, and in these LGAs there were 2,105 buildings flooded by the heavy downpour of Aug 26, 2011.
The causes of the flooding in Ibadan are not only heavy rainfall but the land use factors. Notable among these factors is the indiscriminate and relentless construction of buildings on floodplains.
5http://www.disasterscharter.org/web/charter/activation_details?p_r_p_1415474252_assetId=ACT-370

July 201
In and arcity and Iganmu,
The coarainfall, communfor peop
Case of
Kubwa Tthe Usumtown to i
JICA Prfollowintypical to
The catccatchmeriver bedthe floodthe resid
Figure ScatchmeGenerallrainfall. is observ
Also in course aoutstand
11 Lagos flo
round Lagosclosed the LSurulere, Ag
astal lowlandespecially
nities is spillple’s access to
Kubwa Tow
Town is locama River freidentify the c
Ssource: NE
Figure SR5
roject Team ng is the obseowns in term
chment area nt there is thd slope near d water to Kudual basin (18
SR5.3-16 shont tributariesly this kind oAccording t
ved 2m high
Kubwa Toware serious coding issues fo
od
s city, the heaLagos Airporguda, Idi Ara
d area in Nigprolonged ied out to creo safe water.
wn (FCT, Ab
ated on the wequently. NEcritical areas
EMA GIS Unit
5.3-14 GIS
visited the ervation by th
ms of river flo
of the Usumhe Usuma DKubwa Tow
Kubwa Town 86 km2) of th
ows the streas are enterinof stream conto local peopabove the riv
wn, garbage oncerns accoor NEMA.
avy rainfall lrt. The inundaba, Ikorodu
geria such ainundation deate the dece
buja)
western part oEMA’s GIS Us in terms of
, 2010
Based Floo
Kubwa Towhe JICA Projooding and u
ma River is Dam for watwn is about 1is composed
he Usuma Ri
am courses ong from bothnfiguration cple in Kubwaver bank sur
dumping inording to NE
(SR5-113)
lasted over 1 dation took pu road and Aj
as Lagos citydue to higheased on cho
of Abuja in FUnit has beeflood damag
od Risk Asse
wn with NEMoject Team. Turban drainag
377 km2 atter supply, w1/350. The Dd of the releaiver.
of the Usumah left side ancould produca Town, therrface.
nto the riverEMA. Regula
Niger
day in July lace in Victoegunle, Mary
y is facing ah tide. Consolera. The flo
FCT and has en developingge vulnerabil
essment of K
MA GIS UnThe Kubwa Tge issue in N
t the Kubwawhose catchmDam was conase from the
a Dam downnd right side
ce sudden ince was a floo
r and the neation of usag
The Project ia National Wat
2011 causedoria Island, Ikyland.
a problem ofsequently thood problem
been suffereg a flood haity.
Kubwa Abuj
nit Team on Town is supp
Nigeria.
a Town. In tment area is nstructed in Usuma Dam
stream. It is e just upstrecrease of flood 3 years ag
w settlemenge og the flo
for Review andater Resources M
Volu
d the inundatikoyi, Obalen
f inundation he waste ma
m is a kind of
ed from floodazard map fo
a by NEMA
May 18, 2posed to be o
the upper paabout 191 k1984 by SW
m and the run
recognized team of Kubwod level duri
go and the flo
nt confining oodplain is o
d Update of Master Plan
me-5, SR5
ion in the nde, Orile
by local aterial of f obstacle
ding from or Kubwa
A
012. The one of the
art of the km2. The
WB. Thus noff from
that large wa Town. ing heavy ood mark
the river one of the

The Project for Review and Update of Nigeria National Water Resources Master Plan
Volume-5, SR5 (SR5-114)
Source: JICA Project Team
Figure SR5.3-15 Catchment Boundary and Topography of Usuma River
Source: JICA Project Team
Figure SR5.3-16 Tributaries of Pedan River downstream of Usuma Dam

The Project for Review and Update of Nigeria National Water Resources Master Plan
Volume-5, SR5 (SR5-115)
Source: JICA Project Team
Figure SR5.3-17 Dumped Garbage into the river channel (Left) and Flood Mark at 2m above the river bank (Right)
c) 2012 Flood
The wet season started early in February/March in the south and in early May/June in the north. Widespread flooding peaked between September and mid-October across the country and was particularly severe in the northcentral and coastal states. Nigeria experienced the worst flooding in more than 100 years. NIWA indicated that the 2012 flooding was the second highest in the country; the first and highest occurred in 1932.
The flood in 2012 was caused by more flooding of the Niger River, the Benue river and other major tributaries than normal years. Those flooding were brought by rainfall in Nigerian territory as well as the inflow from Niger and Cameroun borders. Especially the flooding extent along the Benue river was large to result into the historical flooding at Lokoja downstream where the Niger and the Benue river confluence with local rainfall. According to a media, this flooding at Lokoja was the worst in fifty years.
Usually the flood disasters in Nigeria in rainy season are destructive ones such as flash flooding over poor drainage system in urban area, however in 2012 the flood along the rivers lasted more than 2 months and brought in Nigeria a lot of damage on people, properties and sanitary conditions, and the Federal, State, Local governments and communities responded.
Rainfall in 2012
JICA Project Team obtained the NIMET monthly rainfall data in 2012 from the World Bank’s PDNA Team (Table SR5.3-11). The cumulative rainfall from June to September is shown in Figure SR5.3-18.
Source: JICA Project Team
Figure SR5.3-18 Rainfall during June - September in 2012 in Nigeria

The Project for Review and Update of Nigeria National Water Resources Master Plan
Volume-5, SR5 (SR5-116)
Table SR5.3-11 Monthly Rainfall in 2012 of NIMET stations
Source: World Bank Post Disaster Need Assessment Team obtained from NIMET
Damages
The damage occurred in the communities on floodplain along the Niger and the Benue rivers and the Delta area as well as agricultural lands.
In 2012 from July to October, Nigeria experienced historical flood along the Benue and the Niger rivers. The flood traveled in those rivers for more than 1 month and affected the urban areas along the rivers. According to NIMET information, the flood magnitude was the worst in 80 years on record, whose causes were the inflow from Niger due to a lot of rainfall in the country and the runoff from in and outside of Nigeria due to rainfall in July. Totally 33 states among 36 states were affected by the flood. Especially 14 states were seriously affected. The number of affected people is 7.7 million during July and October. The number of victim is 33 and the 18 thousand were injured and 618 thousands of houses/building was damaged.
The chronology of the 2012 flood was made based on local newspapers as follows.
unit: mm
STN JAN FEB MAR APR MAY JUN JUL AUG SEPT OCT NOV DEC Total (Jan-Nov)
ABEOKUTA 0.0 27.2 57.5 76.5 183.8 350.3 147.8 34.2 189.6 283.2 8.4 1358.5ABUJA 0.0 20.6 19.0 52.0 162.8 222.8 376.1 270.5 274.4 228.9 11.0 1638.1ADO EKITI 2.3 69.9 45.6 155.3 145.3 329.2 207.3 39.3 182.3 265.2 67.1 1508.8AKURE 35.6 13.8 74.1 152.1 96.8 250.5 242.3 111.9 204.1 143.1 42.0 1366.3ASABA 0.1 15.8 20.6 164.3 68.2 209.4 294.5 328.5 145.7 296.0 104.8 1647.9
AWKA 28.3 66.5 16.5 206.1 236.7 327.6 232.0 363.5 167.4 291.7 49.8 1986.1BAUCHI 0.0 0.0 0.0 14.4 167.9 163.8 535.0 274.8 375.3 14.6 0.0 1545.8BENIN 47.7 53.2 74.8 157.1 383.7 490.4 395.3 124.9 255.5 285.2 189.7 2457.5BIDA 0.0 0.0 0.0 64.5 308.6 194.0 274.3 140.9 137.2 230.2 0.0 1349.7CALABAR 32.9 376.4 36.0 83.2 438.4 398.8 630.1 861.7 619.7 410.4 126.7 4014.3
EKET 63.2 291.8 74.6 222.0 227.7 856.3 847.0 408.6 604.9 281.9 182.8 4060.8ENUGU 39.0 35.7 13.0 86.9 288.7 282.5 388.0 309.1 393.2 227.7 88.5 2152.3GOMBE 0.0 0.0 0.0 10.3 64.0 222.9 337.8 356.2 178.0 28.1 0.0 1197.3GUSAU 0.0 0.0 0.0 5.2 131.0 63.4 271.5 153.0 113.0 17.5 0.0 754.6IBADAN 0.0 20.6 36.2 117.1 215.9 215.0 257.0 82.5 238.2 141.3 54.9 1378.7
IBI 0.0 0.0 0.0 99.1 202.7 203.6 288.9 74.4 166.8 169.3 2.6 1207.4IJEBU-ODE 0.0 101.9 16.8 91.6 136.6 301.3 317.2 59.6 254.1 166.6 133.4 1579.1IKEJA 10.5 122.2 78.1 64.0 134.9 477.6 147.5 34.0 214.1 138.9 123.1 1544.9IKOM 16.4 72.5 11.3 213.7 343.6 482.6 309.5 313.7 273.3 322.3 93.1 2452.0ILORIN 0.0 22.1 4.0 134.6 138.2 152.8 120.7 108.7 230.0 159.3 8.7 1079.1
ISEYIN 26.7 42.9 13.0 215.2 221.1 145.5 87.7 146.0 153.0 182.5 15.7 1249.3JOS 0.0 0.0 0.0 66.6 315.4 240.3 429.0 156.9 201.2 58.6 0.0 1468.0KADUNA 0.0 0.0 0.0 61.6 212.8 140.3 225.6 269.4 403.4 135.1 0.0 1448.2KANO 0.0 0.0 0.0 0.0 71.9 432.6 416.6 626.3 123.5 18.6 0.0 1689.5KATSINA 0.0 0.0 0.0 0.0 59.5 135.2 224.1 201.1 76.8 2.0 0.0 698.7
LAFIA 0.0 0.0 0.0 93.5 178.6 200.8 218.4 230.3 194.0 174.2 34.9 1324.7LAGOS B/BEACH 1.1 61.2 28.7 161.0 221.1 476.7 250.2 10.4 184.5 229.0 0.0 1623.9LAGOS ISLAND 0.0 61.5 47.9 158.1 196.7 582.9 236.5 13.1 101.5 336.0 0.0 1734.2LOKOJA 0.0 11.8 0.0 86.5 253.8 166.9 283.3 180.5 148.4 209.9 2.2 1343.3MAIDUGURI 0.0 0.0 0.0 0.0 33.8 76.9 328.0 228.6 198.1 3.4 0.0 868.8
MAKURDI 0.0 0.5 0.0 143.2 139.5 160.6 297.9 174.3 290.7 232.7 27.3 1466.7MINNA 0.0 0.0 0.0 34.2 204.5 99.4 333.0 376.9 337.2 158.0 0.0 1543.2NGURU 0.0 0.0 0.0 0.0 15.7 107.3 105.3 300.6 125.2 0.0 0.0 654.1OBUDU 0.0 28.0 2.2 115.2 284.2 154.1 223.4 137.6 113.7 180.2 48.3 1286.9OGOJA 25.4 13.5 0.0 160.4 565.1 541.6 371.4 607.5 530.7 476.7 118.9 3411.2
ONDO 4.0 93.2 24.5 92.8 158.0 187.3 249.3 102.3 187.1 247.4 95.6 1441.5OSOGBO 3.7 61.5 35.2 134.3 178.5 202.9 171.1 99.3 296.2 219.6 124.4 1526.7OWERRI 0.0 74.1 22.1 138.1 234.4 284.2 415.0 285.4 501.9 192.3 110.2 2257.7PORT HARCOURT 23.4 104.0 92.7 247.2 208.0 311.8 359.0 208.6 409.4 205.5 79.0 2248.6POTISKUM 0.0 0.0 0.0 0.0 78.6 111.7 206.6 358.5 306.9 0.0 0.0 1062.3
SHAKI 0.0 28.6 23.9 111.6 141.1 153.0 82.4 77.1 107.4 115.3 0.0 840.4SOKOTO 0.0 0.0 0.0 0.0 54.5 83.2 178.2 140.7 92.4 64.4 0.0 613.4USI EKITI 0.0 25.1 41.0 97.9 183.2 223.8 56.7 37.4 171.2 223.3 62.0 1121.6
UYO 163.3 321.5 29.5 148.6 336.0 699.5 911.9 720.8 526.7 498.9 270.5 4627.2
WARRI 18.8 168.0 47.1 137.6 333.4 469.9 677.5 132.9 333.0 330.0 166.4 2814.6
YELWA 0.0 28.0 0.0 56.8 168.1 50.3 254.3 163.3 190.2 41.2 0.0 952.2
YOLA 0.0 0.0 0.0 0.0 108.0 198.9 157.3 209.8 189.5 67.2 0.0 930.7
ZARIA 0.0 0.0 0.0 16.7 265.0 157.7 306.1 422.7 166.3 85.2 0.0 1419.7

Mid. Of A
End of Au
September
September
September
September
October 19
Source: JIC
JICA ProFigure SSR5.3-2Niger rivJebba DestimateLower N
Source
August 2012
ugust 2012
r 10, 2012
r 10, 2012
r 12, 2012
r 24, 2012
9, 2012
CA Project Tea
oject Team cSR5.3-19 sh0 is the hydrver and the am out and d that the rai
Niger section
e: JICA Project
F
Table SThe wors
OverflowAdamawState.
In Adamin the eas
NEMA iAnambrawere reco
The inunthousand
Director
NEMA is
am
collected thehows the perograph at thBenue riverYola stationinfall runoff
n.
Team
Figure SR5.3
SR5.3-12 st flash flood in
w from Lagdo a State. The nu
awa State, it wstern Adamawa
ssued evacuatia, Delta)alongorded as the hig
ndation in Makuhouses were in
of NIWA stated
ssued flood war
e daily discheak discharghe major statr, was more , the runoff vwithin the N
3-19 Peak D
(SR5-117)
Chronologn fifty years on r
dam in Cameumber of victim
was announced ta State. 65 cases
ion order to thg the Niger riveghest in 29 year
urdi along the Bnundated. In Lo
d that the water
rning in Ekiti S
harge data in ge and the dtions. The pe
than 30,000volume at L
Nigerian terri
Discharge Di
Niger
gy of the 201record in Platea
eroun started ims was 15 that
that 30 people ds of cholera wer
he people in ther, after the wars for this period
Benue river starokoja, the inund
rlevel in Lokoja
tate.
Nigeria durdate in maj
eak discharge0 m3/s. Com
Lokoja stationitory had gre
istribution i
The Project ia National Wat
12 flood au State
n August 24 is the worst da
dead and 120 thre recognized.
he states (Nigaterlevels in Kad.
rted from aboutdation started in
a recorded the h
ing the 2012or hydrologe at Lokoja,
mpared this wn is very largeat contributi
n 2012 Floo
for Review andater Resources M
Volu
according to oamage in fifty y
housand people
ger, Kogi, Kwaainji Dam and J
t September 9th
n September 12.
highest since 19
2 flood fromgical stationsthe confluen
with the discge, consequeion to the flo
od
d Update of Master Plan
me-5, SR5
officials of years in the
e evacuated
ara, Kebbi, Jebba Dam
h. About 10 .
939.
m NIHSA. s. Figure nce of the charge of ently it is ood in the

The Project for Review and Update of Nigeria National Water Resources Master Plan
Volume-5, SR5 (SR5-118)
Source: JICA Project Team
Figure SR5.3-20 Discharge Hydrograph during June – October in 2012 of NIHSA Hydrological Station
source : NASA HP6
Figure SR5.3-21 Satellite Images of the Benue River near Lau (Top:2009/9/23, Bottom:2012/9/8)
6 http://earthobservatory.nasa.gov/IOTD/view.php?id=79149
0
5,000
10,000
15,000
20,000
25,000
30,000
35,000
1‐Jun
8‐Jun
15‐Jun
22‐Jun
29‐Jun
6‐Jul
13‐Jul
20‐Jul
27‐Jul
3‐Aug
10‐Aug
17‐Aug
24‐Aug
31‐Aug
7‐Sep
14‐Sep
21‐Sep
28‐Sep
5‐Oct
12‐Oct
19‐Oct
26‐Oct
Discharge (m3/s)
Yola
Kainji Out
Jebba Out
Baro
Lokoja

The Project for Review and Update of Nigeria National Water Resources Master Plan
Volume-5, SR5 (SR5-119)
Source : NASA HP7
Figure SR5.3-22 Satellite Images of the confluence of the Niger and the Benue River near Lokoja (Top:2012/10/13, Bottom:2008/10/20)
Responses of Nigerian Government
President Jonathan said that the required response to the flooding and the recovery for the flood damage exceeded the capacity of Federal and relevant State Governments. The President set up Fund Promotion Committee composed of previous Presidents and economic circles and made efforts to prepare 100 billion Naira in order to support the affected people and the State Governments. (Source: News “This Day” dated on Nov. 6, 2012)
Local newspaper showed an opinion article that 2012 flood disaster had 4 factors such as insufficient experience of natural disaster management, lack of preparedness for disaster, lack of record of past
7 http://earthobservatory.nasa.gov/IOTD/view.php?id=79404
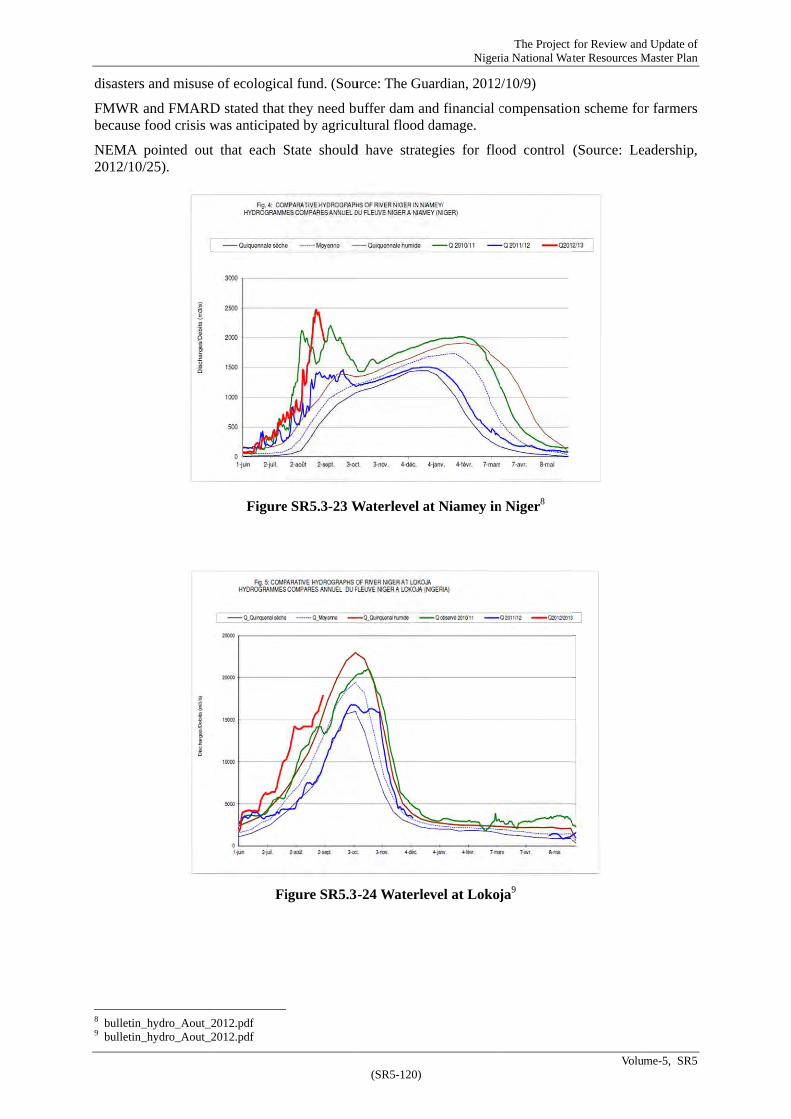
disasters
FMWR because
NEMA 2012/10/
8 bulletin_9 bulletin_
s and misuse
and FMARDfood crisis w
pointed out /25).
_hydro_Aout_2_hydro_Aout_2
of ecologica
D stated that was anticipat
that each S
Figure
Fi
2012.pdf 2012.pdf
al fund. (Sou
they need bued by agricu
State should
e SR5.3-23 W
igure SR5.3-
(SR5-120)
urce: The Gu
uffer dam anultural flood d
d have strate
Waterlevel a
-24 Waterle
Niger
ardian, 2012
nd financial cdamage.
egies for flo
at Niamey in
evel at Lokoj
The Project ia National Wat
/10/9)
compensatio
ood control
n Niger8
ja9
for Review andater Resources M
Volu
on scheme fo
(Source: Le
d Update of Master Plan
me-5, SR5
r farmers
eadership,

10 bulletin11 bulletin
n_hydro_Aout_n_hydro_Aout_
Figu
Figu
_2012.pdf _2012.pdf
ure SR5.3-25
ure SR5.3-26
(SR5-121)
5 Waterlevel
6 Waterlevel
Niger
l at Kainji D
l at Jebba D
The Project ia National Wat
Dam10
Dam11
for Review andater Resources M
Volu
d Update of Master Plan
me-5, SR5
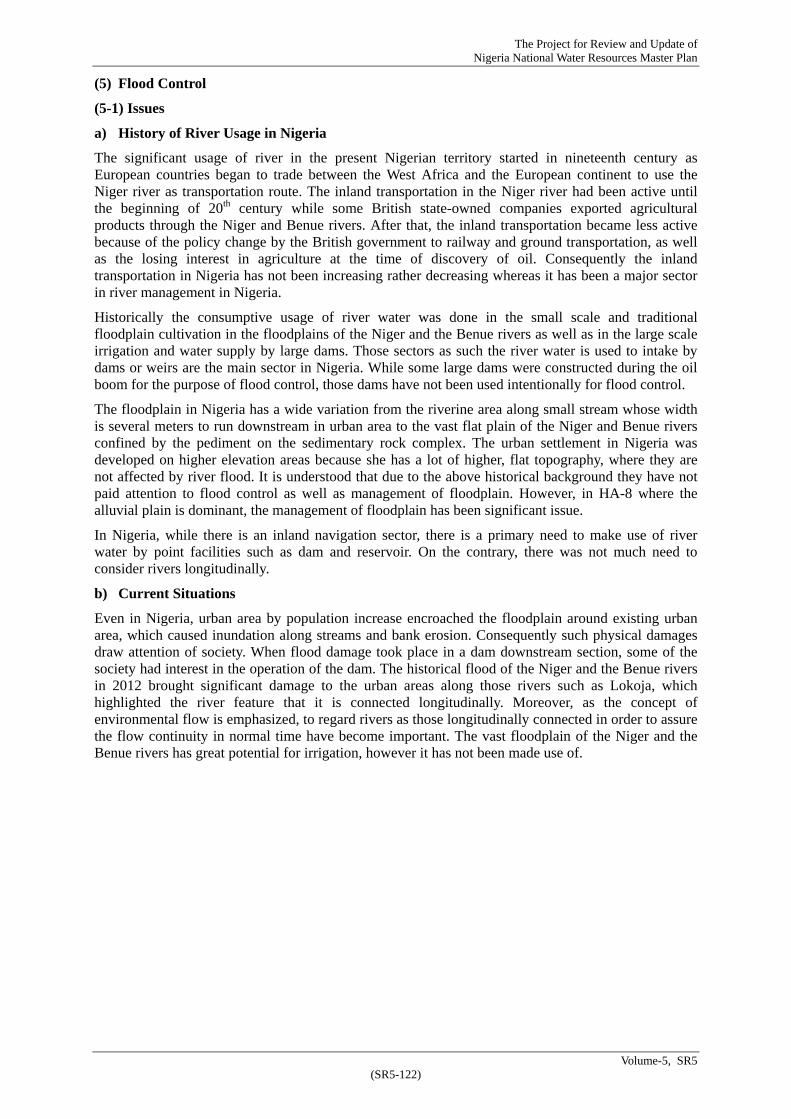
The Project for Review and Update of Nigeria National Water Resources Master Plan
Volume-5, SR5 (SR5-122)
(5) Flood Control
(5-1) Issues
a) History of River Usage in Nigeria
The significant usage of river in the present Nigerian territory started in nineteenth century as European countries began to trade between the West Africa and the European continent to use the Niger river as transportation route. The inland transportation in the Niger river had been active until the beginning of 20th century while some British state-owned companies exported agricultural products through the Niger and Benue rivers. After that, the inland transportation became less active because of the policy change by the British government to railway and ground transportation, as well as the losing interest in agriculture at the time of discovery of oil. Consequently the inland transportation in Nigeria has not been increasing rather decreasing whereas it has been a major sector in river management in Nigeria.
Historically the consumptive usage of river water was done in the small scale and traditional floodplain cultivation in the floodplains of the Niger and the Benue rivers as well as in the large scale irrigation and water supply by large dams. Those sectors as such the river water is used to intake by dams or weirs are the main sector in Nigeria. While some large dams were constructed during the oil boom for the purpose of flood control, those dams have not been used intentionally for flood control.
The floodplain in Nigeria has a wide variation from the riverine area along small stream whose width is several meters to run downstream in urban area to the vast flat plain of the Niger and Benue rivers confined by the pediment on the sedimentary rock complex. The urban settlement in Nigeria was developed on higher elevation areas because she has a lot of higher, flat topography, where they are not affected by river flood. It is understood that due to the above historical background they have not paid attention to flood control as well as management of floodplain. However, in HA-8 where the alluvial plain is dominant, the management of floodplain has been significant issue.
In Nigeria, while there is an inland navigation sector, there is a primary need to make use of river water by point facilities such as dam and reservoir. On the contrary, there was not much need to consider rivers longitudinally.
b) Current Situations
Even in Nigeria, urban area by population increase encroached the floodplain around existing urban area, which caused inundation along streams and bank erosion. Consequently such physical damages draw attention of society. When flood damage took place in a dam downstream section, some of the society had interest in the operation of the dam. The historical flood of the Niger and the Benue rivers in 2012 brought significant damage to the urban areas along those rivers such as Lokoja, which highlighted the river feature that it is connected longitudinally. Moreover, as the concept of environmental flow is emphasized, to regard rivers as those longitudinally connected in order to assure the flow continuity in normal time have become important. The vast floodplain of the Niger and the Benue rivers has great potential for irrigation, however it has not been made use of.

The Project for Review and Update of Nigeria National Water Resources Master Plan
Volume-5, SR5 (SR5-123)
Table SR5.3-13 shows the activities which each government level is taking to distinguish floodplain into riverine area in urban area, floodplain near urban center along rivers, and floodplain along the major rivers.
The improvement of urban environment which State governments and FMEnv area dealing with includes lining of natural stream, dredging, bank protection and flood early warning from the viewpoint of floodplain management. State governments have sections for land use planning, which are responsible for land use planning in floodplain. Federal Ministry of Niger Delta is a coordination body for relevant 9 states in Delta areas (Ondo, Edo, Delta, Bayelsa, Rivers, Imo, Abia, Akwa Ibom, Cross River). This ministry is also involved in the management of floodplain.

The Project for Review and Update of Nigeria National Water Resources Master Plan
Volume-5, SR5 (SR5-124)
Table SR5.3-13 Management of Floodplain Subjective Floodplain
Riverine area in urban area Floodplain near urban center along rivers
Floodplain along major rivers Area of higher
elevation Lowland area(Delta area)
State Government
Improvement of Urban Environment Land use planning
Improvement of Urban Environment Land use planning
Improvement of Urban Environment Land use planning
Land use planning
FMEnv Improvement of Urban Environment Flood Early Warning
Improvement of Urban Environment Flood Early Warning
Improvement of Urban Environment -
FMWR - -
Regulation of Release from Dam Hydrological Monitoring
Regulation of Release from Dam Hydrological Monitoring Large scale Irrigation
FM Niger Delta -
Improvement of Urban Environment (Delta area)
Improvement of Urban Environment (Delta area)
FMT-NIWA - - Management of Navigation Route
Management of Navigation Route
source:JICA Project Team
c) Issues
The management of floodplain in Nigeria can be defined as mitigation of flood damage, promoting of river usage in normal time and enhancement of land use, responding to the variety of river regime such as water level, discharge and velocity.
The management of floodplain should be prioritized among the national policies as well as the environmental management in urban areas.
In terms of small floodplain in urban area, State governments and FMEnv are in charge as a part of environmental administration. The sufficient fund for countermeasures and technical support such as hydrological data, planning and design methodology from Federal government are necessary.
In terms of mitigation of flood damage, FMEnv is preparing flood early warning system based on rainfall prediction in urban area. The flood early warning against flooding of major rivers such as the 2012 flood is highly expected at present.
For the food production, large scale irrigation project in floodplain of major rivers is expected. However, the basic information on such floodplain such as historical change of river bank, river cross section, soil profile and river channel flow capacity is not enough.
NIWA is in charge of navigation route of major rivers. The management covers the entire width of floodplain, however, the actual activity is not clarified.

The Project for Review and Update of Nigeria National Water Resources Master Plan
Volume-5, SR5 (SR5-125)
Figure SR5.3-27 Natural Swamp area and flood-prone area by FMEnv GIS Data
(5-2) Under Discussion /On-going /Project
At present in Nigeria, the discussion on flood control is very frequent in the national level as well as in States and communities, especially after the 2012 flood incident.
a) Flood Forecasting
Institutional Framework of Flood Early Warning System in Nigeria
At present in Nigeria the Federal Ministry of Environment (FME) is the primary stakeholder for flood early warning system. The role on flood and erosion control as well as flood early warning used to be under the former Federal Ministry of Water Resources. When the FME was created from the National Environmental Protection Agency in 1999, the role of flood and erosion control as well as flood early warning was transferred to FME together with the department.
The key stakeholders in the establishment of FEWS are
Three tiers of Governance (Local, State and Federal Government of Nigeria) Federal Ministry of Environment, Housing and Urban Development National Emergency Management Agency NIMET (former Nigerian Meteorological Agency) NIHSA (former National Hydrological Management Agency) Federal Ministry of Agriculture and Water Resources River Basin Development Authorities in the 8 Has Power Holdings Company of Nigeria Nigerian Institute of Oceanography and Marine Research Nigerian Air Space Research and Development Agency Federal Ministry of Information and Communication Nigerian Communication Commission GSM Telecommunications Service Providers Nigerian Television Authority Print and Electronic Media Traditional Ruling Council Across the Country Vulnerable Resident Communities in the 8Has
The Project for Review and Update of Nigeria National Water Resources Master Plan
Volume-5, SR5 (SR5-126)
Red Cross Society International Organizations and Institutions (UNDP, UNEP, WMO, UNISDR, etc)
Main stakeholder’s roles and responsibilities are as follows,
Three tiers of Governance (Local, State and Federal Government of Nigeria)
Provision of legal and policy framework for the establishment and operation of an integrated FEWS in Nigeria
Establishment of the FEWS as a long term national and local high priority for hydro-meteorological disaster reduction strategy
Creation of the enabling environment for the enhancement of the institutional capacities for the sustainability of the proposed FEWS
Integration of FEWS into the national development plan National commitment to the establishment of FEWS in Nigeria through appropriate funding and
policy support
Federal Ministry of Environment, Housing and Urban Development
Implementation of government policies relating to flood management Demonstration and presentation of the economic benefits of FEWS to senior government officials
and political leaders Provision of a leadership and role model the establishment and operation of FEWS in Nigeria Facilitate the development of sustained collaboration and cooperation between FME, strategic
stakeholder, Ministries, Departments and Agencies identified for the establishment and operation of the proposed FEWS
Clearly define the roles and responsibilities of all stakeholders involved in the establishment and operation of FEWS in Nigeria
Formulation of institutional framework that facilitate the establishment and operation of the proposed FEWS and installation of technical infrastructure for preparing and issuing timely flood warning
Appointment of one senior government official in the Ministry empowered by law as the national decision maker on Nigeria’s FEWS
Integration of Nigeria’s FEWS with regional and transboundary hydrometeorology data collection network and flood early warning initiatives
Identify and make an inventory of all major river basins in the 8 Has as well as coastal areas and lagoons in Nigeria with significant backwater effects for the purpose of FEWS establishment
Establishment of sustainable partnerships and relationship between all stakeholders, ministries, department and agencies involved in FEWS institutional framework and mechanism for flood disaster detection, warning generation and communication, and emergency response delivery
Set alert and critical flood levels that will trigger the issuance of early flood warning Review rainfall-runoff relationships in river basins and collection of catchment characteristics
data pertinent for the operation of the FEWS Identify and engage competent technical and human resources locally and abroad for
development and sustainable operation of the FEWS Ensure that flood early warnings and related responses address all the relevant population
especially the most vulnerable Provision of support to local governments and communities to develop their FEWS operational
capabilities and effectively interpret flood early warning messages Identification and sourcing for government funding the proposed FEWS, its sustained
development and institutionalization Identify and advocate for Public/private sectors partnerships and assistance in the establishment
of Nigeria’s FEWS.
National Emergency Management Agency
Facilitate policy on all activities relating to flood disaster management in Nigeria and coordinate the plans and programs for efficient and effective response at national level
Coordinate and promote research activities relating to flood disaster management at national level Monitor the state of preparedness of all organizations or agencies which may contribute to flood
disaster management

The Project for Review and Update of Nigeria National Water Resources Master Plan
Volume-5, SR5 (SR5-127)
Collate data from relevant agencies so as to enhance flood disaster management Coordinate and facilitate the provision of necessary resources for search and rescue and
emergency response upon issuance of flood early warning Establish flood emergency shelters Assist in evacuation and coordinates flood emergency response Coordinate the activities of all voluntary organizations engaged in flood warning emergency
response and relief operations in any part of the country Identify and source for functional and technical aid from international organizations and
nongovernmental agencies for the purpose of flood emergency response Collect emergency relief supply from local, foreign sources and from international and
non-governmental agencies Distribute emergency relief materials to victims of flood disaster and assist in the rehabilitation of
the victims where necessary Liaise with the State Emergency Management Committees to assess and monitor where necessary,
the distribution of relief materials to flood victims Liaise with the United Nations Disaster Reduction Organization or other international bodies for
the reduction of flood disasters in Nigeria Prepare the annual budget for flood disaster management and the emergency response component
of the proposed FEWS Collaborate and cooperate with the FME and other stakeholders in the establishment and
operation of the proposed FEWS
Federal Ministry of Water Resources
Collaboration and partnership with FME, NEMA and other stakeholders in the establishment of the FEWS
Collect hydrological data in river basins across the country Participate in the design of the proposed FEWS Source for and install hydrometric equipment and telemetric systems in river basins of interest Collaborate in the raising of community awareness of the FEWS and flood warning response Preform and review rainfall-runoff simulation Monitoring of the flow regimes of water resources in river basins across the country Dissemination, communication and exchange of data on flood characteristics of river basins for
the operation of the FEWS
Figure SR5.3-28 Institutional Framework and Mechanism for the Establishment and Operation of Nigeria’s Flood Early Warning System (source: FME)

Latest d
The FMESystem minimizand Rese
ForecastRainfall,
Also thewith sup
Web-ba
This sysAbaji Ciwind speand 10Pindicatedgovernm
Accordin17, 2012
Figure Swhich w
Sate
FMautotemthe War
Com
Floo
development
E in Collabo(FEWS) to e loss of liveervoirs such
t data is pro, Temperatur
e FME has stpport of UND
sed flood ea
stem is the mity, 5 days adeed, wind di
PM on May d with a ma
ment issues th
ng to FME, 2. The metho
SR5.3-29 Ewas issued on
ellite-based m
ME has just somated stati
mperature, humExploitation
rning Center
mmunity-bas
od Vulnerab
Maps fromsponsored b
t of FEWS in
oration with omonitor var
es and propeas Dams.
ovided on thre, Humidity,
arted the sateDP and other
arly warning
most advancedvanced flooirection and 20, issued o
ark “Not OKheir own inte
this 5 day’s odology of th
Example of n May 17, 20
monitoring s
started the sions in Ogumidity and p
n of Meteoror within FME
sed FEWS
ility Assessm
m the "Floodby FME and
n Nigeria
other partnerrious locatioerty. The FEW
his website f, Atmospheri
ellite-based frelevant org
g
ed at present od forecast batmosphericon May 17. K”. This bulerpretation to
advanced fohis forecast w
5 Days adva012 by FME
ystem
satellite-baseun River wprecipitation.ological SateE, Abuja.
ment
d Risk and d UNDP) are
(SR5-128)
r agencies haons in the cWS is setup
for various ic Pressure a
flood monitoganizations.
t in Nigeria. y FME. The
c pressure at If these par
lletin is issuo the local.
orecast is imwas not disclo
anced FloodE to State G
ed flood mowhose param. These data ellites (Eume
Vulnerabilitlisted below
Niger
as set up thiscountry for F
to cater for
cities in theand more.
oring system
The followie information
1AM, 4AMrameters excued from FM
mplemented fosed to the JI
d Forecast fovernment
nitoring sysmeters are w
are transmittetsat) in hour
ty Studies aw.
The Project ia National Wat
s Web based Flood Signsurban areas
e country. Th
and the com
ng informatin includes pr, 7AM, 10A
ceed the norME to releva
for 75 cities ICA Project
for Abaji Ci
tem in Nigewind speed, ted via Europrly basis to N
and Mapping
for Review andater Resources M
Volu
Flood Earlys, and Issue and for Rive
The Forecast
mmunity-base
ion is an exarecipitation, h
AM, 1PM, 4Prmal values, ant governm
in Nigeria aTeam.
ity on May 2
eria. It has 2wind direc
pean OrganizNational Flo
g in Nigeria
d Update of Master Plan
me-5, SR5
y Warning alerts to
er basins,
includes
ed FEWS
ample for humidity, PM, 7PM
they are ment. The
s of May
20, 2012,
2 ground ction, air zation for ood Early
a" report

The Project for Review and Update of Nigeria National Water Resources Master Plan
Volume-5, SR5 (SR5-129)
Table SR5.3-14 Number of Settlements with High Flood Risk
Name of RBDA Number of Settlements with High
Flood Risk 1 Anambra-Imo 13 2 Benin Owena 17 3 Chad River 18 4 Cross River 9 5 Hadejia-Jama’are 19 6 Upper Niger River 20 7 Lower Benue River 14 8 Niger Delta 14 9 Ogun-Osun River 17 10 Sokoto-Rima River 18 11 Upper Benue River N/A 12 Lower Niger River 8 13 The Coastal Areas N/A
Figure SR5.3-30 Example of Mapping of Flood Vulnerable Communities in Sokoto-Rima River Basin Development Authority

It is exppredictio(Softwar
F
b) Das
JICA PrAuthoritExecutivdam wanavigatiopurposesis as foll
ected that inon system, re, Topograp
Figure SR5.
sin Hausa M
roject Team ty Yola-Nigve Summary,as constructeon and irrigas of the dam lows,
n order to imRainfall-Ru
phical Data) a
.3-31 Locati
Multipurpose
collected ageria, Dasin , Hidroserviced in Cameration, at preis buffer fun
mplement the unoff and Rand National
ion of Flood
e Dam
a Pre-F/S reHausa Mu
ce, 1982. Whroun for thesent the nec
nction agains
(SR5-130)
above systeRouting Mol FEWS Coo
-prone citie
eport entitledultipurpose hile this proje future comcessity of thest the inflow
Niger
em in Nigeridel, Flood rdinating Ce
s for each R
d “Upper BProject, Prect was stud
mprehensive e project is from Camer
The Project ia National Wat
an –nationwHazard Ma
enter.
RBDA accord
Benue River efeasibility
died 30 yearsdevelopmen
discussed inroun. The bri
for Review andater Resources M
Volu
wide, there arapping Meth
ding to FME
Basin DevStudy Volu
s ago when thnt for flood
n Nigeria. Onief feature of
d Update of Master Plan
me-5, SR5
re rainfall hodology
E
elopment ume 1-A he Lagdo
d control, ne of the f the dam
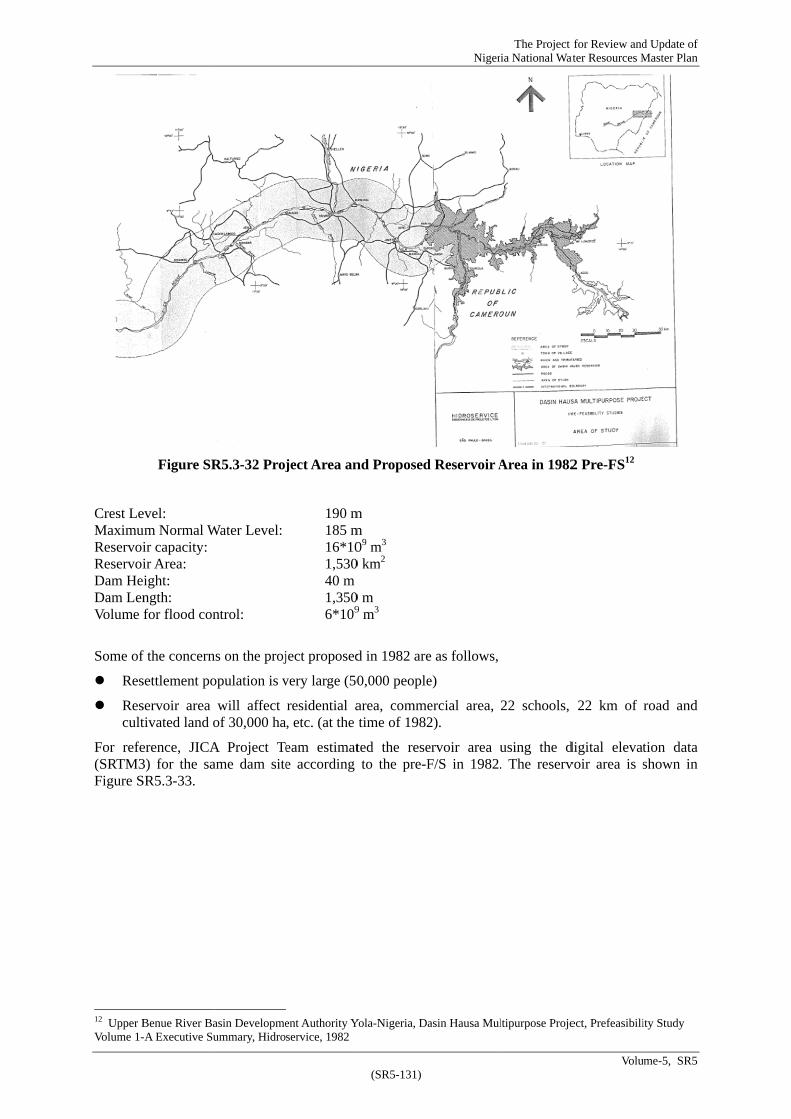
Crest LeMaximuReservoiReservoiDam HeDam LenVolume
Some of
Res
Rescult
For refe(SRTM3Figure S
12 Upper BVolume 1-
Figure SR
evel: um Normal Wir capacity: ir Area:
eight: ngth: for flood con
f the concern
settlement po
servoir area tivated land o
erence, JICA3) for the saSR5.3-33.
Benue River Ba-A Executive Su
R5.3-32 Proj
Water Level:
ntrol:
ns on the proj
opulation is v
will affect of 30,000 ha
A Project Teame dam site
asin Developmeummary, Hidro
ject Area an
190 m 185 m 16*10 1,530 40 m 1,350 6*109
ject proposed
very large (50
residential a, etc. (at the
eam estimate according
ent Authority Yservice, 1982
(SR5-131)
nd Proposed
m m 09 m3
0 km2
0 m 9 m3
d in 1982 are
0,000 people
area, commetime of 1982
ted the reseto the pre-F
Yola-Nigeria, Da
Niger
d Reservoir A
e as follows,
e)
ercial area, 2).
ervoir area uF/S in 1982.
asin Hausa Mul
The Project ia National Wat
Area in 1982
22 schools,
using the d. The reserv
ltipurpose Proje
for Review andater Resources M
Volu
2 Pre-FS12
22 km of
digital elevatvoir area is s
ect, Prefeasibili
d Update of Master Plan
me-5, SR5
road and
tion data shown in
ity Study

The Project for Review and Update of Nigeria National Water Resources Master Plan
Volume-5, SR5 (SR5-132)
Source:JICA Project Team
Figure SR5.3-33 Reservoir Area for 185 m (Blue color), 167 m (Green color)
(5-3) Proposed Strategies of FMWR
Considering the above issues, FMWR should start the basic investigation of floodplain of major rivers such as the Benue, the Niger, the Kaduna and the Sokoto-Rima Rivers which have great potential of large scale irrigation.
Table SR5.3-15 Proposed Items of Basic Investigation Item Contents
Historical change of river bank
Collecting of map in Colonial era、aerial photos、satellite image、to check the change of river bank and to study the channel stability
River cross section survey
Surveying of floodplain cross section、to prepare cross section drawing indicating of detailed topography. Also surveying of river channel, to confirm the location of thalweg.
Soil profile To prepare soil profile by boring survey. Flow capacity Based on the cross section survey drawing, calculating of waterlevel and flow capacity, to evaluate
how frequent the flooding occurs on the floodplain. Source:JICA Project Team
By doing the proposed basic investigation, it is possible to evaluate the channel stability, inundation frequency on floodplain and urban area. Further the evaluation results can be reflected in the dam operation, planning and design of large irrigation project within floodplain, reference to navigation route management and providing of disaster information with riverine area and land use planning. Those beneficial outputs from river cross section survey are shown in Figure SR5.3-34.

The Project for Review and Update of Nigeria National Water Resources Master Plan
Volume-5, SR5 (SR5-133)
Source: JICA Project Team
Figure SR5.3-34 Beneficial Output from River Cross Section Survey
Following are examples which can explain the beneficial usage of cross section data.
Figure SR5.3-35 is the satellite image during the 2012 flooding in the Benue river downstream. The cross section extent is shown in the image. Figure SR5.3-36 is the cross section derived from SRTM3 corresponding to the cross section extent. From the satellite image, we can know approximate flooded width over the cross section. In this case, the width is 9,640 m as an estimate. According to the cross section, the flood elevation on 2012/10/13 is assumed to be around 55 m, in which the proposed irrigation area would be flooded. Also from this cross section figure, the discharge can be calculated.
Source : NASA HP13
Figure SR5.3-35 Satellite Images of the confluence of the Niger and the Benue River near Lokoja (2012/10/13)
13 http://earthobservatory.nasa.gov/IOTD/view.php?id=79404
River CrossSection Survey
River Bed Elev.&
River Bank Elev.
Longitudinal Profile (River Channel Slope)
Deepest Point in cross section
Critical Waterlevel of Overflow, Flooding
River Channel Capacity(Critical Discharge
for Overflow)
Stage-Flow Conveyance
Relation
Soil Survey(Sampling, Boring)
Stability and Suitability of Floodplain Area
Planning of IrrigationDevelopment
Dam Release OperationFlood Early Warning
Safe Navigation Route
Flood EarlyWarning
&Landuse Planning
Hydraulic Modelling
Proposed Irrigation Area

The Project for Review and Update of Nigeria National Water Resources Master Plan
Volume-5, SR5 (SR5-134)
Source:JICA Project Team
Figure SR5.3-36 Cross Section and Flooding Width (2012/10/13)
Figure SR5.3-37 is another example. This is the satellite image during the 2012 flooding in the Benue river middlestream. The cross section extent is shown in the image. Figure SR5.3-38 is the cross section derived from SRTM3 corresponding to the cross section extent. From the satellite image, we can know approximate flooded width over the cross section. In this case, the width is 4,900 m as an estimate. According to the cross section, the flood elevation on 2012/09/08 is assumed to be around 98 m, in which the proposed irrigation area would be flooded. Also from this cross section figure, the discharge can be calculated.
Source : NASA HP14
Figure SR5.3-37 Satellite Images of the Benue River near Lau (2012/9/8)
14 http://earthobservatory.nasa.gov/IOTD/view.php?id=79149
20
30
40
50
60
70
80
90
100
110
120
130
140
150
0 5000 10000 15000 20000
2012 Oct. 13 Flood Level assumed from the flooded area width (9640m)in satellite image
Elevation (m)
Distance (m)
Proposed Irrigation Area (W=4km)
Proposed Irrigation Area

The Project for Review and Update of Nigeria National Water Resources Master Plan
Volume-5, SR5 (SR5-135)
Source:JICA Project Team
Figure SR5.3-38 Cross Section and Flooding Width (2012/9/8)
(5-4) Guidance to Flood Modeling for the Niger and Benue River
Introduction
The hydrological modeling for surface water was done in this JICA Project as described in Section SR2.3.3, Volume-5 Supporting Report.. The hydrological model can simulate long term flow variation on monthly basis in each SHA, which covers major tributaries of the Niger and Benue river system. The hydrological model, while to be further developed and calibrated, shall be the core tool for water resources management and development in Nigeria.
The 2012 flood in Nigeria, especially which affected the floodplain along the Benue and the Lower Niger River, revealed the flood water level at certain place should be monitored at least daily basis. This flood phenomenon for short time such as daily and week should be studied by hydrological model as well as by site investigations such as flood mark survey, flood condition interview survey.
For the flood modeling in the future in Nigeria, it is necessary to use a rainfall data set which can reflect both spatial and temporal distribution for the Niger- Benue river basin. In this report, JICA Study team introduces the satellite based rainfall data called GSMap as a reference for guidance to flood modeling.
Also, for the starting of flood modeling work, it is necessary to take into consideration of the daily observed river discharge data for the calibration. Because the model design should be depending on the location and period of such observed discharge data set as well as the dam operation data availability.
GSMaP
Global Satellite Mapping of Precipitation, hereinafter called GSMaP, is a satellite-produced spatial rainfall data set in global basis by Japan Aerospace Exploration Agency (JAXA).
The GSMaP Project was sponsored by JST-CREST and is promoted by the JAXA Precipitation Measuring Mission (PMM) Science Team, and the GSMaP products were distributed by the Earth Observation Research Center, Japan Aerospace Exploration Agency.
JICA Project Team requested GSMap data to JAXA in February 2013 through JICA for the purpose of studying of 2012 rainfall in Nigeria. JAXA provided the GSMap data in electrical form with JICA Study Team in April 2013.
The provided GSMap Data is described in general as follows,
70
80
90
100
110
120
130
140
150
0 5000 10000 15000 20000
2012 Sep 8 Flood Level assumed from the flooded area width (4900m)in satellite image
Elevation (m)
Distance (m)
Proposed Irrigation Area (W=6km)

The Project for Review and Update of Nigeria National Water Resources Master Plan
Volume-5, SR5 (SR5-136)
Table SR5.3-16 General Description of obtained GSMap Data Item Description Item Description
Data Coverage N3.95 to N39.95 W18.95 to E35.05
Frequency Daily Average rainfall as mm/h
Resolution 0.1 degree (541 columns and 361 rows)
Data Format Ascii (Text)
Period January 1, 2005 to December 31, 2012
Number of grid data
Approx. 570 million grid
Source:JICA Project Team
The data coverage of the obtained GSMap is shown in the Figure below. In the figure, the area of the Niger River Basin is added as green color area. The obtained GSMap coverage is covering the entire Niger River Basin.
Source:JICA Project Team
Figure SR5.3-39 Data Coverage of Obtained GSMap Data
JICA Study Team processed the obtained GSMap data to observe the spatial rainfall distribution by visualization of monthly value in Hydrological Area in Niger River Basin and Nigeria.
The following Figure shows the catchment boundary of the entire Niger River Basin. The number from 1 to 5 in the figure indicates the name of sub-catchment for upstream of the Niger River for the JICA Study. The number 6 catchment is the entire Nigerian Hydrological Area including the areas belonging to adjacent countries.

The Project for Review and Update of Nigeria National Water Resources Master Plan
Volume-5, SR5 (SR5-137)
Source:JICA Project Team
Figure SR5.3-40 Sub-catchment Boundary in Niger River Basin
The Table below is the monthly rainfall of average during 2005-2012 and the monthly rainfall in 2012 only for the sub-catchment for upstream of the Niger River. It is revealed that in sub-catchment 2 had 50 to 60 % higher than the average in June and July in 2012, in which Niamey in Republic of Niger was affected by floodwater in 2012. Also it is revealed that in sub-catchment 4 had 35% higher than the average in April in 2012, in which the inland delta area was affected by floodwater in 2012.
Table SR5.3-17 Ratio of 2012 Monthly Rainfall to Average (2005-2012) in Upper part of Niger River Basin
source:JICA Project Team
The Table below is the monthly rainfall of average during 2005-2012 and the monthly rainfall in 2012 only for HA. It is revealed that in HA3 had 45 % higher than the average in June in 2012, in which was the runoff source from Cameroon territory to affect the Nigeria by floodwater in 2012.
Catchment Jan Feb Mar Apr May Jun Jul Aug Sep Oct Nov Dec1 2.6 10.3 26.6 81.7 184.9 259.6 253.8 287.2 249.4 132.2 11.7 2.12 2.2 2.7 5.4 9.3 30.0 90.8 200.3 233.5 127.6 24.9 2.5 1.64 1.2 2.6 3.5 20.2 56.8 115.5 194.5 241.8 124.3 32.6 1.0 0.65 2.7 2.9 2.1 3.1 10.0 34.4 49.0 81.7 30.5 7.4 0.8 1.43 3.6 3.6 2.1 3.2 11.2 35.4 71.0 100.9 35.0 7.8 1.0 1.71 0.0 5.2 2.9 74.7 174.9 239.1 224.7 261.5 249.8 174.7 29.3 2.32 0.0 2.3 0.4 6.0 23.3 139.4 323.6 259.0 152.5 27.2 0.7 0.54 0.1 4.8 0.8 27.2 52.0 126.9 206.3 282.3 134.5 38.6 0.2 0.15 1.9 1.6 0.2 2.1 9.1 39.5 48.9 71.4 34.9 11.1 0.0 0.13 0.0 0.4 0.1 1.6 13.8 13.6 67.9 77.5 35.4 11.6 0.0 0.21 0.00 0.51 0.11 0.91 0.95 0.92 0.89 0.91 1.00 1.32 2.50 1.102 0.01 0.85 0.07 0.64 0.78 1.54 1.62 1.11 1.19 1.09 0.26 0.304 0.05 1.89 0.22 1.35 0.92 1.10 1.06 1.17 1.08 1.18 0.20 0.215 0.71 0.56 0.09 0.70 0.92 1.15 1.00 0.87 1.14 1.52 0.06 0.073 0.01 0.11 0.03 0.52 1.23 0.38 0.96 0.77 1.01 1.49 0.01 0.09
Average(2005-2012)
2012
Ratio of2012 toAverage

The Project for Review and Update of Nigeria National Water Resources Master Plan
Volume-5, SR5 (SR5-138)
Table SR5.3-18 Ratio of 2012 Monthly Rainfall to Average (2005-2012) in Hydrological Area for Nigeria
source:JICA Project Team
While the above 2 tables show only monthly basis amount, the obtained GSMap data is providing daily basis rainfall amount for spatially , produced for the upper part of the Niger River Basin, and HA as well as SHA. GSMap can provide valuable viewpoints which cannot get from conventional ground observation data.
Proposed Flood Modeling for Niger – Benue river basin
In order to develop a flood model, it is necessary to select a calibration point for the flood model. Such calibration point should be located comparatively upstream, in which there are few discharge control structure such as dam, having long term period of daily discharge data. The Table below shows the daily discharge data availability in Niger-Benue river basin based on FMWR and Niger Hycos web site. As shown in the table, Niamey and Lokoja stations have comparatively long and continuous, however Niamey is located outside of Nigerian border and Lokoja is located downstream of the Niger and Benue river confluence.
In the case of Niger-Benue river basin, such appropriate location is not available.
Garoua, which is located on the Cameroun along the Benue river, has the daily discharge data in 2012, while the observed discharge had been influenced by the operation of Lagdo dam.
In Niger-Benue river flood modeling, at least more than 2years duration’s daily discharge variation should be calibrated to consider dry and rainy seasons soil moisture variation which is conceived as dominant flood runoff. As of July 2013, such daily discharge data set is not available, also major dam operation data (reservoir inflow and outflow including spilling) is not available. It is difficult to model calibrate, however, assuming that such data set will be accumulated in 2014 or later, the following practical modeling concept shown below.
(unit:mm)HA Jan Feb Mar Apr May Jun Jul Aug Sep Oct Nov Dec1 0.3 1.0 1.2 24.9 103.3 161.5 214.8 284.3 184.2 53.6 0.6 0.42 2.2 8.6 21.5 166.3 262.8 238.1 265.3 270.6 319.6 175.4 5.2 2.83 1.3 5.2 12.2 121.8 245.4 268.7 286.3 331.3 289.4 199.5 10.7 2.24 5.1 20.9 46.0 205.8 328.1 247.5 214.5 236.3 271.1 295.9 27.5 2.55 21.7 76.0 135.3 269.5 345.4 269.1 211.0 174.2 237.7 277.4 92.0 19.06 10.9 63.8 141.8 222.9 251.9 240.5 177.8 120.6 219.4 218.8 63.1 10.67 29.8 100.6 179.4 332.4 437.1 311.8 232.8 218.6 309.9 407.8 122.0 15.38 1.5 1.7 1.5 22.9 71.8 151.6 270.1 322.0 171.5 36.0 1.7 2.01 0.1 2.6 0.3 28.5 114.7 111.8 222.6 212.2 238.8 53.8 0.1 0.32 2.0 8.8 10.1 195.9 313.0 200.4 239.4 178.1 283.1 199.9 7.6 0.63 0.8 4.7 2.3 130.7 251.1 388.6 348.1 308.1 304.1 221.0 28.8 1.04 2.4 13.8 10.1 152.3 399.1 245.7 251.9 174.2 232.8 324.8 61.1 0.45 12.5 113.6 70.0 265.2 264.3 234.4 175.2 107.1 203.5 293.0 152.9 16.16 8.8 87.6 73.6 279.6 183.9 246.9 140.3 51.0 163.2 235.1 116.1 5.47 9.6 120.5 70.3 350.4 391.5 281.7 216.7 162.0 245.1 426.5 199.9 14.28 0.3 0.3 0.7 16.9 98.2 196.3 284.5 352.1 211.4 23.5 0.2 0.51 0.48 2.59 0.24 1.15 1.11 0.69 1.04 0.75 1.30 1.00 0.15 0.862 0.89 1.02 0.47 1.18 1.19 0.84 0.90 0.66 0.89 1.14 1.45 0.223 0.62 0.89 0.18 1.07 1.02 1.45 1.22 0.93 1.05 1.11 2.69 0.444 0.47 0.66 0.22 0.74 1.22 0.99 1.17 0.74 0.86 1.10 2.22 0.175 0.58 1.49 0.52 0.98 0.77 0.87 0.83 0.62 0.86 1.06 1.66 0.856 0.81 1.37 0.52 1.25 0.73 1.03 0.79 0.42 0.74 1.07 1.84 0.517 0.32 1.20 0.39 1.05 0.90 0.90 0.93 0.74 0.79 1.05 1.64 0.938 0.18 0.21 0.45 0.74 1.37 1.29 1.05 1.09 1.23 0.65 0.13 0.26
Average(2005-2012)
2012
Ratio of2012 toAverage

It is propthe Nige
The rainsurface wmodelingmodel fodetailed provided
The Nigonly bourainfall wdischargShiroro,
source:JICA
Figure S
posed that ther River mod
nfall runoff mwater resourg, shorter peor SHA basisdata availab
d shorter peri
F
ger river sub-undary condwithin the m
ge calibrationGoronyo, B
A Project Team
SR5.3-41 Ava
he Niger-Bendel and the Be
model comporces model weriod of rains is recommbility. For thiod of rainfal
Figure SR5.3
-model basicditions from
model area is n can be possakolori and o
ailability of
ue river flooenue river m
onent for thewhich was d
nfall and runended at inite rainfall dall such as dai
3-42 Schema
cally covers outside of
given to simsible at Baro others are ne
(SR5-139)
Daily Disch
od model shomodel as show
e flood modedeveloped in
noff process tial modeling
ata to be useily and high
atic Image o
HA1 and HAthe model.
mulate the runstation, how
eeded to impr
Niger
harge Data i
ould be develwn in the two
el shall be ban this JICA should be cog work phasd, GSMap ispatial resol
of Niger Riv
A2 and use tIn addition noff and floo
wever, the damrove the disc
The Project ia National Wat
n Niger-Ben
loped from 2o figures belo
ased on the sProject. Esp
onsidered ane because ofs a candidateution.
er sub-mode
the daily disto the disch
od discharge m operation charge calibr
for Review andater Resources M
Volu
nue River
2 sub-modelsow.
similar concepecially for tnd the simplef the model ate resource b
el
scharge of Nharge at Niain river chandata in Kain
ration accura
d Update of Master Plan
me-5, SR5
s, namely,
ept to the the flood e lumped area size,
because it
Niamey as amey, the nnel. The
nji, Jebba, cy.

The Benboundarythe modcalibratiooperationdischarg
The discat Baro advance
Regardindownstresub-mod
After theriver floo
(6) Eros
(6-1) Er
As frequPre-Camformer ilater sedcomplexwhen theby river
The flat the land
The gullAmong tapprox. gully ero
Gully erseveral f
15 Egbo
Symposium16 Floy
F
nue river sub-y conditions
del area is gion can be pn data in L
ge calibration
charge at Lokstation. The
.
ng the Loweam dischardels.
e calibration od model in
sion Contro
rosion Probl
uently descrimbrian basem
s extensive diments (fluvx and the sede sea level wflow or slop
erosion surfhas little veg
ly erosion inthe sites, the1,100km2) aosion.
rosion, sincefactors are in
oka, Okpoko, Gm, July 1984, p
yd, B., Soil Eros
Figure SR5.3
-model basic from outsidiven to simupossible at G
Lagdo, othersn accuracy.
koja is influeerefore the
wer Niger rirge can be
of the aboveorder to use
l
ems in Nige
ibed in manyment compleerosion surfavial). In othdiment along
was higher thae failure as w
face of basemgetation.
n Nigeria has Agulu-Nank
and some cou
e its scale isnvolved in th
Gully erosion inpp.335-347 sion and Deteri
3-43 Schema
cally covers He of the modulate the runGaroua, Yolas along the
enced by theBenue river
iver reach (modeled as
e sub-modelsfor flood for
ria
y documentsex and low face and the her words, tg the rivers an the presenwell as gully
ment comple
s been paid ka site15 16 iuntermeasure
s large, can he developme
n the Agulu-Nan
oration in Easte
(SR5-140)
atic Image o
HA3 and HAdel. In additionoff and flooa, Ibi, MakuBenue and
e discharge frr sub-model
(HA5), the s similar wa
s, they shoulrecast and ris
s, the topogrelevated arelatter is the the boundaryis terrace w
nt. The prese erosion and
ex develops
attention to in Anambra es have been
be paid atteent of such l
nka region of A
ern Nigeria, Nig
Niger
of Benue Riv
A4 and use thon to the discod dischargeurdi and Lo
Gongola ri
rom the Benushould be
discharge aay to the N
ld be coupledsk assessmen
aphy of Nigea along theflattened vay between t
with cliff whient terrace w
foot spring,
gully erosio
since the BrState was on
n applied bei
ention to, hoarge gully. In
Anambra State, N
g. Geogr. J. 8(1
The Project ia National Wat
ver sub-mod
he daily dischcharge at Ba
e in river chkoja stationsvers are nee
ue river systcalibrated at
at Lokoja isNiger river a
d to create thnt.
eria is comp Niger-Benu
alley infilled the erosion ich was creaith cliff has pto extend ou
on if rainfall
ritish coloniane of the largng a symbol
owever, it shn Agulu-Nan
Nigeria, Procee
965), pp33-43
for Review andater Resources M
Volu
del
harge of Bararo, the rainfahannel. The dns, however, eded to imp
tem and the dat Makurdi s
s given, theand the Ben
he entire Nig
posed of highue river systwith Cretacsurface of b
ated by fluvipotential to buterward.
intensity is
al era in 19th
gest (Figure Sl in terms of
hould be cernka site, it is
edings of the Ha
d Update of Master Plan
me-5, SR5
ro as only all within discharge the dam
prove the
discharge station in
e further nue river
ger-Benue
h land of tem. The
ceous and basement ial action be eroded
high and
h century. SR5.3-44, f Nigerian
rtain that s reported
arare

that the system, ritself17. Tof infras
(6-2) Er
a) Issu
The pro
17 EnuvManageme
18 EgboSymposium
road construresulting intoThe man-mastructure such
rosion Contr
es
oblematic ph
vie G. Akpokodent Implicatioooka, Okpoko, Gm, July 1984, p
uction passino the rill dev
ade activities h as road, qu
Figure SR
rol
henomenon o
dje, Akaha C. Tons , Scientia AfGully erosion inpp.335-347
ng the streamvelopment as
to cause guluarry, cultivat
R5.3-44 Agu
on gully ero
Tse, Nnamdi Ekefricana, Vol. 9 (
n the Agulu-Nan
(SR5-141)
m source mads well as the lly erosion intion, footpath
ulu-Nanka si
osion in Ni
eocha , Gully E(No.1), March, nka region of A
Niger
de considerabgully, and prn the Southeh, grazing an
ite Gully Er
geria are sh
Erosion Geohaz2010, pp 20-36
Anambra State, N
The Project ia National Wat
ble change oroduced inveastern in Nig
nd high popu
rosion Map1
hown in the
ards In Southea6 Nigeria, Procee
for Review andater Resources M
Volu
on rainwater erse effect ongeria are conulation densit
8
e left colum
astern Nigeria
edings of the Ha
d Update of Master Plan
me-5, SR5
drainage n the road nstruction ty.
mn of the
and
arare

The Project for Review and Update of Nigeria National Water Resources Master Plan
Volume-5, SR5 (SR5-142)
following table. This table indicates the assumed man-made factors for each problematic phenomenon on gully erosion. It is important to make comprehensive countermeasures for each man-made factor.
Table SR5.3-19 Assumed man-made factors for each problematic phenomenon on gully erosion in Nigeria
Construction of Infrastructure
(road) Quarry Cultivation Footpath Grazing Urbanization
The earth surface road in urban area to be eroded easily by rainfall
● ● ●
Slope failure along main road(rill erosion)
●
Steep slope failure just behind the residential area
● ●
Farmland loss due to sheet erosion
● ●
Large scale gully erosion to affect downstream area (sedimentation)
● ● ● ● ● ●
River Bank erosion ● ● ●
Source:JICA Project Team
According to Floyd B.’s paper19, since the beginning of 20 century, an effort by the Government was made to prevent surface water from directly entering the head of the gullies. Water courses, drainage ditches, sunken footpaths, and other catchment features were blocked and the water diverted. Circular soak-away pits or sumps were dug alongside footpaths to encourage runoff to disappear underground. Rainwater collected in the depressions and was thus prevented from running downs the slopes.
Shrubs and trees were planted in the holes to stabilize the land. Establishing a protective plant cover within the watershed was considered absolutely vital. Farming was prohibited in the areas immediately adjacent to the gullies and a number of shrubs and trees, capable of surviving on the dry, acid sands and sterile bare slopes were introduced. Among the plants tested were those called Acioa barteri, which acts not only to protect the soil from drop erosion, but also probably to restore fertility.
Mechanical works in the form of earth check dams across the gully floor, and stepping of walls, were also undertaken, with less favorable results. Some dams were swept away by flood waters from violent storms. Others were undermined or ruptured by the steady pressure of backed-up water. Beyond the ravines on gently sloping land where farming might be permitted, narrow-based contour terraces (Bunds) were made obligatory, and strip cropping was strongly encouraged.
Even in the time of Floyd’ paper, it was pointed out that
All methods of controlling erosion are to be capable of slowing down the pace of destruction and stabilizing the smaller gullies.
Because of change of Government policies, there was little indication of willingness for farmers to adopt the procedures deemed necessary.
Controversial land tenure issue (ownership over land) for effective scheme of soil conservation Sociological and religious considerations against soil conservation activities Throughout the Eastern Region, the work of soil conservationists must be supported by the efforts
of agriculturists, economists, educators, politicians, even psychologists, in order to convince the people that fundamental changes in land use are essential and long overdue.
b) On-going Project/Programs
FMAWR studied in 2009 the current status of flood control and erosion control projects20. There are on-going projects of Federal Ministry of Environment Budget and of Ecological Fund based, which is said to be 2 % of the total Federal Government budget.
19 Floyd, B., Soil Erosion and Deterioration in Eastern Nigeria, Nig. Geogr. J. 8(1965), pp33-43
20 FMAWR, Water Sector Consultancy Services for National Water Resources Baseline Studies on Erosion and Flood Control, Drought Management and Desertification Control, Final Report, Flood Control System Company Limited, 2009
Phenomenon Man-made factor

The Project for Review and Update of Nigeria National Water Resources Master Plan
Volume-5, SR5 (SR5-143)
According to the Federal Ministry of Environment Budget in 2011, the totally 7,229 million Naira was allocated to erosion and flood control project. The following table shows the significant feature of the 2011 Budget. The total number of project (on going and new projects) is 65, so the average amount for one project is about 100 million Naira annually. However, there is a large variation in terms of the size of project, in which the largest amount for a new project was 633 million Naira.
Table SR5.3-20 Variation of Allocated Amount for Erosion and Flood Control Project in FME Budget 2011
2011 Budget Number The smallest amount The largest amount
Million Naira Million Naira On-going Projects 6 37 600 New Projects 59 17 633 source:JICA Project Team
According to the Federal Ministry of Environment Budget in 2012, the allocated amount for erosion and flood control project is only 1,984 million Naira. No new project was allocated. It is understood that year by year the allocated amount for erosion and flood control can change drastically in the FME.
Nigerian Erosion/ Watershed Management Project (NEWMAP)
The overall objective of the Nigeria Erosion and Watershed Management Project (NEWMAP) is to support participating states and local governments to reduce vulnerability to erosion financed by World Bank. The relevant Federal Governments are FMF, FME and FMARD.
This is to be achieved by applying a comprehensive watershed management approach and by selecting and implementing affective engineering/ecological solutions for selected erosion sites. The project will focus on nine states21, namely Anambra, Abia, Imo, Enugu, Ebonyi and Kaduna, Kano Ogun. The project includes two major components of investments in targeted areas and institutional development and establishment of information systems for erosion management and watershed planning. The total financing is said to be 508 million US$.
Land Degradation Mapping and Assessment for the Prevention and Control of Potential Erosion Hazard in Nigeria
FME conducted the study on Land Degradation Mapping and Assessment for the Prevention and Control of Potential Erosion Hazard in Nigeria in 2010 in order to assess the land condition in terms of land degradation. The main output was the mapping of nationwide land degradation condition as shown in Figure SR5.3-45, separated into 99 sheets (scale 1:250,000). Table SR5.3-21 shows the category of land degradation.
Table SR5.3-21 Category of Land Degradation Bu Built-up areas Pw Water-logged areas Cs Salinization/alkalinization Sn Stable land under natural conditions Et Loss of topsoil by wind action Ma Mined/mining areas FR Forest Reserve Wb Water body NPw Permanent swamp/flooded areas Wdr Terrain deformation by gully and/or rill erosion or mass
movements(red spots) WDu Dunes Wd Terrain deformation by gully and/or rill erosion or mass
movements(bright spots) WR Rock outcrop Wof Stream channels and adjoining lands, seasonally flooded, also dry
valleys and floodplains etc. Pc Compacted areas Wt Loss of topsoil by sheet erosion/surface wash Source: FME, Land Degradation Mapping and Assessment for the Prevention and Control of Potential Erosion Hazard in Nigeria
21 This Day(Newspaper) 2012 March 09

The Project for Review and Update of Nigeria National Water Resources Master Plan
Volume-5, SR5 (SR5-144)
Source: JICA Project Team
Figure SR5.3-45 Index of Map Sheet of FME Land Degradation Map
The very serious gully erosion extent shown by “Wdr” is concentrating on the sheet 63, 71, 72 and 79. They are located in HA5 and HA7. And the total area of “Wdr” and “Wd” which is potential gully erosion is estimated to be about 23,000km2.
Table SR5.3-22 Area evaluated as Serious Gully Erosion Sheet No. Area(km2) Sheet No. Area(km2)
62 0.5 71 36 63 57 72 524 68 2.5 78 2.4 70 0.8 79 83
Source: JICA Project Team
Table SR5.3-23 Thematic area-regional development Ministry of Environment Priority Projects
Cost in N’m Total
2010 2011 2012 2013 Erosion , Flood and Coastal Zone Management
3,246.62 3,069.72 3,332.95 9,649.29
i. Emergency call centers ii. Mobile advanced command, control and communication system(AC3s) iii. Purchase of 2 helicopters iv. seven mobile clinics
3,246.62 3,639.44 3,732.95 10,619.01
Source: NPC, The First National Implementation Plan for NV20:2020, Volume I: The Vision and Development Priorities, p.86

The Project for Review and Update of Nigeria National Water Resources Master Plan
Volume-5, SR5 (SR5-145)
Table SR5.3-24 Thematic area-regional development Ministry of Niger Delta Priority Projects
Cost in N’m Total
2010 2011 2012 2013 Inland waterways transportation system 67.75 76.78 81.30 225.83Land reclamation, shoreline protection and flood/erosion control for seven states: Azumini(Abia State), Ibakan Nsit(Akwa Ibom State), Odi(Bayelsa State), Essien Town(Cross River State), Ijaghalla(Delta State), Okhelen Awo(Edo State), Amadi Ama(Rivers State)
853.86 967.71 1,024.63 2,846.20
Feasibility studies and design on land reclamation, shoreline protection and flood/erosion control for 10 sites in Niger Delta region
27.10 30.71 32.52 90.33
Gully reclamation, slope protection, primary/secondary drain channel construction, culvert construction at Idumuje-Unor(Delta State)
6.39 7.24 7.66 21.29
Source: NPC, The First National Implementation Plan for NV20:2020, Volume I: The Vision and Development Priorities
c) Strategies
Information which was obtained by Social Survey
JICA Project Team conducted a sub-contract survey entitled “Social and Economic Survey related to Water Sectors” in 2011-2012. This survey included to request each State Government to answer the questionnaire on flood and erosion control in the State. The number of State from which the Survey collected the more or less relevant information was 17 States among the 37 States including FCT. The states which answered for the questionnaire in terms of flood and erosion control are as follows,
Table SR5.3-25 List of States from which information collected on flood and erosion State State State State
Adamawa Cross River Kwara Oyo
Anambra Delta Nasarawa Taraba
Bauchi Ebonyi Niger
Bayelsa Kebbi Ogun
Benue Kogi Osun Source: JICA Project Team
The descriptions from those States are quite various. In general, the common policies on flood and erosion in State level can be understood as follows,
Prevention: Before the onset of rains, the existing drainage system in the town is desilted to pave way for free flow of storm waters.
Mitigation: More drains are being constructed to curb the menace of flooding and erosion.
Response and Preparedness: Usually, flood early warning system is put in place. The citizens are warned through radio jingles on the rainfall pattern as predicted by NIMET. Equally, information received from other relevant agencies is also communicated to the populace.
Recovery: The SEMA is the organ of government responsible for disaster handling/management in the state including flood victims.
It can be pointed out that quite a few States concerns the blockage of drainage by garbage dumping when they are mentioning about flood and erosion. They are focusing on urban drainage issue as urban environment improvement.
Most of the State Government stresses more funding from Federal Government and technical assistance continually in order to implement their planned projects.

The Project for Review and Update of Nigeria National Water Resources Master Plan
Volume-5, SR5 (SR5-146)
(7) Inland Waterway Navigation
(7-1) History of Inland Water Transport in Nigeria22
The inland navigation transportation in the current territory of Nigeria started in the nineteenth century as European countries started trading activities using the Niger river course with the European continent. The Niger river received a lot of interest of the world’s explorers since 16th century. A lot of explores tried to enter the downstream of the Niger river from the upstream near Sahara desert, however, because of some rapids in the section between Niger and Nigeria they faced much difficulty in the course of exploration. It is very famous that Mongo Park lost his life in the Niger river in 1805.Since John Richard Lander discovered the route from the Niger delta to the ocean in 1832, the Niger river became internationally, important commercial navigation route.
In 1850’s, British Government started the international trade for palm oil and others such as groundnuts, leather, tobacco, cotton, beans and elephant tusk. In 1870, the steam engine boat was introduced in Nigeria, and the British-supported companies such as United African Company did business in the Niger river, so the trade and the inland navigation became active. Moreover the Nigeria became the protectorate of the British Government in the Berlin Conference in 1885, consequently many European companies came to Nigeria to do their own business.
In 1898, the Colonial Government decided to extend the railway in Lagos to other areas and the transportation method for the trading was shifted to railway from inland navigation. The Royal Niger Company, which was called United African Company, lost the business power.
In 1906, the British unified the protectorates in the North and the South in Nigeria. Until 1912 many European trading companies also penetrated the Lower Niger from the coast and established trading stations at Aboh, Burutu, Warri, Onitsha, Lokoja, and other riverside towns. They purchased agricultural products which they exported overseas via the seaports. They also conveyed imported manufactured goods from the seaports to the hinterland.
In 1912, the railway line between Lagos, Minna, Kano and Baro opened.
In 1914, the British Government unified the Northern Nigeria and the Southern Nigeria. And by 1940, the British Government put heavy investment on road network in all of the Nigeria.
In terms of the Governmental organization on inland navigation, in 1901 Government Marine Department (GMD) was established. GMS implemented dredging works in various ports from 1924 to 1939. In 1954 GMD was split into 4 departments, namely the Nigerian Ports Authority, the Nigerian Navy, Coastal Agency, and the Inland Waterways Department. The Inland Waterway Departments took over all operations concerning Nigeria’s inland waterways.
However, by 1960s, trade and water transport began to decline in the Lower Niger as inland water transport experienced neglect with the shift from water to rail and road transport. The decline equally deepened when crude oil displaced agriculture as the main stay of the Nigerian economy.
In 1997, the Inland Waterway Department was again transformed into the National Inland Waterways Authority (NIWA) by Decree No. 13 of 1997, as a parastatal under the Federal Ministry of Transport. The headquarter of NIWA is located in Lokoja.
Source: NIWA
Figure SR5.3-46 Organization Chart of NIWA23
22 Anthony Danladi Ali, Trade and Transport in the Lower Niger 1830-2011

The Project for Review and Update of Nigeria National Water Resources Master Plan
Volume-5, SR5 (SR5-147)
(7-2) National Policy
The First National Implementation Plan for NV20:2020 (2010-2013) Volume II: Sectoral Plans and Programmes by National Planning Commission, Page 23.
Nigeria has 12 major inland navigable rivers of about 3,800 km. The country also has an extensive coastline of about 852 km. This offers great potential for the movement of goods and passengers from the coast to the hinterland, since these waterways traverse 20 out of the 36 States of the country. The Niger River and the Benue River (including its major tributaries and estuaries) are the principal waterways. The waterways are characterized by inadequate river ports, poor navigational and communication infrastructure, high rates of sediment and poor maintenance.
In order to tackle the deficiencies of the water transport sub-sector, government aims at promoting the development of the sector by eliminating the major physical constraints, promoting pricing policies (that help shift traffic back to inland waterways), restructure the supervisory agency, and provide opportunities for private sector participation in the operation and development of new inland waterways infrastructure.
The development of inland water transport will ease pressure on the over congested road sector and will enhance the mobility, welfare, and development of many remote and underprivileged communities. However, this mode of transportation has been neglected in the past three decades due to inadequate investment. Government has recently embarked on the dredging of the lower river Niger from Warri in Delta state to Baro in Niger state to enhance the all year navigability. When completed this will decongest Lagos and Port Harcourt sea ports and reduce pressure on the roads. The dredging project which spans 8 states namely: Niger, Kogi, Anambra, Imo, Edo, Delta, Rivers and Bayelsa has been divided into five lots to ensure its timely completion. They are:
Lot 1 - Warri to Bifurcation (154 km) Lot 2 - Bifurcation to Onitsha (116 km) Lot 3 - Onitsha to Idah (118 km) Lot 4 - Idah to Jamata (108 km) Lot 5 - Jamata to Baro (76 km)
Sea Ports
The seaports are of great significance for the economic development of Nigeria as they practically handle all the country’s imports and exports with the potential of increasingly serving the landlocked countries of Niger and Chad. All the ports in Nigeria were owned and operated by the Nigerian Ports Authority (NPA). NPA’s assets comprise 13 major ports, 11 oil terminals, and 128 jetties with a total annual cargo handling capacity of 35 million tons. Nigerian ports are dependent on imports, which constituted on the average about 70 per cent of the total cargo. The ports mainly handle imports, ranging from between 31.6 per cent and 6.7 per cent for general cargo, 53.5 per cent and 44.5 per cent for bulk cargo, and 23.6 per cent and 22.6 per cent for containerized traffic.
NPA which owns the ports on behalf of the Federal Government was established to provide infrastructure and services at the seaports. However, due to inefficiency of services, poor maintenance of infrastructure, corruption, excessive bureaucracy which made Nigerian ports uncompetitive, the government in 2001 commenced the reform and restructuring of the ports to introduce private sector participation. In April, 2006 private terminal operators took over handling operations when the ports were concessioned to private terminal operations after international competitive bidding, based on the Landlord model. The concession of the operation of the ports was done in conjunction with fundamental reforms in structure, institutional arrangements and operational modalities. NPA remains the regulatory agency supervising port operations and development.
Shipping
Nigerian indigenous companies have in the past made unsuccessful attempts to participate in the carriage of Nigerian crude oil, and exploit the opportunities available. Nigerian produces and exports a daily crude oil output of approximately two million barrels a day, of which 57 per cent (fifty seven per cent) accrues directly to Nigerian National Petroleum Company by virtue of its joint venture
23 NIWA’s Charter of Service Compact(SERVICOM)

The Project for Review and Update of Nigeria National Water Resources Master Plan
Volume-5, SR5 (SR5-148)
arrangement with the multi-national oil companies.
Article 2 of the National Shipping Policy Act of 1987, which is based on the recommendations of the United Nations Conference on Trade and Development (UNCTAD), makes it mandatory for indigenous shipping lines under the code cargo sharing formula of 40:40:20, to carry at least 40 per cent (forty per cent) of the cargo generated in that country. A majority of the oil producing and exporting countries in the world, either the governments or the producing and marketing organizations of those countries, adopt operational and marketing strategies that exploit the revenues and profit opportunities of all the modal interfaces of the oil marketing chain, including shipping. This will encourage foreign shipping companies to register In Nigeria and flag vessels supplied under Nigerian colors, thereby ensuring that a substantial amount of the crew are Nigerian and expanding the Nigerian Ship Registry.
Source: World Bank (The arrow in this figure is the dredged section in 2009-2012. Some legends were improved by JICA Project Team.)
Figure SR5.3-47 Navigable Route in Niger and Benue Rivers in Nigeria
(7-3) Issues and Challenges for the Transport Sector
The key challenges facing the Nigerian Transport sector according to Vision 20:2020 are:
Dilapidated infrastructure
The railway system has almost ceased to function, with infrequent trains on a limited number of routes, and only a small percentage of locomotives remain serviceable. Many inland waterways are no longer navigable because of sedimentation, water vegetation, wrecks and other obstructions. Also relevant are inadequate port infrastructure, poor communication and navigational aids, piracy, environmental constraints, legal disagreements between State and Federal jurisdictions.

The Project for Review and Update of Nigeria National Water Resources Master Plan
Volume-5, SR5 (SR5-149)
Institutional reform
The enactment of the Infrastructure Concession Regulatory Commission (ICRC) Act, 2005 has created an enabling environment for PPP participation in infrastructural development in Nigeria. Key policies and legislation will need to be created to establish the appropriate institutional framework for each mode of the transport sector. The legislation for the relevant transport modes will:
• Separate policy, regulation and operation • Develop the economic and safety framework for the sector • Create the environment for PPP
Inadequate funding
The public transport infrastructure lacked investment and adequate maintenance for many years, in spite of significant sums being expended in various sectors and institutional reforms. A major challenge in the transport sector is to have adequate resources required for investment in all the modes. The problem of inadequate funding is reflected in the poorly maintained roads, dilapidated rail network and rolling stock, obsolete navigational equipment for the aviation sector and waterways that are not navigable year round.
Absence of Multi-modal Integrated Transport System
The inadequate attention to other modes of transportation has led to imbalance in the distribution of traffic with roads responsible for over 90 per cent. With inadequate investment in maintenance and rehabilitation, the roads have deteriorated over the years. To correct this imbalance the government will address the following:
• Rehabilitate the rail connection to the ports • Link the four major international airports to road and rail • Modernize the rail system
The Objectives, Targets and Strategies are as follows.
In line with the vision, the following are the objectives for the transport sector during the first implementation plan period:
(i) To provide adequate transport infrastructure and services for even socio-economic development of the Country;
(ii) To ensure the provision of safe, efficient and cost effective transport services for the country; (iii) Develop the capacity to sustain and continuously improve the quality of transport infrastructure and
service delivery in the country (iv) To create an enabling environment for private sector participation in the provision of transport
infrastructure (v) Develop a seamless inter-modal transport system
The target and strategies for achieving the above objectives are listed below:
Mode: Waterways
• To increase the navigable routes on the inland waterways to 3,000km • To increase inland waterways traffic and passengers substantially • To introduce private sector participation in the provision of inland waterway services • Rehabilitate and construct key river ports, jetties and wharfs (Baro, Lokoja, Onitsha, Oguta, Degema
and Yenagoa) by 2013
Strategies
• Dredge and reclaim the rivers Niger and Benue
• To concession routes to the private sector
Dr. Anthony Danladi Ali “Trade and Transport in the Lower Niger 1830-2011” reviewed the inland transportation in Nigeria as follows,
In the colonial period the Lower Niger was useful to trading firms only as a means of exporting product overseas. In 1870, the motor engine was introduced to ply boat in the Lower Niger, movement has been faster and more convenient.

The Project for Review and Update of Nigeria National Water Resources Master Plan
Volume-5, SR5 (SR5-150)
But when the railway and roads were constructed, the transportation on the Lower Niger River declined so that people involved in the colonial trade diverted their investment to other business.
Since the independence of Nigeria, the Nigerian Government did not take transportation in the Lower Niger seriously. Although NIWA was created in 1997 by the Federal Government, the activities of marine department completely declined and many private operators diverted the investment to other forms of business. Some Nigerians except the river side dweller think that effort at making the Lower Niger navigable all year round is not viable.
It is possible to develop transportation in the Lower Niger river to make it navigable all year round, and the Lower Niger river could serve as an alternative mode of transportation if necessary infrastructure provided.
Federal Government has failed the necessary support by ways of finance and infrastructure. The development has been focused on roads, but there are poor linkage between the roads and other modes of transportation.
The river side dwellers need to continue to use the Lower Niger river as a principal mode of transportation.
Dr.Ali’s recommendations (main points) are as follows,
It is necessary for Nigerian Government to design a transportation system in response to private and public demands. The transportation network must be consistent with the health and convenience of Nigerians.
It is necessary to create an efficient navigable channel for the Lower Niger so that vessels can ply all year round. This is possible if the Federal Government pays adequate attention to the problem of silting and dredging. It is recommended that government furnish Nigeria’s inland river terminals and river ports with infrastructural facilities like boats, jetties, ferries, landing, loading and unloading facilities. The Lower Niger river should be made navigable all year round through capital and maintenance dredging, hydrological and hydrographic surveys, removal of wrecks and clearance of debris and other obstructions from inland waterways.
Private operators should be encouraged on the use of inland waterways transport. Promoting transportation on the Lower Niger River would create employment opportunities in riverside settlements and thereby minimize rural-urban migration.
SR5.3.2 Inland Fishery
(1) Outline of Fishery Production in Nigeria
The share of fisheries production on national GNP is as small as 1.6% (2007). The Total fishery products supply in 2007 amounted to 1,355 thousand ton, consisting of 655 thousand ton of domestic catch and 740 thousand ton of imports, the latter accounting for 54.6%. In Nigeria, domestic fishery production has been in short of the domestic demand, resulting in the chronicle imports by 50-60% of the total annual supply.
In terms of domestic fisheries types on the basis of quantities of catch, small-scale artisanal fisheries has the largest share, accounting for 70-80% of the total catch in recent years. More particularly, limited to inland small-scale artisanal fisheries, its share on the total catch comes to around 35%. On the activity basis, this type accounts for 45-50% of the total inland fisheries activity. Annual domestic catch is totaled at around 250 thousand ton, thus the annual per capita consumption of fisheries products remains at 1.6kg. Conventional fish markets without refrigerating storage facility mainly deal with primarily processed sweet water fish like catfish, with very limited amount of fresh fish. Domestic artisanal type of fisheries shows a dwindling trend irrespective of whether they are small-scale, commercial basis, marine/off-shore or inland water surface, however, catch of inland water fish as well as production of fish farms have recently shown gradually increasing tendency.
As for aquaculture, the situation shows a good contrast to the artisanal fishery, production has continued to increase since 2003. Before 2003, its share remained at only 6% or so of the total fisheries production, but in 2007 as well in 2010, it has given sharp increase 13.8% and 23.6%, respectively. Likewise, the rate of the entire catch of inland fisheries to the national total catch

accounteAccordinshare of for 29%
Source: Fe
Source: F
(2) Curr
Inland fiTable SR(excludinmain fis
ed for 53.5%ngly, assumifish farmingof the total.
ederal Ministry
F
Federal Ministr
Fig
rent situatio
isheries haveR5.3-26 shong fish farmh species in
% in 2007 ing that 50%g in 2010 to t
y of Agriculture Figure SR5.
ry of Agricultur
gure SR5.3-4
on of Inland
e been operatows the amo
ming) have alnclude Nile t
and 57.5% % of the total
the total supp
.3-48 Domes
e 49 Share of E
Fisheries
ted mainly inount of catcso been operilapia, moon
(SR5-151)
in 2010, thsupply is deply comes to
stic Product
Each Type o
n rivers thouch in major rated in othen fish, Niger
Niger
hus recently erived from to 12%, while
tion and Imp
of Catch on
ugh it is also lakes/dams
er rivers and r perch and c
The Project ia National Wat
keeping thethe domestice that of inlan
ports of Fish
the Total Ca
done in suchand streamslakes than t
catfish. Due
for Review andater Resources M
Volu
e range of c catch, the eand fisheries
h
atch
h lakes as Las. Artisanal those tabulat to rampant
d Update of Master Plan
me-5, SR5
55-60%. estimated accounts
ake Chad. fisheries
ted. Their catch by

The Project for Review and Update of Nigeria National Water Resources Master Plan
Volume-5, SR5 (SR5-152)
artisanal fishermen, not only fish itself but numbers of such predators as water fowls and aquatic animals have also been diminished.
Table below gives the catch by inland fisheries.
Table SR5.3-26 Annual Catch in Major Water Body Rivers and Lakes/Dams Catch by Inland Fisheries (MT)
Lake Chad 22,000 Niger River 13,450 Benue River 9,750
Niger River Delta 19,000 Other rivers 45,000 Lake Kainji 10,000
Total 119,200 Source:Fishery statistics of Nigeria 4th edition 1995-2007
Meanwhile, according to the 4th edition of Fisheries Statistics of Nigeria, fish farming has been operated on 60,000 ha out of the total inland water surface area, 14 million ha, equivalent to only less than 1%. Annual fish production from aquaculture amounts to 85,000 ton though recently it has been reported to reach over 100,000 ton. It follows that the mean productivity is calculated at:
85,000 / 60,000 = 1.4 t/ha/year.
Table SR5.3-27 indicates the number of fish farm ponds and water surface area surveyed by fishery department of FMARD in 2004 excluding ponds and area that were likely brackish water culture.
Table SR5.3-27 Distribution & Number of Major Inland Fish Farms / Fish Feed Mills State Dams/
Ponds Fish
farms Fish-feed
mills Area of fishPonds ha
State Dams/Ponds
Fish farms
Fish-feed mills
Area of fishPonds ha
Abia 4 40 2 50.7 Kano 17 10 1 711.6 Adamawa 16 4 0 30.2 Katsina 40 7 16 29.0
Akwa Ibom 9 98 16 57.6 Kebbi 30 56 0 57.7 Anambra 5 18 3 34.7 Kogi 35 32 0 37.1 Bauchi 33 16 0 21.9 Kwara 21 121 18 83.2 Bayelsa 16 86 4 6.3 Lagos 0 153 16 66.1 Benue 45 198 5 19.3 Nasarrawa 26 39 2 78.5 Borno 18 12 0 12.1 Niger 35 29 1 29.0
Cross River 52 191 0 385.4 Ogun 24 173 0 97.9 Delta 17 420 0 2,410.0 Ondo 8 15 3 27.6Edo 30 138 6 2.7 Oyo 29 234 9 474.0
Ebonyi 17 12 7 14.9 Osun 7 293 26 568.6 Ekiti 6 31 35 74.5 Plateau 85 18 9 186.7
Enugu 22 4 4 4.0 Rivers 22 89 0 284.6 Abuja 15 29 1 12.3 Sokoto 15 9 1 14.2
Gombe 44 15 1 10.0 Taraba 83 8 1 2.8 Imo 9 40 16 61.5 Yobe 20 13 1 9.9
Jigawa 15 4 1 63.0 Zamfara 40 9 7 37.5 Kaduna 20 10 9 59.2 Total 917 2,658 215 6.126.0
Source:Inventory of Fish Farms in Nigeria, Dec.2004, Note: All the ponds using brackish water are excluded from these pond areas.
Fish species farmed in inland fish farms generally include tilapia (Oreochromis spp.), clarias, carp (Cyprinus spp.) and mullet (Mugil spp.), though culture of catfish (clarias) occupies by far majority in and around major urban areas. Inland fish farms are clustered in HA-5, HA-6 and HA-7 because many ponds/ lakes and dish feed producing mills are concentrated in these areas and also fingerings are readily available. Average scale of fish ponds owned by a fish farming enterprise is said to be in the range 20-30 ha though no formal data is available on this matter. Some of the existing fish farms are operated by the states themselves concerned. In the cases of fish farming utilizing concrete basins, both farm area (mostly in the range of several hundred square meter) and water quantity can be economized and this type of basin farms are very often used by private fish farms managed by individual farmers.
(3) Factors detrimentally affecting Inland Fisheries
The following can be considered as causative factors negatively affecting inland fisherira

The Project for Review and Update of Nigeria National Water Resources Master Plan
Volume-5, SR5 (SR5-153)
Dam construction: Narrowing areas of suitable habitat owing to depleted discharges of floods and by drastic change in river flow state
Irrigated agriculture: Diminished areas of habitats for fish due to farmland reclamation on and around floodplains
Water pollution: Polluted water by use of agrochemicals and chemical fertilizers, drained water from mining spots
Droughts: Water deficiency/shortage caused by frequent droughts especially frequent in northern states.
Besides, the following technical and institutional factors may serve as obstacles hindering development of inland fisheries. The most serious limiting factors include short supply of fries/fingerings, low availability of fish-feeds and lack of markets/outlets of products or refrigerated storage facilities where fish farmers can store/sell their products at remunerative prices. These are major causes why fish farming fails to diffuse into central and northern areas of the country.
Immature fishery management, Inefficient fishery processing techniques, Retarded introduction/extension of private enterprises into fishery sector, Delay in human resource development among stakeholders of fisheries and Insufficient research performances on inland fisheries.
SR5.3.3 Livestock
(1) Outline of Livestock Industry
In Nigeria, share of livestock sub-sector in national GDP accounts for only about 2%, implying that this sub-sector is a minor economic sector. Major livestock species include fowls (including chicken, Guinea fowls and ducks), cattle, goats, sheep and pigs. The relative importance of this sub-sector is larger in northern part of the country but smaller in the south, for the climate in northern part is rather disadvantageous to crop farming thus dependency on livestock that can make use of natural grass/ rangeland is larger. Generally, local population keeps their livestock under traditional grazing that doesn’t require feeding of marketed feeds. In southern states, cage rearing of poultry is also observed. Cattle have been raised throughout the country but more popular in the central and northern part thereof, mainly consisting of draught “Zebu” specie, though dairy cattle are very few. Shifting grazing is major type of husbandry practiced by nomadic population who keep goats, sheep, cattle and camels. Swine constitute a lucrative livestock that are reared in non-Islamic areas. In rural areas, they are mostly reared in small-scale traditional piggery barns, but also they are intensively raised in large-scale large piggery lots in and around large urban areas.
(2) Constraints of Livestock Development
The constraints that inhibit development of livestock industry are considered as follows:
Low quality / productivity of livestock (slow growth rate, low milk yield or carcass rate), Though animal husbandry constitutes labor-intensive production system, labor force
required by livestock sub-sector has been in short, Insufficient feed base and equipment required for livestock production including rangeland
in both terms of quantity and quality, Epidemic diseases invade from neighbor countries because of no border in rangeland areas, Shortage in efficient and hygienic livestock processing/ storage facilities for meets, milk and
skins, Lack of consolidated/ streamlined abattoirs and system of marketing/ sale.
Particularly, shortage in livestock water has not constituted any limiting factor for developing livestock industry. Since luminous livestock usually is kept around natural streams, lakes/ ponds or reservoirs, and water for pigs and fowls has been availed from rainwater and groundwater, it is likely that potable water sources for livestock are more dependent on rainwater and groundwater. Also, provision/ consolidation of water points required along major transhumant routes located in northern part of the country has been behind the time.
