supporting online material for - science | aaas online material for c-di-amp secreted by...
TRANSCRIPT

www.sciencemag.org/cgi/content/full/science.1189801/DC1
Supporting Online Material for
c-di-AMP Secreted by Intracellular Listeria monocytogenes Activates a Host Type I Interferon Response
Joshua J. Woodward, Anthony T. Iavarone, Daniel A. Portnoy*
*To whom correspondence should be addressed. E-mail: [email protected]
Published 27 May 2010 on Science Express DOI: 10.1126/science.1189801
This PDF file includes:
Materials and Methods Figs. S1 to S4 References

Supporting Online Material
Materials and Methods
Site directed mutants of MdrM. The open reading frame of MdrM was
amplified from L. monocytogenes strain 10403S genomic DNA and the stop codon was
removed using the following primers: 3’- GAG GAG CAT ATG AAT ATG AAA GCA
GCA AGT ACA TCA G - 5’ and 3’- GAG GAG CTC GAG TGC TTT TTC CGT TTT
AGT AAC AAT TG – 5’. The resulting fragment was digested with NdeI and XhoI and
ligated into similarily digested pET20b. The resulting open reading frame, containing a
hexa-histidine tag, was subsequently amplified using the following primers: 3’- GAG
GAG CGG CCG ATG AAT ATG AAA GCA GCA AGT ACA TC -5’ and 3’- GAG
GAG GTC GAC TCA GTG GTG GTG GTG GTG G -5’. The amplification product was
digested using EagI and SalI and ligated into similarily digested pLIV2 to generate the
IPTG inducible construct pLIV2:MdrMHis6x. The R109A MdrM DNA construct was
made using quick change mutagenesis with the following primers: 5’ – CCA TGC TGA
TTG CTG GGG CAA TGG TAC AAG CAA TTG G – 3’ and 5’ – CCA ATT GCT TGT
ACC ATT GCC CCA GCA ATC AGC ATG G – 3’ with pLIV2:MdrMHis6x as the
template DNA. The G154C MdrM DNA construct was made using quick change
mutagenesis with the following primers: 5’ – GAA CTT TGC CCC AGC AAT TTG
CCC GAC ACT TTC AGG – 3’ and 5’ – CCT GAA AGT GTC GGG CAA ATT GCT
GGG GCA AAG TTC– 3’ with pLIV2:MdrMHis6x as the template DNA. DNA
sequencing was performed by the UC Berkeley DNA sequencing. Mutant plasmid was
transformed into chemically Z-competent (Zymo Research) SM10 E. coli cells and
conjugated with the mdrM- L. monocytogenes strain.

Intracellular growth curves. Bacterial growth in bone marrow derived
macrophages was performed as described previously (S1). Briefly, BMMs (3x10⁶
cells/dish) were plated in a monolayer on 12 x 1 mm round cover slips in 60 mm round
petri dishes the night before infection. Bacteria were grown overnight at 30 °C in BHI.
When appropriate, bacteria were grown overnight with IPTG (1 mM). In the morning
bacteria were pelleted by centrifugation and washed 3 times with PBS. Macrophages
were infected with 2 x 10⁵ bacteria. Infections were washed 3X with PBS at 30 minutes
post infections and gentamycin (50 µg/mL) was added at 1 hour post infection. Cover
slips were removed and placed into sterile MQ water to lyse macrophages. Various
dilutions were plated to determine the number of colony forming units.
DacA inducible L. monocytogenes strain. An IPTG inducible plasmid
containing the open reading frame (ORF) of dacA (lmo2120) was integrated into the L.
monocytogenes chromosome. The ORF of dacA was amplified using the following
primers: 5’- GAG GAG CGG CCG ATG GAT TTT TCC AAT ATG TCG ATA TTG -
3’ and 5’- GAG GAG GTC GAC ATT TAA AAT TCG ATC CAT CAT TCG CT - 3’.
The PCR amplification product was then digested with EagI and SalI and ligated with
similarly digest pLIV2 plasmid. The plasmid was then conjugated into L. monocytogenes
using E. coli SM10. DNA sequencing was performed by the UC Berkeley DNA
sequencing.

Fractionation of L. monocytogenes culture supernatants. Various strains of L.
monocytogenes were cultured overnight shaking at 37 ºC in brain heart infusion (BHI)
media. The following morning, overnight cultures were used to inoculate 50 mL of BHI
media (OD600=0.02), which were subsequently grown with shaking at 37 ºC until
OD600=0.5. Cells were then pelleted by centrifugation and resuspended in 50 mL of
chemically defined minimal media (S2). Cultures were grown at 37 ºC, shaking for 19
hours followed by centrifugation to remove bacteria. The supernatant was subsequently
filtered through 0.4 µm nitrocellulose membrane filter (Millipore) and the pH of the
supernatants was adjusted to 4.0 with concentrated HCl. Supernatants were then applied
to Sep-Pak columns (Waters Corp., 6cc, 500 mg C18) by gravity. The column was
subsequently washed in succession with 5 mL each of 0.1% (w/v) trichloroacetic acid
(TCA), 50% MeOH mixed with 0.1% TCA, and MeOH. Each wash was collected as a
separate fraction and dried using a SpeedVac concentrator. The resulting pellet was
resuspended in 1 mL of water and assayed for IFN- β stimulatory activity. Active
fractions were further fractionated using reversed-phase high performance liquid
chromatography (RP-HPLC) on an Agilent 1100 LC system. A fraction of the active
sample (100 µL) was loaded onto a Waters Nova-Pak C18 column (4 µm, 3.9x150 mm)
equilibrated with 0.1% formic acid (Solvent A). The column was developed at 0.5
mL/minute with an initial 5 minute wash with 100% Solvent A, a gradient of 0-50%
MeOH over 40 minutes, a gradient from 50-100% MeOH over 5 minutes, followed by
100% MeOH for 3 minutes and a return to 100% water. Fractions (0.5 mL) were
collected over the entire run. Each fraction was dried using a SpeedVac, resuspended in

50 µL of water, and tested for IFN-β stimulating activity in bone marrow derived
macrophages.
Purification and digestion of L. monocytogenes peptidoglycan. L.
monocytogenes grown overnight in BHI was used to inoculate 1 L culture of BHI to an
optical density of 0.02. Cells grown at 37 ºC with shaking to an optical density of 1 were
harvested by centrifugation. Bacteria were resuspended in PBS with 5% SDS and boiled
for 30 minutes. Cells were separated by centrifugation and then washed 2 times with
water and then run through a French press 3 times at 14000 psi. Cells then were
resuspended in PBS and bead beat for 10 minutes and subsequently separated by
centrifugation. Pellets from centrifugation were resuspended in 4% boiling SDS for 30
minutes. Sample was cooled and cell wall was pelleted by centrifugation. Supernatant
was removed and pellet resuspended in 4% SDS and boiled for 15 minutes. Cell wall
was then washed with hot water, 0.1% Triton, and five more times with hot water.
Finally, purified cell wall was resuspended in mutanolysin buffer (50 mM MES pH 5.9, 1
mM MgCl2). Cell wall (15 mg) was digested with mutanolysin (50 units, Sigma Aldrich,
Streptomyces globisporus) in the presence and absence of DNAse (5 Kunitz units,
Qiagen). IFN-β inducing activity of these samples was assessed using the IFN-β
bioassay. Attempts to use digitonin delivery with DNA were unsuccessful with either
double stranded DNA oligonucleotides or digested bacterial cell wall. As such, delivery
of samples to the macrophage cytosol was performed using Lipofectamine 2000
(Invitrogen) according to the manufacturer’s protocol.

Ion exchange pull-down. To characterize the charge of the active component
secreted by L. monocytogenes, active fractions from HPLC purification of the marR-
supernatant were incubated with cation-exchange resin (SP650M, Toyopearl) or anion-
exchange resin (Q650M, Toyopear) for 30 minutes with agitation at room temperature.
Resin was removed by centrifugation and the activity remaining in the supernatant was
measure by IFN-β bio-assay.
IFN-β bio-assay. Mouse bone marrow from 6-8 week old female mice was
differentiated to bone marrow derived macrophages (BMM) as described previously (S3).
Interferon responsive ISRE-L929 cells were cultured in ISRE media (DMEM, 2 mM
glutamine, 1 mM pyruvate, 10% heat inactivated FBS, and penicillin-streptomycin).
Induction of type-I interferon was assessed using BMMs plated in 96-well flat bottom
tissue culture treated plates (105 cells/well) a minimum of 12 hours prior to use in BMM
media (DMEM, 2 mM glutamine, 1 mM pyruvate, 10% CSF from 3T3 cells, and 20%
heat inactivated FBS). Samples (10 µL) of L. monocytogenes supernatants, HPLC
fractions, and cyclic di-AMP standard (Biolog Life Sciences Institute, Denmark) were
mixed with a 10X volume of digitonin permeabilization solution (50 mM HEPES pH 7.0,
100 mM KCl, 3 mM MgCl2, 0.1 mM DTT, 85 mM Sucrose, 0.2% BSA, 1 mM ATP, 0.1
mM GTP, ± 10 µg/mL Digitonin) (S4). Media was aspirated from the cells and replaced
with 50 µL each sample mixture. Cells were incubated for 30 minutes at 37 ºC. Wells
were again aspirated and fresh BMDM media (50 µL/well) was added. At 4 hours post
initial addition of sample, supernatants were removed and applied in various dilutions to
the interferon responsive ISRE-L929 cells (5 x 10⁴ cells/well) in white, 96-well, tissue

culture treated plates (Thermo Scientific Nunc). Cells were incubated for 4 hours, media
aspirated, and 40 µL of TNT lysis buffer (20 mM Tris, 100 mM NaCl, 1% triton, pH 8.0)
was added to each well. Finally, 40 µL of luciferase substrate solution (20 mM Tricine,
2.67 mM MgSO4.7H2O, 0.1 mM EDTA, 33.3 mM DTT, 530 µM ATP, 270 µM acetyl
CoA lithium salt, 470 µM luciferin, 5 mM NaOH, 265 µM magnesium carbonate
hydroxide) was added to each well and luminescence was measured using a VICTOR3
luminometer (PerkinElmer).
IFN-β induction by qPCR. BMMs were plated in 6-well tissue culture treated
plates (106 cells/well). Macrophages were infected with 4x10⁶ bacteria from 30°C
overnight cultures that had been washed 3 times with PBS. At 30 minutes post infection,
cells were washed with PBS and gentamycin (10 µg/mL) was added at 1 hour. At 4
hours post infection, RNA was harvested using an Ambion RNaqueous kit (Ambion).
DNA was removed by treatment with TURBO DNA-free DNAse (Ambion). RNA was
reverse transcribed using the Superscript III First-Strand Synthesis Supermix kit
(Invitrogen). SYBR Green PCR core reagents (Applied Biosystems) and a Stratagene
Mx3000P Real-Time PCR system were used to perform quantitative PCR in 96-well
plates. Standard curves for IFN-β and actin (reference) were performed for each
experiment. Relative expression of IFN-β was determined by comparing transcipt levels
of IFN-β to actin within the same sample.
Liquid Chromatography Mass Spectrometry (LC-MS) Analysis. Listeria
monocytogenes fractions were analyzed using an Agilent 1200 series liquid

chromatograph (LC; Santa Clara, CA) connected in-line with an LTQ Orbitrap XL hybrid
mass spectrometer equipped with an Ion Max electrospray ionization source (ESI;
Thermo Fisher Scientific, Waltham, MA). Acetonitrile (Fisher Optima grade, 99.9%)
and formic acid (Pierce, 1 mL ampules, 99+%) purchased from Fisher Scientific
(Pittsburgh, PA), and water purified to a resistivity of 18.2 MΩ·cm (at 25 °C) using a
Milli-Q Gradient ultrapure water purification system (Millipore, Billerica, MA), were
used to prepare mobile phase solvents for liquid chromatography.
The LC was equipped with C8 guard (Poroshell 300SB-C8, 5 µm, 12.5 × 2.1 mm,
Agilent) and analytical (75 × 0.5 mm) columns. Solvent A was 0.1% formic acid/99.9%
water and solvent B was 0.1% formic acid/99.9% acetonitrile (v/v). Sample solutions
contained in 0.3 mL polypropylene snap-top vials sealed with rubber septa caps
(Wheaton Science, Millville, NJ) were loaded into the Agilent 1200 autosampler
compartment prior to analysis. A 50 µL injection volume was used for each sample.
Following sample injection, analyte trapping was performed for 5 min with 99.5% A at a
flow rate of 90 µL/min. The elution program consisted of a linear gradient from 5% to
95% B over 27 min, isocratic conditions at 95% B for 10 min, a linear gradient to 0.5% B
over 1 min, and then isocratic conditions at 0.5% B for 16 min, at a flow rate of 90
µL/min. The column and sample compartment were maintained at 35 ºC and 10 ºC,
respectively. Solvent (Milli-Q water) blanks were run between samples, and the auto-
sampler injection needle was rinsed with Milli-Q water after each sample injection, to
avoid cross-contamination between samples.
The connections between the LC column exit and the ESI probe of the mass
spectrometer were made using PEEK tubing (0.005” i.d. × 1/16” o.d., Western

Analytical, Lake Elsinore, CA). External mass calibration was performed prior to
analysis using the standard LTQ calibration mixture containing caffeine, the peptide
MRFA, and Ultramark 1621 dissolved in 51% acetonitrile/25% methanol/23% water/1%
acetic acid solution (v/v). The ESI source parameters were as follows: ion transfer
capillary temperature 275ºC, normalized sheath gas (nitrogen) flow rate 25%, ESI voltage
2.0 kV, ion transfer capillary voltage 49 V, and tube lens voltage 120 V. Full scan mass
spectra were recorded in the positive ion mode over the range m/z = 100 to 1500 using
the Orbitrap mass analyzer, in profile format, with a full MS automatic gain control target
setting of 5 × 10⁵ charges and a resolution setting of 6 × 10⁴ (at m/z = 400, FWHM). In
the data-dependent mode, the most intense ion measured from each full scan mass
spectrum exceeding an intensity threshold of 15,000 counts was selected for tandem mass
spectrometry (MS/MS) analysis. MS/MS spectra were acquired using the Orbitrap mass
analyzer, in profile format, with a resolution setting of 1.5 × 10⁴ (at m/z = 400, FWHM),
using collisionally activated dissociation (CAD) with an isolation width of 2 m/z units, a
normalized collision energy of 28%, and a default charge state of 1+. To avoid the
occurrence of redundant MS/MS measurements, real-time dynamic exclusion was
enabled to preclude re-selection of previously analyzed precursor ions using a repeat
count of one, a repeat duration of 5 s, a maximum exclusion list size of 100 different
precursor ions, an exclusion duration of 180 s, and an exclusion width of 1.5 m/z units.
Mass spectra and MS/MS spectra were processed using Xcalibur software (version 4.1,
Thermo). ChemBioDraw Ultra software (version 11.0.1, CambridgeSoft, Cambridge,
MA) was used to draw and calculate the exact masses of candidate chemical structures
for comparison with measured masses.

To quantify c-di-AMP in L. monocytogenes supernatants, the four fractions eluted
from HPLC purification of the nucleotide surrounding the peak of activity were pooled
for each strain and analyzed by LC-MS. The observed peak for ion 659.11 m/z was
integrated using Xcalibur software. The concentration of the nucleotide was determined
by comparing the integrated peak area to a calibration curve generated using synthetic c-
di-AMP samples of known concentration analyzed in a similar way.
IFN-β induction in various host strains. BMMs were differentiated as described
previously (S3). For mavs-/- macrophages, heterozygous mice were used as a control.
WT and mutant BMMs were plated in 24-well plates (5x10⁶ cells/well) the evening prior
to use. For infections, 2x10⁶ bacteria from 30°C overnight cultures were washed with
PBS and added to each well containing 500 µL of BMM media. For c-di-AMP
treatment, synthetic standard was dissolved in digitonin solution to a final concentration
of 3 µM. Media was aspirated from cells and replaced with 200 µL of c-di-
AMP/digitonin mix. From this point on infections and c-di-AMP samples were treated
the same. At 30 minutes wells were aspirated and replaced with fresh BMM media. At 1
hour post infection gentamycin (50 µg/mL) was added. For LPS treatment, 100 ng of
sonicated LPS stock solution (50 µg/mL) was added to appropriate wells containing 500
µL of BMM media. Supernatants from all wells were collected and analyzed by ISRE
L929 bioassay for IFN-β activity at 6 hours.

Supporting Figure 1
Supporting Figure S1. (A) Absorbance spectrum from tetR::Tn917 L. monocytogenes
HPLC fraction 22 (λmax = 260 nm). (B) Active fraction from marR- L. monocytogenes
were mixed with (red bars) and without (black bars) anion and cation exchange resins.
Resin was removed by centrifugation and the supernatant was tested for IFN-β
stimulatory activity with BMMs and ISRE cells. (C) Digested cell wall from L.
monocytogenes in the presence (red bars) and absence (black bars) of DNAse (PGN
digest) was delivered to macrophage cytosol using lipofectamine 2000. Solid phase
extract from marR- L. monocytogenes (L.m. extract) was treated similarly and IFN-β
stimulatory activity was measured as in Figure 1a. Error bars represent standard
deviations of single samples measured in triplicate.

Supporting Figure 2
Supporting Figure S2. Identification of c-di-AMP from Listeria monocytogenes. (A)
Isotopically resolved electrospray ionization mass spectrum measured in the positive ion
mode for a fraction of Listeria monocytogenes, showing detail for the range m/z = 658-
662. (B) Isotopic distribution calculated for the (M + H)+ ion of c-di-AMP (M =
C20H24N10O12P2). The simulated spectrum of (B) was calculated from the natural
abundances of the isotopes using Xcalibur software (version 4.1, Thermo).
Supporting Figure 3
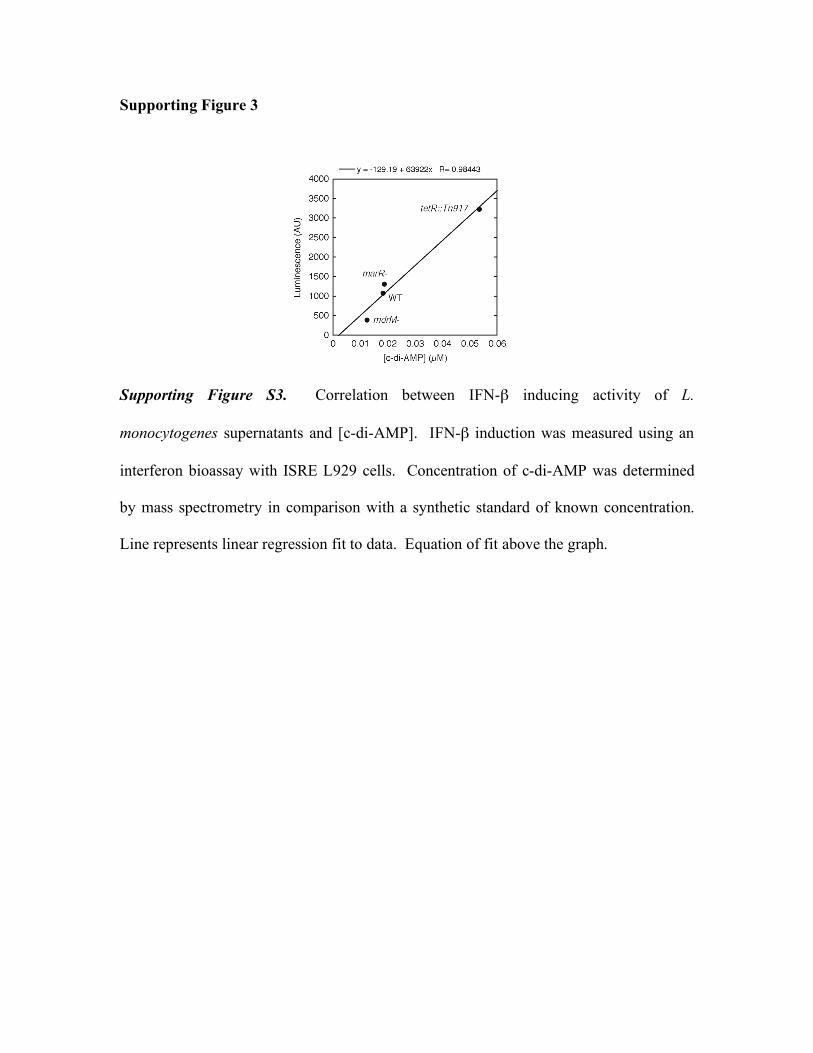
Supporting Figure S3. Correlation between IFN-β inducing activity of L.
monocytogenes supernatants and [c-di-AMP]. IFN-β induction was measured using an
interferon bioassay with ISRE L929 cells. Concentration of c-di-AMP was determined
by mass spectrometry in comparison with a synthetic standard of known concentration.
Line represents linear regression fit to data. Equation of fit above the graph.

Supporting Figure 4
Supporting Figure S4. Cytosolic detection of L. monocytogenes vs. c-di-AMP. Type-I
interferon was measured in response to the tetR::Tn917 strain of L. monocytogenes, c-di-
AMP, and LPS in (A) WT (black bars) and myd88-trif-/- (grey bars), (B) WT (black bars)
and irf3-/- (grey bars), and (C) mavs+/- (black bars) and mavs-/- (grey bars) macrophages.
L. monocytogenes infection was performed at an MOI of 4. Digitonin was used to deliver
c-di-AMP to the cytosol. LPS was used as a positive control. Type-I IFN was measured
using the ISRE L929 cells from supernatants of BMMs after 6 hours.

Supporting References
S1. D. A. Portnoy, P. S. Jacks, D. J. Hinrichs, Role of hemolysin for the intracellular
growth of Listeria monocytogenes. J. Exp. Med. 167, 1459 (1988).
S2. L. Phan-Thanh, T. Gormon, A chemically defined minimal medium for the
optimal culture of Listeria. Int. J. Food Microbiol. 35, 91 (1997).
S3. J. H. Leber et al., Distinct TLR- and NLR-mediated transcriptional responses to
an intracellular pathogen. PLoS Pathog. 4, e6 (2008).
S4. S. E. Girardin et al., Nod1 detects a unique muropeptide from gram-negative
bacterial peptidoglycan. Science 300, 1584 (2003).