supporting information - proceedings of the national academy of sciences€¦ · supporting...
TRANSCRIPT

Supporting InformationWhite et al. 10.1073/pnas.1118029109SI Materials and MethodsHydrocarbon Extraction and Purification.OneGF/F filter containingthe flocculent material was taken from each coral sample andextracted using a Microwave Accelerated Reaction System at100 °C and 800 W for 30 min with 20 mL of methanol:dichloro-methane (DCM:MeOH, 9:1). Extracts were reduced in volume,and 50% of the extract was archived. The remaining 50% wassolvent exchanged into hexane and charged onto a glass column (8cm × 0.6 cm) packed with fully activated silica gel (100–200 mesh).The column was eluted with 4 mL of 5%DCM in hexane (F1), 1:1DCM hexane (F2), 1% formic acid in DCM (F3), and 1% formicacid in MeOH (F4). The F1 fraction was analyzed for hydro-carbons via gas chromatography (GC). The combined F1 and F2fraction was analyzed for polycyclic aromatic hydrocarbons via gaschromatography–mass spectrometry (GC-MS).
One-Dimensional Gas Chromatography. Extracts were analyzed ona 1D Agilent 7890 series gas chromatograph interfaced to a flameionization detector (FID). Compounds were separated on a J&WDB-XLB capillary column (30 m, 0.25 mm internal diameter(I.D.), 0.25-μm film) with helium carrier gas at a constant flow of1 mL min−1. The GC oven had an initial temperature of 40 °C(1 min hold) and was ramped at 5 °C min−1 until 320 °C (15 minhold). Contributions of an unresolved complex mixture (UCM)to the extracts were quantified by integrating the total FID areaof the UCM and using response factors determined from ExxonValdez oil standards. Quantities of n-alkanes were calculatedusing response factors determined from pure standards.
Gas Chromatography–Mass Spectrometry. The samples were ana-lyzed on an Agilent 7890 series gas chromatograph with anAgilent 5975 mass selective detector (MSD). The MSD wasoperated in the selected-ion monitoring mode for quantitation oftarget polycyclic aromatic hydrocarbon (PAHs). Compoundswere separated on a J&W DB-XLB capillary column (60 m, 0.25mm I.D., 0.25-μm film) with helium carrier gas at a constant flowof 1 mL min−1. The GC oven had an initial temperature of 50 °C(1 min hold) and was ramped at 10 °C min−1 until 320 °C (37 minhold). Parent PAHs and alkylated PAHs were identified usingstandard solutions prepared from the National Institute ofStandards and Technology Standard Reference Material 2260“Aromatic Hydrocarbons in Toluene.”
Comprehensive 2D Gas Chromatography (GC×GC). GC×GC-MS andGC×GC-FID conditions were similar to methods previously de-scribed (1). GC×GC-FID was primarily used for both identifica-tion and quantification. Briefly, first-dimension separations wereperformed on a nonpolar column (Restek Rtx-1, 60 m length, 0.25mm I.D., 0.25-μm film thickness) that was programmed to remainisothermal at 100 °C for 0.5 min and then ramped from 110 to155 °C at 10 °C min−1, then 155 to 305 °C at a ramp rate of 0.66 °Cmin−1, resulting in a boiling point separation. Compounds elutingfrom the first-dimension column were cryogenically trapped,concentrated, focused, and reinjected (modulated) onto a second-dimension column. The second-dimension separations were per-formed on a 50% phenyl polysilphenylene-siloxane column (SGEBPX50, 1.50 m length, 0.10 mm I.D., 0.1-μm film thickness),programmed to remain isothermal at 105 °C for 0.5 min, and thenramped from 105 to 160 °C at 10.0 °C min−1, then 160 to 310 °C ata ramp rate of 0.66 °C min−1, to yield a polarity-base separation.The carrier gas was hydrogen at a constant flow rate of 1.00 mLmin−1. The FIDdetector signal was sampled at 100 data points s−1.GC×GC–TOF-MS was used to confirm identities. The GC×GC–
TOF-MS GC×GC-FID with the following exceptions: the mainGC oven on the Pegasus GC×GC-TOF system is a 6890N, thecarrier gas used was helium instead of hydrogen, the first-di-mension column on the GC×GC-TOF system was a Restek Rtx-1,(30 m length, 0.25 mm I.D., 0.25-μm film thickness), and thesecond-dimension column was a SGE BPX50 (1.25 m length, 0.10mm I.D., 0.1-μm film thickness). The TOF-MS detector signal wassampled at a data rate of 50 spectra per second. The transfer linefrom the second oven to the TOF-MS was deactivated fused silica(0.5 m length, 0.18 mm I.D.), which was held at a constant tem-perature of 275 °C. The TOF source temperature was 225 °C, thedetector voltage was 1,575 V, the mass scan range was 50–650amu, and the mass defect was manually set at 100.8 mu/100u(optimized for C27 steranes). The mass spectrometer employs 70eV electron ionization and operates at a push pulse rate of 5 kHz,allowing sufficient signal averaging time to ensure good signal-to-noise ratios, while still operating at a high enough data acquisitionrate to accurately process (signal average) spectra from peaks thatelute from the second dimension column in this high-resolutionseparation technique.
1. Nelson RK, et al. (2006) Tracking the weathering of an oil spill with comprehensivetwo-dimensional gas chromatography. Environ Forensics 7:33–44.
White et al. www.pnas.org/cgi/content/short/1118029109 1 of 7

1500
1550
1600
1600
1650
1550
1700
Macondo Well
MC 294 Study Area
Fig. S1. Acoustic amplitude map from 3D seismic data with bathymetry overlay. The acoustic signal for conventional 3D seismic data used in this study isgenerated by 100-Hz airguns. The acoustic amplitude response of the reflected sound is controlled by the hardness and thickness of the seafloor and sub-surface stratigraphic layers. Authigenic carbonate hardgrounds formed at hydrocarbon seep sites cause high positive amplitude response (red, green, andyellow), soft bottom muds have a background response of blue and white, and very soft, gaseous muds at high flux vent sites appear white. Data courtesy ofTGS-NOPEC. The Macondo well is shown as a star on map, and MC 294 is indicated as a filled circle.
White et al. www.pnas.org/cgi/content/short/1118029109 2 of 7

Fig. S2. (A) Bayesian inference of octocoral species that occur at MC294 and control sites (in bold) along with similar haplotypes downloaded from GenBank(indicated by accession number). Additional Paramuricea haplotypes (A–E) collected from Gulf of Mexico control sites were also included in analyses. Bayesianposterior probabilities denoted by an asterisk (*) are >95% at each node. Sequences for the msh gene are deposited in GenBank under JQ241244 throughJQ241252 and the COI+igr region under JQ411462 through JQ411469). (B) Neighbor-joining tree of deep-water ophiuroid species in the Gulf of Mexico (inbold), along with other closely related species downloaded from GenBank (indicated by accession number) on the basis of a portion of the 16S mitochondrialgene. Asteroschema clavigerum was the identified ophiuroid epibiont on Paramuricea at MC294 and DC673. Bootstrap support from 500 replicates of >95%are denoted by an asterisk (*). Ophiuroid sequences are deposited in GenBank under JQ771615 through JQ771617. Both trees were rooted at the midpoint.
White et al. www.pnas.org/cgi/content/short/1118029109 3 of 7
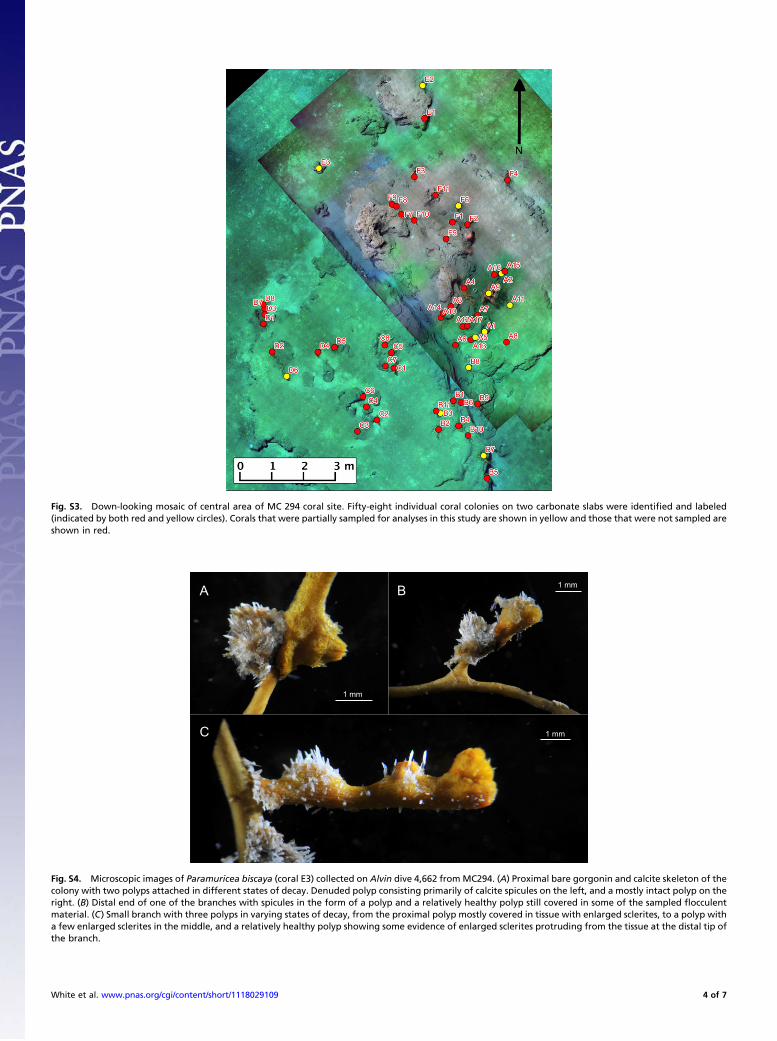
Fig. S3. Down-looking mosaic of central area of MC 294 coral site. Fifty-eight individual coral colonies on two carbonate slabs were identified and labeled(indicated by both red and yellow circles). Corals that were partially sampled for analyses in this study are shown in yellow and those that were not sampled areshown in red.
A B
C
1 mm
1 mm
1 mm
Fig. S4. Microscopic images of Paramuricea biscaya (coral E3) collected on Alvin dive 4,662 fromMC294. (A) Proximal bare gorgonin and calcite skeleton of thecolony with two polyps attached in different states of decay. Denuded polyp consisting primarily of calcite spicules on the left, and a mostly intact polyp on theright. (B) Distal end of one of the branches with spicules in the form of a polyp and a relatively healthy polyp still covered in some of the sampled flocculentmaterial. (C) Small branch with three polyps in varying states of decay, from the proximal polyp mostly covered in tissue with enlarged sclerites, to a polyp witha few enlarged sclerites in the middle, and a relatively healthy polyp showing some evidence of enlarged sclerites protruding from the tissue at the distal tip ofthe branch.
White et al. www.pnas.org/cgi/content/short/1118029109 4 of 7

A
B
Fig. S5. Ophiuroids (Astersochema clavigerum) living in association with the octocoral Paramuricea biscaya at MC294 in November 2010 (A) and December2011 (B). Ophiuroids (e.g., white arrow) were notably lighter in color than previous in situ documentation and apparently transitioned from an attachment of“tightly-coiled” arms to “splayed-out” arms, which is a previously undocumented behavior in this ophiuroid species. Anemones observed at the nodes ofinternal branches appeared unchanged over this time. Field of view across the bottom of A and B is approximately 0.9 m and 1.2 m, respectively.
Fig. S6. Photographs of the brown flocculent material collected from (A) coral F6; (B) coral E3; (C) coral B8; and (D) coral A5.
White et al. www.pnas.org/cgi/content/short/1118029109 5 of 7

Fig. S7. A portion of GC×GC chromatographic plane (3D surface rendering or mountain plot) for the Macondo well crude oil (MW-1). The x and y axisrepresent the first and second dimension retention time, and the z axis represents detector signal intensity. Labeled compounds are as follows: 1, 13β(H),17α(H)-20S-diacholestane (DiaC27βα-20S); 2, 13β(H),17α(H)-20R-diacholestane (DiaC27βα-20R); 3, 5α(H),14β(H),17β(H)-20R-cholestane (C27αββ-20R); 4, 24-ethyl-13β(H),17α(H)-20S-diacholestane (DiaC29βα-20S); 5, 5α(H),14β(H),17β(H)-20S-cholestane (C27αββ-20S); 6, 24-methyl-5α(H),14β(H),17β(H)-20R-cholestane (C28αββ-20R);7, 24-ethyl-5α(H),14β(H),17β(H)-20R-cholestane (C29αββ-20R); 8, 24-ethyl-5α(H),14β(H),17β(H)-20S-cholestane (C29αββ-20S); 9, 18α(H)-22,29,30-trinorneohopane(Ts); 10, 17α(H)-22,29,30-trinorhopane (Tm); 11, 17α(H),21β(H)-30-norhopane (NH); 12, 17α(H),21β(H)-diahopane (C30-Dia); 13, 17α(H),21β(H)-hopane (H); 14, 17α(H),21β(H)-22S-homohopane (HH(S)); 15, 17α(H),21β(H)-22S-bishomohopane (2HH(S)).
A B C
D E F
Fig. S8. A portion of GC×GC chromatographic plane (3D surface rendering or mountain plot) rotated from the representation used in Fig S7. to focus on thehopanoid region for samples (A) Macondo well crude oil, (B) surface water oil sample (S1), (C) coastal water oil reference sample (M1), (D) coral B8, (E)sediment 4664 0–2 cm, and (F) sediment 4662 0–2 cm. The region of the GC×GC chromatographic plane shown for each sample is the same. The yellow arrow isused to label the first dimension and the white arrow labels the second dimension.
White et al. www.pnas.org/cgi/content/short/1118029109 6 of 7

A
B
Fig. S9. A portion of GC×GC chromatographic plane (3D surface rendering or mountain plot) focused on the sterane region for samples (A) Macondo wellcrude oil (MW-1) and (B) coral B8. The region of the GC×GC chromatographic plane shown for each sample is the same and identical to that shown in Fig. S7.
White et al. www.pnas.org/cgi/content/short/1118029109 7 of 7