supporting information overall water splitting · supporting information ... overall water...
TRANSCRIPT

1
Supporting Information
Constructing Hierarchical 3D Co/N-Doped Carbon Electrocatalyst
for Efficient Oxygen Reduction and
Overall Water SplittingZengxia Pei,a Zijie Tang,a Zhuoxin Liu,a Yan Huang,b Yukun Wang,a Hongfei Li,a Qi Xue,a Minshen Zhu,a Daiming Tang,c* Chunyi Zhia, d*
a Department of Materials Science and Engineering, City University of Hong Kong, 83 Tat Chee Avenue, Kowloon, Hong Kong 999077, China. E-mail: [email protected]
b School of Materials Science and Engineering, Harbin Institute of Technology, Shenzhen 518055, China
c International Center for Materials Nanoarchitectonics (MANA), National Institute for Materials Science (NIMS)Namiki 1-1, Tsukuba, Ibaraki 305-0044 JapanE-mail: [email protected].
d Shenzhen Research InstituteCity University of Hong KongHigh-Tech Zone, Nanshan District, Shenzhen 518057, China
Experimental
Synthesis of catalysts: for the fabrication of CF-NG-Co material, 187 mg
Co(Ac)2•4H2O was dissolved into a graphene oxide solution (1 mg mL-1, 25 mL),
which then subject to ultrasonic treatment followed by stirring for 20 min. Then, a
piece of melamine foam (2×2×3 cm in size, ca. 90 mg) was immersed in the solution
and was squeezed repeatedly for thorough and even adsorption of GO sheets and Co
Electronic Supplementary Material (ESI) for Journal of Materials Chemistry A.This journal is © The Royal Society of Chemistry 2017
2
precursor within the foam framework. After immersion for 2 hrs, the infiltrated
melamine foam with adsorbed aqueous solution was carefully taken out and was dried
by lyophilization technique. The thus obtained foam with GO sheets and Co2+ species
was calcined at 800 °C for 3 hrs under Ar atmosphere with a ramp rate of 5 °C min-1.
In the following, the carbonized foam was immersed into 0.5 M H2SO4 solution at 80
°C for 10 hrs to leach out the excess and unstable Co-containing particles. Finally, the
as-obtained foam was heated again at 800 °C for 1 h. Different temperatures
(700/800/900 °C) were selected to check the influence of calcination temperature with
the other procedures being identical. The catalyst calcined at 800 °C without the
addition of Co species was marked as CF-NG. The CF sample was synthesized by
mere carbonization of melamine foam.
Physicochemical Characterization. The morphology and microstructure of the
samples were revealed by a Hitachi field-emission SEM and a JEOL-2001F field-
emission TEM, respectively, and the accessory EELS of TEM was used to determine
to composite elements. The crystal structure of the catalyst was identified by a Bruker
D2 Phaser X-ray diffractometer with Cu Kα radiation (λ = 0.15418 nm) operating at
30 kV and 10 mA, respectively. Raman scattering measurements were performed with
a multichannel modular triple Raman system (Renishaw Co.) with confocal
microscopy at room temperature using the 633 nm laser. XPS analyses were
conducted on an ESCALAB 250 photoelectron spectroscopy (Thermo Fisher
Scientific) at 1.2 × 10⁻⁹ mbar using Al Kα X-ray beam (1486.6 eV). The XPS spectra

3
were charge corrected to the adventitious C 1s peak at 284.5 eV. TGA were carried
out on a TA #SDT Q600 analyzer at 30-900 °C with an O2 flow of 40 mL min-1. The
nitrogen adsorption and desorption isotherms were characterized using a
Micrometrics ASAP 2020 analyzer. Pore size distribution and specific surface area
were obtained via Barrett-Joyner-Halenda (BJH) and Brunauer-Emmett-Teller (BET)
methods from adsorption branch of the isotherm, at a relative pressure range of P/P0 =
0.06-0.25.
Electrochemical Measurements. All electrochemical measurements were carried out
on a CHI 760D electrochemical workstation integrated with a RRDE-3A rotating ring
disk electrode apparatus in a typical 3-eletrode system. A glassy carbon electrode
(GCE, 3mm in diameter) loaded with different catalysts was used as working
electrode, an Ag/AgCl (in 3 M KCl) electrode and a Pt mesh (or a graphitic rod for
HER) served as reference and counter electrode, respectively. The recorded potential
was converted to a reversible hydrogen electrode (RHE) according to the Nernst
equation: ERHE = EAg/Ag/Cl + 0.059 × pH + 0.210. The loading mass was 280 μg cm-2
for non-noble metal catalysts and 140 μg cm-2 for noble-metal materials (Pt/C, Alfa
Acesar, 20 wt%, and IrO2, Alfa Acesar).
ORR tests: N2 or O2 saturated 0.1 M KOH or 1 M KOH solution served as the
electrolyte for ORR measurements. The CV curves were recorded at a scan rate of 20
mV s-1 and the LSV curves at 5 mV s-1. The onset potential (Eonset) for ORR is defined
as the critical potential where the reduction current density reaches 1% of the limiting
4
current density. All the catalysts were capacity-corrected by subtracting the
background voltammograms results for the N2-purged electrolyte from those of the
O2-purged electrolyte. Each catalyst was repeated at least 3 times for the above
measurements to exclude possible incidental errors.
The RRDE tests were conducted with a Pt ring surrounded 4 mm diameter
GCE (with a loading mass of 0.28 mg cm-2). The Pt ring electrode was set at 1.3 V (vs.
RHE) to detect the generated HO2- species. The value of n was also calculated
through RRDE tests:
𝑛 =4𝑖𝑑
𝑖𝑑 +𝑖𝑟
𝑁
the HO2- yield was calculated from equation:
𝐻𝑂 ‒2 % =
200𝑖𝑟
𝑁(𝑖𝑑 +𝑖𝑟
𝑁)
here id and ir are the disk current and ring current, respectively, and N is the current
collection efficiency of the Pt ring and was determined to be 0.44.
Long term stability tests in ORR were conducted by measuring the current
changes of the catalyst modified GCE at a fixed potential of 0.7 V (vs. RHE) and a
rotation speed of 1600 rpm in O2 saturated electrolyte. The cross-over tolerance tests
were performed by comparing the CV curves before and after the addition of 10 vol%
methanol into the electrolyte.
OER tests: the electrolyte was O2 saturated 1 M KOH solution. The LSV
curves were obtained at a scan rate of 5 mV s-1 and the GCE was rotated at 1600 rpm

5
to alleviate the accumulation of evolved oxygen bubbles on the electrode surface. The
Eonset for OER is defined as the critical potential where the current density reaches 0.5
mA cm-2. All the curves were iR corrected unless otherwise stated and in order to get
a stable current, the LSV data were collected at the second sweep.
HER tests: N2 saturated 0.5 M H2SO4 or 1 M KOH served as the electrolyte. A
graphite rod was used as the counter electrode during the whole measurements to
avoid the possible contamination of Pt species. LSV curves were carried out at 5 mV
s-1 from 0.2 to -0.6 V (vs. RHE). All polarization curves were automatically corrected
for the iR contribution from the cell. The working electrode was rotated at a speed of
1600 rpm to alleviate the accumulation of evolved hydrogen bubbles on the GCE
surface. The Eonset for HER is defined as the critical potential where the current
density reaches 0.5 mA cm-2.
Zn-air battery assembly. The air electrodes for Zn-air battery use stainless steel
mesh (SSM) as backing layer, with a gas diffusion layer (GDL) on the air-facing side
and catalyst on the water-facing side. A carbon ink consists of carbon black and
polytetrafluoroethylene (PTFE) emulsion (60 wt%) according to a mass of 3:7 was
painted onto the backing layer to form the GDL, which then subject to heating at 200
°C for 30 min. The catalyst was then loaded onto the other side of the SSM by drop-
casting with an identical loading mass of 1.0 mg cm-2 for both CF-NG-Co sample and
noble metal catalyst (bare Pt/C or Pt/C-IrO2 mixture, 0.5+0.5 mg). A polished Zn
plate served as anode and the electrolyte were 6.0 M KOH for Zn-air primary

6
batteries and 6.0 M KOH with 0.2 M Zn(Ac)2 for rechargeable Zn-air batteries. The
GDL has an effective area of 1 cm2 and allows O2 from ambient air to reach the
catalyst sites.
Figure S1. SEM images showing (a) the morphology of the hierarchical hybrid CF-NG-Co catalyst, and (b) the intimate grafting of graphene sheets onto the carbon foam skeleton. Scale bar: (a) 20 μm, (b) 10 μm.
7
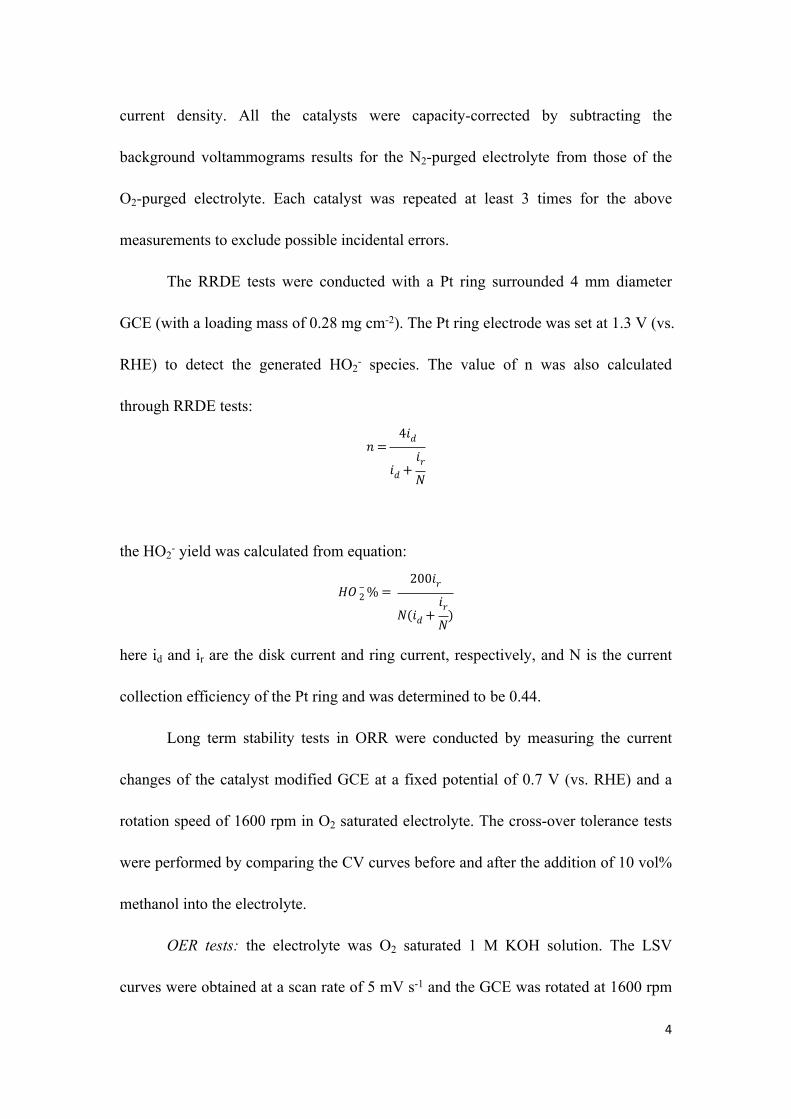
Figure S2. Digital image of the (I) pristine MF, (II) Co(Ac)2 impregnated MF, (III) GO and Co(Ac)2 impregnated MF, (IV) pyrolyzed CF-NG-Co sample (before acid leaching).
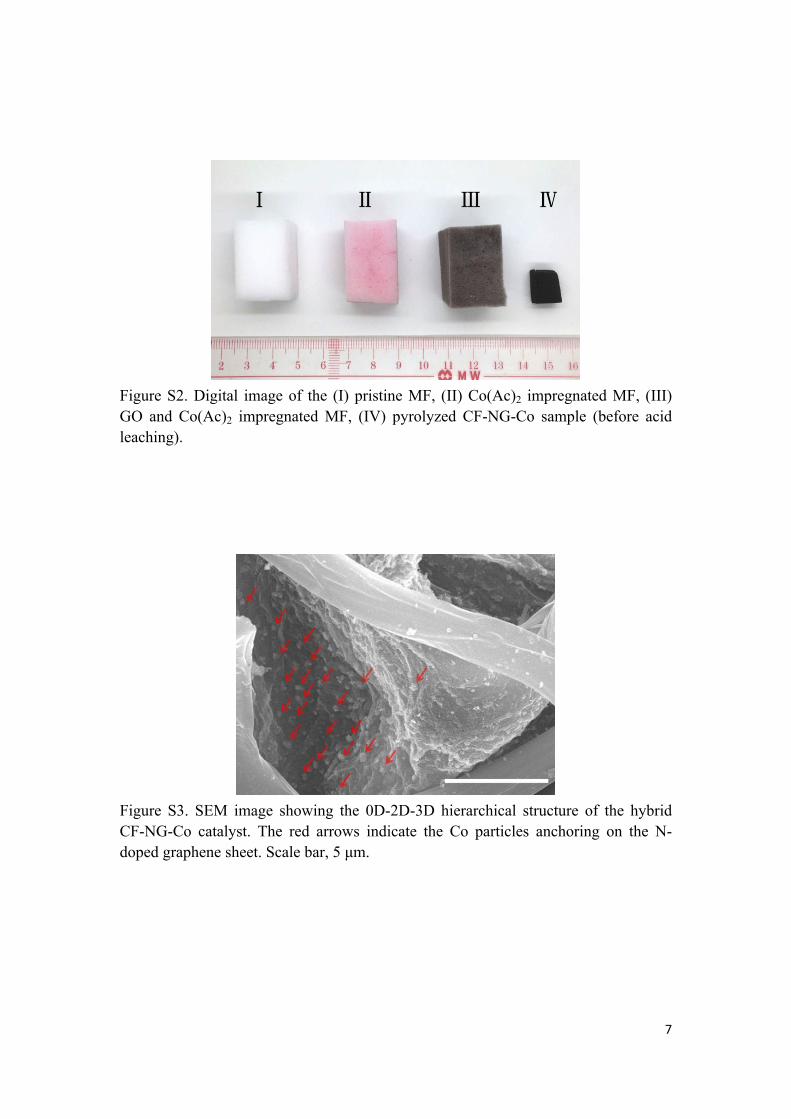
Figure S3. SEM image showing the 0D-2D-3D hierarchical structure of the hybrid CF-NG-Co catalyst. The red arrows indicate the Co particles anchoring on the N-doped graphene sheet. Scale bar, 5 μm.

8
Figure S4. (a) TGA analyses of the CF-NG-Co and pure CF samples; (b) XRD patterns of the resulted black powders from the CF-NG-Co sample after combustion in O2.
Note: the pure CF sample still left 10 wt% residuals after combustion, which is
very probably from the original addictives in the melamine foam (e.g., sodium
bisulfite).1 The CF-NG-Co sample left some black powder, which was then identified
to be tricobalt-tetraoxide (JCPDS No. CF-03-065-3103) by XRD patterns. According
to the XRD results from the pristine CF-NG-Co samples (Figure 2b), a reliable Co
content of 22.3 wt% could therefore be determined by assuming that all the cobalt
species is metallic Co.

9
Figure S5. (a) N2 adsorption/desorption isotherms of the CF-NG-Co series samples pyrolyzed at different temperatures; (b) Pore diameter distribution of all samples.
Figure S6. (a) High resolution C 1s XPS spectra of the samples. Magnified (b) C 1s and (c) N 1s core-levels of the representative 800-CF-NG-Co sample.

10
Figure S7. LSV curves for ORR in O2 saturated 0.1 M KOH solution of the CF-NG-Co series catalysts pyrolyzed at different temperatures.
Figure S8. Influence of different loading masses on the ORR activity in O2 saturated 0.1 M KOH: (a) CV scans (at 20 mV s-1) and (b) LSV curves (at 5 mV s-1, positive scan) of the the CF-NG-Co catalyst with different loading masses. (c) Comparison of the influence of loading mass on limgting current density (JL) and half-wave potential of the CF-NG-Co catalyst. (d) LSV curves (at 5 mV s-1) of the CF-NG-Co sample with the referenced Pt/C catalyst at an identical loading mass.
Note: Different laoding masses have negligible influence on the Eonset and the
11
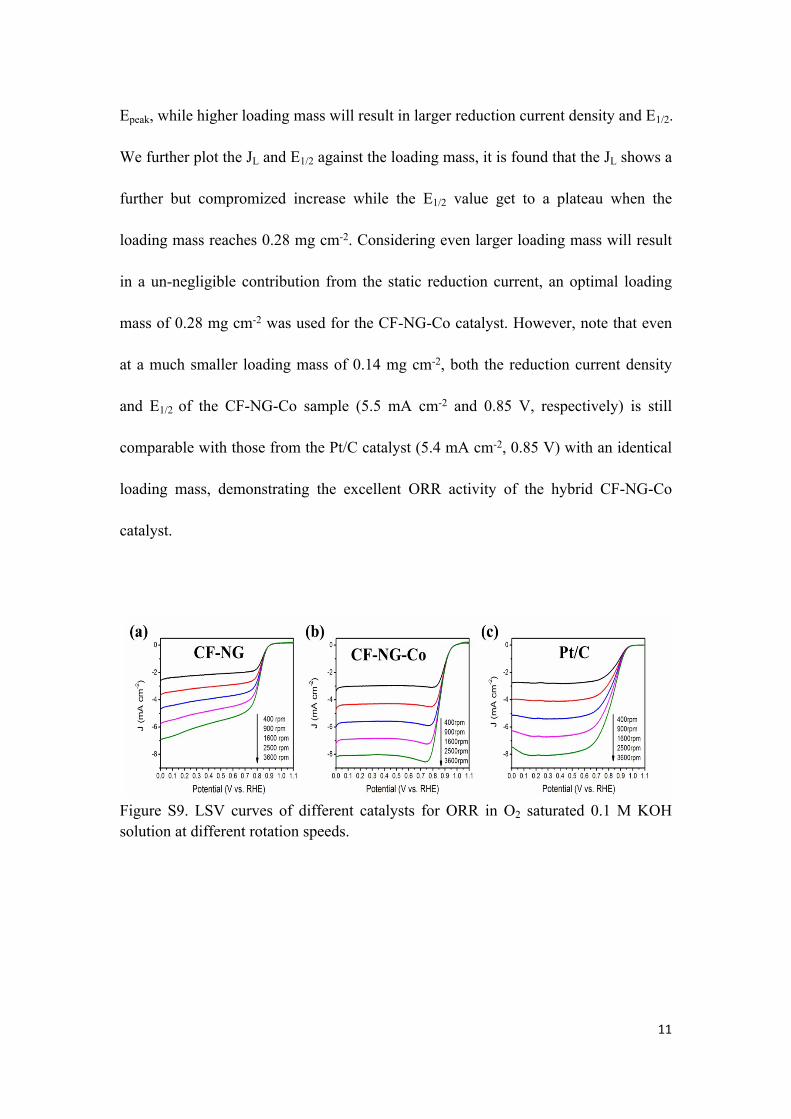
Epeak, while higher loading mass will result in larger reduction current density and E1/2.
We further plot the JL and E1/2 against the loading mass, it is found that the JL shows a
further but compromized increase while the E1/2 value get to a plateau when the
loading mass reaches 0.28 mg cm-2. Considering even larger loading mass will result
in a un-negligible contribution from the static reduction current, an optimal loading
mass of 0.28 mg cm-2 was used for the CF-NG-Co catalyst. However, note that even
at a much smaller loading mass of 0.14 mg cm-2, both the reduction current density
and E1/2 of the CF-NG-Co sample (5.5 mA cm-2 and 0.85 V, respectively) is still
comparable with those from the Pt/C catalyst (5.4 mA cm-2, 0.85 V) with an identical
loading mass, demonstrating the excellent ORR activity of the hybrid CF-NG-Co
catalyst.
Figure S9. LSV curves of different catalysts for ORR in O2 saturated 0.1 M KOH solution at different rotation speeds.

12
Figure S10. RRDE (Pt ring GC disk electrode) voltammograms for the reduction of K3[Fe(CN)6] at the disk electrode in N2 saturated aqueous KCl solution with disc scan rate of 10 mV s-1 at different rotation speeds.
Note: The current collection efficiency (N) of Pt ring in RRDE technique is
determined by using single electron reversible couple of ferrocyanide/ferricyanide
system. Specifically, a mirror-polished Pt ring GC disk electrode was immersed into
N2 saturated 0.5 M KCl solution containing 10 mM K3[Fe(CN)6]. The disk electrode
was scanned between -1.0 – 0.4 V (vs. Ag/AgCl) at 10 mV s-1 and the ring potential
was set at 0.5 V. The LSV curves were recorded at rotation speeds of 400-3600 rpm
and the ratio the ring and disk limiting currents (N = ir/id) reveals the N. In the present
system, the N was determined to be 0.44 irrespective of the rotation speed.
13
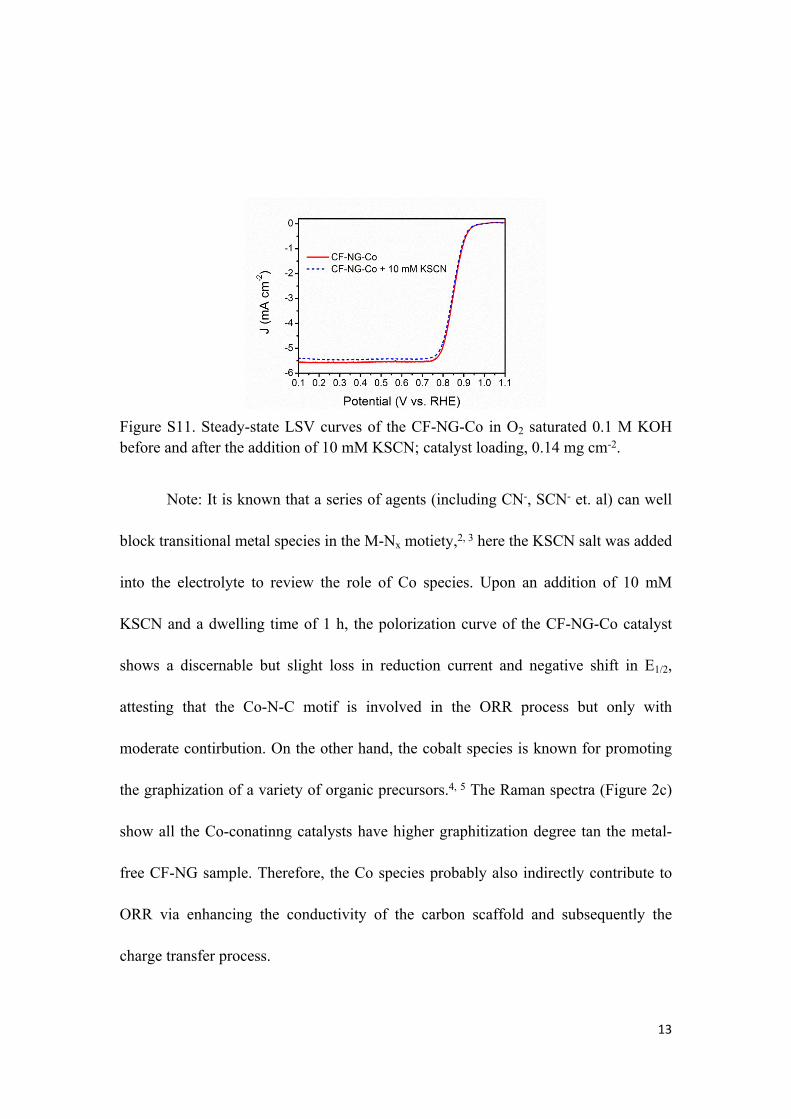
Figure S11. Steady-state LSV curves of the CF-NG-Co in O2 saturated 0.1 M KOH before and after the addition of 10 mM KSCN; catalyst loading, 0.14 mg cm-2.
Note: It is known that a series of agents (including CN-, SCN- et. al) can well
block transitional metal species in the M-Nx motiety,2, 3 here the KSCN salt was added
into the electrolyte to review the role of Co species. Upon an addition of 10 mM
KSCN and a dwelling time of 1 h, the polorization curve of the CF-NG-Co catalyst
shows a discernable but slight loss in reduction current and negative shift in E1/2,
attesting that the Co-N-C motif is involved in the ORR process but only with
moderate contirbution. On the other hand, the cobalt species is known for promoting
the graphization of a variety of organic precursors.4, 5 The Raman spectra (Figure 2c)
show all the Co-conatinng catalysts have higher graphitization degree tan the metal-
free CF-NG sample. Therefore, the Co species probably also indirectly contribute to
ORR via enhancing the conductivity of the carbon scaffold and subsequently the
charge transfer process.
14
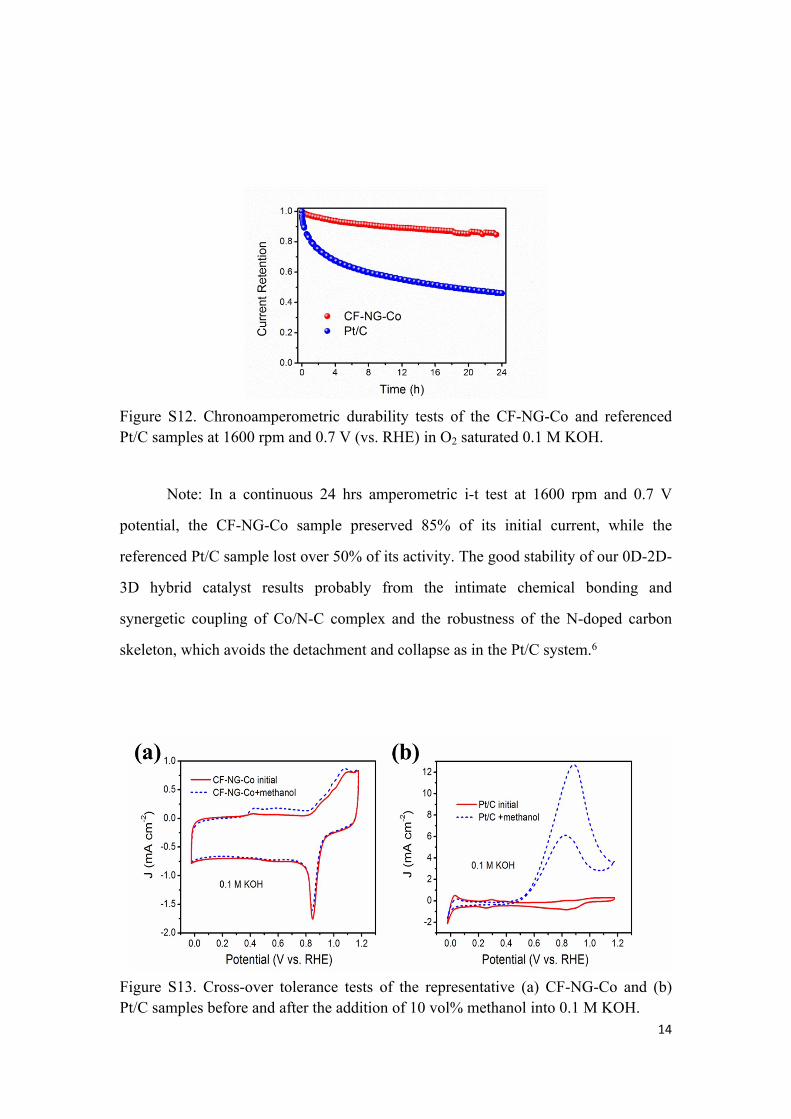
Figure S12. Chronoamperometric durability tests of the CF-NG-Co and referenced Pt/C samples at 1600 rpm and 0.7 V (vs. RHE) in O2 saturated 0.1 M KOH.
Note: In a continuous 24 hrs amperometric i-t test at 1600 rpm and 0.7 V
potential, the CF-NG-Co sample preserved 85% of its initial current, while the
referenced Pt/C sample lost over 50% of its activity. The good stability of our 0D-2D-
3D hybrid catalyst results probably from the intimate chemical bonding and
synergetic coupling of Co/N-C complex and the robustness of the N-doped carbon
skeleton, which avoids the detachment and collapse as in the Pt/C system.6
Figure S13. Cross-over tolerance tests of the representative (a) CF-NG-Co and (b) Pt/C samples before and after the addition of 10 vol% methanol into 0.1 M KOH.
15
Note: the hybrid CF-NG-Co catalyst shows negligible distinction with the
inroduction of metahnol, suggesting the excellent selectivity towards ORR of the
sample. By contrast, Pt/C modified electrode dilivers a drastic anodic current, which
results from significant methanol oxidation reaction, indicating the susceptive
selectivity of Pt/C catalyst.
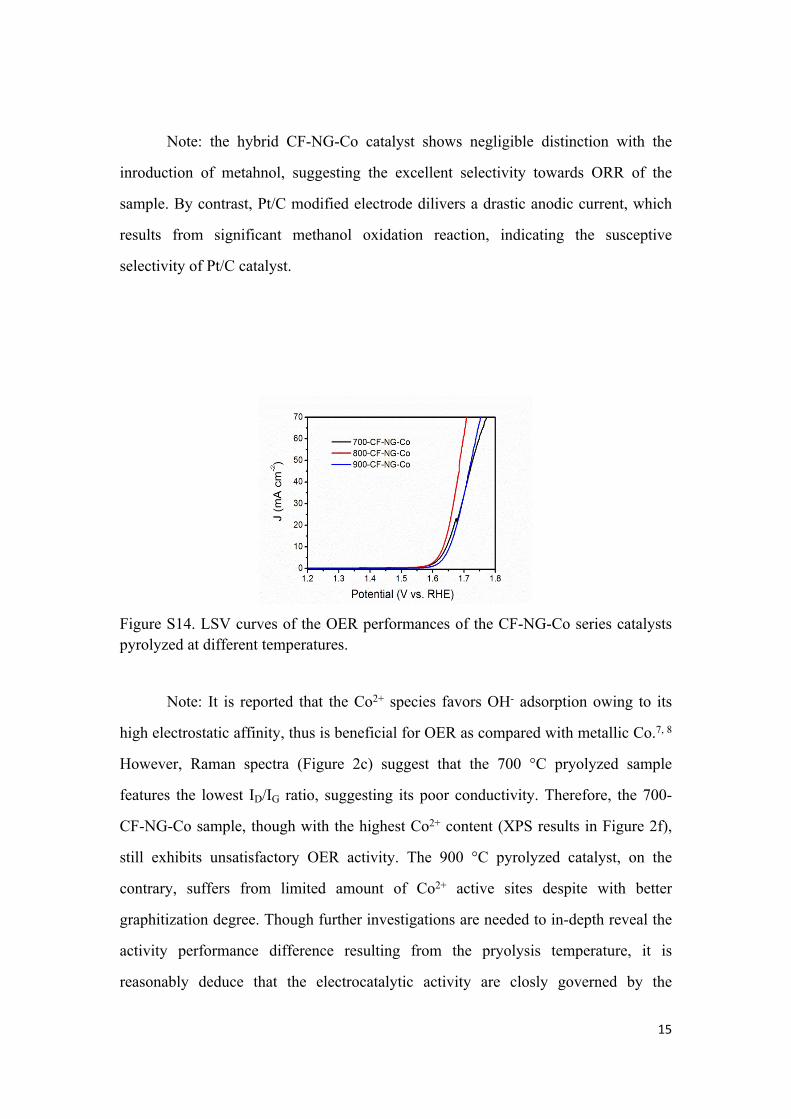
Figure S14. LSV curves of the OER performances of the CF-NG-Co series catalysts pyrolyzed at different temperatures.
Note: It is reported that the Co2+ species favors OH- adsorption owing to its
high electrostatic affinity, thus is beneficial for OER as compared with metallic Co.7, 8
However, Raman spectra (Figure 2c) suggest that the 700 °C pryolyzed sample
features the lowest ID/IG ratio, suggesting its poor conductivity. Therefore, the 700-
CF-NG-Co sample, though with the highest Co2+ content (XPS results in Figure 2f),
still exhibits unsatisfactory OER activity. The 900 °C pyrolyzed catalyst, on the
contrary, suffers from limited amount of Co2+ active sites despite with better
graphitization degree. Though further investigations are needed to in-depth reveal the
activity performance difference resulting from the pryolysis temperature, it is
reasonably deduce that the electrocatalytic activity are closly governed by the
16
concentration of active species and the conductivity. The 800-CF-NG-Co catalyst
poessesses a desirable amount of Co2+ species in conjuction with a preferable
conductivity, thus affords the best OER as observed here. On the other hand, the N/C
atomic ratio by XPS analyses was determined to be 10.7%, 6.8% and 3.8% for the
700 °C, 800 °C and 900 °C pyrolyzed samples, respectively. The suitable N
heteroatom concentration may also contribute to the OER activity of the CF-NG-Co
catalyst, as proven in Figure 4a.
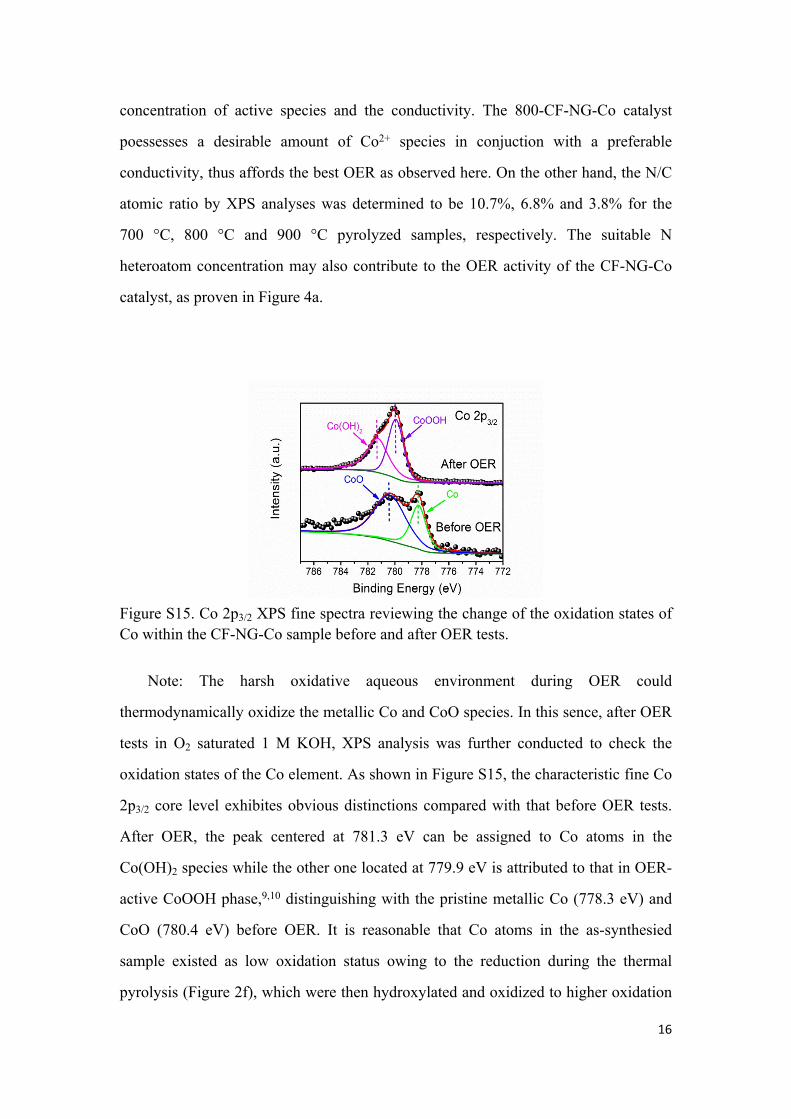
Figure S15. Co 2p3/2 XPS fine spectra reviewing the change of the oxidation states of Co within the CF-NG-Co sample before and after OER tests.
Note: The harsh oxidative aqueous environment during OER could
thermodynamically oxidize the metallic Co and CoO species. In this sence, after OER
tests in O2 saturated 1 M KOH, XPS analysis was further conducted to check the
oxidation states of the Co element. As shown in Figure S15, the characteristic fine Co
2p3/2 core level exhibites obvious distinctions compared with that before OER tests.
After OER, the peak centered at 781.3 eV can be assigned to Co atoms in the
Co(OH)2 species while the other one located at 779.9 eV is attributed to that in OER-
active CoOOH phase,9,10 distinguishing with the pristine metallic Co (778.3 eV) and
CoO (780.4 eV) before OER. It is reasonable that Co atoms in the as-synthesied
sample existed as low oxidation status owing to the reduction during the thermal
pyrolysis (Figure 2f), which were then hydroxylated and oxidized to higher oxidation
17
states in the aqueous OER environment. This oxidation process also accounts for the
observed oxidation peaks at high potential (~ 1.1-1.2 VRHE) in the CV scans during
ORR (Figure 3a, S8a). Therefore, it is believed that the Co species in the CF-NG-Co
sample underwent an in-situ transformation process to initiate the OER, similar to
some recent other studies.9, 11, 12
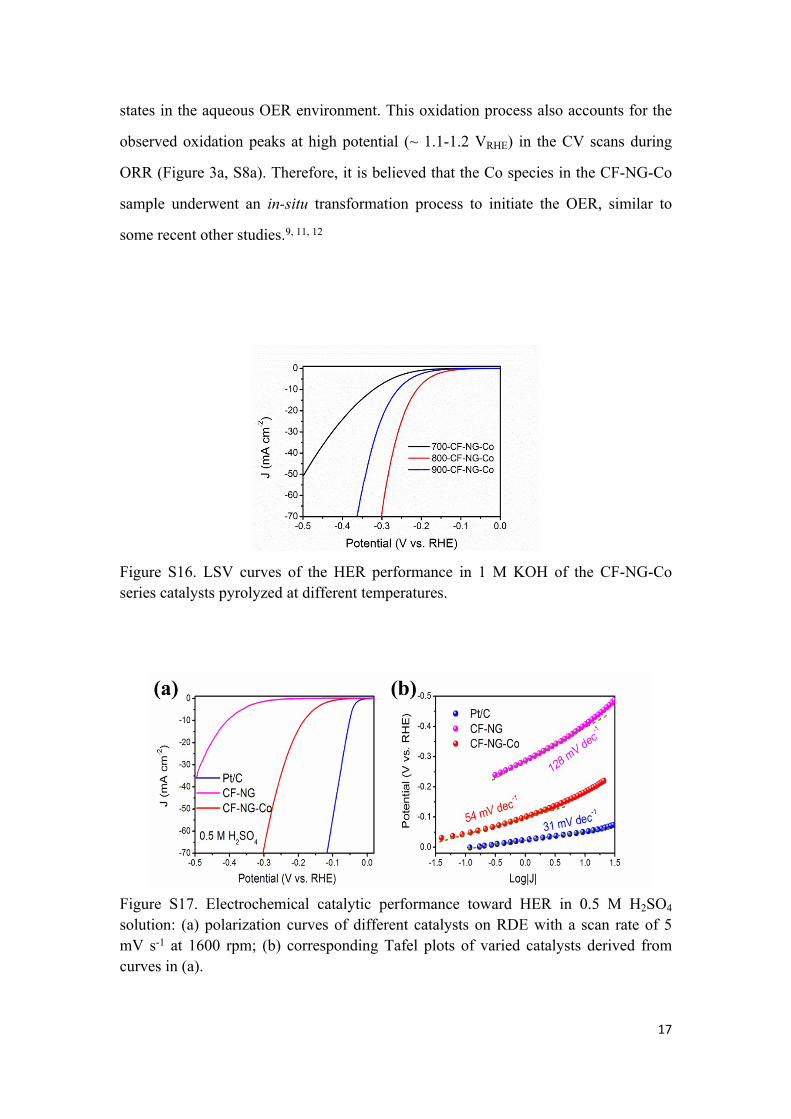
Figure S16. LSV curves of the HER performance in 1 M KOH of the CF-NG-Co series catalysts pyrolyzed at different temperatures.
Figure S17. Electrochemical catalytic performance toward HER in 0.5 M H2SO4 solution: (a) polarization curves of different catalysts on RDE with a scan rate of 5 mV s-1 at 1600 rpm; (b) corresponding Tafel plots of varied catalysts derived from curves in (a).

18
Figure S18. Overall water splitting perforamnce recorded in 1 M KOH using the CF-NG-Co/Ni foam as work electrode and counter electrode in a typical 3-electrode system (a) or anode and cathode in a 2-electrode (b) system. The loading mass of the catalyst was 200 mg cm-2 for all the electrodes. All the data are not iR-corrected.
Figure S19. Side-view (a) & (b) and front-view (c) of the static Zn-air battery device. The catalyst was casted onto the gas diffusion layer with a geometric area of 1×1 cm.
19
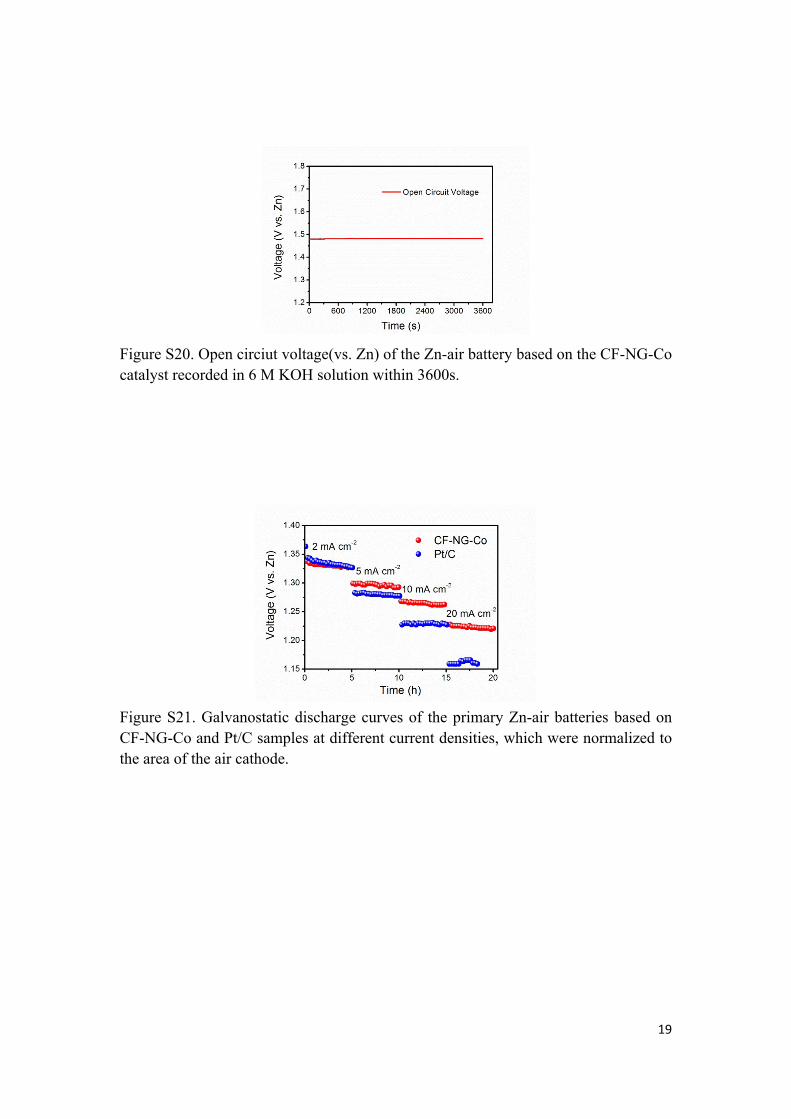
Figure S20. Open circiut voltage(vs. Zn) of the Zn-air battery based on the CF-NG-Co catalyst recorded in 6 M KOH solution within 3600s.
Figure S21. Galvanostatic discharge curves of the primary Zn-air batteries based on CF-NG-Co and Pt/C samples at different current densities, which were normalized to the area of the air cathode.
20
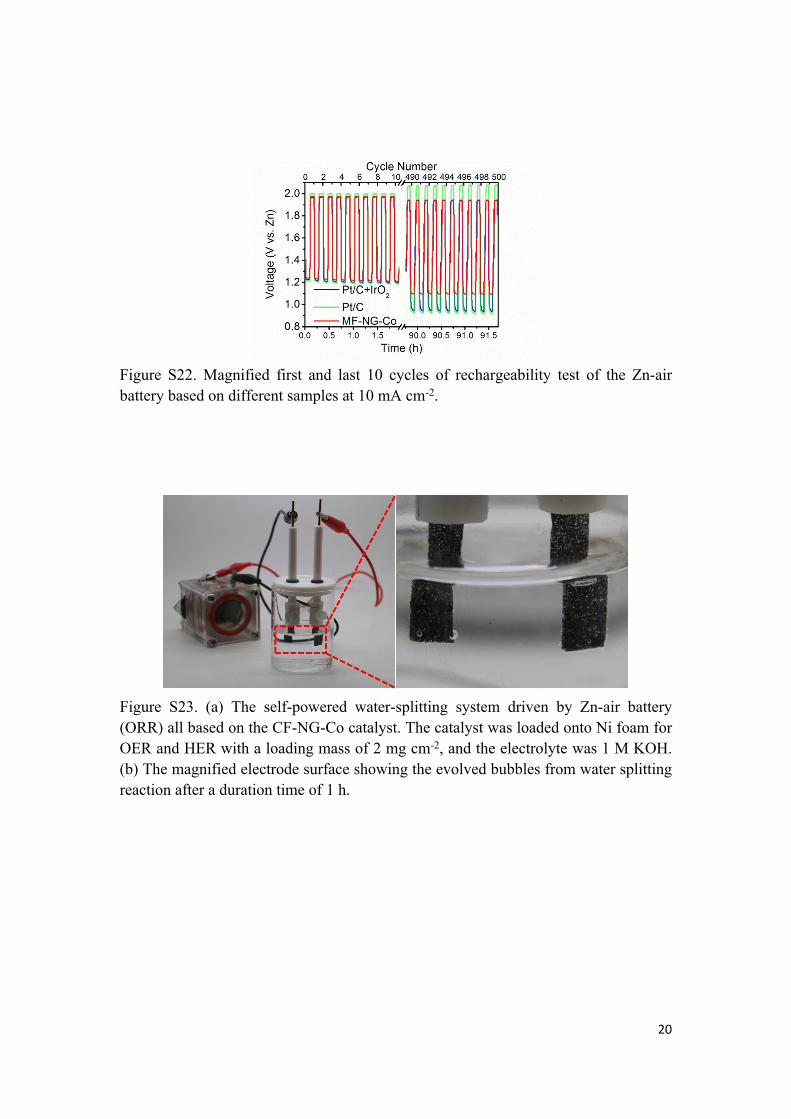
Figure S22. Magnified first and last 10 cycles of rechargeability test of the Zn-air battery based on different samples at 10 mA cm-2.
Figure S23. (a) The self-powered water-splitting system driven by Zn-air battery (ORR) all based on the CF-NG-Co catalyst. The catalyst was loaded onto Ni foam for OER and HER with a loading mass of 2 mg cm-2, and the electrolyte was 1 M KOH. (b) The magnified electrode surface showing the evolved bubbles from water splitting reaction after a duration time of 1 h.
21
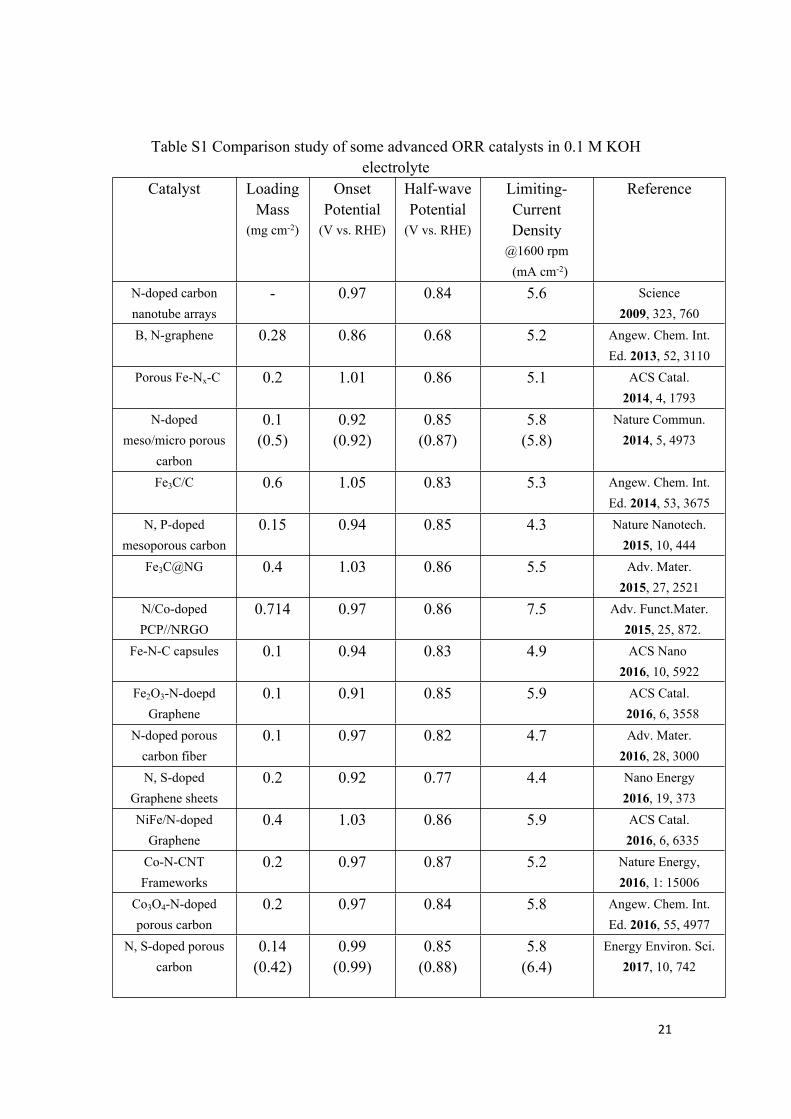
Table S1 Comparison study of some advanced ORR catalysts in 0.1 M KOH electrolyte
Catalyst Loading Mass
(mg cm-2)
Onset Potential
(V vs. RHE)
Half-wave Potential
(V vs. RHE)
Limiting-Current Density
@1600 rpm (mA cm-2)
Reference
N-doped carbon nanotube arrays
- 0.97 0.84 5.6 Science 2009, 323, 760
B, N-graphene 0.28 0.86 0.68 5.2 Angew. Chem. Int. Ed. 2013, 52, 3110
Porous Fe-Nx-C 0.2 1.01 0.86 5.1 ACS Catal. 2014, 4, 1793
N-doped meso/micro porous
carbon
0.1(0.5)
0.92(0.92)
0.85(0.87)
5.8(5.8)
Nature Commun. 2014, 5, 4973
Fe3C/C 0.6 1.05 0.83 5.3 Angew. Chem. Int. Ed. 2014, 53, 3675
N, P-doped mesoporous carbon
0.15 0.94 0.85 4.3 Nature Nanotech. 2015, 10, 444
Fe3C@NG 0.4 1.03 0.86 5.5 Adv. Mater. 2015, 27, 2521
N/Co-dopedPCP//NRGO
0.714 0.97 0.86 7.5 Adv. Funct.Mater. 2015, 25, 872.
Fe-N-C capsules 0.1 0.94 0.83 4.9 ACS Nano 2016, 10, 5922
Fe2O3-N-doepd Graphene
0.1 0.91 0.85 5.9 ACS Catal. 2016, 6, 3558
N-doped porous carbon fiber
0.1 0.97 0.82 4.7 Adv. Mater. 2016, 28, 3000
N, S-doped Graphene sheets
0.2 0.92 0.77 4.4 Nano Energy 2016, 19, 373
NiFe/N-doped Graphene
0.4 1.03 0.86 5.9 ACS Catal. 2016, 6, 6335
Co-N-CNTFrameworks
0.2 0.97 0.87 5.2 Nature Energy, 2016, 1: 15006
Co3O4-N-doped porous carbon
0.2 0.97 0.84 5.8 Angew. Chem. Int. Ed. 2016, 55, 4977
N, S-doped porous carbon
0.14(0.42)
0.99(0.99)
0.85(0.88)
5.8(6.4)
Energy Environ. Sci. 2017, 10, 742
22
CF-NG-Co 0.28(0.14)
0.97(0.97)
0.88(0.85)
5.6(5.5)
This work
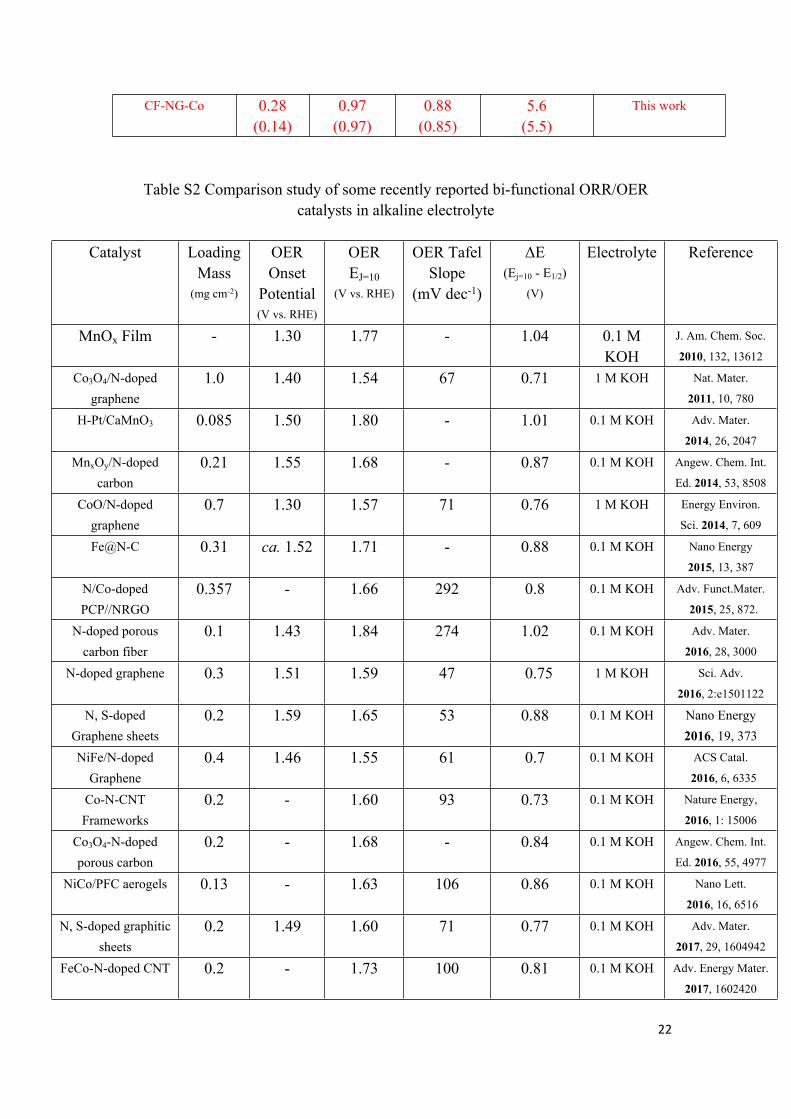
Table S2 Comparison study of some recently reported bi-functional ORR/OER catalysts in alkaline electrolyte
Catalyst Loading Mass
(mg cm-2)
OER Onset
Potential(V vs. RHE)
OER EJ=10
(V vs. RHE)
OER Tafel Slope
(mV dec-1)
ΔE(Ej=10 - E1/2)
(V)
Electrolyte Reference
MnOx Film - 1.30 1.77 - 1.04 0.1 M KOH
J. Am. Chem. Soc.
2010, 132, 13612
Co3O4/N-doped graphene
1.0 1.40 1.54 67 0.71 1 M KOH Nat. Mater.
2011, 10, 780
H-Pt/CaMnO3 0.085 1.50 1.80 - 1.01 0.1 M KOH Adv. Mater.
2014, 26, 2047
MnxOy/N-doped carbon
0.21 1.55 1.68 - 0.87 0.1 M KOH Angew. Chem. Int.
Ed. 2014, 53, 8508
CoO/N-doped graphene
0.7 1.30 1.57 71 0.76 1 M KOH Energy Environ.
Sci. 2014, 7, 609
Fe@N-C 0.31 ca. 1.52 1.71 - 0.88 0.1 M KOH Nano Energy
2015, 13, 387
N/Co-dopedPCP//NRGO
0.357 - 1.66 292 0.8 0.1 M KOH Adv. Funct.Mater.
2015, 25, 872.
N-doped porous carbon fiber
0.1 1.43 1.84 274 1.02 0.1 M KOH Adv. Mater.
2016, 28, 3000
N-doped graphene 0.3 1.51 1.59 47 0.75 1 M KOH
Sci. Adv.
2016, 2:e1501122
N, S-doped Graphene sheets
0.2 1.59 1.65 53 0.88 0.1 M KOH Nano Energy 2016, 19, 373
NiFe/N-doped Graphene
0.4 1.46 1.55 61 0.7 0.1 M KOH ACS Catal.
2016, 6, 6335
Co-N-CNTFrameworks
0.2 - 1.60 93 0.73 0.1 M KOH Nature Energy,
2016, 1: 15006
Co3O4-N-doped porous carbon
0.2 - 1.68 - 0.84 0.1 M KOH Angew. Chem. Int.
Ed. 2016, 55, 4977
NiCo/PFC aerogels 0.13 - 1.63 106 0.86 0.1 M KOH Nano Lett.
2016, 16, 6516
N, S-doped graphitic sheets
0.2 1.49 1.60 71 0.77 0.1 M KOH Adv. Mater.
2017, 29, 1604942
FeCo-N-doped CNT 0.2 - 1.73 100 0.81 0.1 M KOH Adv. Energy Mater.
2017, 1602420
23
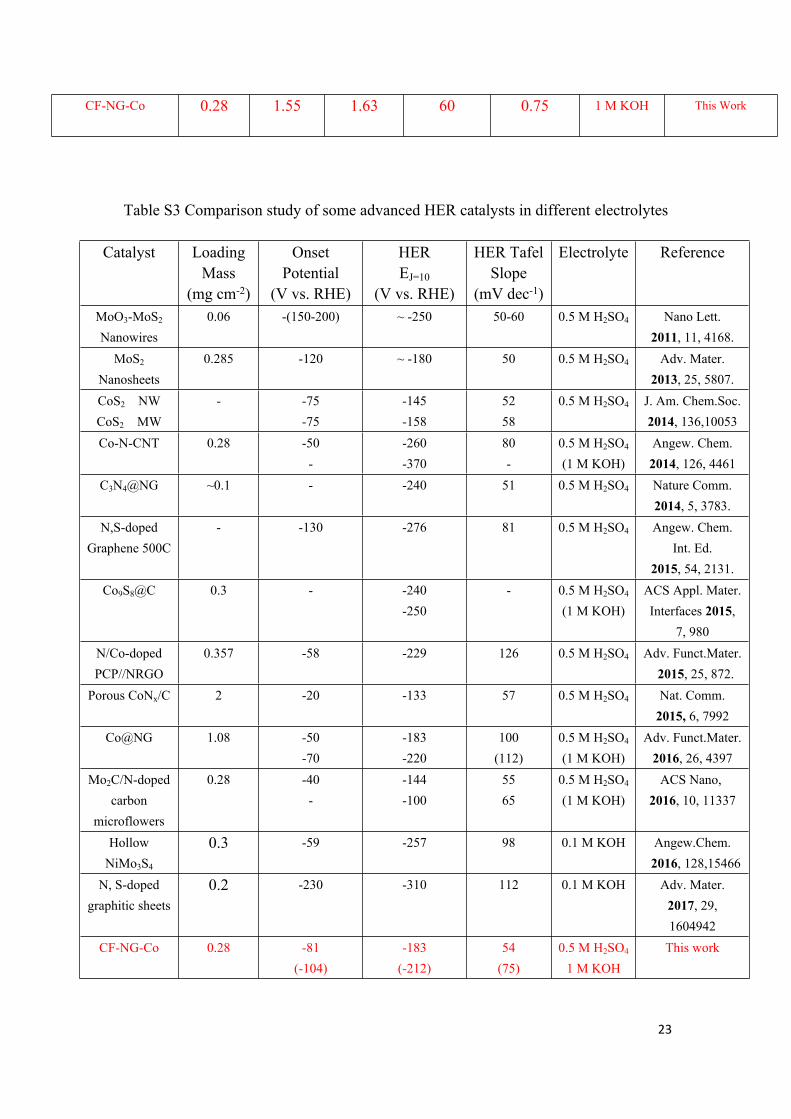
CF-NG-Co 0.28 1.55 1.63 60 0.75 1 M KOH This Work
Table S3 Comparison study of some advanced HER catalysts in different electrolytes
Catalyst Loading Mass
(mg cm-2)
Onset Potential
(V vs. RHE)
HER EJ=10
(V vs. RHE)
HER Tafel Slope
(mV dec-1)
Electrolyte Reference
MoO3-MoS2
Nanowires0.06 -(150-200) ~ -250 50-60 0.5 M H2SO4 Nano Lett.
2011, 11, 4168.MoS2
Nanosheets0.285 -120 ~ -180 50 0.5 M H2SO4 Adv. Mater.
2013, 25, 5807.CoS2 NWCoS2 MW
- -75-75
-145-158
5258
0.5 M H2SO4 J. Am. Chem.Soc.2014, 136,10053
Co-N-CNT 0.28 -50-
-260-370
80-
0.5 M H2SO4
(1 M KOH)Angew. Chem. 2014, 126, 4461
C3N4@NG ~0.1 - -240 51 0.5 M H2SO4 Nature Comm.2014, 5, 3783.
N,S-dopedGraphene 500C
- -130 -276 81 0.5 M H2SO4 Angew. Chem. Int. Ed.
2015, 54, 2131.Co9S8@C 0.3 - -240
-250- 0.5 M H2SO4
(1 M KOH)ACS Appl. Mater. Interfaces 2015,
7, 980N/Co-dopedPCP//NRGO
0.357 -58 -229 126 0.5 M H2SO4 Adv. Funct.Mater. 2015, 25, 872.
Porous CoNx/C 2 -20 -133 57 0.5 M H2SO4 Nat. Comm. 2015, 6, 7992
Co@NG 1.08 -50-70
-183-220
100(112)
0.5 M H2SO4
(1 M KOH)Adv. Funct.Mater.
2016, 26, 4397Mo2C/N-doped
carbon microflowers
0.28 -40-
-144-100
5565
0.5 M H2SO4
(1 M KOH)ACS Nano,
2016, 10, 11337
HollowNiMo3S4
0.3 -59 -257 98 0.1 M KOH Angew.Chem. 2016, 128,15466
N, S-doped graphitic sheets
0.2 -230 -310 112 0.1 M KOH Adv. Mater. 2017, 29, 1604942
CF-NG-Co 0.28 -81(-104)
-183(-212)
54(75)
0.5 M H2SO4
1 M KOHThis work
24
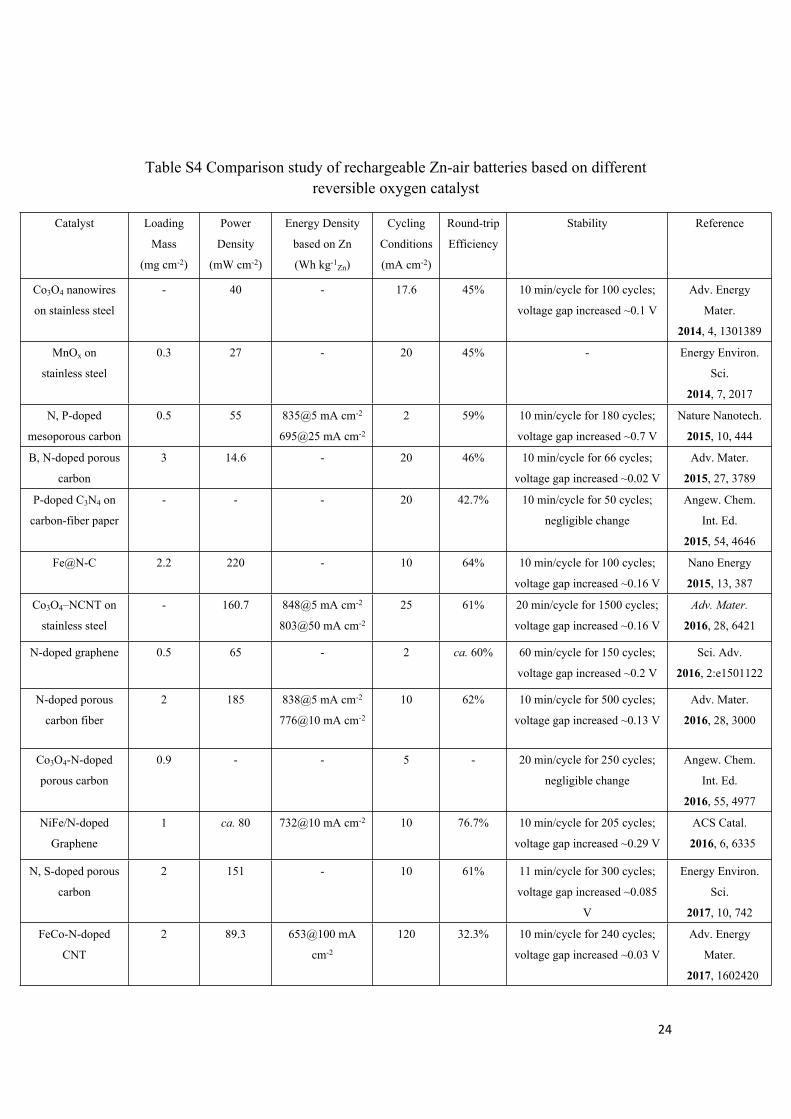
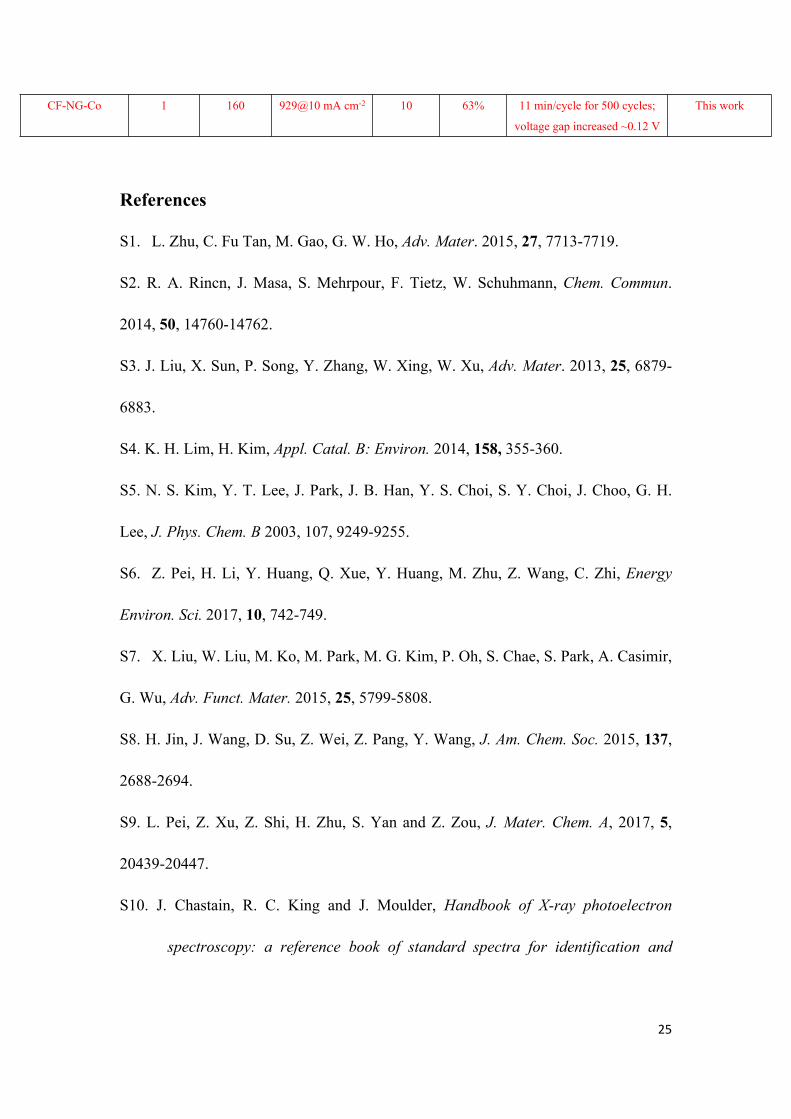
Table S4 Comparison study of rechargeable Zn-air batteries based on different reversible oxygen catalyst
Catalyst Loading
Mass
(mg cm-2)
Power
Density
(mW cm-2)
Energy Density
based on Zn
(Wh kg-1Zn)
Cycling
Conditions
(mA cm-2)
Round-trip
Efficiency
Stability Reference
Co3O4 nanowires
on stainless steel
- 40 - 17.6 45% 10 min/cycle for 100 cycles;
voltage gap increased ~0.1 V
Adv. Energy
Mater.
2014, 4, 1301389
MnOx on
stainless steel
0.3 27 - 20 45% - Energy Environ.
Sci.
2014, 7, 2017
N, P-doped
mesoporous carbon
0.5 55 835@5 mA cm-2
695@25 mA cm-2
2 59% 10 min/cycle for 180 cycles;
voltage gap increased ~0.7 V
Nature Nanotech.
2015, 10, 444
B, N-doped porous
carbon
3 14.6 - 20 46% 10 min/cycle for 66 cycles;
voltage gap increased ~0.02 V
Adv. Mater.
2015, 27, 3789
P-doped C3N4 on
carbon-fiber paper
- - - 20 42.7% 10 min/cycle for 50 cycles;
negligible change
Angew. Chem.
Int. Ed.
2015, 54, 4646
Fe@N-C 2.2 220 - 10 64% 10 min/cycle for 100 cycles;
voltage gap increased ~0.16 V
Nano Energy
2015, 13, 387
Co3O4–NCNT on
stainless steel
- 160.7 848@5 mA cm-2
803@50 mA cm-2
25 61% 20 min/cycle for 1500 cycles;
voltage gap increased ~0.16 V
Adv. Mater.
2016, 28, 6421
N-doped graphene 0.5 65 - 2 ca. 60% 60 min/cycle for 150 cycles;
voltage gap increased ~0.2 V
Sci. Adv.
2016, 2:e1501122
N-doped porous
carbon fiber
2 185 838@5 mA cm-2
776@10 mA cm-2
10 62% 10 min/cycle for 500 cycles;
voltage gap increased ~0.13 V
Adv. Mater.
2016, 28, 3000
Co3O4-N-doped
porous carbon
0.9 - - 5 - 20 min/cycle for 250 cycles;
negligible change
Angew. Chem.
Int. Ed.
2016, 55, 4977
NiFe/N-doped
Graphene
1 ca. 80 732@10 mA cm-2 10 76.7% 10 min/cycle for 205 cycles;
voltage gap increased ~0.29 V
ACS Catal.
2016, 6, 6335
N, S-doped porous
carbon
2 151 - 10 61% 11 min/cycle for 300 cycles;
voltage gap increased ~0.085
V
Energy Environ.
Sci.
2017, 10, 742
FeCo-N-doped
CNT
2 89.3 653@100 mA
cm-2
120 32.3% 10 min/cycle for 240 cycles;
voltage gap increased ~0.03 V
Adv. Energy
Mater.
2017, 1602420
25
References
S1. L. Zhu, C. Fu Tan, M. Gao, G. W. Ho, Adv. Mater. 2015, 27, 7713-7719.
S2. R. A. Rincn, J. Masa, S. Mehrpour, F. Tietz, W. Schuhmann, Chem. Commun.
2014, 50, 14760-14762.
S3. J. Liu, X. Sun, P. Song, Y. Zhang, W. Xing, W. Xu, Adv. Mater. 2013, 25, 6879-
6883.
S4. K. H. Lim, H. Kim, Appl. Catal. B: Environ. 2014, 158, 355-360.
S5. N. S. Kim, Y. T. Lee, J. Park, J. B. Han, Y. S. Choi, S. Y. Choi, J. Choo, G. H.
Lee, J. Phys. Chem. B 2003, 107, 9249-9255.
S6. Z. Pei, H. Li, Y. Huang, Q. Xue, Y. Huang, M. Zhu, Z. Wang, C. Zhi, Energy
Environ. Sci. 2017, 10, 742-749.
S7. X. Liu, W. Liu, M. Ko, M. Park, M. G. Kim, P. Oh, S. Chae, S. Park, A. Casimir,
G. Wu, Adv. Funct. Mater. 2015, 25, 5799-5808.
S8. H. Jin, J. Wang, D. Su, Z. Wei, Z. Pang, Y. Wang, J. Am. Chem. Soc. 2015, 137,
2688-2694.
S9. L. Pei, Z. Xu, Z. Shi, H. Zhu, S. Yan and Z. Zou, J. Mater. Chem. A, 2017, 5,
20439-20447.
S10. J. Chastain, R. C. King and J. Moulder, Handbook of X-ray photoelectron
spectroscopy: a reference book of standard spectra for identification and
CF-NG-Co 1 160 929@10 mA cm-2 10 63% 11 min/cycle for 500 cycles;
voltage gap increased ~0.12 V
This work

26
interpretation of XPS data, Physical Electronics Division, Perkin-Elmer
Corporation Eden Prairie, Minnesota, 1992.
S11. H. Jin, J. Wang, D. Su, Z. Wei, Z. Pang and Y. Wang, J. Am. Chem. Soc, 2015,
137, 2688-2694.
S12. Z. Dai, H. Geng, J. Wang, Y. Luo, B. Li, Y. Zong, J. Yang, Y. Guo, Y.
Zheng and X. Wang, ACS nano, 2017, DOI: 10.1021/acsnano.7b05050.