supporting information for single-point-mutation detection ... · 1 supporting information for...
TRANSCRIPT

1
Supporting Information for Single-Point-Mutation Detection in RNA extracts using Gold Nanoparticles Modified with Hydrophobic Molecular Beacons. Alfonso Latorre,† Christian Posch,‡ Yolanda Garcimartín,† Susana Ortiz-Urda,*‡ Álvaro Somoza*†
† Instituto Madrileño de Estudios Avanzados en Nanociencia (IMDEA Nanociencia),
Cantoblanco, 28049 Madrid, Spain& CNB-CSIC-IMDEA Nanociencia Associated Unit "Unidad de
Nanobiotecnología. Spain
‡Department of Dermatology, University of California San Francisco, USA.
Table of contents 1
Synthesis of modified CPG 1
Synthesis and MALDI data of Oligonucleotides 4
Synthesis and functionalization of gold nanoparticles 5
RNA Extracts 6
Detection experiments 7
Using oligonucleotides as targets 7
Using RNA extracts 24
Hydrodynamic size of particles 29
NMR spectra 30
Synthesis of modified CPG
General Experimental Methods:
Reagents were purchased from Aldrich and used without further purification. Thin layer
chromatography was carried out using Silica Gel 60 F254 plates. Column chromatography was
performed using Silica Gel (60 Å,230 x 400 mesh). All NMR spectra were recorded on Bruker
Electronic Supplementary Material (ESI) for Chemical CommunicationsThis journal is © The Royal Society of Chemistry 2014

2
300 MHz instrument as solutions in the deuterated solvent indicated, and the chemical shifts
are reported in parts per million (ppm). Coupling constants are reported in hertz (Hz).
5-[(3S)-1,2-dithiolan-3-yl]-N-[(1R,2S)-2-hydroxy-1-(hydroxymethyl)propyl]pentanamide (1).
To a solution of (R)-(+)-1,2-dithiolane-3-pentanoic acid (3.301 mmol, 680 mg, 1.2 eq.) in DMF
(0.5 M) at room temperature, N- hydroxybenzotriazole (3.027 mmol, 409 mg, 1.1 eq.) and
diisopropylcarbodiimide (3.026 mmol, 468 µl, 1.1 eq.) were added. After stirring the mixture
10 min. L- threoninol (2.752 mmol, 289 mg, 1 eq.) was added. The resulting mixture was stirred
overnight and then quenched by the addiction of methanol. The solvent was evaporated under
vacuum and the residue purified by flash chromatography 20:1 (CH2Cl2: MeOH) to yield 660 mg
as a pale yellow oil (82%).1H-NMR (300 MHz, CDCl3): δ 6.26 (d, J = 6.7 Hz, 1H), 4.17 (d, J = 6.2
Hz, 1H), 3.95 – 3.71 (m, 3H), 3.58 (dt, J = 13.1, 6.5 Hz, 1H),3.48 (s,1H), 3.26 – 3.04 (m, 2H), 2.46
(td, J = 12.4, 6.4 Hz, 1H), 2.27 (t, J = 7.4 Hz, 2H), 1.91 (dq, J = 13.7, 6.9 Hz, 1H), 1.80 – 1.60 (m,
5H), 1.57 – 1.41 (m, 2H), 1.19 (d, J = 6.4 Hz, 3H). 13C-NMR (75MHz, CDCl3): δ 174.1 (C),
68.7(CH), 65.0(CH2), 56.4(CH), 54.7(CH), 40.3(CH2), 38.5(CH2), 36.5(CH2), 34.6(CH2), 28.8(CH2),
25.5(CH2), 20.6(CH3). HR-MS (ESI): m/z calculated for C12H24NO3S2 294.1192 [M+H]+, found
294.1186.
N-((1R,2S)-1-{[bis(4-methoxyphenyl)(phenyl)methoxy]methyl}-2-hydroxypropyl)-5-[(3S)-1,2-
dithiolan-3-yl]pentanamide (2).
To a solution of the corresponding diol (0.682 mmol, 200 mg, 1 eq.) in pyridine (0.2 M) at 0°C,
diisopropylethylamine (1.023 mmol, 179 µl, 1.5 eq), 4,4´-dimethoxyltritylchloride (0.819 mmol,
277 mg, 1.2 eq) and dimethylaminopyridine (catalytic amount) were added. After 15 min. the
mixture was allowed to reach room temperature. The mixture was stirred overnight and then
quenched by the addiction of methanol. The solvent was evaporated under vacuum and the
residue purified by flash chromatography 1:2 (hexane: EtOAc) to yield 270 mg as a white to
light yellow foam (66%). 1H-NMR (300 MHz, CDCl3): δ 7.28 (m, 9H), 6.83 (d, J = 8.8 Hz, 4H), 6.03
(d, J = 8.7 Hz, 1H),4.10 (m, 1H), 3.93 (dd, J = 8.4, 2.5 Hz, 1H), 3.79 (s, 6H), 3.62 – 3.48 (m, 1H),
3.41 (dd, J = 9.6, 4.3 Hz, 1H), 3.29 (dd, J = 9.6, 3.5 Hz, 1H), 3.23 – 3.05 (m, 3H), 2.44 (td, J = 12.4,
6.4 Hz, 1H), 2.23 (t, J = 7.3 Hz, 2H), 1.90 (td, J = 13.7, 6.9 Hz, 1H), 1.76 – 1.62 (m, 4H), 1.56 –
1.41 (m, 2H), 1.12 (d, J = 6.4 Hz, 3H). 13C-NMR (75MHz, CDCl3): δ 173.0 (C), 158.6 (2C) (C),
144.3 (C), 135.5 (C), 135.3 (C), 129.9 (2C) (CH), 129.8 (2C) (CH), 127.9 (2C) (CH), 127.8 (2C) (CH),
127.0(CH), 113.3 (4C) (CH3), 86.7, 68.6(CH), 65.2(CH2), 60.3, 56.3(CH), 55.2(CH), 53.3(CH),
Electronic Supplementary Material (ESI) for Chemical CommunicationsThis journal is © The Royal Society of Chemistry 2014

3
40.2(CH2), 38.4(CH2), 36.5(CH2), 34.6(CH2), 28.9(CH2), 25.5(CH2), 19.9(CH3). HR-MS (ESI): m/z
calculated for C33H41NNaO5S2 618.2324 [M+Na]+, found 618.2296.
CPG Functionalization (two steps)
I
To a solution of 2 (0.084 mmol, 50 mg, 1 eq) in anhydrous dichloromethane (0.2 M) succinic
anhydride (0.109 mmol, 10.9 mg, 1.3 eq), diisopropylethylamine (0.118 mmol, 20.5 µl, 1.4 eq)
dimethylaminopyridine (catalytic amount) were added. The solution was stirred for 16 h at
room temperature. The solution was washed with water and extracted with dichloromethane.
The organic layer was dried over MgSO4, filtered and evaporated under vacuum to yield
yellowish oil.
II
To a solution of DMAP (0.126 mmol, 15.4 mg, 1.5 eq) in acetronitrile (60 mM) the product
obtained in the step II was added (0.084 mmol, 58.3 mg, 1 eq). After mixing it well in vortex,
the solution was added to a solution of 2,2´-dithiobis-(5-nitropyridine) (0.126 mmol, 39.0 mg,
1.5 eq) in anhydrous CH2Cl2 (300 µl). The solution was mixed well and added to triphenyl
posphine (0.126 mmol, 33.0 mg, 1.5 eq). The mixture was vortexed till all reagents were
dissolved giving rise to a reddish solution, which was added to 500 mg of CPG (500 Å). After 2h
at room temperature, the solution was removed and the CPG washed with methanol (3 x 20
ml) and dry acetronitrile (3 x 20 ml). Once the CPG was dry, 2 ml of a 1:1 mixture of the
capping reagents (CAP A: 600 µl pyridine, 500 µl dry THF, 400 µl acetic anhydride; CAP B: 1 ml
dry THF, 400 µl 1-methylimidazole) was added. After 20 min at room temperature, the CPG
was washed with dry acetonitrile (6 x 20 ml) and dried well.
The CPG loading was calculated by detrytylation of the sample as follow: 10 mg of CPG were
treated with 5 ml of detrytylation solution (3 ml of perchloric acid and 2 ml of ethanol) for 1
hour. Then 500 µl of the mixture were dissolved in 2 ml of the detrytylation solution and
absorbance was measured at 498 nm. Functionalization (F) was determined by Lambert-Beer
law using a extinction coefficient of 7x 10⁴ M-1 cm -1:
F = (ABS x V) / (ε x g) = M / g
The loading of the modified CPG as prepared was 183 μM/g
Electronic Supplementary Material (ESI) for Chemical CommunicationsThis journal is © The Royal Society of Chemistry 2014

4
Synthesis and MALDI data of Oligonucleotides
Oligonucleotides were prepared using a MerMade4 DNA Synthesizer using phosphoramidites
(Link Technologies). DNA oligonucleotides were prepared at 1 µMol scale. After solid-phase
synthesis, the solid support was transferred to a screw-cap glass vial and incubated at 55 °C for
4 h with 2 mL of ammonia solution (33%). After the vial was cooled on ice the supernatant was
transferred by pipet to microcentrifuge tubes and the solid support and vial were rinsed with
water. The combined solutions were evaporated to dryness using a evaporating centrifuge.
The samples were purified by polyacrylamide gel electrophoresis 20% and the oligonucleotides
were eluted from gel fractions using an elutrap system. The solutions were desalted using a
NAP-10 column and concentrated in an evaporating centrifuge.
Cholesterol modification (Chole) was incorporated using commercial available
phosphoramidites (Link Technologies).
Dithiolane modification was incorporated using the modified CPG described above.
SEQUENCES
Entry Name Sequence
1 KRAS-WT-Chole 5’-Chole-AGCAAGACGCCACCAGCTCCACTTGCTAAAAA-Dithiolane-3’
2 KRAS-MUT-Chole 5’-Chole-AGCAAGACGCCACAAGCTCCACTTGCTAAAAA-Dithiolane-3’
3 KRAS-WT-Target 5’-TGGAGCTGGTGGCGT-3’
4 KRAS-MUT-Target 5’-TGGAGCTTGTGGCGT-3’
5 GNAQ-WT-Chole 5’-Chole-CCGTCTGACCTTTGGCCCCCGACGGAAAAA –Dithiolane-3’
6 GNAQ-MUT-Chole 5’-Chole-CCGTCTGACCTTGGGCCCCCGACGGAAAAA-Dithiolane-3’
7 GNAQ-WT-Target 5’-GGGGGCCAAAGGTCA-3’
8 GNAQ-MUT-Target 5’-GGGGGCCCAAGGTCA-3’
9 RP-WT-Chole 5’-Chole-CTCCCCGTGGCGCCAGTTGGGAGAAAAA- Dithiolane-3’
10 RP-MUT-Chole 5’-Chole-CTCCCCGTGGCACCAGTTGGGAGAAAAA -Dithiolane-3’
11 RP-WT-Target 5’-CAACTGGCGCCACGG -3’
12 RP-Mut-Target 5’- CAACTGGTGCCACGG -3’
13 RP-MUT-Control 5’- CTCCCCGTGGCACCAGTTGGGAGAAAAA -Dithiolane-3’
Table S1. Sequences prepared in this work
Electronic Supplementary Material (ESI) for Chemical CommunicationsThis journal is © The Royal Society of Chemistry 2014

5
MALDI
Entry Name Calc Mass Found
1 KRAS-WT-Chole 10687.3 10674.9
2 KRAS-MUT-Chole 10711.3 10702.9
3 KRAS-WT-Target 4680.1 4677.1
4 KRAS-MUT-Target 4655 4651.4
5 GNAQ-WT-Chole 10084.8 10078.3
6 GNAQ-MUT-Chole 10109.8 10116.7
7 GNAQ-WT-Target 4667.1 4655
8 GNAQ-MUT-Target 4643.1 4631.01
9 RP-WT-Chole 9571.42 9565.5
10 RP-MUT-Chole 9555.42 9534.5
11 RP-WT-Target 4563.0 4551.1
12 RP-MUT-Target 4578.0 4568.6
13 RP-MUT-Control 8962.6 8973.3
Table S2. Maldi data of the sequences prepared
Maldi data was obtained at the Proteomic facility of the National Center for Biotechnology
(CNB-CSIC) & at IMDEA Nanociencia using a Voyager DE Pro.
Synthesis and functionalization of gold nanoparticles
Gold Nanoparticles. Gold Nanoparticles were prepared by the citrate reduction method.[1] A solution of HAuCl4 (34.3 mg) in H2O (101 mL) was heated up to reach boiling temperature then a solution of sodium citrate (119.4 mg) in H2O (10.1 mL) was added quickly. The solution was stirred for 10 min and then the removed from the heating source and stirred overnight at room temperature. The reddish solution was filtered and stored at 4 C. A UV/Vis spectrum of AuNPs showed the absorption inflection point at 520 nm, which was
defined as the peak value to produce a diameter of 13 nm. This result was consistent with the
observation from the high-resolution TEM image, in which a uniform size distribution of about
13 nm in diameter was observed. The concentration of AuNPs was determined using the
Lambert-Beer law and the extinction coefficient of 2.7x 10⁸ M-1 cm -1 at 520 nm.
[1] Ambrosi, A.; Castañeda, M. T.; Killard, A. J.; Smyth, M. R.; Alegret, S.; Merkoçi, A. Anal.
Chem. 2007, 79, 5232–40.
Funtionalization of Gold nanoparticles with oligonucleotides. Gold nanoparticles were incubated with oligonucleotides (1, 2, 5, 6, 9, 10 and 13) overnight in a 0.3M NaCl buffer. The samples were purified by centrifugation, the supernatants were removed and the particles dissolved in water. This process was repeated 3 times.
Electronic Supplementary Material (ESI) for Chemical CommunicationsThis journal is © The Royal Society of Chemistry 2014

6
Figure S1 . TEM images of modified gold nanoparticles.
RNA Extracts In this work we have used total RNA extracts from cell lines and tissue of mice. The required samples were obtained as follow: Animal Tissue
Total RNA extracts from tissue (liver) were generated from 6-8 weeks old female Pde6brd10/
Pde6brd10 mice carrying a germ line, missense rd10 mutation in exon 13 of the Pde6b gene.
Animals were euthanized by CO2 asphyxiation and cervical dislocation. Liver tissue was
collected under sterile conditions and flash frozen in liquid nitrogen. Frozen tissue was
crushed, lysed with QIAzol Lysis Reagent (Qiagen, 79306), homogenized and subject to total
RNA extraction with miRNeasy Mini Kit (Quiagen, 219004) following the manufacturer’s
instructions. All mouse studies were approved by the UCSF Institutional Animal Care and Use
Committee.
Cell culture
Human melanoma cell lines OMM1.3, and C918 were available in Ortiz’s lab at the University
of California San Francisco. Cells were maintained in RPMI 1640 media supplemented with 10%
FBS and grown at 37°C under 5% CO2 until they reached 80-90% confluency. Cells were lysed
with QIAzol Lysis Reagent (Qiagen, 79306) and total RNA was extracted with the miRNeasy
Mini Kit (Quiagen, 219004) following the manufacturer’s instructions.
Electronic Supplementary Material (ESI) for Chemical CommunicationsThis journal is © The Royal Society of Chemistry 2014

7
Detection experiments
Using oligonucleotides as targets. KRAS target sequence Gold nanoparticles (50 µL, 13 nM) modified with oligonucleotides ( 1 or 2) were incubated with PBS (100 µL) and the target sequence (3 or 4) (5 µL, at the required concentration: 1 µM, 100 nM) during 4 h. GNAQ Target sequence Gold nanoparticles (50 µL, 13 nM) modified with oligonucleotides (5 or 6) were incubated with PBS (100 µL), NaCl (5M, 5 µL) and the target sequence (7 or 8) (5 µL, at the required concentration: 1 µM, 100 nM or 10 nM) during 16 h. RP Target sequence Gold nanoparticles (50 µL, 13 nM) modified with oligonucleotides (9 and 10) were incubated with PBS (50 µL), H2O (50 µL) and the target sequence (11 or 12) (5 µL, at the required concentration: 1 µM, 100 nM or 10 nM) during 16 h.
KRAS Sensor.
Targeting WT KRAS
The nanoparticles designed to detect the WT KRAS gene were aggregated in the presence of
the oligonucleotide sequence that matches the sequence in the nanoparticle (blue). The
aggregation leads to a decrease in the plasmon band of gold nanoparticles at 530 nm. The
aggregation was less intense in the presence of the oligonucleotide with the mutated KRAS
sequence (green) or a scramble sequence (red).
0
0,01
0,02
0,03
0,04
0,05
0,06
0,07
0,08
0,09
400 450 500 550 600 650
abso
rban
ce
wavelegth (nm)
Match
SCR
Mismatch
Electronic Supplementary Material (ESI) for Chemical CommunicationsThis journal is © The Royal Society of Chemistry 2014

8
Figure S2. UV-Vis spectra of modified nanoparticles designed to detect the WT KRAS gene in
the presence of the matched (blue), mismatched (green) and scramble (red) oligonucleotide
sequences at 32 nM. There is a significant decrease in absorbance where the complementary
sequence is present (Match). On the other hand, when there is a mismatched or scramble
sequence the absorbance is higher
In this experiment the following sequences were employed:
Match: KRAS-WT-Target
SCR: RP-MUT-Target
Mismatch: KRAS-MUT-Target
Figure S3. UV-Vis spectra of modified nanoparticles designed to detect the WT KRAS gene in
the presence of the matched (blue), mismatched (green) and scramble (red) oligonucleotide
sequences at 3.2 nM. There is not selectivity at this concentration.
In this experiment the following sequences were employed:
Match: KRAS-WT-Target
SCR: RP-MUT-Target
Mismatch: KRAS-MUT-Target
Electronic Supplementary Material (ESI) for Chemical CommunicationsThis journal is © The Royal Society of Chemistry 2014
9
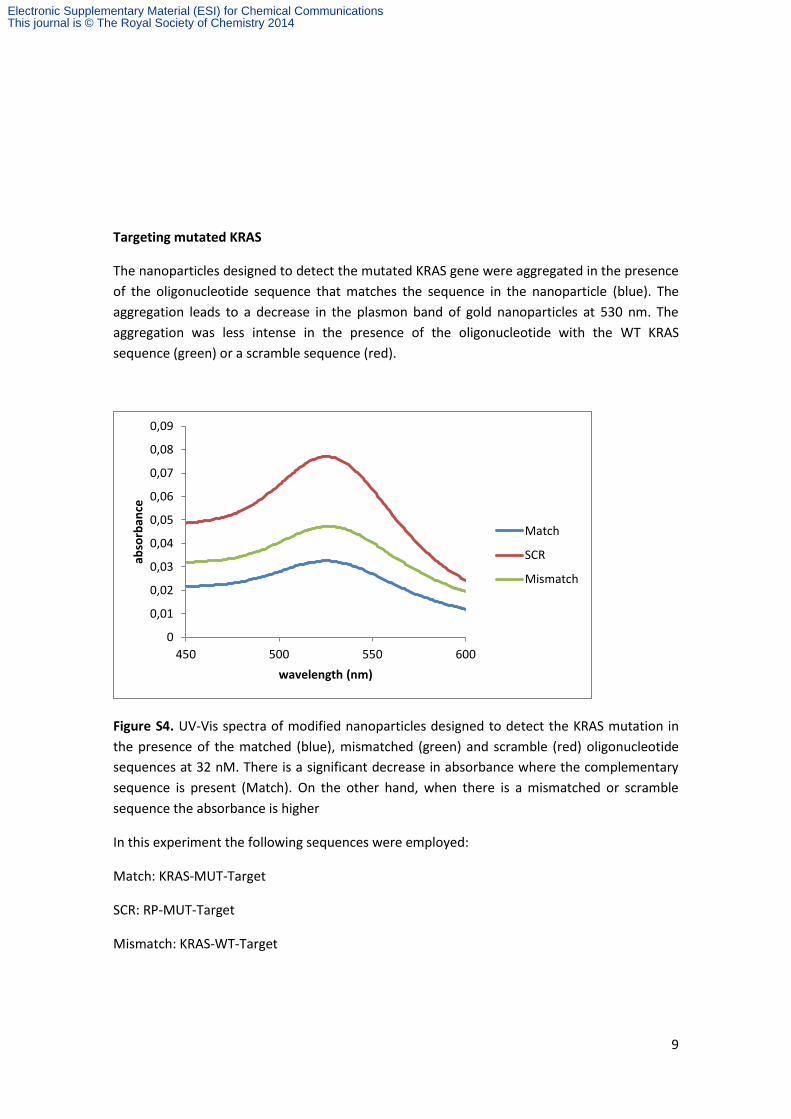
Targeting mutated KRAS
The nanoparticles designed to detect the mutated KRAS gene were aggregated in the presence
of the oligonucleotide sequence that matches the sequence in the nanoparticle (blue). The
aggregation leads to a decrease in the plasmon band of gold nanoparticles at 530 nm. The
aggregation was less intense in the presence of the oligonucleotide with the WT KRAS
sequence (green) or a scramble sequence (red).
Figure S4. UV-Vis spectra of modified nanoparticles designed to detect the KRAS mutation in
the presence of the matched (blue), mismatched (green) and scramble (red) oligonucleotide
sequences at 32 nM. There is a significant decrease in absorbance where the complementary
sequence is present (Match). On the other hand, when there is a mismatched or scramble
sequence the absorbance is higher
In this experiment the following sequences were employed:
Match: KRAS-MUT-Target
SCR: RP-MUT-Target
Mismatch: KRAS-WT-Target
0
0,01
0,02
0,03
0,04
0,05
0,06
0,07
0,08
0,09
450 500 550 600
abso
rban
ce
wavelength (nm)
Match
SCR
Mismatch
Electronic Supplementary Material (ESI) for Chemical CommunicationsThis journal is © The Royal Society of Chemistry 2014

10
Figure S5. UV-Vis spectra of modified nanoparticles designed to detect the KRAS mutation in
the presence of the matched (blue), mismatched (green) and scramble (red) oligonucleotide
sequences at 3.2 nM. There is not selectivity at this concentration.
In this experiment the following sequences were employed:
Match: KRAS-MUT-Target
SCR: RP-MUT-Target
Mismatch: KRAS-WT-Target
0
0,02
0,04
0,06
0,08
0,1
0,12
450 500 550 600 650
abso
rban
ce
wavelength (nm)
Match
SCR
Mismatch
Electronic Supplementary Material (ESI) for Chemical CommunicationsThis journal is © The Royal Society of Chemistry 2014

11
GNAQ Sensor
Targeting the WT GNAQ
The nanoparticles designed to detect the WT GNAQ gene were aggregated in the presence of
the oligonucleotide sequence that matches the sequence in the nanoparticle (blue). The
aggregation leads to a decrease in the plasmon band of gold nanoparticles at 530 nm. The
aggregation was less intense in the presence of the oligonucleotide with the mutated GNAQ
sequence (green) or a scramble sequence (red).
Figure S6. UV-Vis spectra of modified nanoparticles designed to detect the WT GNAQ gene in
the presence of the matched (blue), mismatched (green) and scramble (red) oligonucleotide
sequences at 32 nM. There is a significant decrease in absorbance where the complementary
sequence is present (Match). On the other hand, when there is a mismatched or scramble
sequence the absorbance is higher.
In this experiment the following sequences were employed:
Match: GNAQ-WT-Target
SCR: RP-MUT-Target
Mismatch: GNAQ-MUT-Target
0
0,01
0,02
0,03
0,04
0,05
0,06
0,07
0,08
450 500 550 600 650
abso
rban
ce
wavelength (nm)
GQ-WT
Match
SCR
Mismatch
Electronic Supplementary Material (ESI) for Chemical CommunicationsThis journal is © The Royal Society of Chemistry 2014

12
Figure S7. UV-Vis spectra of modified nanoparticles designed to detect the WT GNAQ gene in
the presence of the matched (blue), mismatched (green) and scramble (red) oligonucleotide
sequences at 3.2 nM. There is a significant decrease in absorbance where the complementary
sequence is present (Match). On the other hand, when there is a mismatched or scramble
sequence the absorbance is higher.
In this experiment the following sequences were employed:
Match: GNAQ-WT-Target
SCR: RP-MUT-Target
Mismatch: GNAQ-MUT-Target
Electronic Supplementary Material (ESI) for Chemical CommunicationsThis journal is © The Royal Society of Chemistry 2014
13
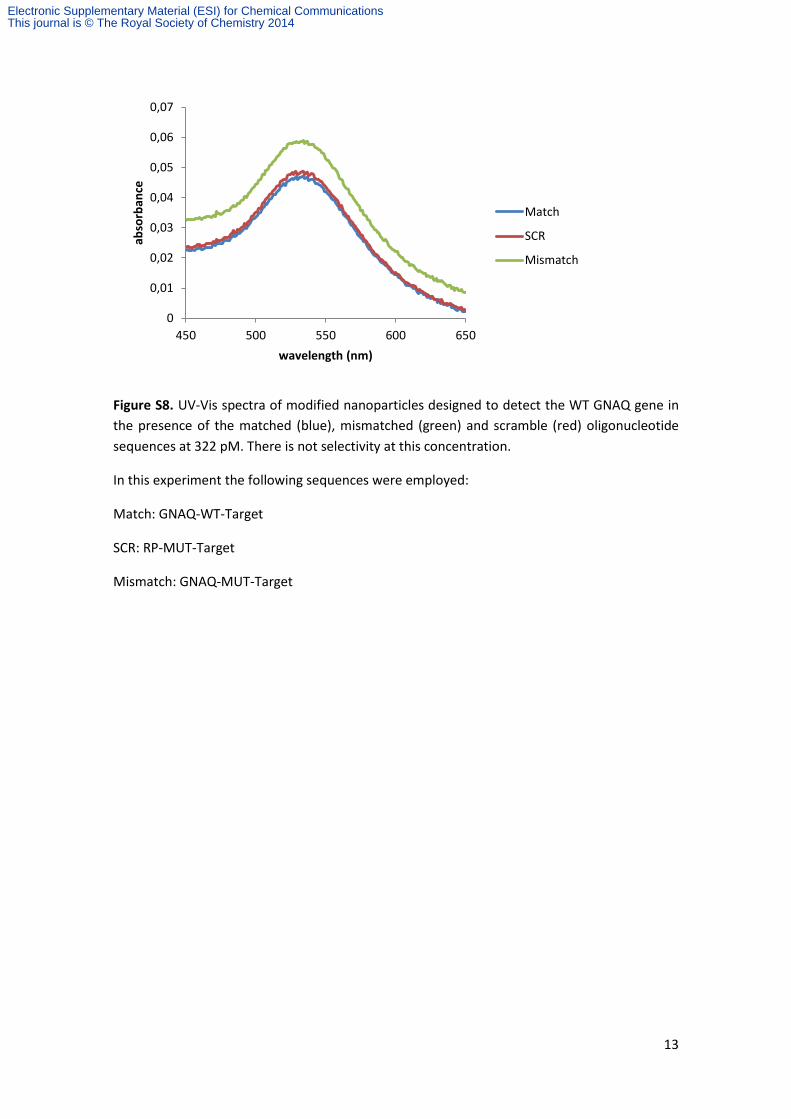
Figure S8. UV-Vis spectra of modified nanoparticles designed to detect the WT GNAQ gene in
the presence of the matched (blue), mismatched (green) and scramble (red) oligonucleotide
sequences at 322 pM. There is not selectivity at this concentration.
In this experiment the following sequences were employed:
Match: GNAQ-WT-Target
SCR: RP-MUT-Target
Mismatch: GNAQ-MUT-Target
0
0,01
0,02
0,03
0,04
0,05
0,06
0,07
450 500 550 600 650
abso
rban
ce
wavelength (nm)
Match
SCR
Mismatch
Electronic Supplementary Material (ESI) for Chemical CommunicationsThis journal is © The Royal Society of Chemistry 2014

14
Targeting the Mutated GNAQ
The nanoparticles designed to detect the mutated GNAQ gene were aggregated in the
presence of the oligonucleotide sequence that matches the sequence in the nanoparticle
(blue). The aggregation leads to a decrease in the plasmon band of gold nanoparticles at 530
nm. The aggregation was less intense in the presence of the oligonucleotide with the mutated
GNAQ sequence (green) or a scramble sequence (red).
Figure S9. UV-Vis spectra of modified nanoparticles designed to detect the mutated GNAQ
gene in the presence of the matched (blue), mismatched (green) and scramble (red)
oligonucleotide sequences at 32 nM. There is a significant decrease in absorbance where the
complementary sequence is present (Match). On the other hand, when there is a mismatched
or scramble sequence the absorbance is higher.
In this experiment the following sequences were employed:
Match: GNAQ-MUT-Target
SCR: RP-MUT-Target
Mismatch: GNAQ-WT-Target
0
0,01
0,02
0,03
0,04
0,05
0,06
0,07
0,08
0,09
450 500 550 600 650
abso
rban
ce
wavelength (nm)
GQ-MUT
Match
SCR
Mismatch
Electronic Supplementary Material (ESI) for Chemical CommunicationsThis journal is © The Royal Society of Chemistry 2014

15
Figure S10. UV-Vis spectra of modified nanoparticles designed to detect the mutated GNAQ
gene in the presence of the matched (blue), mismatched (green) and scramble (red)
oligonucleotide sequences at 3.2 nM. There is a significant decrease in absorbance where the
complementary sequence is present (Match). On the other hand, when there is a mismatched
or scramble sequence the absorbance is higher.
In this experiment the following sequences were employed:
Match: GNAQ-MUT-Target
SCR: RP-MUT-Target
Mismatch: GNAQ-WT-Target
Electronic Supplementary Material (ESI) for Chemical CommunicationsThis journal is © The Royal Society of Chemistry 2014

16
Figure S11. UV-Vis spectra of modified nanoparticles designed to detect the mutated GNAQ
gene in the presence of the matched (blue), mismatched (green) and scramble (red)
oligonucleotide sequences at 322 pM. There is not selectivity at this concentration.
In this experiment the following sequences were employed:
Match: GNAQ-MUT-Target
SCR: RP-MUT-Target
Mismatch: GNAQ-WT-Target
0
0,01
0,02
0,03
0,04
0,05
0,06
0,07
450 500 550 600 650
abso
rban
ce
wavelength (nm)
Match
SCR
Mismatch
Electronic Supplementary Material (ESI) for Chemical CommunicationsThis journal is © The Royal Society of Chemistry 2014

17
RP Sensor
Targeting the WT PDE6B gene
The nanoparticles designed to detect the WT PDE6B gene were aggregated in the presence of
the oligonucleotide sequence that mimics the PDE6B gene (blue and green). The aggregation
leads to a decrease in the plasmon band of gold nanoparticles at 530 nm. The aggregation was
less intense in the presence of the oligonucleotide with the scramble sequence (red).
Figure S12. UV-Vis spectra of modified nanoparticles designed to detect the WT PDE6B gene in
the presence of the matched (blue), mismatched (green) and scramble (red) oligonucleotide
sequences at 32 nM. There is a decrease in absorbance where the gene is present (Match and
Mismatch) compared with the scramble sequence.
In this experiment the following sequences were employed:
Match: RP-WT-Target
SCR: GNAQ-MUT-Target
Mismatch: RP-MUT-Target
0
0,01
0,02
0,03
0,04
0,05
0,06
0,07
450 500 550 600 650
abso
rban
ce
wavelength (nm)
Match
SCR
Mismatch
Electronic Supplementary Material (ESI) for Chemical CommunicationsThis journal is © The Royal Society of Chemistry 2014

18
Figure S13. UV-Vis spectra of modified nanoparticles designed to detect the WT PDE6B gene in
the presence of the matched (blue), mismatched (green) and scramble (red) oligonucleotide
sequences at 3.2 nM. There is a decrease in absorbance where the gene is present (Match and
Mismatch) compared with the scramble sequence.
In this experiment the following sequences were employed:
Match: RP-WT-Target
SCR: GNAQ-MUT-Target
Mismatch: RP-MUT-Target
0
0,02
0,04
0,06
0,08
0,1
0,12
450 500 550 600 650
absr
ob
ance
wavelength (nm)
Match
SCR
Mismatch
Electronic Supplementary Material (ESI) for Chemical CommunicationsThis journal is © The Royal Society of Chemistry 2014
19
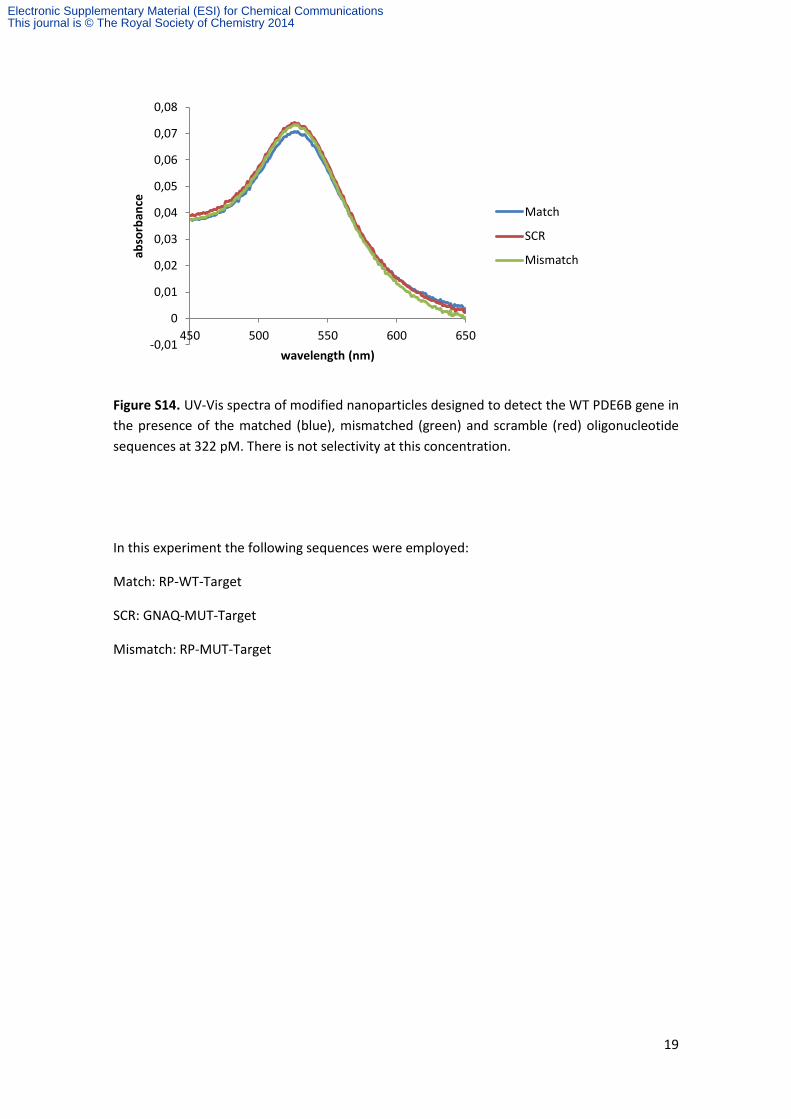
Figure S14. UV-Vis spectra of modified nanoparticles designed to detect the WT PDE6B gene in
the presence of the matched (blue), mismatched (green) and scramble (red) oligonucleotide
sequences at 322 pM. There is not selectivity at this concentration.
In this experiment the following sequences were employed:
Match: RP-WT-Target
SCR: GNAQ-MUT-Target
Mismatch: RP-MUT-Target
-0,01
0
0,01
0,02
0,03
0,04
0,05
0,06
0,07
0,08
450 500 550 600 650
abso
rban
ce
wavelength (nm)
Match
SCR
Mismatch
Electronic Supplementary Material (ESI) for Chemical CommunicationsThis journal is © The Royal Society of Chemistry 2014

20
Targeting Mutated PDE6B gene
The nanoparticles designed to detect the mutated PDE6B gene were aggregated in the
presence of the oligonucleotide sequence that matches the sequence in the nanoparticle
(blue). The aggregation leads to a decrease in the plasmon band of gold nanoparticles at 530
nm. The aggregation was less intense in the presence of the oligonucleotide with the WT
PDE6B sequence (green) or a scramble sequence (red).
Figure S15. UV-Vis spectra of modified nanoparticles designed to detect the PDE6B mutation in
the presence of the match (blue), mismatched (green) and scramble (red) oligonucleotide
sequences at 32 nM. There is a significant decrease in absorbance where the complementary
sequence is present (match). On the other hand, when there is a mismatched or scramble
sequence the absorbance is higher.
In this experiment the following sequences were employed:
Match: RP-MUT-Target
SCR: GNAQ-MUT-Target
Mismatch: RP-WT-Target
-0,01
0
0,01
0,02
0,03
0,04
0,05
0,06
450 500 550 600 650
abso
rban
ce
wavelength (nm)
Match
SCR
Mismatch
Electronic Supplementary Material (ESI) for Chemical CommunicationsThis journal is © The Royal Society of Chemistry 2014

21
Figure S16. UV-Vis spectra of modified nanoparticles designed to detect the PDE6B mutation in
the presence of the match (blue), mismatched (green) and scramble (red) oligonucleotide
sequences at 3.2 nM. There is a significant decrease in absorbance where the complementary
sequence is present (match). On the other hand, when there is a mismatched or scramble
sequence the absorbance is higher.
In this experiment the following sequences were employed:
Match: RP-MUT-Target
SCR: GNAQ-MUT-Target
Mismatch: RP-WT-Target
0
0,01
0,02
0,03
0,04
0,05
0,06
0,07
450 500 550 600 650
abso
rban
ce
wavelength (nm)
Match
SCR
Mismatch
Electronic Supplementary Material (ESI) for Chemical CommunicationsThis journal is © The Royal Society of Chemistry 2014

22
Figure S17. UV-Vis spectra of modified nanoparticles designed to detect the PDE6B mutation in
the presence of the match (blue), mismatched (green) and scramble (red) oligonucleotide
sequences at 322 pM. There is not selectivity at this concentration.
In this experiment the following sequences were employed:
Match: RP-MUT-Target
SCR: GNAQ-MUT-Target
Mismatch: RP-WT-Target
0
0,01
0,02
0,03
0,04
0,05
0,06
0,07
450 500 550 600 650
abso
rban
ce
wavelength (nm)
Match
SCR
Mismatch
Electronic Supplementary Material (ESI) for Chemical CommunicationsThis journal is © The Royal Society of Chemistry 2014

23
Targeting Mutated PDE6B gene with a control nanoparticle (without Cholesterol group).
We prepared a nanoparticle to detect the mutated PDE6B gene, but in this case we did not
introduce a cholesterol group at the end of the oligonucleotide, as in the previous cases. Using
the same conditions no aggregation was observed. This result highlights the key role of the
hydrophobic cholesterol group in the sensor.
Figure S18. UV-Vis spectra of modified nanoparticles without the cholesterol modification
designed to detect the RP mutation in the presence of the match (blue), mismatched (green)
and scramble (red) oligonucleotide sequences at 3.2 nM. There is not a significant decrease in
absorbance, therefore the presence of the cholesterol moiety is key to have an effective
sensor.
In this experiment the following sequences were employed:
Match: RP-MUT-Target
SCR: GNAQ-MUT-Target
Mismatch: RP-WT-Target
0
0,02
0,04
0,06
0,08
0,1
0,12
0,14
0,16
0,18
0,2
450 500 550 600
abso
rban
ce
wavelength (nm)
Match
SCR
Mismatch
Electronic Supplementary Material (ESI) for Chemical CommunicationsThis journal is © The Royal Society of Chemistry 2014

24
Using RNA extracts Total RNA extracts were obtained using standard procedures from mouse liver that express mutated RP gene, and the following cell lines C918 and OMM1.3. Stock solutions of RNA were prepared at 170 ng/µL and 85 ng/µL Detection of GNAQ gene from RNA extracts. Gold nanoparticles modified with oligonucleotides 5 or 6 (50 µL) were incubated with PBS (95 µL) , NaCl (5M, 10 µL) and total RNA extracts (15 µL) obtained from 1) a cell line that express the wild-type gene (C918), 2) mouse liver extracts that does not contain the gene (RP) and 3) a cell line that express the mutated gene (OMM1.3). After 16 h the samples were analyzed using a UV-vis spectrometer or a microplate reader (Synergy H4, Biotek)
Figure S19. UV-Vis spectra of modified AuNPs after incubation with the total mRNA extracts (5.5 ng/µL) of different cell lines. C918 expresses wild type GNAQ, OMM1.3 expresses mutated GNAQ and mRNA from mouse liver that do not contain the GNAQ gene. The nanoparticles are designed to detect the wt GNAQ gene present in the C918 cell line.
Electronic Supplementary Material (ESI) for Chemical CommunicationsThis journal is © The Royal Society of Chemistry 2014

25
Figure S20. Detection of wt gene using modified AuNPs and total mRNA extracts (5.5 ng/µL) of different cell lines. C918 expresses wild type GNAQ, OMM1.3 expresses mutated GNAQ and mRNA from mouse liver that do not contain the GNAQ gene. The nanoparticles are designed to detect the wt GNAQ gene present in the C918 cell line. The drop in absorbance in the blue bar is due to the presence of the wt GNAQ gene. Values obtained as an average of three experiments
Figure S21. Detection of wt gene using modified AuNPs and total mRNA extracts (2.75 ng/µL) of different cell lines. C918 expresses wild type GNAQ, OMM1.3 expresses mutated GNAQ and mRNA from mouse liver that do not contain the GNAQ gene. The nanoparticles are designed to detect the wt GNAQ gene present in the C918 cell line. The drop in absorbance in the blue bar is due to the presence of the wt GNAQ gene. Values obtained as an average of three experiments
Electronic Supplementary Material (ESI) for Chemical CommunicationsThis journal is © The Royal Society of Chemistry 2014

26
Figure S22. UV-Vis spectra of modified AuNPs after incubation with the total mRNA extracts
(5.5 ng/µL) of different cell lines. C918 expresses wt GNAQ, OMM1.3 expresses mutated GNAQ
and mRNA from mouse liver that does not express GNAQ. The nanoparticles are
Figure S23. Detection of mutated gene using modified AuNPs and total mRNA extracts (5.5 ng/µL) of different cell lines. C918 expresses wild type GNAQ, OMM1.3 expresses mutated GNAQ and mRNA from mouse liver that do not contain the GNAQ gene. The nanoparticles are designed to detect the mutated GNAQ gene present in the OMM1.3 cell line. The drop in absorbance in the blue bar is due to the presence of the mutated GNAQ gene. Values obtained as an average of three experiments.
Electronic Supplementary Material (ESI) for Chemical CommunicationsThis journal is © The Royal Society of Chemistry 2014

27
Figure S24. Detection of mutated gene using modified AuNPs and total mRNA extracts (2.75 ng/µL) of different cell lines. C918 expresses wild type GNAQ, OMM1.3 expresses mutated GNAQ and mRNA from mouse liver that do not contain the GNAQ gene. The nanoparticles are designed to detect the mutated GNAQ gene present in the OMM1.3 cell line. The drop in absorbance in the blue bar is due to the presence of the mutated GNAQ gene. Values obtained as an average of three experiments.
Figure S25. The AuNP sensor for mutant GNAQ allows the detection of the mutation with the naked eye. A: Extract from OMM1.3 cell line where the mutated gene is expressed. B: Extract from mouse liver where the gene is not expressed. C: Extracts from C918 cell line where the wild type gene is expressed. The total mRNA amount employed was (5.5 ng/µL).
Electronic Supplementary Material (ESI) for Chemical CommunicationsThis journal is © The Royal Society of Chemistry 2014
28
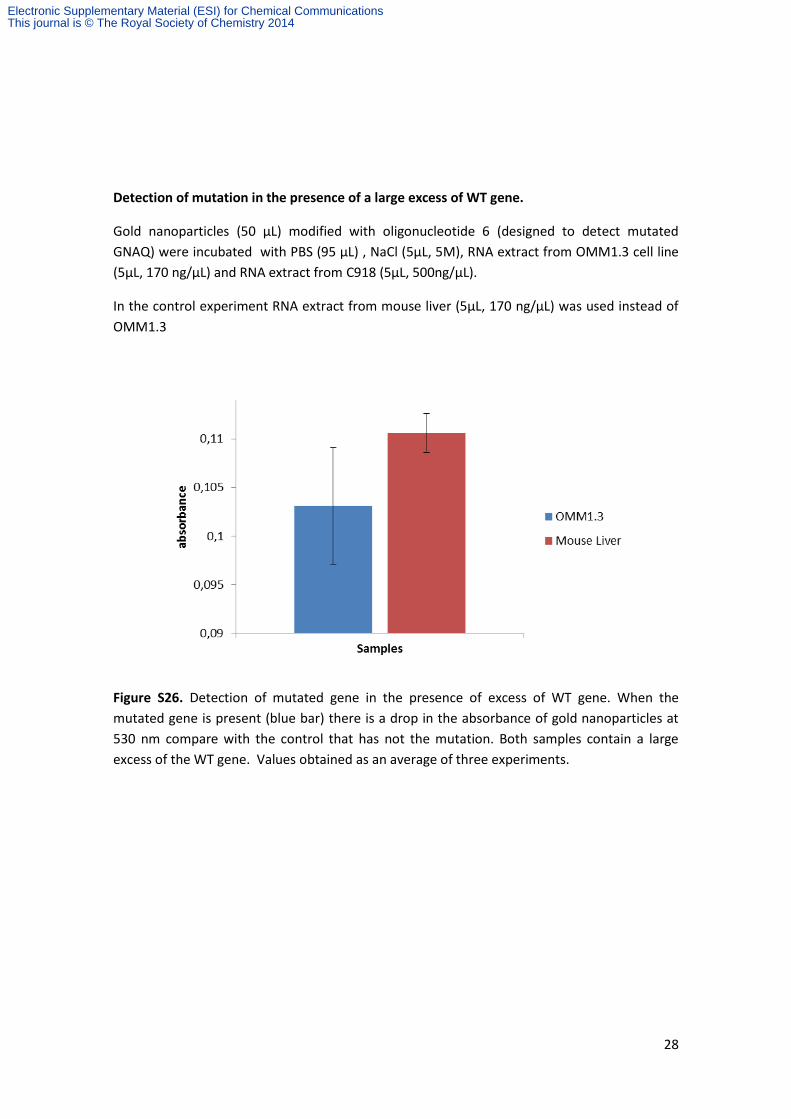
Detection of mutation in the presence of a large excess of WT gene.
Gold nanoparticles (50 µL) modified with oligonucleotide 6 (designed to detect mutated
GNAQ) were incubated with PBS (95 µL) , NaCl (5µL, 5M), RNA extract from OMM1.3 cell line
(5µL, 170 ng/µL) and RNA extract from C918 (5µL, 500ng/µL).
In the control experiment RNA extract from mouse liver (5µL, 170 ng/µL) was used instead of
OMM1.3
Figure S26. Detection of mutated gene in the presence of excess of WT gene. When the
mutated gene is present (blue bar) there is a drop in the absorbance of gold nanoparticles at
530 nm compare with the control that has not the mutation. Both samples contain a large
excess of the WT gene. Values obtained as an average of three experiments.
Electronic Supplementary Material (ESI) for Chemical CommunicationsThis journal is © The Royal Society of Chemistry 2014

29
Hydrodynamic Size of Particles
The hydrodynamic size of the particles before and after aggregation was measured for the
GNAQ-MUT system.
Hydrodynamic size was determined by dynamic light scattering (DLS) using a Zetasizer Nano
(Malvern). 3μL of AuNPs were diluted in water (200μL). The measurements were performed at
25°C at a 173° scattering angle in disposable microcuvettes. The mean dynamic diameter was
determined by cumulative analysis.
GNAQ-Mut particles: Z-average: 58.4 ± 0.9634 nm ; PDI= 0.351
GNAQ-Mut particles after incubation with RNA extracts:
OMM1.3: Z-average: 361.1±25.37; PDI: 0.541
Mouse liver: Z-average: 323.7±12.35; PDI: 0.443
C918: Z-average: 340.2±69.19; PDI: 0.539
The bigger particles are present in the sample containing the mutated gene (OMM1.3). This
data is in agreement with the aggregation observed and the decrease in absorbance, since the
larger particles should precipitate more than the others.
Electronic Supplementary Material (ESI) for Chemical CommunicationsThis journal is © The Royal Society of Chemistry 2014

30
NMR Spectra
Electronic Supplementary Material (ESI) for Chemical CommunicationsThis journal is © The Royal Society of Chemistry 2014

1
Electronic Supplementary Material (ESI) for Chemical CommunicationsThis journal is © The Royal Society of Chemistry 2014

1
Electronic Supplementary Material (ESI) for Chemical CommunicationsThis journal is © The Royal Society of Chemistry 2014

2
Electronic Supplementary Material (ESI) for Chemical CommunicationsThis journal is © The Royal Society of Chemistry 2014

2
Electronic Supplementary Material (ESI) for Chemical CommunicationsThis journal is © The Royal Society of Chemistry 2014