supporting information for - rsc.org · supporting information for: profiling of diferulates (plant...
TRANSCRIPT

1
Supporting Information for:
Profiling of Diferulates (Plant Cell Wall Cross-
Linkers) Using Ultrahigh-performance Liquid
Chromatography-Tandem Mass Spectrometry
Ramin Vismeha,b, Fachuang Luc,d, Shishir Chundawate,b, James F. Humpulae,b, Ali Azarpirad,
John Ralphc,d, Venkatesh Balane,b, Bruce E. Dalee,b and A. Daniel Jonesa,b,f,*.
a Department of Chemistry, Michigan State University, East Lansing, MI, USA. b DOE-Great Lakes Bioenergy Research Center (GLBRC), Michigan State University, East
Lansing, MI, USA. c DOE-Great Lakes Bioenergy Research Center (GLBRC), University of Wisconsin, Madison,
WI, USA. d Department of Biochemistry, University of Wisconsin, Madison, WI, USA. e Biomass Conversion Research Laboratory, Chemical Engineering and Materials Science,
Michigan State University, Lansing, MI, USA. Fax: 517 336 4615; Tel: 517 432 0157 f Department of Biochemistry and Molecular Biology, Michigan State University, East Lansing,
MI, USA. Tel. 517 432-7202; E-mail: [email protected]
Electronic Supplementary Material (ESI) for AnalystThis journal is © The Royal Society of Chemistry 2013

2
Supplemental Information: Methods Separation and analysis of diferulates using LC/MS/MS
The LC/MS system consisted of two Prominence LC-20AD (Shimadzu Corp.) pumps
connected to a QTRAP 3200 hybrid-linear ion trap mass analyzer (Applied Biosystems)
equipped with an electrospray ionization source (ESI). Diferulic acid standards, synthesized Ac-
Am and Di-Am diferulates, and NaOH-hydrolyzed and AFEXTM-treated corn stover extracts
were analyzed directly using a fused core Ascentis Express C18 (50 × 2.1 mm; 2.7 µm particles)
column (Supelco, USA). Binary gradient elution was used with 0.15% aqueous formic acid (A)
and methanol (B) under the following conditions and linear gradients: 0-1 min 5% B, increase to
30% B at 20 min; 40% B at 25 min; sudden increase to 99% B at 25.01 min and held until 27
min; returned to initial conditions at 27.01 min and held until 30 min. Injection volume, flow rate
and column temperature were 5.0 µL, 0.4 mL/min and 50 °C.
Fragment ions were generated in both positive and negative ion modes for [M+H]+ and [M-H]-
ions using collision induced dissociation (CID) with nitrogen as collision gas, using enhanced
product ion scanning. Major product ions generated at collision energy of 20 eV were subjected
to a second CID stage in MS3 scans. Accurate mass measurements were performed using a
Waters LCT Premier orthogonal acceleration time-of-flight (TOF) mass spectrometer with the
same chromatography system and multiplexed non-selective collision induced dissociation
through three collision potentials (15, 45, and 70 V) with spectrum acquisition of 0.2
s/function.42
Profiling of process byproducts following AFEXTM pretreatment of corn stover
AFEXTM treated corn stover was extracted with hot water (20 mL/g at 60 °C) for 2 h. The
mixture was cooled and filtered through Whatman filter paper (grade 40, pore size 8 µm).
Electronic Supplementary Material (ESI) for AnalystThis journal is © The Royal Society of Chemistry 2013

3
Filtrates were centrifuged for 10 min at 10,000g, and supernatant was used directly for LC/MS
analysis via injection with no further processing. Electrospray ionization in negative mode was
employed for analysis of process byproducts. Nontargeted peak detection, integration, and
retention time alignment was performed using Waters MarkerLynx software.
Electronic Supplementary Material (ESI) for AnalystThis journal is © The Royal Society of Chemistry 2013

4
Table S1 Table S1. Fragment ions from CID MS/MS spectra of [M+H]+ from diferulic acid standards using 20 eV collision energy, with suggested consecutive losses of side-chains and relative abundance for each product ion. MS3 performed on major product ions to support these suggested pathways.
Type of ion Neutral
Loss
m/z 8-O-4 8-8 NC 8-8 C 8-5 C
8-5 NC 5-5
[M+H+-H2O]+ 18 369 10 100 100 [M+H+-2H2O]+ 36 351 100 48 24 35 100 [M+H+-CO2]+ 44 343 40 [M+H+-H2O-CO]+ 46 341 43 95 90 [M+H+-CO-CH3
.]+ 61 326 37 [M+H+-H2O-CO2]+ 62 325 32 100 18 [M+H+-2H2O-CO]+ 64 323 40 55 20 10 [M+H+-2H2O-CH3OH]+ 68 319 18 [M+H+-H2O-CO-CH3OH]+ 78 309 55 [M+H+-2H2O-CO2]+ 80 307 50 [M+H+-H2O-CO-CO2]+ 90 297 49 100 [M+H+-H2O-CO2-CH3OH]+ 94 293 35 [M+H+-2H2O-2CH3OH]+ 100 287 4 [M+H+-H2O-CO-CO2- CH3OH]+ 122 265 30 54 26 [M+H+-H2O-C7H8O2]+ 142 245 71 [M+H+-H2O-2CO-CO2-CH3OH]+ 150 237 12 [263-CO2]+ 168 219 33 [219-H2O]+ 186 201 15 [M+H+- C10H10O4]+ 194 193 70 [219-CH3OH]+ 210 177 15 [M+H+-C10H10O4-CO2]+ 238 149 15
Electronic Supplementary Material (ESI) for AnalystThis journal is © The Royal Society of Chemistry 2013

5
Figure S1 Figure S1. Enhanced product ion (MS/MS) spectra of [M+H]+ from synthetic diferulate Ac-Am and Di-Am
Electronic Supplementary Material (ESI) for AnalystThis journal is © The Royal Society of Chemistry 2013
6
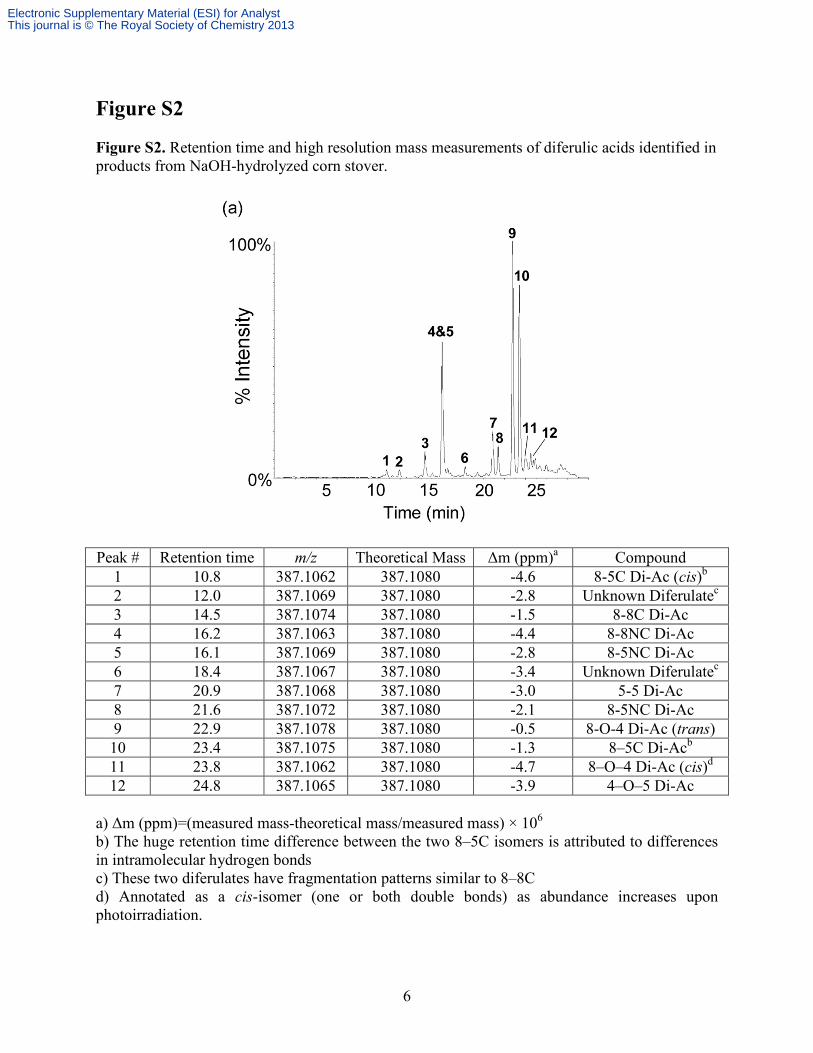
Figure S2 Figure S2. Retention time and high resolution mass measurements of diferulic acids identified in products from NaOH-hydrolyzed corn stover.
Peak # Retention time m/z Theoretical Mass Δm (ppm)a Compound 1 10.8 387.1062 387.1080 -4.6 8-5C Di-Ac (cis)b 2 12.0 387.1069 387.1080 -2.8 Unknown Diferulatec 3 14.5 387.1074 387.1080 -1.5 8-8C Di-Ac 4 16.2 387.1063 387.1080 -4.4 8-8NC Di-Ac 5 16.1 387.1069 387.1080 -2.8 8-5NC Di-Ac 6 18.4 387.1067 387.1080 -3.4 Unknown Diferulatec 7 20.9 387.1068 387.1080 -3.0 5-5 Di-Ac 8 21.6 387.1072 387.1080 -2.1 8-5NC Di-Ac 9 22.9 387.1078 387.1080 -0.5 8-O-4 Di-Ac (trans) 10 23.4 387.1075 387.1080 -1.3 8–5C Di-Acb 11 23.8 387.1062 387.1080 -4.7 8–O–4 Di-Ac (cis)d 12 24.8 387.1065 387.1080 -3.9 4–O–5 Di-Ac
a) Δm (ppm)=(measured mass-theoretical mass/measured mass) × 106
b) The huge retention time difference between the two 8–5C isomers is attributed to differences in intramolecular hydrogen bonds c) These two diferulates have fragmentation patterns similar to 8–8C d) Annotated as a cis-isomer (one or both double bonds) as abundance increases upon photoirradiation.
Electronic Supplementary Material (ESI) for AnalystThis journal is © The Royal Society of Chemistry 2013

7
Figure S3. CID MS/MS spectra of diferulic acids from NaOH-hydrolyzed corn stover. Labels 1-12 correspond to the peaks in Table S-2
Figure S3
Electronic Supplementary Material (ESI) for AnalystThis journal is © The Royal Society of Chemistry 2013
8
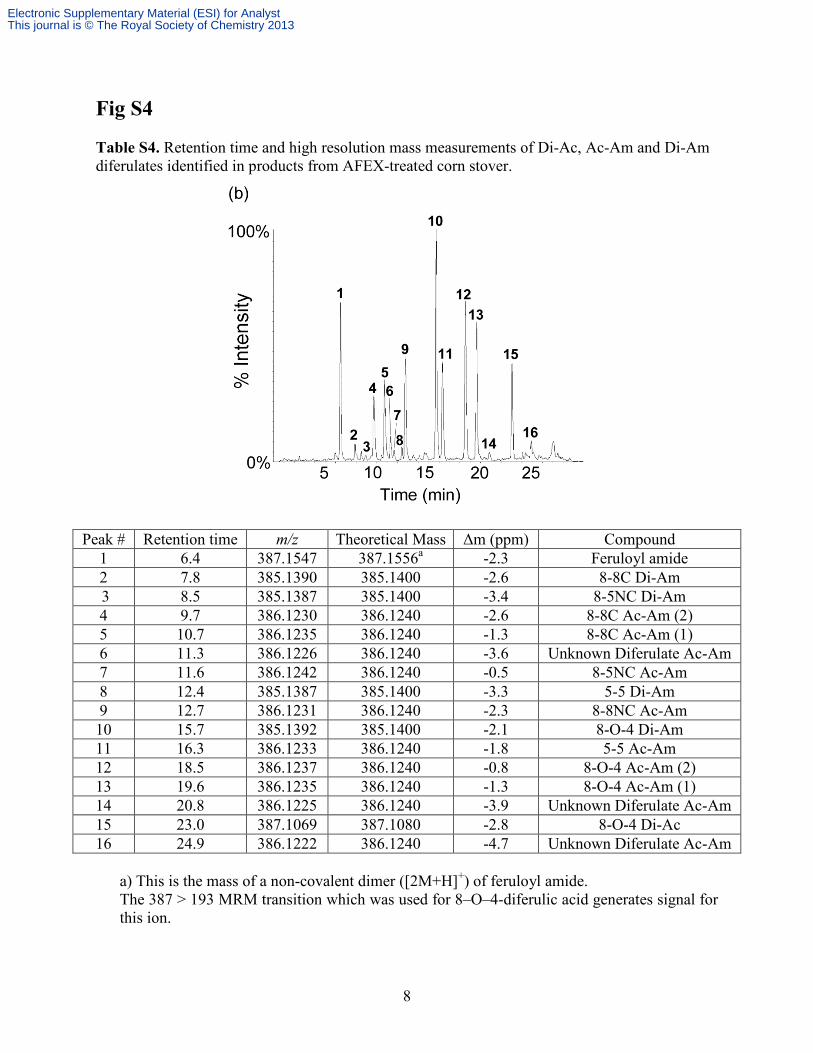
Fig S4 Table S4. Retention time and high resolution mass measurements of Di-Ac, Ac-Am and Di-Am diferulates identified in products from AFEX-treated corn stover.
Peak # Retention time m/z Theoretical Mass Δm (ppm) Compound 1 6.4 387.1547 387.1556a -2.3 Feruloyl amide 2 7.8 385.1390 385.1400 -2.6 8-8C Di-Am 3 8.5 385.1387 385.1400 -3.4 8-5NC Di-Am 4 9.7 386.1230 386.1240 -2.6 8-8C Ac-Am (2) 5 10.7 386.1235 386.1240 -1.3 8-8C Ac-Am (1) 6 11.3 386.1226 386.1240 -3.6 Unknown Diferulate Ac-Am 7 11.6 386.1242 386.1240 -0.5 8-5NC Ac-Am 8 12.4 385.1387 385.1400 -3.3 5-5 Di-Am 9 12.7 386.1231 386.1240 -2.3 8-8NC Ac-Am 10 15.7 385.1392 385.1400 -2.1 8-O-4 Di-Am 11 16.3 386.1233 386.1240 -1.8 5-5 Ac-Am 12 18.5 386.1237 386.1240 -0.8 8-O-4 Ac-Am (2) 13 19.6 386.1235 386.1240 -1.3 8-O-4 Ac-Am (1) 14 20.8 386.1225 386.1240 -3.9 Unknown Diferulate Ac-Am 15 23.0 387.1069 387.1080 -2.8 8-O-4 Di-Ac 16 24.9 386.1222 386.1240 -4.7 Unknown Diferulate Ac-Am
a) This is the mass of a non-covalent dimer ([2M+H]+) of feruloyl amide. The 387 > 193 MRM transition which was used for 8–O–4-diferulic acid generates signal for this ion.
Electronic Supplementary Material (ESI) for AnalystThis journal is © The Royal Society of Chemistry 2013

9
Figure S5 Figure S5. CID MS/MS spectra of Di-Ac, Ac-Am and Di-Am diferulates identified in products from AFEXTM-treated corn stover. Labels 1-16 correspond to the peaks in Table S3.
Electronic Supplementary Material (ESI) for AnalystThis journal is © The Royal Society of Chemistry 2013

10
Figure S5 (Continued)
Electronic Supplementary Material (ESI) for AnalystThis journal is © The Royal Society of Chemistry 2013

11
Figure S6 Figure S6. CID MS/MS spectra from [M-H]- of diferulic acid authentic standards using 20 eV collision energy
Electronic Supplementary Material (ESI) for AnalystThis journal is © The Royal Society of Chemistry 2013

12
Figure S7 Figure S7. CID spectra of diferulic acid authentic standards generated using (a) a hybrid linear ion trap (QTRAP 3200), (b) an orthogonal TOF instrument (LCT Premier) with nonselective CID, (c) a triple quadrupole (Quattro Premier XE) and (d) quadrupole/time-of-flight hybrid (QTOF Ultima API). MS/MS spectra are products of [M+H]+.
Electronic Supplementary Material (ESI) for AnalystThis journal is © The Royal Society of Chemistry 2013

13
Figure S8 Fig. S8. Extracted ion chromatograms for 5 MRM transitions from five authentic diferulic acid standards at equal concentrations (5 µM; 5 µL injection).
Peak # Diferulic acid isomer MRM transition in ESI positive mode
Relative response factor (relative to peak #1)
1 8–8C 387 > 297 1.00 2 8–8NC 387 > 245 1.76 3 5–5 387 > 319 2.37 4 8–O–4 387 > 193 2.47 5 8–5C 387 > 293 1.70
Electronic Supplementary Material (ESI) for AnalystThis journal is © The Royal Society of Chemistry 2013