supporting information for photochemistry with laser ... · pdf files1 supporting information...
TRANSCRIPT
S1
Supporting Information
for
Photochemistry with laser radiation in condensed
phase using miniaturized photoreactors
Elke Bremus-Köbberling1, Arnold Gillner1, Frank Avemaria2, Céline Réthoré2 and
Stefan Bräse*2,3
Address: 1Fraunhofer Institute for Laser Technology, Steinbachstrasse 15, D-52074
Aachen, Germany, 2Institute of Organic Chemistry, Karlsruhe Institute of Technology,
Fritz-Haber-Weg 6, D-76131 Karlsruhe, Germany and 3Institute of Toxicology and
Genetics, Karlsruhe Institute of Technology, Hermann-von-Helmholtz-Platz 1, D-
76344 Eggenstein-Leopoldshafen, Germany
Email: Stefan Bräse - [email protected]
* Corresponding author
Description of the flow reactor setup, kinetics, experimental
procedures and spectroscopic data of all compounds.
S2
General
NMR spectra were recorded on a Bruker AM 400, a Bruker Avance 300 or a Bruker DRX 500
spectrometer as solutions. Chemical shifts are expressed in parts per million (ppm, ) downfield from
tetramethylsilane (TMS) and are referenced to residual solvent peaks. All coupling constants (J) are
absolute values and J values are expressed in Hertz (Hz). The description of signals include s =
singlet, d = doublet, t = triplet, q = quartet, m = multiplet. The spectra were analyzed according to first
order. The signal structure in 13
C NMR was analyzed by DEPT and is described as follows: + =
primary or tertiary C-atom (positive signal), – = secondary C-atom (negative signal) and Cquart =
quaternary C-atom (no signal). – EIMS (electron impact mass spectrometry) was performed by using a
Finnigan MAT 90 (70 eV). In cases where no MS (EI) spectra could be measured due to the high
volatility of the compound, the GC–MS spectra were used for characterization. IR (infrared
spectroscopy) was recorded on a FT-IR Bruker alpha. Solvents, reagents and chemicals were
purchased from Aldrich, ABCR and Acros. All solvents, reagents and chemicals were used as
purchased unless stated otherwise.
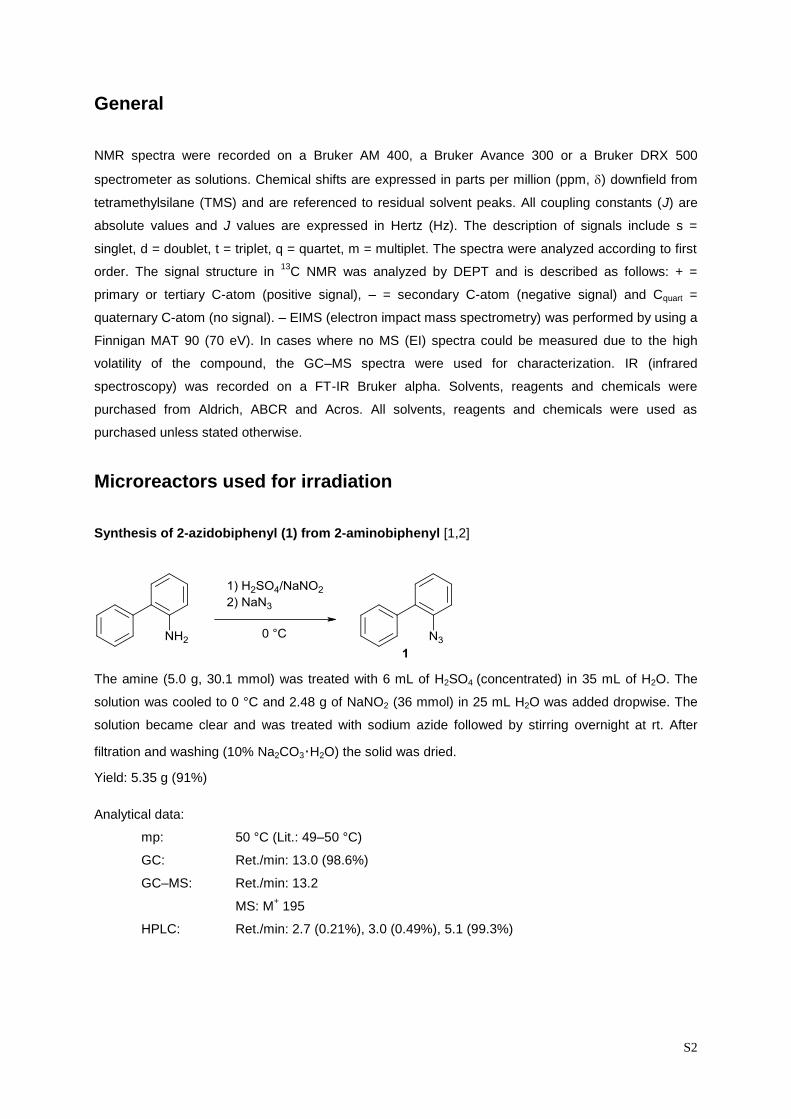
Microreactors used for irradiation
Synthesis of 2-azidobiphenyl (1) from 2-aminobiphenyl [1,2]
The amine (5.0 g, 30.1 mmol) was treated with 6 mL of H2SO4 (concentrated) in 35 mL of H2O. The
solution was cooled to 0 °C and 2.48 g of NaNO2 (36 mmol) in 25 mL H2O was added dropwise. The
solution became clear and was treated with sodium azide followed by stirring overnight at rt. After
filtration and washing (10% Na2CO3·H2O) the solid was dried.
Yield: 5.35 g (91%)
Analytical data:
mp: 50 °C (Lit.: 49–50 °C)
GC: Ret./min: 13.0 (98.6%)
GC–MS: Ret./min: 13.2
MS: M+ 195
HPLC: Ret./min: 2.7 (0.21%), 3.0 (0.49%), 5.1 (99.3%)

S3

S4
Photolysis of 2-azidobiphenyl in benzene [2]
2-Azidobiphenyl (1, 0.502 g, 2.58 mmol) was dissolved in 150 mL of degassed benzene under argon
(c = 1.73 × 10⁻²
M, Lit: 2.0 × 10⁻²
M). The reaction solution was heated to 20 °C (cryostat). The
photolysis was carried out under stirring and continuous irradiation (xenon lamp, 450 W, > 345 nm).
The pale yellow solution turned reddish–orange in 20 min and a weak gas evolution was observed.
The irradiation took place over 24 h. Samples (1 h, 2 h, 18 h, 24 h) were taken and the turnover was
determined by GC. The reaction solution was evaporated and dried over magnesium sulfate to give a
dark yellow oil.
Analytical data:
Sample after 1 h:
GC: Ret./min: 1.06 (14.81%), 1.14 (4.36%), 12.93 (70.81%), 14.94 (9.63%)
Ratio starting material:product: 7:1
Sample after 2 h:
GC: Ret./min: 1.07 (29.21%), 1.15 (8.49%), 12.92 (50.77%), 14.93 (10.85%)
Ratio starting material:product: 5:1
Sample after 18 h:
GC: Ret./min: 1.07 (13.63%), 1.15 (3.96%), 15.0 (39.65%), 15.00 (40.87%)
Ratio starting material:product: 1:1
Sample after 24 h:
GC: Ret./min: 1.05 (13.95%), 1.12 (4.06%), 12.92 (34.88%), 14.97 (45.33%)
Ratio starting material:product: 3:4
HPLC: Ret./min:
0.53 (2.69%), 1.58 (2.86%), 1.95 (1.56%), 2.91 (57.1%), 5.03 (34.2%)
Ratio starting material:product: 3:5

S5
Chromatographic separation of photolysis reactions. Eluent: 10% ether in hexane; Column:
35 mm × 500 mm silica gel 60. 1.8 liters of eluent was used, and the collected fractions (41, each ca.
50 mL) by TLC (eluent: 10% ether in hexane) were evaporated.
Fraction 5–9: yellow oil; 2-azobiphenyl:
GC: Ret./min: 13.25 (98.43%)
HPLC: Ret./min: 5.1 (99%)
Fraction 21–37: white crystals; carbazole):
GC: Ret./min: 1.30 (0.25%), 15.05 (99.75%)
HPLC: Ret./min: 3.00 (97.7%)
Elemental analysis:
Azide 1
Carbazole 2
Calcd. C 73.83 Calcd. C 88.88
H 4.65 H 2.49
N 21.52 N 8.64
Found C 73.62 Found C 86.28
H 4.02 H 5.83
N 21.07 N 8.26
Photolysis of 2-azidobiphenyl (1) in MeOH
Procedure, see above.
Analysis:
Starting material, azide
GC: Ret./min: 1.23 (0.2%), 11.39 (0.3%), 13.01 (98.3%), 13.84 (0.5%) 14.94 (0.6%)
Sample after 19 h:
GC: Ret./min: 1.29 (0.5%), 11.39 (0.2%), 12.26 (1.0%), 12.95 (45.5%), 15.00
(50.3%), 24.53 (2.1%)
Ratio starting material:product: 10:9
S6
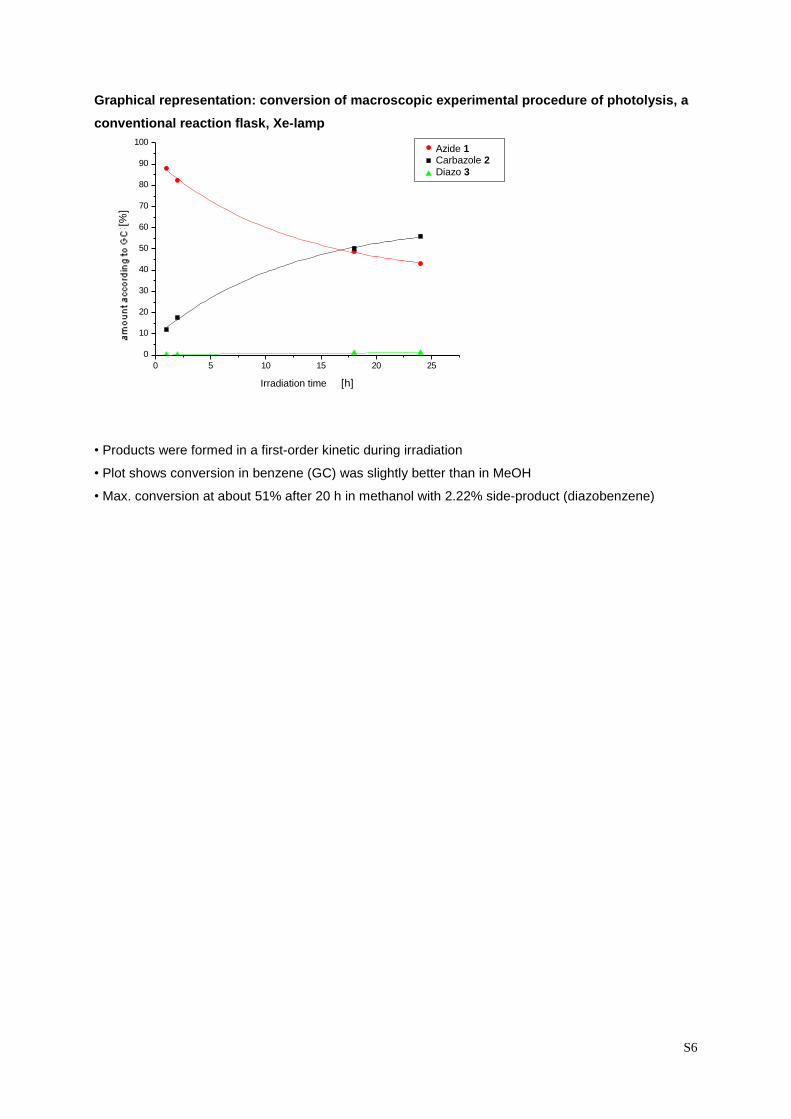
Graphical representation: conversion of macroscopic experimental procedure of photolysis, a
conventional reaction flask, Xe-lamp
0 5 10 15 20 25
0
10
20
30
40
50
60
70
80
90
100
Makroskopische Photolyse von Azidobiphenyl zum Carbazol
Xenonlampe, Kolben (Werte normiert)
Azid 3
Carbazol 4
Diazo 5
Geh
alt
navh
GC
[%
]
Bestrahlungszeit [h]
• Products were formed in a first-order kinetic during irradiation
• Plot shows conversion in benzene (GC) was slightly better than in MeOH
• Max. conversion at about 51% after 20 h in methanol with 2.22% side-product (diazobenzene)
Azide 1 Carbazole 2
Diazo 3
Irradiation time

S7
Exemplary GC in MeOH:
Starting material, azide 1
Sample after 19 h
S8
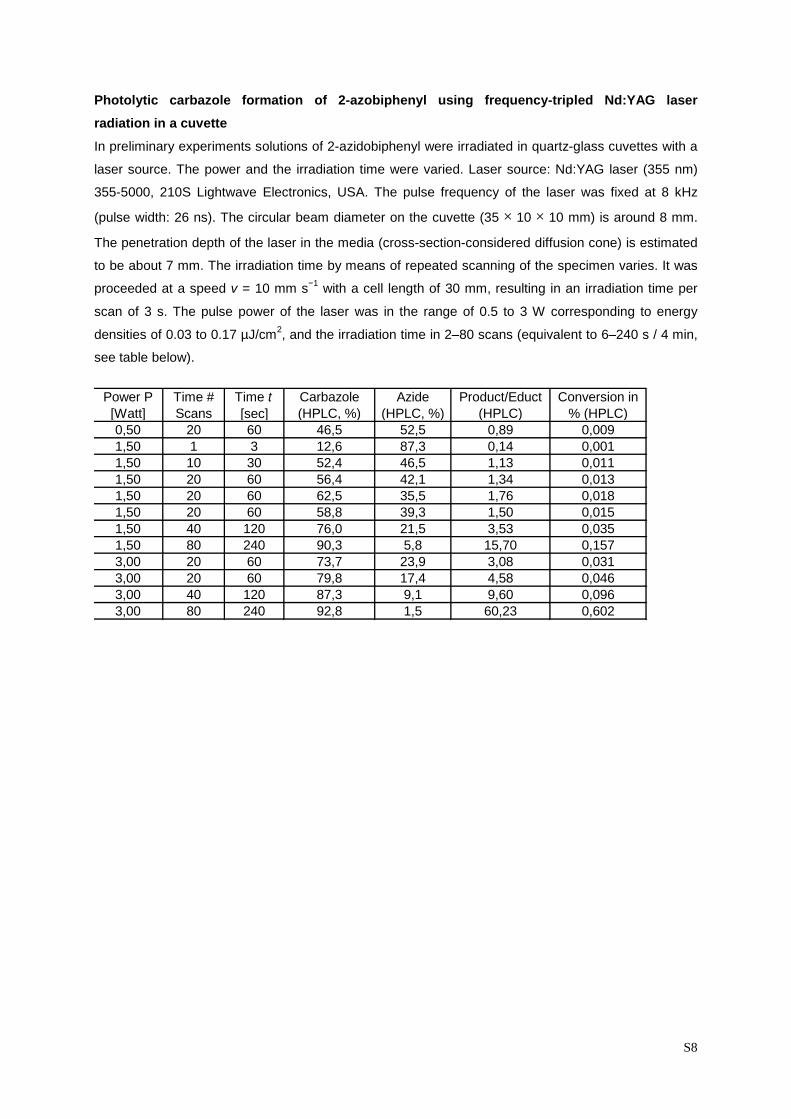
Photolytic carbazole formation of 2-azobiphenyl using frequency-tripled Nd:YAG laser
radiation in a cuvette
In preliminary experiments solutions of 2-azidobiphenyl were irradiated in quartz-glass cuvettes with a
laser source. The power and the irradiation time were varied. Laser source: Nd:YAG laser (355 nm)
355-5000, 210S Lightwave Electronics, USA. The pulse frequency of the laser was fixed at 8 kHz
(pulse width: 26 ns). The circular beam diameter on the cuvette (35 × 10 × 10 mm) is around 8 mm.
The penetration depth of the laser in the media (cross-section-considered diffusion cone) is estimated
to be about 7 mm. The irradiation time by means of repeated scanning of the specimen varies. It was
proceeded at a speed v = 10 mm s−1
with a cell length of 30 mm, resulting in an irradiation time per
scan of 3 s. The pulse power of the laser was in the range of 0.5 to 3 W corresponding to energy
densities of 0.03 to 0.17 µJ/cm2, and the irradiation time in 2–80 scans (equivalent to 6–240 s / 4 min,
see table below).
Power P
[Watt]
Time #
Scans
Time t
[sec]
Carbazole
(HPLC, %)
Azide
(HPLC, %)
Product/Educt
(HPLC)
Conversion in
% (HPLC)
0,50 20 60 46,5 52,5 0,89 0,009
1,50 1 3 12,6 87,3 0,14 0,001
1,50 10 30 52,4 46,5 1,13 0,011
1,50 20 60 56,4 42,1 1,34 0,013
1,50 20 60 62,5 35,5 1,76 0,018
1,50 20 60 58,8 39,3 1,50 0,015
1,50 40 120 76,0 21,5 3,53 0,035
1,50 80 240 90,3 5,8 15,70 0,157
3,00 20 60 73,7 23,9 3,08 0,031
3,00 20 60 79,8 17,4 4,58 0,046
3,00 40 120 87,3 9,1 9,60 0,096
3,00 80 240 92,8 1,5 60,23 0,602

S9
Graphical representation: Conversion of the photolysis laser radiation (355 nm) in a cuvette
0 50 100 150 200 250
0
20
40
60
80
100
Photolyse von Azidobiphenyl zum Carbazol in Küvetten
konstante Leistung 1,5W, variable Zeit
Carbazol 4
Azid 3
Diazo 5
Geh
alt
nach
HPLC
[%
]
Bestrahlungszeit [s]
• Products of the exponential growth with time
• Max. turnover at about 90% after 4 min in methanol with 0.95% side-product (diazobenzene)
• Conversion of 52% and 0.57% side product (diazobenzene, after 30 s)
.
Carbazole 2 Azide 1 Diazo 3
Irradiation time

S10
Exemplary HPLC
S11
Photolytic carbazole formation of 2-azobiphenyl using frequency-tripled Nd:YAG laser
radiation in a continuously operating microreactor (PTFE)
In miniaturized reactors of type II (see Figure 1, 3 and 4 of the manuscript, dimension of the reactor
chamber 3 × 5 mm, 35 L volume) was added a solution of 2-azidobiphenyl continuously fed with a
syringe pump under continuous irradiation with a Nd:YAG laser (355 nm irradiated). At a constant flow
of 26 mL/h, the laser pulse power was varied from 0.16 to 1.28 W corresponding to energy densities
between 0.02 and 0.17 µJ/cm2. Furthermore, at a constant power of 0.92 W or 0.12 µJ/cm
2, the flow
rate (10 to 100 mL/h) and therefore the dwell time (exposure time) in the reactor were varied. The yield
was determined by HPLC.
HPLC determination of conversion by the photolysis laser radiation (355 nm, constant flow rate
26 mL/h, power variable) in the continuously operated microreactor (PTFE)
Pulse power [W] Carbazole Azide
0.16 25.23 73.57
0.32 29.91 68.78
0.48 38.13 60.29
0.68 45.59 52.61
0.92 55.28 42.44
1.28 70.80 26.68
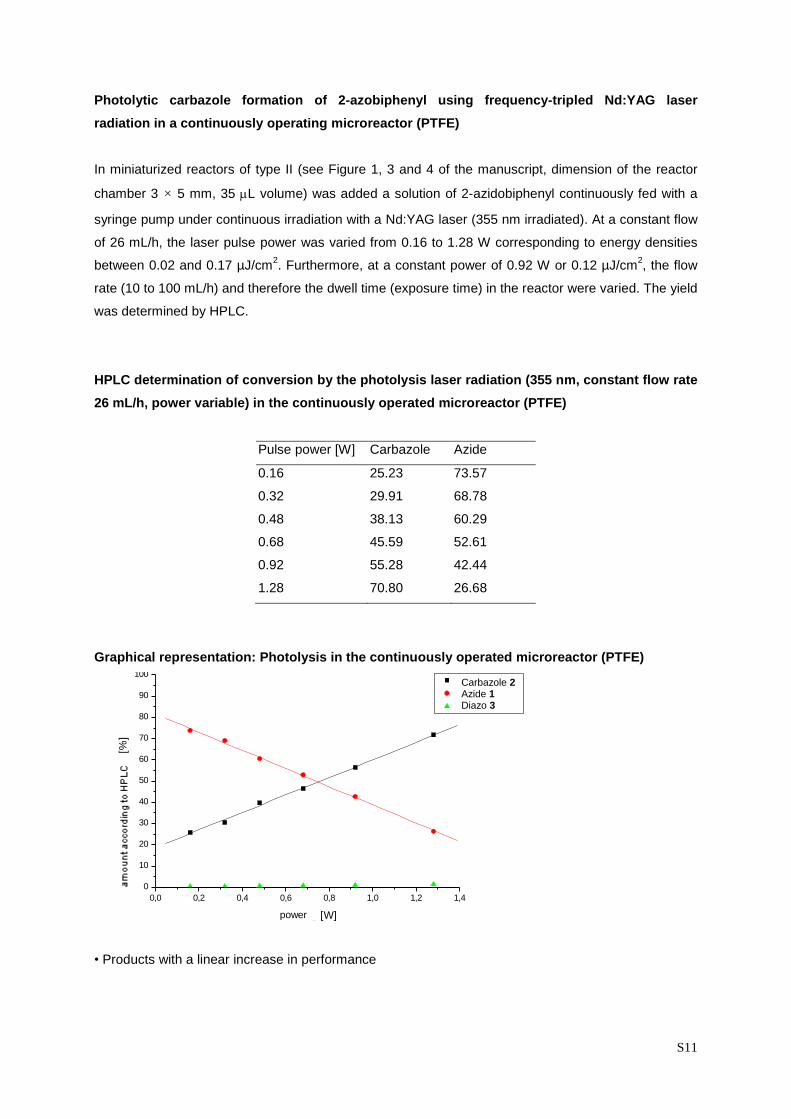
Graphical representation: Photolysis in the continuously operated microreactor (PTFE)
0,0 0,2 0,4 0,6 0,8 1,0 1,2 1,4
0
10
20
30
40
50
60
70
80
90
100
Photolyse von Azidobiphenyl zum Carbazol in Reaktor Typ B, kontinuierlich
PTFE, variable Leistung, konstanter Durchfluss 26 ml/h
Carbazol 4
Azid 3
Diazo 5
Geh
alt
nach
HPLC
[%
]
Leistung [W]
• Products with a linear increase in performance
Carbazole 2 Azide 1 Diazo 3
power
S12
HPLC determination of conversion by the photolysis laser radiation (355 nm, 0.92 W constant
power, variable flow rate) in the continuously operated microreactor (PTFE)
Carbazole
[%, HPLC]
Azide
[%, HPLC]
Time [s] Flow [mL/h]
77.53 19.32 12.3 10
53.25 44.53 4.73 26
45.86 52.31 3.07 40
38.69 59.70 2.46 50
38.90 59.50 2.05 60
33.00 65.57 1.76 70
31.59 67.02 1.54 80
30.46 68.19 1.37 90
28.73 69.98 1.23 100
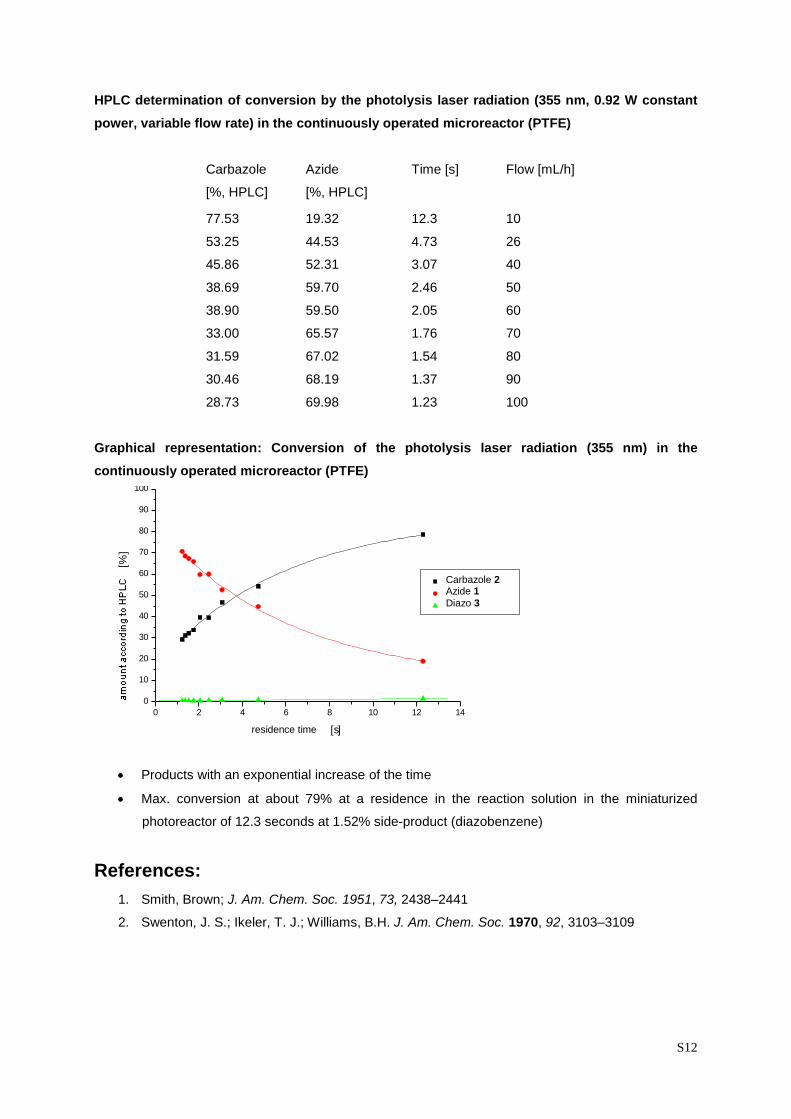
Graphical representation: Conversion of the photolysis laser radiation (355 nm) in the
continuously operated microreactor (PTFE)
0 2 4 6 8 10 12 14
0
10
20
30
40
50
60
70
80
90
100
Photolyse von Azidobiphenyl zum Carbazol in Reaktor Typ B, kontinuierlich
PTFE, konstante Leistung 0,92 W, variable Verweilzeit (MP20)
Carbazol 4
Azid 3
Diazo 5
Geh
alt
nach
HPLC
[%
]
Verweilzeit [s]
Products with an exponential increase of the time
Max. conversion at about 79% at a residence in the reaction solution in the miniaturized
photoreactor of 12.3 seconds at 1.52% side-product (diazobenzene)
References:
1. Smith, Brown; J. Am. Chem. Soc. 1951, 73, 2438–2441
2. Swenton, J. S.; Ikeler, T. J.; Williams, B.H. J. Am. Chem. Soc. 1970, 92, 3103–3109
Carbazole 2 Azide 1
Diazo 3
residence time