supporting information effect of intercalator and lewis ... · was bubbled in a phenylboronic acid...
TRANSCRIPT

S1
Supporting Information
Effect of Intercalator and Lewis Acid-base Branched Peptide Complex Formation: Boosting Affinity Towards HIV-1 RRE RNA
Jessica E. Wynn,a Wenyu Zhang,a Denis M. Tebit,b Laurie R. Gray,b Marie-Louise Hammarskjold,b David Rekosh,b and Webster L. Santos*,a
a Department of Chemistry, Virginia Tech Center for Drug Discovery, Blacksburg, VA 24061 bDepartment of Microbiology, University of Virginia, Charlottesville, VA 22904
*Email: [email protected], phone: (540) 231-5742
Contents
1. Synthesis of Branched Peptide Library…………………………………………...……S2
2. On-bead Screening Assay……………………………………………………..…………S2
3. Peptide Synthesis, Purification and Characterization…………………………………S3
4. Preparation of 32P-labeled RNA…………………………………………………………S4
5. Electrophoretic Mobility Shift Assays (EMSA) …………………………………..……S4
6. Cell Viability Assays (MTT) ………………………………………………………….…S5
7. Viral replication assays…………………………………………………………………..S5
8. Nuclease Protection Assays………………………………………………………………S5
9. Bead images for determining the optimal filter settings………………….……………S6
10. Isolated hit beads ………………………………………………………………………...S6
11. Synthesis of 3.3.4 BP Library………………….……………………………………...…S7
12. Structure of RREIIB ……………………………………………………...………..……S7
13. HPLC conditions, purity, and identification of BPs by MALDI/MS…………......…. S8
14. EMSAs and Kd plots of BPs against RRE IIB……..…………….….……..…….…..... S22
15. RRE IIB structure, p24 Inhibition and MTT Assays……….………………….…..… S29
16. Stoichiometry of Acridine BP:RRE IIB Complexes (Job Plots).……………...……....S31
17. References…………………………………………………..………………….….….….S32
Electronic Supplementary Material (ESI) for MedChemComm.This journal is © The Royal Society of Chemistry 2016
S2
Synthesis of Branched Peptide Library
We used standard solid phase peptide synthesis techniques to generate the 3.3.4 library via the split and pool method using the previously described procedure.1 N-α-Fmoc protected L-amino acids (Novabiochem), PyOxim (Novabiochem) and N,N-Diisopropylethylamine (DIEA, Aldrich) were used in coupling reactions. The synthesis and full characterization of
Fmoc-N--(4-boronobenzoyl)-L-lysine (KBBA) will be described elsewhere. Fmoc-N--(9-aminoacridinyl)-L-lysine (KACR) and Fmoc-ANP-OH were synthesized as previously reported.2 Three copies of library were prepared simultaneously by using a three-fold excess of Tentagel Macrobead-NH2 resin (0.19 g, 0.05 mmol/g, Peptides International). The resin was swollen in DCM (20 mL, 2 x 15 min) followed by DMF (20 mL, 15 min). The photocleavable linker Fmoc-ANP-OH (58 mg, 0.14 mmol) was first coupled to the resin in DMF for 3 hr in the presence of
PyOxim (70 mg, 0.14 mmol) and DIEA (47 L, 0.27 mmol). After coupling, the resin was washed with DMF (20 mL, 1 min), DCM (20 mL, 1 min) and DMF (20 mL, 1 min). The same washing procedure was applied after every step. Then, 20% piperidine in DMF (20 mL, 2 x 10 min) was used for Fmoc deprotection. A Kaiser test was used after each coupling and deprotection step to confirm reaction completion. N-Fmoc amino acids (3 eq.), PyOxim (3 eq.), and DIEA (6 eq.) were added to each reaction vessels in DMF and coupled for 30 min. Fmoc-Lys(Fmoc)-OH was used as a branching unit, and molar equivalencies of reagents were doubled in coupling reactions after installation of the branching unit. After Fmoc deprotection of the N-terminal amino acids, the resin was bubbled in a phenylboronic acid solution (0.2 g/mL) overnight to remove the pinacol groups of boron-containing side chains. Finally, the resin was treated with 95:2.5:2.5 TFA (Trifluoroacetic acid, Acros)/H2O/TIS (Triisopropylsilane, Acros) (v/v/v) for 3 hr. After deprotection, the resin was
washed extensively with DMF, DCM, and MeOH before drying and storing at -20 C.
On-bead Screening Assay
DY547 labeled HIV-1 RRE-IIB RNA (5′-DY547-GGCUGGUAUGGGCGCAGCGUCAAUGACGCUGACGGUACAGGCCAGCC-3′) was purchased from Dharmacon and prepared according to the manufacturer’s protocol. To account for the autofluorescence of Tentagel Macrobead-NH2 resins, control peptide (LLK)2*KBBAKACRLY was incubated in 100 nM DY547 labeled HIV-1 RRE-IIB RNA for 1 hr in phosphate buffer (10 mM potassium phosphate, 100 mM KCl, 1 mM MgCl2, 20 mM NaCl, pH 7.0). These beads were washed extensively and placed into a sterile 96-well plate (Nunc) and imaged by both a Zeiss Axiovert 200 fluorescent microscope under a rhodamine filter and a Zeiss LSM 510 microscope set to longpass 585. The fluorescence intensity of these RNA-incubated beads was compared with the auto-fluorescence of unincubated control branched peptide beads, and the detector sensitivity was adjusted for removal of auto-fluorescence. Adjusting the fluorescence intensity to a minimum setting did not eliminate the auto-fluorescence of the untreated beads; however, the fluorescence emission of control resins was intense enough to discriminate them from untreated beads. Screening conditions were initially tested using approximately 500 beads from the library. The beads were placed into a 1.5 mL non-stick microfuge tube (Fisher) with a 200 µL final volume of phosphate buffer and mixed

S3
by a Barnstead/Thermolyne Labquake rotisserie shaker. The beads were first treated with 1 mg/mL bovine serum albumin (BSA) (New England BioLabs) and 6.25 mg/mL tRNA (Roche) (~5,000-fold molar excess to RRE-IIB RNA) for 4 hr at rt to block nonspecific binding interactions of the peptide sequences. Then, the beads were washed 5 times with phosphate buffer and incubated in 200 µL of
50 nM DY547 labeled RRE-IIB RNA in phosphate buffer for 3 hr at 4 C. After the final incubation, the beads were extensively washed with buffer and then imaged under both a confocal microscope and a fluorescence microscope in a 96-well plate using the previously optimized settings. The initial screening afforded 4 hits which were isolated, rinsed with DMF (5 x 500 µL) and MeOH (5 x 500 µL), and photocleaved in clear non-stick 0.5 mL microfuge tubes in 15 µL of 1:1 MeOH: H2O (v/v) by irradiation at 365 nm with a 4W handheld UV lamp for 1 hr. The supernatant was retained and subjected to MALDI-TOF analysis. The remaining beads of the 3.3.4 library were divided for subsequent screening, in which each batch contained 50 mg of beads. Each batch was screened using more stringent conditions in an attempt to reduce the total number of hit beads. First the beads were blocked at rt for 4 hr in phosphate buffer with 1 mg/mL BSA, and 12.5 mg/mL tRNA (10,000-fold molar excess to RRE stem IIB RNA). Next, the beads were washed in buffer and incubated with 50 nM DY547 labeled RRE-IIB RNA in phosphate buffer for 3 hr at rt. The resins were washed extensively after the final incubation prior to screening. Hit resins were isolated, photocleaved and sequenced using MALDI-TOF MS.
Peptide Synthesis, Purification and Characterization
Synthesis of the branched peptides was achieved by solid phase peptide synthesis using N--Fmoc protected L-amino acids (Novabiochem) (3 eq.), Pyoxim (Novabiochem) (3 eq.) in DMF as coupling reagent, and DIEA (Aldrich) (6 eq.) on Rink amide MBHA resin (100-200 mesh) (Novabiochem) with 0.4 mmol/g loading. The Fmoc group was deprotected with 20% piperidine in DMF. Fmoc-Lys(Fmoc)-OH was used as a branching unit, and molar equivalencies of reagents were doubled in coupling reactions after installation of the branching unit. The solid phase synthesis was done on a vacuum manifold (Qiagen) outfitted with 3-way Luer lock stopcocks (Sigma) in either Poly-Prep columns or Econo-Pac polypropylene columns (Bio-Rad). The resin was mixed in solution by bubbling argon during all coupling and washing steps. After Fmoc deprotection of the N-terminal amino acids, the resin was bubbled in a phenylboronic acid solution (0.2 g/mL) overnight to remove the pinacol groups of boron-containing side chains. Finally, the resin was treated with 95:2.5:2.5 TFA (Trifluoroacetic acid, Acros)/H2O/TIS (Triisopropylsilane, Acros) (v/v/v) for 3 hr. The supernatant was dried under reduced pressure, and the crude peptide was triturated from cold diethyl ether. The peptides were purified using a Jupiter 4 µm Proteo 90 Å semiprep column (Phenomenex) using a solvent gradient composed of 0.1% TFA in Milli-Q water and HPLC grade acetonitrile. Peptide purity was determined using a Jupiter 4 µm Proteo 90 Å analytical column (Phenomenex), and peptide identity was confirmed by MALDI-TOF analysis. Non-acridine containing peptide concentrations were measured in nuclease free water at 280 nm using their calculated extinction coefficients. Acridine containing peptide concentrations were monitored at 412 nm using the extinction coefficient of acridine at 13,200 mol-1 cm-1 in nuclease free water.

S4
Preparation of 32P-labeled RNA
Wild-type RRE-IIB RNA was transcribed in vitro by T7 polymerase with the Ribomax T7 Express System (Promega) using previously reported techniques.3 The antisense template, sense complementary strand (5'-ATGTAATACGACTCACTATAGG-3') and RRE-IIB reverse PCR primer (5'-GGCTGGCCTGTAC-3') were purchased from Integrated DNA Technologies. The antisense template for HIV-1 RRE-IIB Wild Type RNA that was used is as follows: 5'-GGCTGGCCTGTACCGTCAGCGTCATTGACGCTGCGCCCATACCAGCCCTATAGTGAGTCGTATTACAT-3'. HIV-1 RRE-IIB Wild Type was PCR amplified using HotstarTaq DNA polymerase (Qiagen) followed by a clean-up procedure using a spin column kit (Qiagen). T7
transcription proceeded at 42 C for 1.5 hr. After transcription, DNA templates were degraded with DNase at 37 C for 45 min and the RNA was purified by a 12% polyacrylamide gel containing 7.5 M urea. The band corresponding to the RNA of interest was excised from the gel and eluted overnight
in 1x TBE buffer at 4 C. The sample was desalted using a Sep-Pak syringe cartridge (Waters Corporation), lyophilized, and dephosphorylated with calf intestinal phosphatase (CIP) in NEBuffer 3 (New England Biolabs) according to manufacturer’s protocol. The product was recovered by a standard phenol extraction followed by ethanol precipitation. Purified RNA was stored as a pellet at
-80 C. HIV-1 RRE-IIB RNA was labeled at the 5’-end by treating 10 pmol of dephosphorylated RNA with 20 pmol of [γ-32P] ATP (111 TBq mol-1) and 20 units of T4 polynucleotide kinase in 70
mM Tris•HCl, 10 mM MgCl2, and 5 mM dithiothreitol, pH 7.6. The mixture was incubated at 37 C for 30 min, and then at rt for 20 min. The kinase was heat-inactivated at 65 C for 10 min. The RNA was recovered by ethanol precipitation, and the purity was examined using 12% denaturing PAGE followed by autoradiography Electrophoretic Mobility Shift Assays (EMSA)
EMSAs were used to determine dissociation constants of branched peptides towards RRE-IIB RNA. 4 nM 32P-labeled RNA in 2x phosphate buffer (20 mM potassium phosphate, 200 mM KCl, 1mM
MgCl2, 40 mM NaCl, pH 7.0) was refolded by heating at 95 C for 3 min and cooled at room temperature for 20 min. A 10 µL solution of the refolded RNA was added to 10 µL of peptide in nuclease free water and incubated at room temperature for 4 hr. The final concentration of peptide was varied from 0.001 to 10 µM. After incubation, 3 µL of 30% glycerol was added for loading. Peptide:RNA complexes were resolved on 10% non-denaturing PAGE, which had been pre-run for
at least 1 hr at 400V at 4 C. Gels were electrophoresed at 400 V for 20 min at 4 C. Gels were dried to filter paper and visualized by audioradiography using a storage phosphor screen (GE Healthcare) and a Typhoon Trio phosphorimager (GE Healthcare). Densitometry measurements were quantified using ImageQuant TL (Amersham Biosciences). Binding curves were generated using a four parameter logistic equation with Kaleidagraph (Synergy Software): y = m1+(m2-m1)/(1+10^(log(m3)-x); m1 = 100; m2 = 1; m3 = .000003, where y = percentage of RNA binding, x = log[peptide], m1 = percentage of RNA binding affinity at infinite concentration (nonspecific binding), m2 = percentage of RNA binding affinity at zero concentration, m3 = peptide
S5
concentration at 50% binding (Kd). Each experiment was performed in triplicate and error bars represent the standard deviation calculated over three replicates. Cell Viability Assays (MTT) MTT assays were performed using the CellTiter 96® Non-Radioactive Cell Proliferation Assay System (Promega). U87 CXCR4 cells were seeded in a 96-well flat bottom plate at 1 x 10⁴ cells per well (90 µL) and incubated at 37 °C in a 5% CO2 overnight. The cells were then treated with the appropriate concentration (100, 50 or 10 µM, final per well) of each compound. Wells containing cells and media only were used as controls. After a twenty-four hour incubation at 37 °C in a 5% CO2, 15 µL of the Dye Solution (containing tetrazolium salt) was added to each well and incubated for four hours, at 37 °C with 5%CO2. After the incubation, 100 µL of the Solubilization Solution/Stop Mix was added to each well and incubated for one hour. The wells were mixed gently with a multi-channel pippetor and the plates were read at an absorbance of 570 nm using a microplate reader (Synergy 2, BioTec). The readings were then normalized and plotted using a value of 1.0 for the control cells. Viral replication assays Compounds to be tested were resuspended in distilled water to a concentration of 1 mM. The control drug, Lamivudine (3TC), was obtained from the AIDS Research and Reference Reagent Program and initially diluted in dimethyl sulfoxide (DMSO) to 1 mM. All control compounds and experimental compounds were further diluted in RPMI to the appropriate working concentrations and tested against the reference HIV viral strain NL4-3, which uses the CXCR4 co-receptor. Sensitivity to inhibitors/compounds of HIV-1 replication was determined by infecting U87-CD4/CXCR4 cells with NL4-3 following a previously published procedure.4 Briefly, cells were added to 96-well flat bottom plates at a density of 1 x 10⁴ cells/well and allowed to adhere overnight.
On the next day, cells were treated with the test compounds at desired concentrations (10M - 100M) or control 3TC (1pM -10 M) for 1 hour prior to infection. Cells were then exposed to virus at an MOI of 0.01 infectious units/ml (IU/ml) for 24 h, after which they were washed with phosphate-buffered saline (PBS), and fresh medium containing additional compound was added. The culture was then left to grow for 4 days and supernatant aliquots were taken at intervals from days 2 to 4. Virus production was quantified by p24 assay.5 The data shown is measured at 72 hrs after infection. Nuclease Protection Assays
RNA was first refolded by heating a solution of 5’-32P-labeled RRE-IIB (10 nM) and excess
unlabeled RRE-IIB (200 nM) at 95 C for 3 min and then snap cooling on ice. The refolded RNA was incubated on ice for 4 hr in a solution containing the BPBAs and buffer composed of 10 mM Tris, pH 7, 100 mM KCl, and 10 mM MgCl2. RNase (Ambion) was then added to the solution, which was further incubated on ice for 10 min (0.002 Units RNase V1), or 1 hr (1 Unit RNase T1; 20
S6
ng RNase A). Inactivation/precipitation buffer (Ambion) was added to halt digestion, and the RNA was pelleted by centrifugation at 3,200 rpm for 15 min. Pelleted RNA was redissolved into tracking dye and run through a 12 % PAGE containing 7.5 M urea and imaged by autoradiography.
Bead Images for Determining Optimal Settings with Positive Control and Isolated
Hit Beads
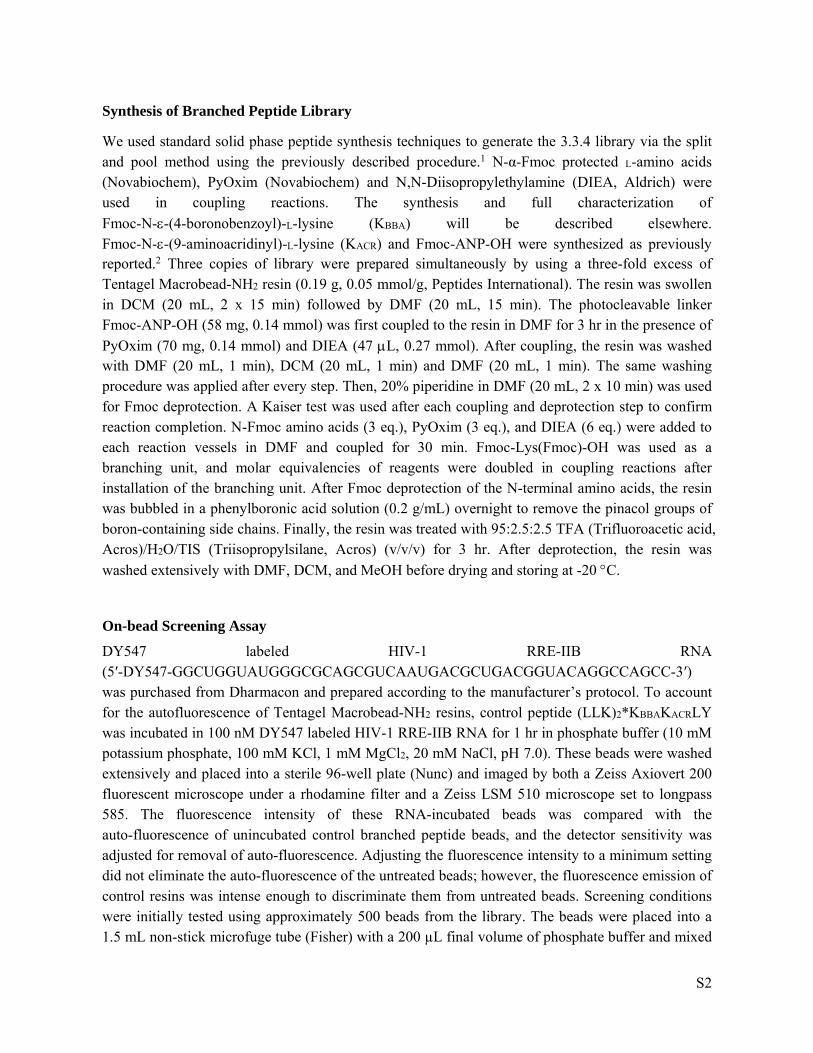
SI.1. (A) Positive control peptide (LLK)2*KBBAKACRLY and (B) Branched peptide library with 100 nM RRE incubated in phosphate buffer for 1 hr, washed, and visualized under confocal microscope (left), and overlap of confocal microscopy with transmitted light (right).
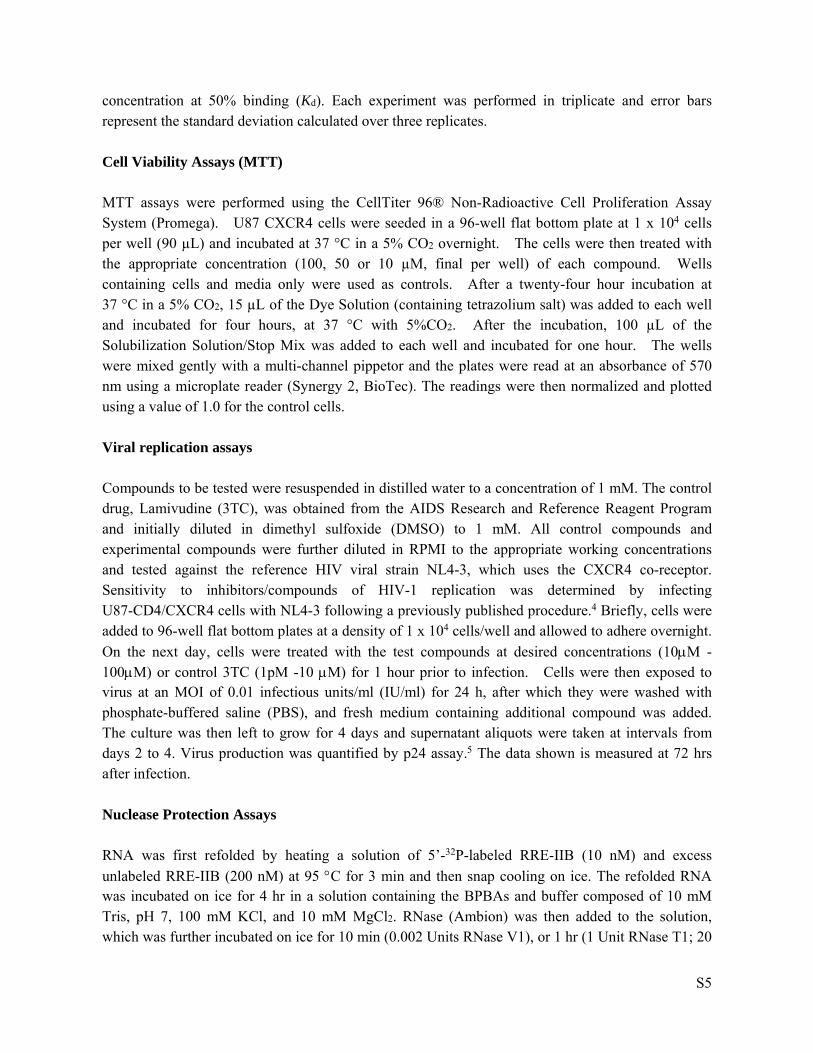
SI.2. (A) Fluorescence image of incubated library, with an arrow indicating a possible hit. (B) Examples of images of hits isolated from the library obtained via fluorescent microscopy (top) and confocal microscopy (bottom).
S7
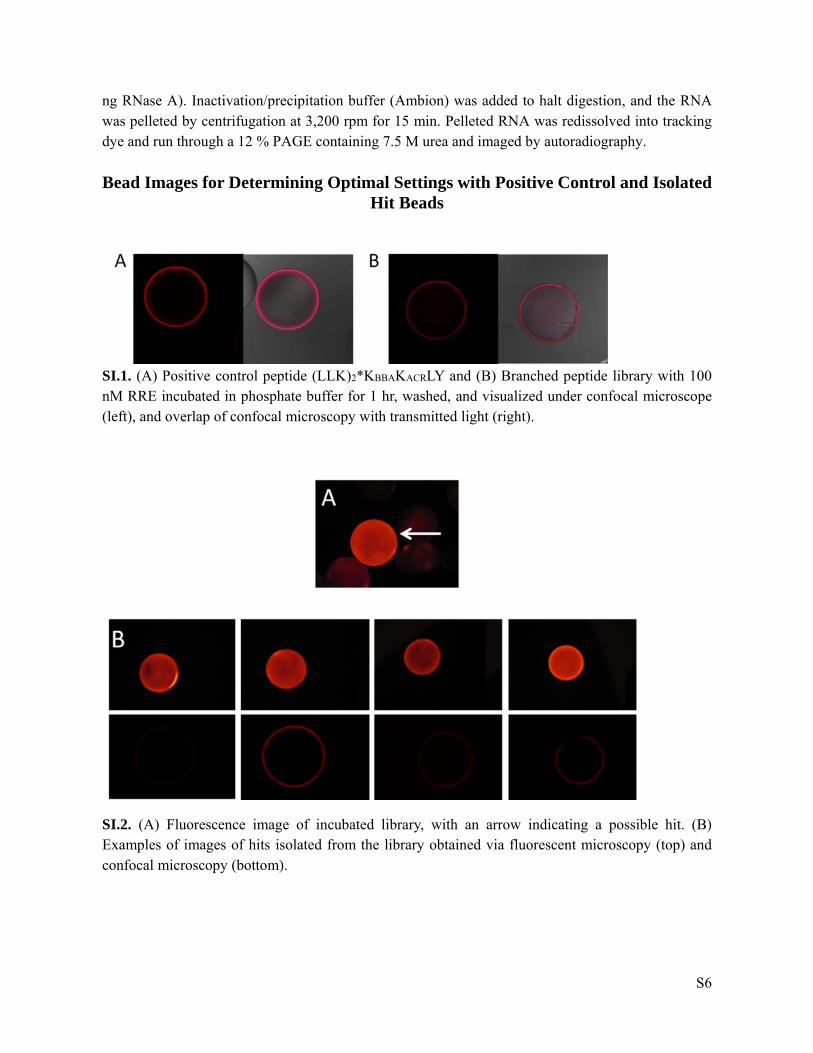
SI.3. Synthesis of 3.3.4 branched peptide library. p = 3-amino-3-(2-nitro-phenyl)propionic acid, the ANP photocleavable linker.

S8
Branched Peptide HPLC Conditions, Purity, and Identification by MALDI/MS HPLC Solvent A: 0.1% TFA in Milli-Q water, Solvent B: HPLC grade acetonitrile. Peptide purity was determined using a Jupiter 4 µm Proteo 90 Å analytical column (Phenomenex), and peptide identity was confirmed by MALDI-TOF analysis (AB Sciex 4800) using DHB as the matrix. A1: (KKK)2*LKBBAKBBAY Molecular Formula: C83H141B2N21O18 HPLC spectrum: Purity (94%) was determined by analytical HPLC employing a linear gradient of 12%-25% B in A in 30 min at a flow rate of 0.2 mL/min following a wash procedure. MALDI-TOF spectrum: Calcd for [C97H146B2N21O22]+, Predicted Mass [M-DHB + H]+: 1980.0, Mass Detected: 1980.0.
900 1220 1540 1860 2180
Mass (m/z)
0
10
20
30
40
50
60
70
80
90
100
% In
tens
ity
1980
.005
0
1981
.979
5
1990
.953
1
1512
.872
4
S9
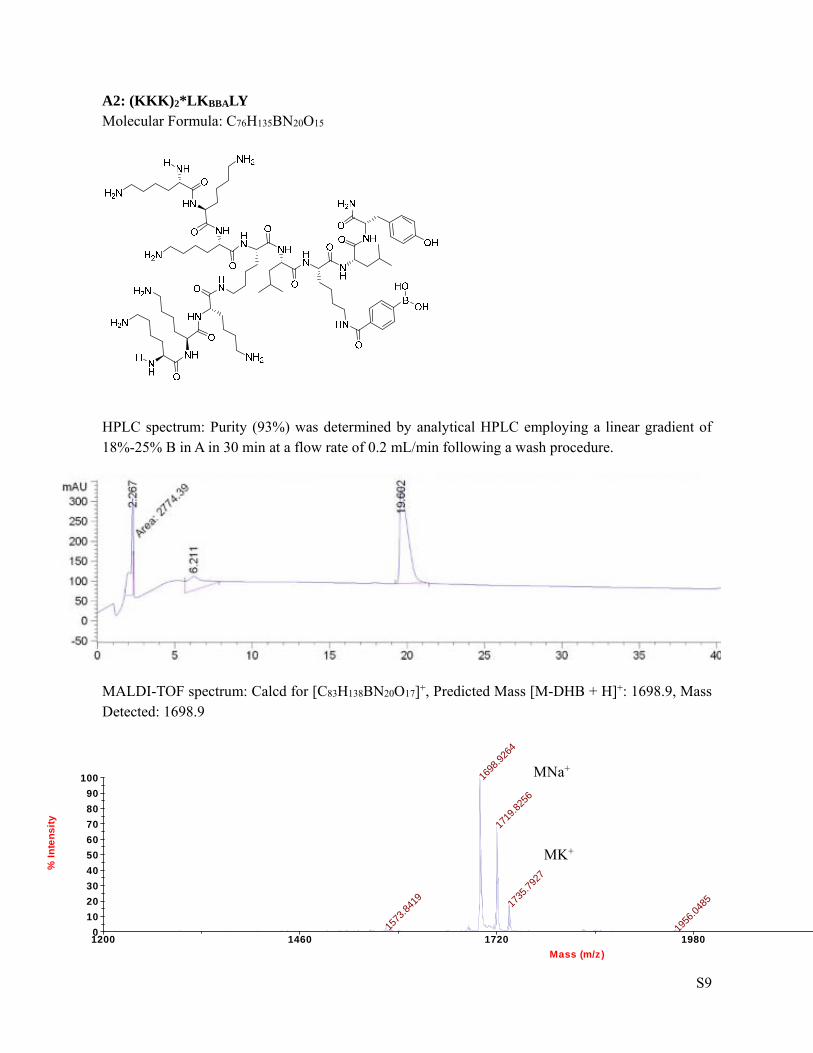
A2: (KKK)2*LKBBALY Molecular Formula: C76H135BN20O15
HPLC spectrum: Purity (93%) was determined by analytical HPLC employing a linear gradient of 18%-25% B in A in 30 min at a flow rate of 0.2 mL/min following a wash procedure.
MALDI-TOF spectrum: Calcd for [C83H138BN20O17]+, Predicted Mass [M-DHB + H]+: 1698.9, Mass Detected: 1698.9
1200 1460 1720 1980
Mass (m/z)
0
10
20
30
40
50
60
70
80
90
100
% I
nte
ns
ity
1698
.926
4
1719
.825
6
1735
.792
7
1573
.841
9
1956
.048
5
MNa+
MK+

S10
A3: (KKK)2*KACRLKY Molecular Formula: C82H138N22O12
HPLC spectrum: Purity (98%) was determined by analytical HPLC employing a linear gradient of 8%-28% B in A in 30 min at a flow rate of 0.2 mL/min following a wash procedure.
MALDI-TOF spectrum: Calcd for [C82H139N22O12]+, Predicted Mass [M + H]+: 1625.2, Mass Detected: 1625.1
900 1220 1540 1860
Mass (m/z)
0
10
20
30
40
50
60
70
80
90
100
% In
tens
ity
1625
.141
0
1627
.055
4
1447
.004
5
1802
.191
9
1632
.226
0

S11
A4: (KKK)2*KLKACRY Molecular Formula: C82H138N22O12
HPLC spectrum: Purity (96%) was determined by analytical HPLC employing a linear gradient of 10%-30% B in A in 30 min at a flow rate of 0.2 mL/min following a wash procedure.
MALDI-TOF spectrum: Calcd for [C82H139N22O12]+, Predicted Mass [M + H]+: 1625.2, Mass Detected: 1625.2
900 1220 1540 1860
Mass (m/z)
0
10
20
30
40
50
60
70
80
90
100
% In
tens
ity
1625
.236
2
1627
.270
1
1630
.398
9
1346
.846
3
1802
.198
6
N
H
HN
O
NH2
NH
OH2N
HN
O
NH2
HNH2N
HO
NH2
HN
O
NH2
NH
O
NH2
HN
O
HN
NH
O
NH2
HN
O
NH
O
HN
HN
O
OH
S12
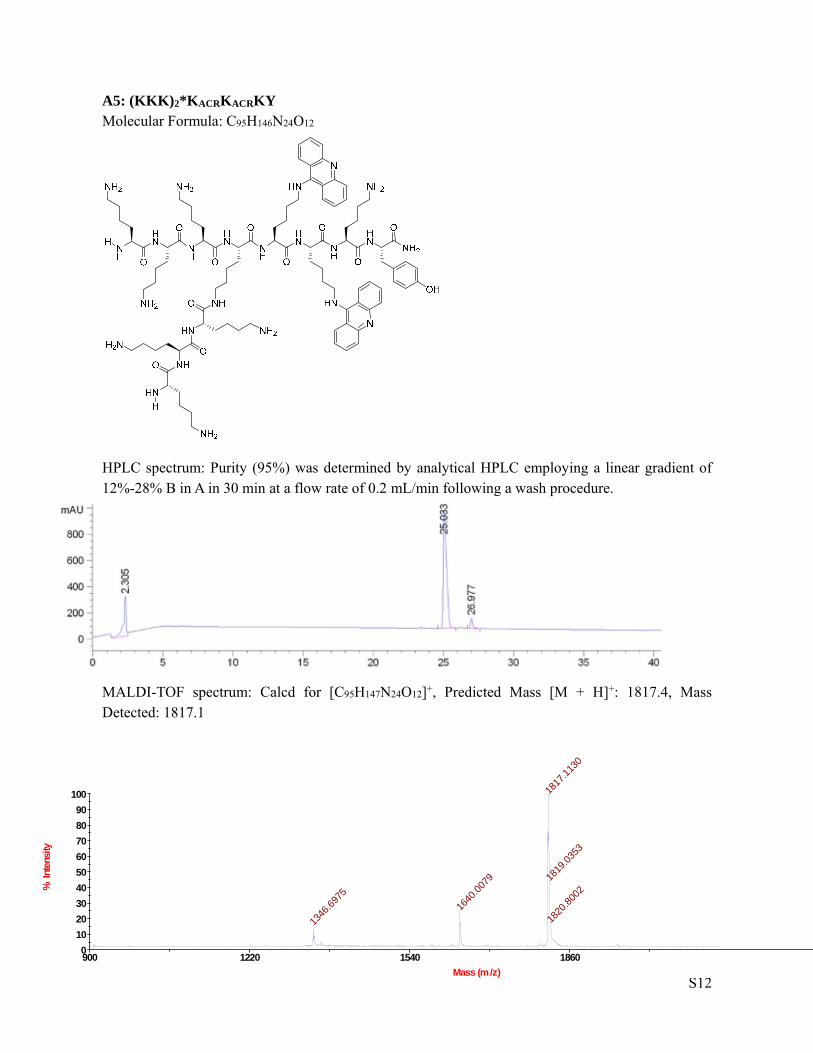
A5: (KKK)2*KACRKACRKY Molecular Formula: C95H146N24O12
HPLC spectrum: Purity (95%) was determined by analytical HPLC employing a linear gradient of 12%-28% B in A in 30 min at a flow rate of 0.2 mL/min following a wash procedure.
MALDI-TOF spectrum: Calcd for [C95H147N24O12]+, Predicted Mass [M + H]+: 1817.4, Mass Detected: 1817.1
900 1220 1540 1860
Mass (m/z)
0
10
20
30
40
50
60
70
80
90
100
% In
tens
ity
1817
.113
0
1819
.035
3
1640
.007
9
1820
.800
2
1346
.697
5

S13
H
HN
O
NH
NH
OH2N
HN
O
NH2
H NH2NH
O
HN
HN
O
NH2
NH
O
NH2
HN
O
NH
NH
O
NH2
HN
O
NH
O
HN
HN
O
OH
O
BOHHO
N
N
A6: (KACRKK)2*KLKBBAY Molecular Formula: C102H150BN23O15 HPLC spectrum: Purity (91%) was determined by analytical HPLC employing a linear gradient of 18%-25% B in A in 30 min at a flow rate of 0.2 mL/min following a wash procedure.
MALDI-TOF spectrum: Calcd for [C109H153BN23O17]+, Predicted Mass [M-DHB + H]+: 2068.4, Mass Detected: 2068.5
1300 1640 1980 2320 2660
Mass (m/z)
0
10
20
30
40
50
60
70
80
90
100
% In
tens
ity
2068
.486
8
2070
.185
5
1890
.519
8
2071
.809
1
2325
.554
7
1537
.309
6
S14
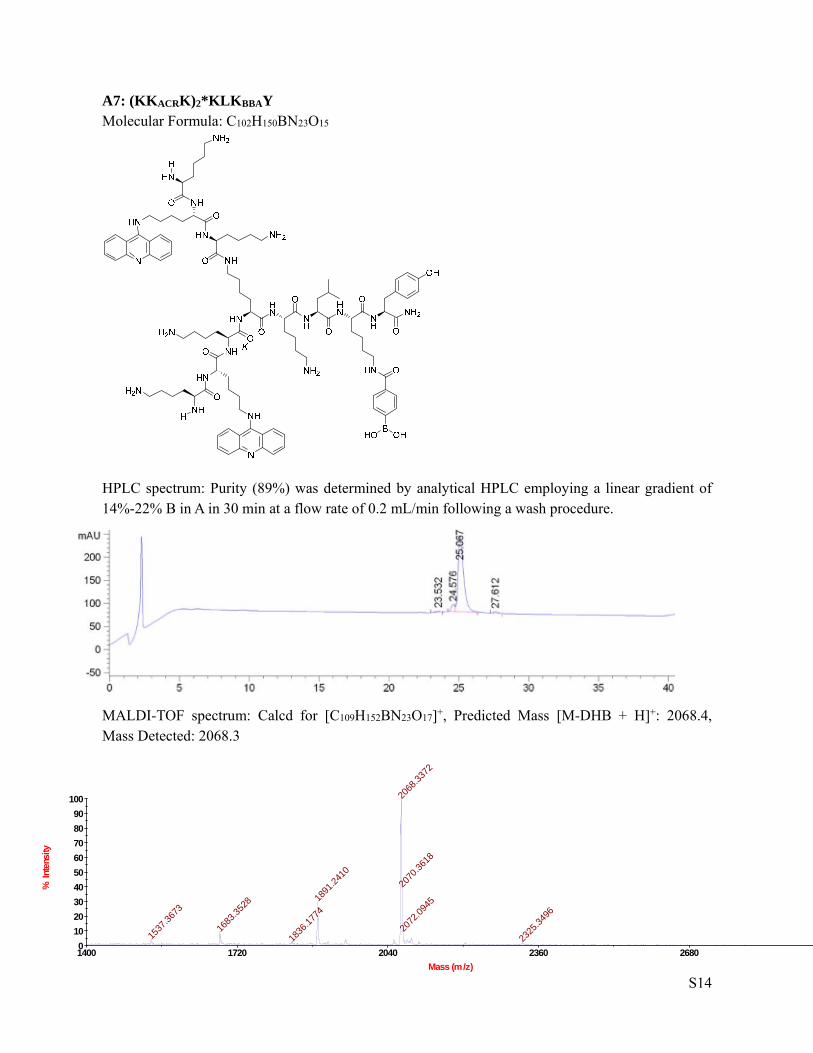
A7: (KKACRK)2*KLKBBAY Molecular Formula: C102H150BN23O15
HPLC spectrum: Purity (89%) was determined by analytical HPLC employing a linear gradient of 14%-22% B in A in 30 min at a flow rate of 0.2 mL/min following a wash procedure.
MALDI-TOF spectrum: Calcd for [C109H152BN23O17]+, Predicted Mass [M-DHB + H]+: 2068.4, Mass Detected: 2068.3
1400 1720 2040 2360 2680
Mass (m/z)
0
10
20
30
40
50
60
70
80
90
100
% In
tens
ity
2068
.337
2
2070
.361
8
1891
.241
0
2072
.094
5
1683
.352
8
1537
.367
3
1836
.177
4
2325
.349
6

S15
A8: (KKBBAK)2*LLKY Molecular Formula: C83H140B2N20O18 HPLC spectrum: Purity (92%) was determined by analytical HPLC employing a linear gradient of 8%-22% B in A in 30 min at a flow rate of 0.2 mL/min following a wash procedure.
MALDI-TOF spectrum: Calcd for [C97H145B2N20O22]+, Predicted Mass [M-DHB + H]+: 1965.0, Mass Detected: 1965.3
1200 1460 1720 1980
Mass (m/z)
0
10
20
30
40
50
60
70
80
90
100
% In
tens
ity
1965
.257
2
1967
.146
4
1985
.782
6
MNa+

S16
A9: (KKKBBA)2*KLKBBAY Molecular Formula: C90H146B3N21O21
HPLC spectrum: Purity (99%) was determined by analytical HPLC employing a linear gradient of 8%-28% B in A in 30 min at a flow rate of 0.2 mL/min following a wash procedure.
MALDI-TOF spectrum: Calcd for [C111H153B3N21O27]+, Predicted Mass [M-DHB + H]+: 2246.0, Mass Detected: 2245.9
1500 1800 2100 2400 2700
Mass (m/z)
0
10
20
30
40
50
60
70
80
90
100
% In
tens
ity
2245
.925
5
2243
.964
6
2249
.761
5
2381
.913
1
1594
.671
8
2084
.021
7
H
HN
O
NH2
NH
OH2N
HN
O
NH
HNH2N
HO
NH2
HN
O
NH2
NH
O
HN
HN
O
NH
NH
O
NH2
HN
O
NH
O
HN
HN
O
OH
O
BOHHO
O
BOH
OH
O
BOHHO

S17
A10: (KLK)2*LKKBBAY Molecular Formula: C76H134BN19O15
HPLC spectrum: Purity (96%) was determined by analytical HPLC employing a linear gradient of 18%-25% B in A in 30 min at a flow rate of 0.2 mL/min following a wash procedure.
MALDI-TOF spectrum: Calcd for [C83H137BN19O17]+, Predicted Mass [M-DHB + H]+: 1683.9, Mass Detected: 1683.3
900 1220 1540 1860
Mass (m/z)
0
10
20
30
40
50
60
70
80
90
100
% In
tens
ity
1683
.344
8
1685
.297
2
1705
.337
5
1565
.272
0
1942
.333
5
1347
.049
4
1125
.976
6
997.
9073
MNa+

S18
O
BHO OH
H
NH
O
H2N
HN
O
NH
O
H2N
HNH2N
HO
NH2
HN
O
NH
O
NH2
HN
O
NH
NH
O
NH2
HN
O
NH2
NH
O
HN
HN
O
OH
A11: (KLK)2*KKKBBAY Molecular Formula: C76H135BN20O15 HPLC spectrum: Purity (93%) was determined by analytical HPLC employing a linear gradient of 10%-18% B in A in 30 min at a flow rate of 0.2 mL/min following a wash procedure.
MALDI-TOF spectrum: Calcd for [C83H138BN20O17]+, Predicted Mass [M-DHB + H]+: 1698.9, Mass Detected: 1699.2
900 1220 1540 1860 2180
Mass (m/z)
0
10
20
30
40
50
60
70
80
90
100
% In
tens
ity
1699
.241
6
1720
.347
9
1579
.980
1
1956
.213
5
1370
.937
4
MNa+
S19
H
HN
O
NH2
NH
OH2N
HN
O
HNH2N
HO
NH2
HN
O
NH2
NH
O
HN
O
HN
NH
O
HN
O
NH2
NH
O
HN
HN
O
OH
O
BOHHO
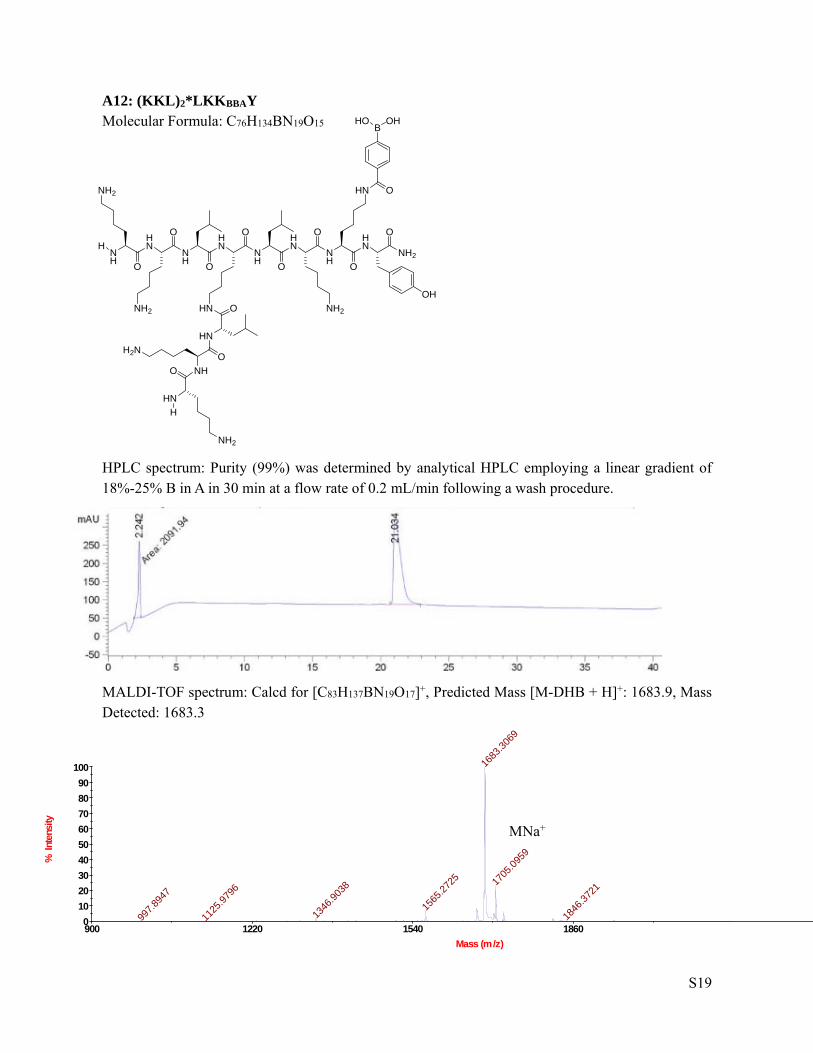
A12: (KKL)2*LKKBBAY Molecular Formula: C76H134BN19O15 HPLC spectrum: Purity (99%) was determined by analytical HPLC employing a linear gradient of 18%-25% B in A in 30 min at a flow rate of 0.2 mL/min following a wash procedure.
MALDI-TOF spectrum: Calcd for [C83H137BN19O17]+, Predicted Mass [M-DHB + H]+: 1683.9, Mass Detected: 1683.3
900 1220 1540 1860
Mass (m/z)
0
10
20
30
40
50
60
70
80
90
100
% In
tens
ity
1683
.306
9
1705
.095
9
1565
.272
5
1346
.903
8
1846
.372
1
997.
8947
1125
.979
6
MNa+

S20
A13: (LLK)2*KKBBAKY Molecular Formula: C76H133BN18O15
HPLC spectrum: Purity (93%) was determined by analytical HPLC employing a linear gradient of 8%-28% B in A in 30 min at a flow rate of 0.2 mL/min following a wash procedure.
MALDI-TOF spectrum: Calcd for [C83H136BN18O17]+, Predicted Mass [M-DHB + H]+: 1668.9, Mass Detected: 1669.0
900 1220 1540 1860 218
Mass (m/z)
0
10
20
30
40
50
60
70
80
90
100
% In
tens
ity
1669
.003
9
1669
.985
0
1689
.953
0
1549
.992
7
1927
.070
6
1209
.723
6
MNa+

S21
A14: (KKL)2*KKBBAKBBAY Molecular Formula: C83H140B2N20O18
HPLC spectrum: Purity (98%) was determined by analytical HPLC employing a linear gradient of 8%-28% B in A in 30 min at a flow rate of 0.2 mL/min following a wash procedure.
MALDI-TOF spectrum: Calcd for [C97H145B2N20O22]+, Predicted Mass [M-DHB + H]+: 1965.0, Mass Detected:1965.0
1200 1460 1720 1980 2240
Mass (m/z)
0
10
20
30
40
50
60
70
80
90
100
% In
tens
ity
1964
.957
2
1966
.933
1
1948
.961
4
1830
.880
1
2100
.983
9
2221
.998
5
1594
.640
1
1709
.789
6
1407
.736
5
H
HN
O
NH2
NH
OH2N
HN
O
HNH2N
HO
NH2
HN
O
NH2
NH
O
HN
O
HN
NH
O
NH2
HN
O
NH
NH
O
HN
HN
O
OH
O
BOHHO
O
BHO OH

S22
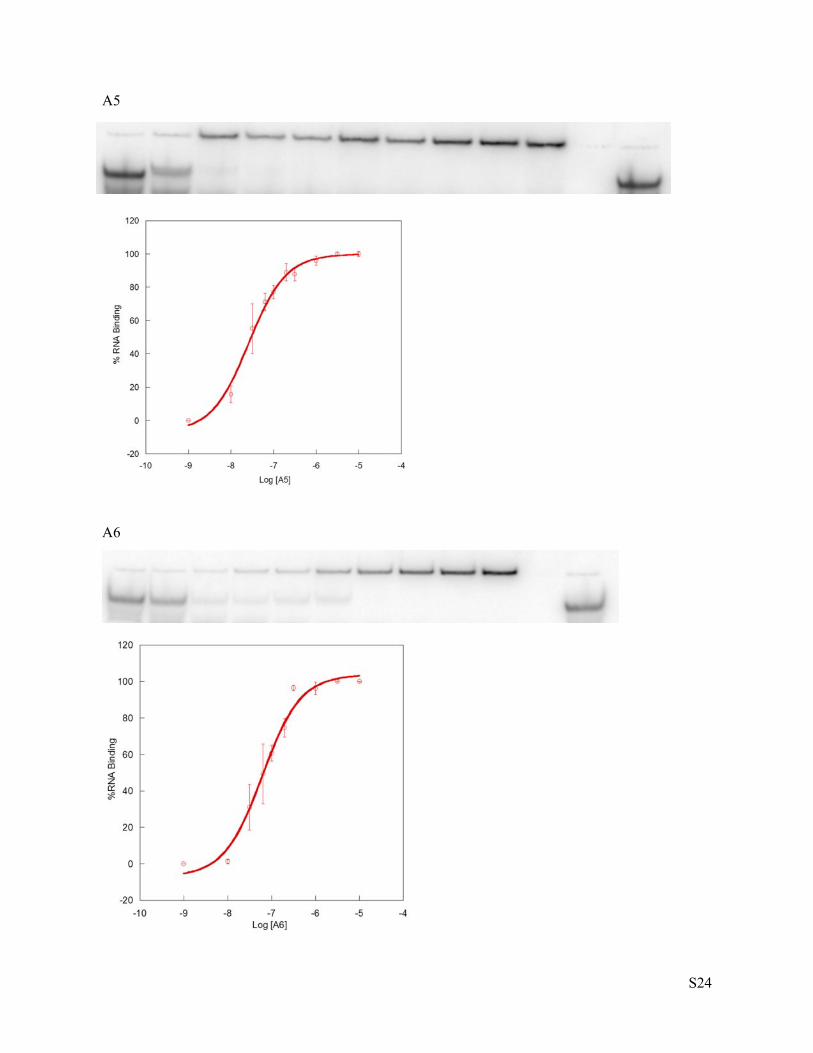
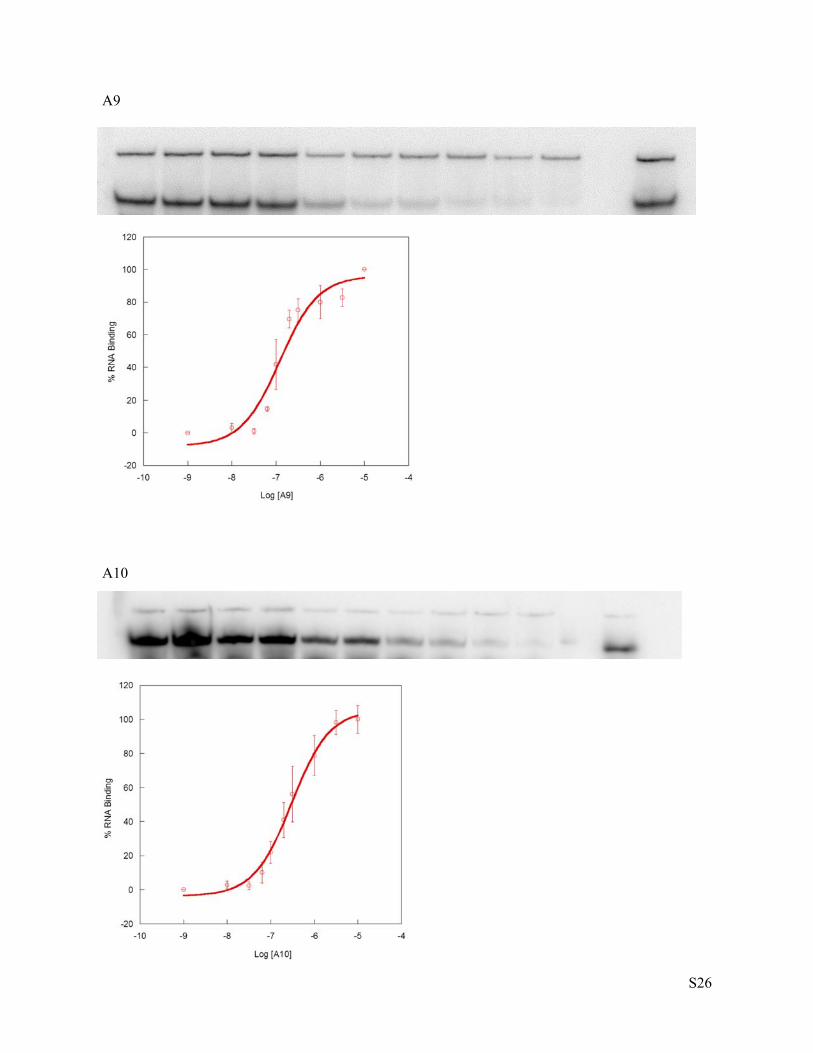
EMSA Results and Binding Curves of BPs with RRE IIB RNA A representative EMSA image is shown for each compound, where the top band is the BP: RRE IIB
RNA complex and the bottom band is free RNA. From left to right, increasing concentrations of BP
(0.001 to 10 µM) were incubated with the RNA; far right lane is RNA only. Binding curves generated
for three or more replicate experiments are shown below the gel images.
A1
.
A2

S23
A3
A4
S24
A5
A6

S25
A7
A8
S26
A9
A10

S27
A11
A12

S28
A13
A14

S29
p24 Inhibition and MTT Assays of BPs
SI.4. p24 inhibition assay of BPs A1-A14 at 10 and 100 µM. Ctr. is the U87 cell line without any compound and 3TC is 2’-3-dideoxy-3’-thiacytidine (Lamivudine), a FDA-approved NRTI for the treatment of HIV/AIDS.
SI.5. Viability assays (MTT) of BPs A1, A4, A5, A6, and A7 run in parallel with dose-dependent p24 screening after 72 h of incubation.

S30
SI.6. Structure of RRE IIB RNA.

S31
Stoichiometry of Acridine BP:RRE IIB Complexes (Job Plots) .The stoichiometry of binding for the acridine-containing branched peptides was determined using 2-aminopurine (2-AP) labeled RRE IIB RNA, with an internal substitution of 2-AP at the U72 position (5'-CUGGUAUGGGCGCAGCGUCAAUGACGCUGACGG-2AP-ACAGGCCAGCC-3', Integrated DNA Technologies).6 All fluorescence spectra were measured on a Varian Cary Eclipse fluorescence spectrophotometer using a xenon flash lamp with a thermoelectrically controlled cell holder. The excitation slit width and the emission slit width were set to 10 nm. The excitation of the sample was done at 310 nm and fluorescence spectra were collected from 340 nm to 450 nm. A quartz
cell of 1 cm path length transparent on three sides was used. All experiments were done at 20 C. Both peptides and RNA were prepared in 1X phosphate buffer (10 mM potassium phosphate, 100 mM KCl,
1 mM MgCl2, 20 mM NaCl, pH 7.0). The RNA was refolded by heating at 95 C for 3 min and cooled at room temperature for 20 min. The total concentration of BPs and RNA was fixed at 0.4 µM, where the mole ratio of peptide vs RNA was varied from 0.25 to 4. The fluorescence intensity at 364 nm was plotted against the ratio of [peptide]/[RNA]. The intersection of the two linear portions of the Job’s plot yielded the mole ratio corresponding to the approximate binding stoichiometry between the peptide and RNA.
S32
References (1) Bryson, D. I.; Zhang, W.; Ray, W. K.; Santos, W. L. Mol. BioSyst. 2009, 5, 1070. (2) (a) Lee, Y.; Hyun, S.; Kim, H. J.; Yu, J. Angew. Chem. Int. Ed. 2008, 47, 134; (b) Tan, D. S.; Foley, M. A.; Stockwell, B. R.; Shair, M. D.; Schreiber, S. L. J. Am. Chem. Soc. 1999, 121, 9073. (3) (a) Milligan, J. F.; Groebe, D. R.; Witherell, G. W.; Uhlenbeck, O. C. Nucleic Acids Res. 1987, 15, 8783; (b) Bryson, D. I.; Zhang, W.; McLendon, P. M.; Reineke, T. M.; Santos, W. L. ACS Chem. Biol. 2012, 7, 210. (4) Tebit, D. M.; Lobritz, M.; Lalonde, M.; Immonen, T.; Singh, K.; Sarafianos, S.; Herchenroder, O.; Krausslich, H.-G.; Arts, E. J. J. Virol. 2010, 84, 9817. (5) Wehrly, K.; Chesebro, B. Methods 1997, 12, 288. (6) (a) Millar, D. P. Curr. Opin. Struct. Biol. 1996, 6, 322; (b) Lacourciere, K. A.; Stivers, J. T.; Marino, J. P. Biochemistry 2000, 39, 5630; (c) Kumar, S.; Bose, D.; Suryawanshi, H.; Sabharwal, H.; Mapa, K.; Maiti, S. PLoS ONE 2011, 6, e23300.