supporting information - beilstein- · pdf files1 supporting information for scalable, high...
TRANSCRIPT

S1
Supporting Information
for
Scalable, high performance, enzymatic cathodes
based on nanoimprint lithography
Dmitry Pankratov1,2, Richard Sundberg3, Javier Sotres1, Dmitry B. Suyatin3,4, Ivan
Maximov3, Sergey Shleev1,2,5*, and Lars Montelius3,4
Address: 1Biomedical Sciences, Health and Society, Malmö University, 20560 Malmö,
Sweden, 2A.N. Bach Institute of Biochemistry, 119071 Moscow, Russia, 3Division of
Solid State Physics and The Nanometer Structure Consortium (nmC@LU), Lund
University, 22100 Lund, Sweden, 4Neuronano Research Center, Medical Faculty, Lund
University, 221 00 Lund, Sweden and 5Kurchatov NBICS Centre, National Research
Centre "Kurchatov Institute", 123182 Moscow, Russia
Email: Sergey Shleev - [email protected]
* Corresponding author

S2
Supplementary data
Figure S1: Schematic illustration of the fabrication process of the nanoimprinted plastic electrodes. A) Ni stamp with ca. 100 nm features is used to transfer the pattern into the
thermoplastic foil, B) nanoimprint patterning is performed by direct mechanical contact of the stamp and the foil at T equal to 160 °C and pressure of 50 bar, C) after separation of
the stamp and the polymer, the stamp nano-pattern is replicated into the polymer, D) 100 nm thick Au layer is thermally evaporated on the imprinted polymer.

S3
Figure S2: Typical CVs of Au (black curve) and NIL/Au (red curve) electrodes. Conditions: 0.5 M H2SO4; 100 mV·s−1 scan rate; second cycle.

S4
Additional AFM studies
Figure S3: Atomic force microscopy images and corresponding height profiles of nanostructured Au electrodes. The images show 2D and 3D representations of a
representative area of the samples. Scan area: 1500 nm 1500 nm. Colour height scale: 0 nm – 245.7 nm. The height profiles (positions highlighted in red in the
topographical images) show the depth of the nano-cavities along the two different directions defined by the primitive vectors of the hexagonal lattice defined by the
nanocavities.

S5
Additional bioelectrochemical studies
Figure S4: CVs of BOx-modified Au electrodes
in air-saturated (black curve) and O2-saturated (blue curve) buffers. Conditions: PBS; scan rate: 20 mV·s−1; second cycle.
Figure S5: CVs of BOx-modified NIL/Au electrodes in air-saturated (black curve) and O2-saturated (blue curve) buffer.
Conditions: PBS; scan rate: 20 mV·s−1; second cycle.

S6
Figure S6: CVs of Au electrode (black curve) and Au electrodes modified with enzyme solutions of different concentrations, μg·mL−1:
0.4 (blue curve), 4 (green curve), 40 (navy curve), and 400 (red curve). Conditions: O2-saturated PBS; 20 mV·s−1 scan rate; second cycle.
Figure S7: CVs of a non-biomodified NIL/Au electrode (black curve) and NIL/Au electrodes modified with enzyme solutions of different concentrations, μg·mL−1:
0.4 (blue curve), 4 (green curve), 40 (navy curve), and 400 (red curve). Conditions: O2-saturated PBS; 20 mV·s−1 scan rate; second cycle.

S7
Ellipsometry studies
The time evolution of the adsorbed amount, thickness, and refractive index of BOx layer
formed on a planar Au surface were monitored by means of null-ellipsometry (Figure
S8). For this, the BOx layer was initially formed by immersing the Au electrodes in a BOx
buffer solution at a concentration of 40 μg·mL−1 for 60 min (adsorption was also
monitored by means of ellipsometry, corresponding to the first 60 minutes of the plots in
Figure S8). Then, the ambient solution was replaced with protein-free buffer and the
layer monitored for 5 more than hours. Ellipsometry data clearly showed that the
adsorbed amount of BOx on the Au surface was approximately constant with a value of
ca. 2.6 mg·mgeom−2 (4.4 pmol·cmgeom
−2 or 2.6 pmol·cmreal−2) during the whole process.
Figure S8: a) Adsorbed amount, b) Thickness and c) Refractive index corresponding to the formation (initial 60 min), rinsing (following
5 min) and stabilization (following 5 hours) of a BOx layer on a planar Au surface monitored
by null-ellipsometry.
b
a
c
S8
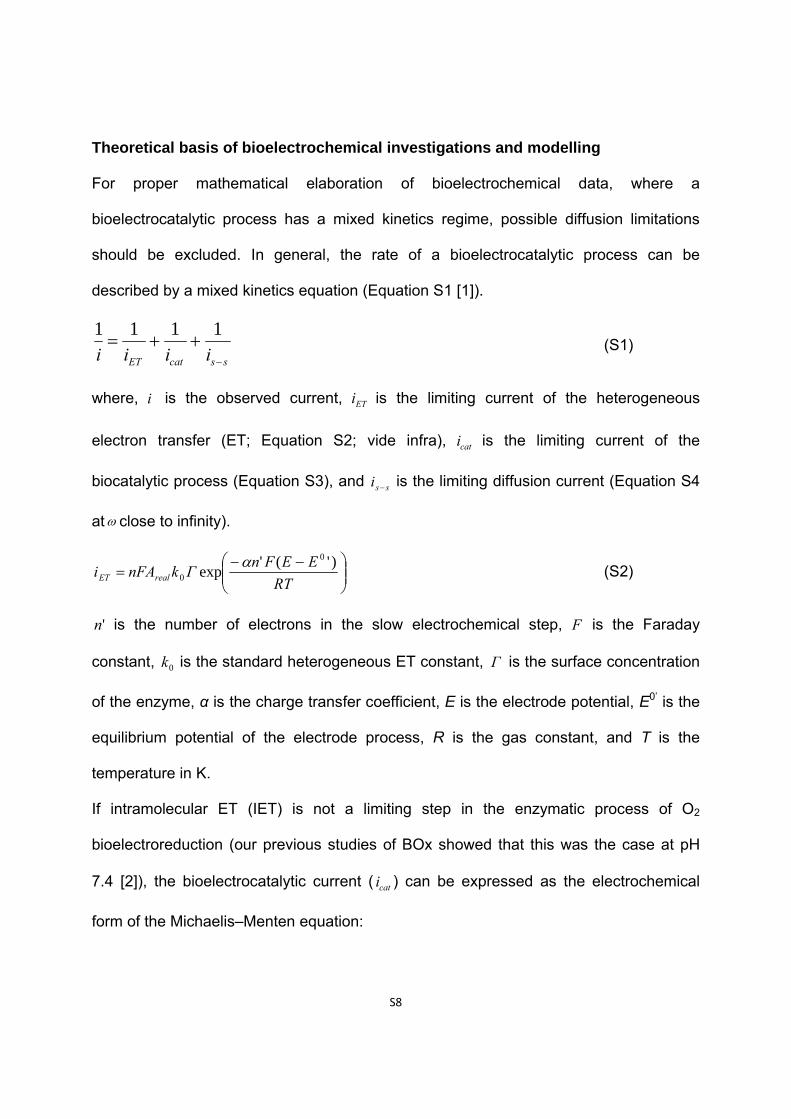
Theoretical basis of bioelectrochemical investigations and modelling
For proper mathematical elaboration of bioelectrochemical data, where a
bioelectrocatalytic process has a mixed kinetics regime, possible diffusion limitations
should be excluded. In general, the rate of a bioelectrocatalytic process can be
described by a mixed kinetics equation (Equation S1 [1]).
sscatET iiii
1111
(S1)
where, i is the observed current, ETi is the limiting current of the heterogeneous
electron transfer (ET; Equation S2; vide infra), cati is the limiting current of the
biocatalytic process (Equation S3), and ssi is the limiting diffusion current (Equation S4
at close to infinity).
RT
EEFnГknFAi realET
)'('exp
0
0
(S2)
'n is the number of electrons in the slow electrochemical step, F is the Faraday
constant, 0k is the standard heterogeneous ET constant, Г is the surface concentration
of the enzyme, α is the charge transfer coefficient, E is the electrode potential, E0’ is the
equilibrium potential of the electrode process, R is the gas constant, and Т is the
temperature in K.
If intramolecular ET (IET) is not a limiting step in the enzymatic process of O2
bioelectroreduction (our previous studies of BOx showed that this was the case at pH
7.4 [2]), the bioelectrocatalytic current ( cati ) can be expressed as the electrochemical
form of the Michaelis–Menten equation:

S9
Moxygen
oxygencatappcatreal
cat KC
СknFAi
(S3)
where appcatk is the apparent rate constant for the bioelectrocatalytic process and MK is
the Michaelis constant.
The Levich equation (Equation S4) defining steady-state current limited by the transport
of substrate molecules at a rotating electrode can be used to estimate mass-transfer
limitations:
(S4)
here, ssi is the steady-state diffusion current, n is the total number of electrons, D is the
diffusion coefficient of the substrate (19.7 × 10⁻⁶ cm2·s−1 for O2), oxygenC is the bulk
concentration of oxygen, O2 (2.5 × 10⁻⁷ mol·cm−3 and 1.2 × 10⁻⁶ mol·cm−3 of O2 (air and
O2 saturated solutions, respectively [3]), is the kinematic viscosity of the solution
(0.01 cm2·s−1 at 25 °C, a typical value for aqueous solutions), and is the angular
frequency (in rad s−1).
For a bioelectrocatalytic process strictly limited by O2 diffusion, direct dependence
between Сoxygen and jmax should be obtained, i.e., jmax should decrease by a factor of ca.
5 when the O2 concentration was decreased from 1.2 mM to 0.25 mM. For
electrocatalytic currents, which are limited by reaction kinetics, jmax can be simply
expressed as the electrochemical form of the Michaelis–Menten equation (Equation S3).
When the O2 concentration was decreased from 1.2 mM down to 0.25 mM in our
studies, i.e., when air-saturated buffer was used instead of oxygen, the maximal current
2/16/13/262.0
geomA
oxygenCnFDi ss

S10
density (jmax), which corresponds to bioelectrocatalytic O2 reduction, decreased by a
factor of ca. 3, which follows Equation S3, suggesting just a minor O2 diffusion limitation.
In the present work, recorded CVs were analysed using the kinetic scheme recently
elaborated by Climent et al. [4].
The equations defining the currents are as follows:
)])1([ 1211 PkPkFAiDET (S5)
'0
01 1exp TEE
RT
Fkk (S6)
'0
02 11exp TEE
RT
Fkk (S7)
2
2
OK
OknFAi
M
catcat
(S8)
where k1 and k2 are potential dependent DET rate constants defined by the Butler–
Volmer formalism (Equations S2, S6, and S7), whereas P1 represents the fraction of
adsorbed BOx molecules with the reduced T1 copper centre.
The maximal bioelectrocatalytic current of O2 electroreduction, as well as current
dependence on the applied potential, can be described by the following summarised
equation:
(S11)
Using this equation, modelling studies of obtained bioelectrocatalytic signals were
performed (Figure S9) and basic parameters of bioelectrocatalytic reduction of O2 were
calculated (Table S1), assuming MK and Г are equal to 0.2 mM and 2.6 pmol·cmreal−2,
'01
0
5'01
max
expexp1 TT EERTF
k
kEE
RTF
jj

S11
respectively. For the calculations, the MK value was taken from our previous studies of
the enzyme immobilised on bare polycrystalline Au surfaces [5], whereas the Г value
was obtained from the ellipsometry studies (vide supra).
Figure S9: Experimental versus modelled voltammograms of Au (triangles) and NIL/Au (circles) biocathodes.
(points – experimental data, lines – modelled curves). Conditions: O2-saturated PBS; 20 mV·s−1 scan rate; second cycle;
an enzyme solution with a concentration equal to 40 μg·mL−1 was used for the bio-modification.

S12
Table S1: Calculated bio-electrocatalytic parameters of Au and NIL/Au bioelectrodes.
Parameter Au NIL/Au
Maximal bio-electrocatalytic current density
(jcat; A·cm−2; air-saturated buffer)
18 ± 3 58 ± 6
Maximal bio-electrocatalytic current density
(jcat; A·cm−2; O2-saturated buffer)
48 ± 5 186 ± 11
kappcat (s
−1) 30 ± 4 39 ± 5
k0 (s−1) 27 ± 3 27 ± 3
S13
References
1. Sucheta, A.; Cammack, R.; Weiner, J.; Armstrong, F. A. Biochemistry 1993, 32,
5455–5465. doi:10.1021/bi00071a023
2. Shleev, S.; Andoralov, V.; Falk, M.; Reimann, C. T.; Ruzgas, T.; Srnec, M.; Ryde, U.;
Rulíšek, L. Electroanalysis 2012, 24, 1524–1540. doi:10.1002/elan.201200188
3. Truesdale, G. A.; Downing, A. L. Nature 1954, 173, 1236. doi:10.1038/1731236a0
4. Climent, V.; Zhang, J.; Friis, E. P.; Østergaard, L. H.; Ulstrup, J. J. Phys. Chem. C
2012, 116, 1232–1243. doi:10.1021/jp2086285
5. Pankratov, D.; Sotres, J.; Barrantes, A.; Arnebrant, T.; Shleev, S. Langmuir 2014, 30,
2943–2951. doi:10.1021/la402432q