supporting information (19 pages) - royal society of chemistry · h2 and n2 sorption isotherms were...
TRANSCRIPT

S1
Insights into the pores of the microwave-assisted synthesized metal-imidazolate frameworks showing enhanced gas sorption
Suvendu Sekhar Mondal,a Subarna Dey,b Ahmed G. Attallah,c,d Reinhard Krause-Rehberg,c Christoph Janiak,b and Hans-Jürgen Holdta,*
aInstitut für Chemie, Anorganische Chemie, Universität Potsdam, Karl-Liebknecht-Straße 24-25, 14476 Potsdam, Germany; E-mail: [email protected]
bInstitut für Anorganische Chemie und Strukturchemie, Heinrich-Heine-Universität Düsseldorf, 40204 Düsseldorf, Germany
cInstitut für Physik, Martin-Luther-Universität Halle-Wittenberg, Von-Danckelmann-Platz 3, 06120 Halle, Germany
dPhysics Department, Faculty of Science, Minia University, P.O. 61519, Egypt
Supporting Information
(19 pages)
Electronic Supplementary Material (ESI) for Dalton Transactions.This journal is © The Royal Society of Chemistry 2017
S2
CONTENTS
IR Spectra S3
Powder X-ray Diffraction S5
Scanning electron microscopy S8
Gas-sorption measurement S8
Positron Annihilation Lifetime Spectroscopy S15
Thermogravimetric Analysis S18
References S19

S3
Percentage (%) of yield and material formation at different conditions.
IFP-7 HIF-1 IFP-8 HIF-2 IFP-14 HIF-31
CE-condition (DMF; 135 °C and 6-7 d)
89 11 97 3 2 98
MW-assisted conditions (DMF, 120 °C, 60 min)
100 0 100 0 0 100
Scheme S1. Schematic presentation of the synthesis of IFP and hydrogen-bonded MBB structure denoted as HIF.
a)

S4
Figure S1. IR-spectra of: a) as-synthesized IFP-7-MW and 4,5- dicyano-2-methoxyimidazole (1a); b) as-synthesizedIFP-8-MW and 4,5- dicyano-2-methoxyimidazole (1a); c) as-synthesized IFP-10-MW and 4,5- dicyano-2-ethoxyimidazole (2a).
The degree of in situ hydrolysis of the cyano groups of 1a (or 1b) into the corresponding linker 2a ( or 1b) was studied with infrared (IR) spectroscopy. The IR-spectra manifested no stretching bands related to CN in the region of 2205–2225 cm1 (Figure S1). Instead, new typical bands for amide and imidate groups were observed at around 1550 cm1 and 1660 cm1. Among other prominent IR
b)
c)
S5
changes, those associated with NH resonances were noticeable. Centered at 3320 cm1, a broad amide NH band with considerable fine structure was noted.
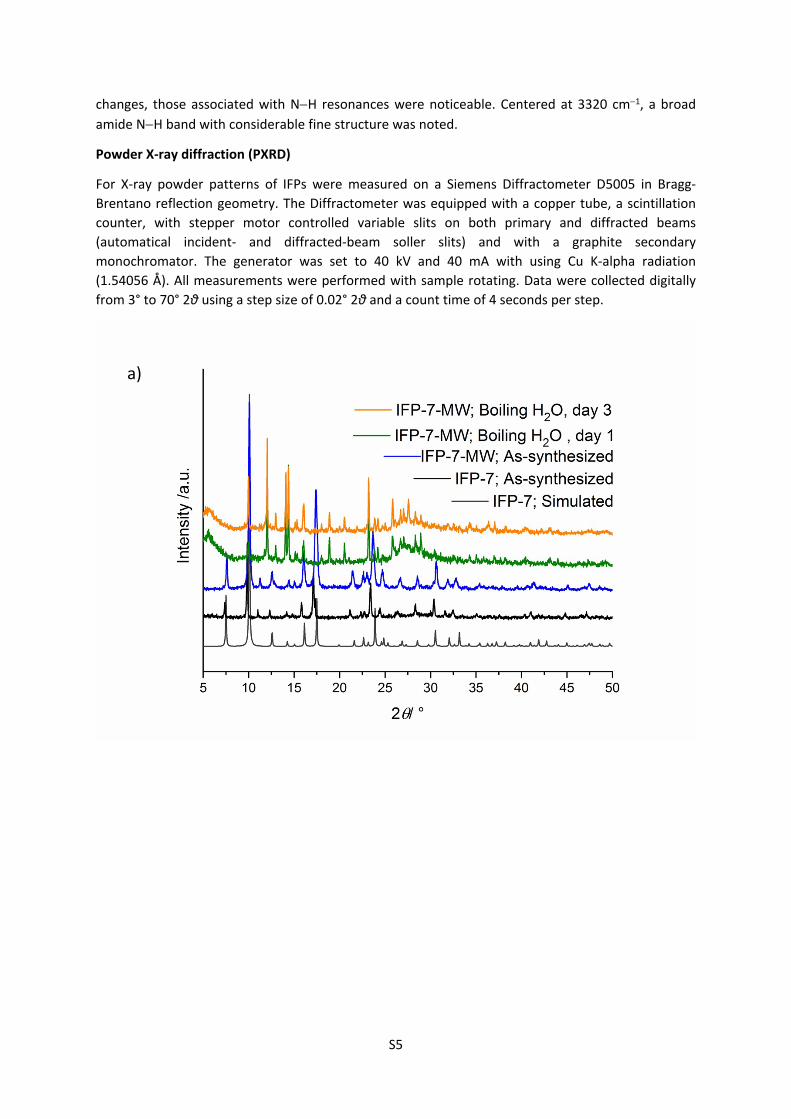
Powder X-ray diffraction (PXRD)
For X-ray powder patterns of IFPs were measured on a Siemens Diffractometer D5005 in Bragg-Brentano reflection geometry. The Diffractometer was equipped with a copper tube, a scintillation counter, with stepper motor controlled variable slits on both primary and diffracted beams (automatical incident- and diffracted-beam soller slits) and with a graphite secondary monochromator. The generator was set to 40 kV and 40 mA with using Cu K-alpha radiation (1.54056 Å). All measurements were performed with sample rotating. Data were collected digitally from 3° to 70° 2θ using a step size of 0.02° 2θ and a count time of 4 seconds per step.
a)

S6
b)

S7
Figure S2. Powder X-ray diffraction profiles of IFP, collected during stability tests in refluxing water.
c)
S8
Scanning electron microscopy
SEM measurements was done on a JEOL JSM 6510 SEM. For measurements all samples were activated under vacuum by 200 °C for 24 h and then coated with carbon (POLARON CC7650 Carbon Coater).
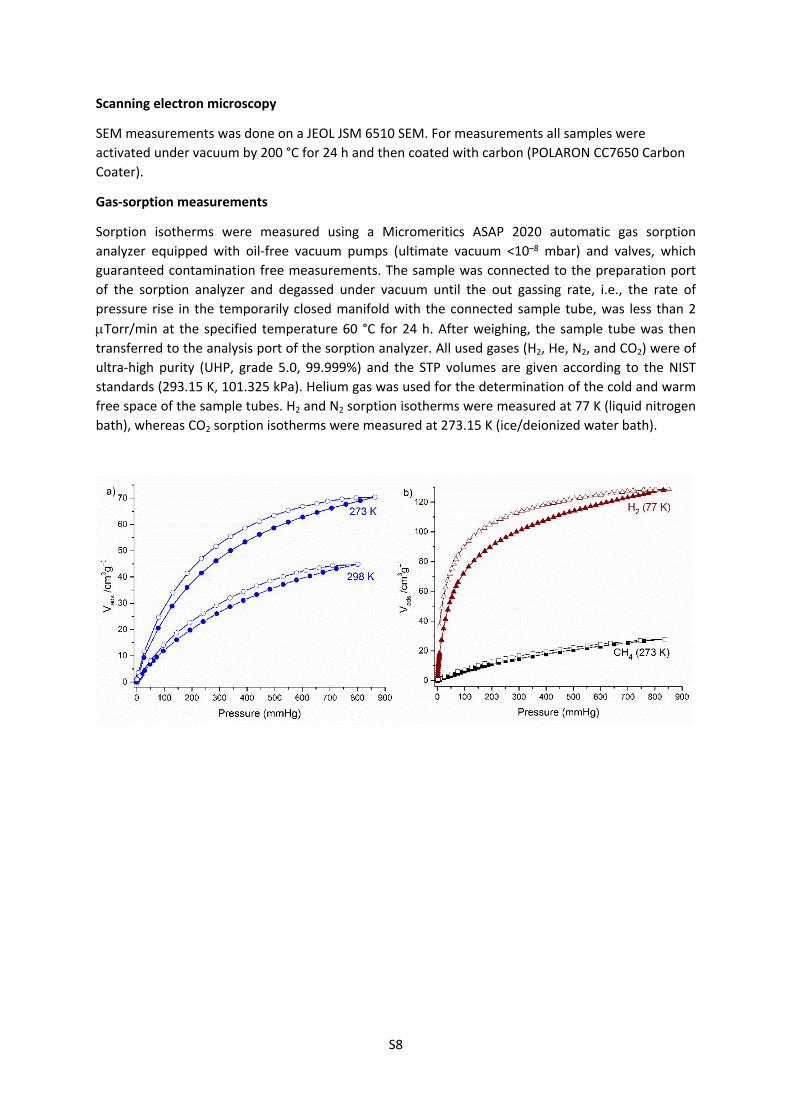
Gas-sorption measurements
Sorption isotherms were measured using a Micromeritics ASAP 2020 automatic gas sorption analyzer equipped with oil-free vacuum pumps (ultimate vacuum <10–8 mbar) and valves, which guaranteed contamination free measurements. The sample was connected to the preparation port of the sorption analyzer and degassed under vacuum until the out gassing rate, i.e., the rate of pressure rise in the temporarily closed manifold with the connected sample tube, was less than 2 Torr/min at the specified temperature 60 °C for 24 h. After weighing, the sample tube was then transferred to the analysis port of the sorption analyzer. All used gases (H2, He, N2, and CO2) were of ultra-high purity (UHP, grade 5.0, 99.999%) and the STP volumes are given according to the NIST standards (293.15 K, 101.325 kPa). Helium gas was used for the determination of the cold and warm free space of the sample tubes. H2 and N2 sorption isotherms were measured at 77 K (liquid nitrogen bath), whereas CO2 sorption isotherms were measured at 273.15 K (ice/deionized water bath).

S9
Figure S3. Gas sorption isotherms for activated IFP-7-MW, a) CO2; b) H2 and CH4; (c) Gas sorption isotherms for activated IFP-7-MW, for CO2 at 273 K for 2nd run. Adsorption and desorption branches are indicated by closed and open symbols, respectively.
Figure S4. Gas sorption isotherms for activated IFP-7-CE. Adsorption and desorption branches are indicated by closed and open symbols, respectively. Images are reproduced from Holdt et al., Chem. Commun., 2013, 49, 75997601.
The origin of the broad H2 desorption hysteresis was raised by one of the Referees when we submitted our IFP-7 manuscript at ChemComm (Holdt et al., Chem. Commun., 2013, 49, 75997601). According to the previous Referee’s suggestion, we did further experiments with increased equilibrium time for H2 and CO2 gas-sorption isotherms of IFP-7-CE. The results are reproduced here from the ESI of that ChemComm paper. Results indicated that similar kinds of hysteresis for both (H2 and CO2) at desorption isotherms are observed as mentioned in the ESI (see Figure S5, Figure S7 and Table S1 for details). This also tells the reproducibility of the gas sorption properties regarding in the capacity and moreover the kinetic behaviour. Therefore, we can suggest that the methoxy group has flexibility and gate-opening behavior. Additionally, we did further H2 gas sorption experiment with IFP-1(IFP-1 is isostructural to IFP-7 but with a methyl group instead of methoxy; Figure S6) that was published previously (Angew. Chem. Int. Ed., 2010, 49, 1258–1262). For IFP-1, the H2 uptake amount was reported to 1.5 wt% and no hysteresis was noted. In our instrument (same measurement condition as for IFP-7-CE) H2 uptake capacity of IFP-1 shows again the same result and no hysteresis is observed (see Fig. S5 for details). This direct comparison of isostructural materials differing only a methyl vs methoxy substituent (Figure S6) is a further strong evidence of the flexibility of methoxy
c)

S10
group and its action in the gate opening behavior of IFP-7. We found one literature that MOFs having alkyl ether side chains can act as a molecular gate due to the chain’s flexibility. Fischer and co-workers have reported a honeycomb-like zinc-dicarboxylate-bipyridine framework with flexible alkyl ether side chains (S. Henke and R. A. Fischer, J. Am. Chem. Soc. 2011, 133, 2064–2067). Such framework shows gate-effects based on gas sorption (N2, CO2 and CH4) measurements. The CO2 sorption measurements of that material at 195, 273, and 298 K show typical type I isotherms with high gas uptake capacity. At 195 K, a steep increase of the CO2 uptake observed in the low-pressure region and a small hysteresis is visible in the desorption branch. The hysteresis can be attributed to slow kinetics of desorption as they reported. In our article, we presented a hexagonal zinc-organic framework with flexible methoxy substituents. Such framework showed gas sorption (N2, CO2 and CH4) behavior similar to the zinc-dicarboxylate-bipyridine framework with flexible alkyl ether side chains.
Mentioned below is reproduced from Holdt et al., Chem. Commun., 2013, 49, 75997601
Table S1 summarizes the equilibrium time interval, measurement time and H2 uptake for IFP-7-CE. The H4 type hysteresis is mostly caused by irreversible uptake of molecules in pores (or through pore entrances). [(a) K. S. W. Sing, D. H. Everett, R. A. W. Haul, L. Moscou, R. A. Pierotti, J. Rouquerol and T. Siemieniewska, Pure Appl. Chem., 1985, 57, 603-619; (b) M. Thommes, B. Smarsly, M. Groenewolt, P. I. Ravikovitch, A. V. Neimark, Langmuir 2005, 22, 756-764.]. We have increased the equilibration interval up to 50 s which had taken the measurement time 68 h. If we further increased the equilibration interval, then it will be a problem to keep the temperature constant (77 K).
Table S1. H2 uptake measurements at different equilibrium time interval for IFP-7-CE.
Condition Curve or Experiment
Measurement time (h)
H2 uptake(cm3/g) a
Absolute pressure (mmHg)
EquilibrationInterval b
(s)0-50 20
50-500 15500-1000 10
curve or experiment 1
IFP-7: 29IFP-1: 8 35
0-50 3050-500 30
500-1000 30
curve or experiment 2 38 37
0-50 5050-500 50
500-1000 50
curve or experiment 3 68 50
a H2 uptake with a standard deviation of ±15 cm3/g at 77 K and 1 bar.b Equilibration time allowed during both adsorption and desorption at each data point up in the stated pressure range

S11
Figure S5. H2 gas sorption isotherms of IFP-7-CE under different equilibration interval. (left) and IFP-1 (right). Adsorption and desorption branches are indicated in closed and open symbols, respectively.
To compare the hysteresis of IFP-7-CE, we measured the H2 sorption at a similar condition (curve or exp.-1) for IFP-1 which is isostructural to IFP-7-CE except for the methyl instead of a methoxy group (IFP-1 contains a methyl group; IFP-7 contains a methoxy group, Figure S6). In IFP-1, there is no hysteresis during the desorption (Fig. S9, right). Therefore, we confirmed that the equilibrium time interval is not a key issue for such broad hysteresis.
N
NCH3
H2N
O
OZn
NH
IFP-1
N
NHOCH3
H2N
O
OZn
NH
IFP-7
Figure S6. Schematic structure of IFP-1 (left) and IFP-7 (right)
The broad desorption hysteresis for H2 in IFP-7-CE does not change with the equilibrium time interval. This was also confirmed for the narrower desorption hysteresis of CO2 at 273 K in IFP-7-CE. At 273 K, again we observed the similar hysteresis when the ad- and desorption equilibrium time interval was increased to 30 s over the whole pressure (Figure S7).
S12
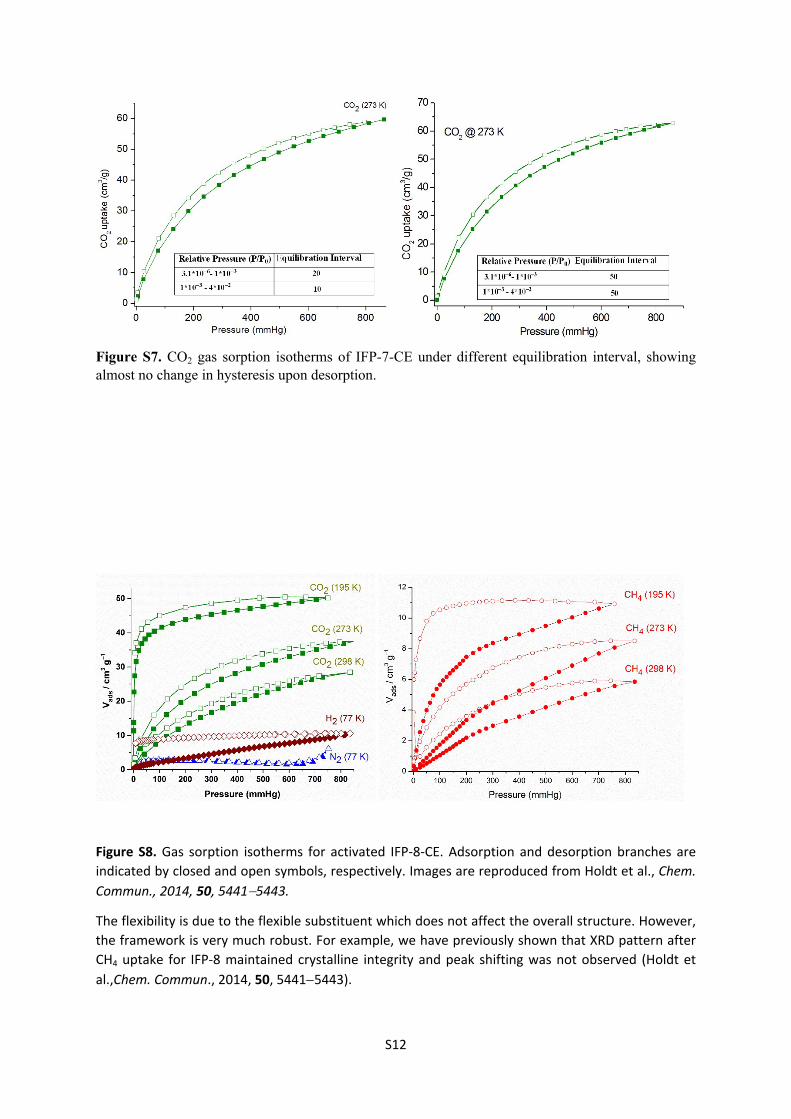
Figure S7. CO2 gas sorption isotherms of IFP-7-CE under different equilibration interval, showing almost no change in hysteresis upon desorption.
Figure S8. Gas sorption isotherms for activated IFP-8-CE. Adsorption and desorption branches are indicated by closed and open symbols, respectively. Images are reproduced from Holdt et al., Chem. Commun., 2014, 50, 54415443.
The flexibility is due to the flexible substituent which does not affect the overall structure. However, the framework is very much robust. For example, we have previously shown that XRD pattern after CH4 uptake for IFP-8 maintained crystalline integrity and peak shifting was not observed (Holdt et al.,Chem. Commun., 2014, 50, 54415443).

S13
Figure S9. Gas sorption isotherms for activated IFP-10-MW, a) CO2; b) H2 and CH4. Adsorption and desorption branches are indicated by closed and open symbols, respectively.
Figure S10. Gas sorption isotherms for activated IFP-10-CE. Adsorption and desorption branches are indicated by closed and open symbols, respectively. Images are reproduced from CrystEngComm, 2013, 15, 93949399.
Heat of adsorption
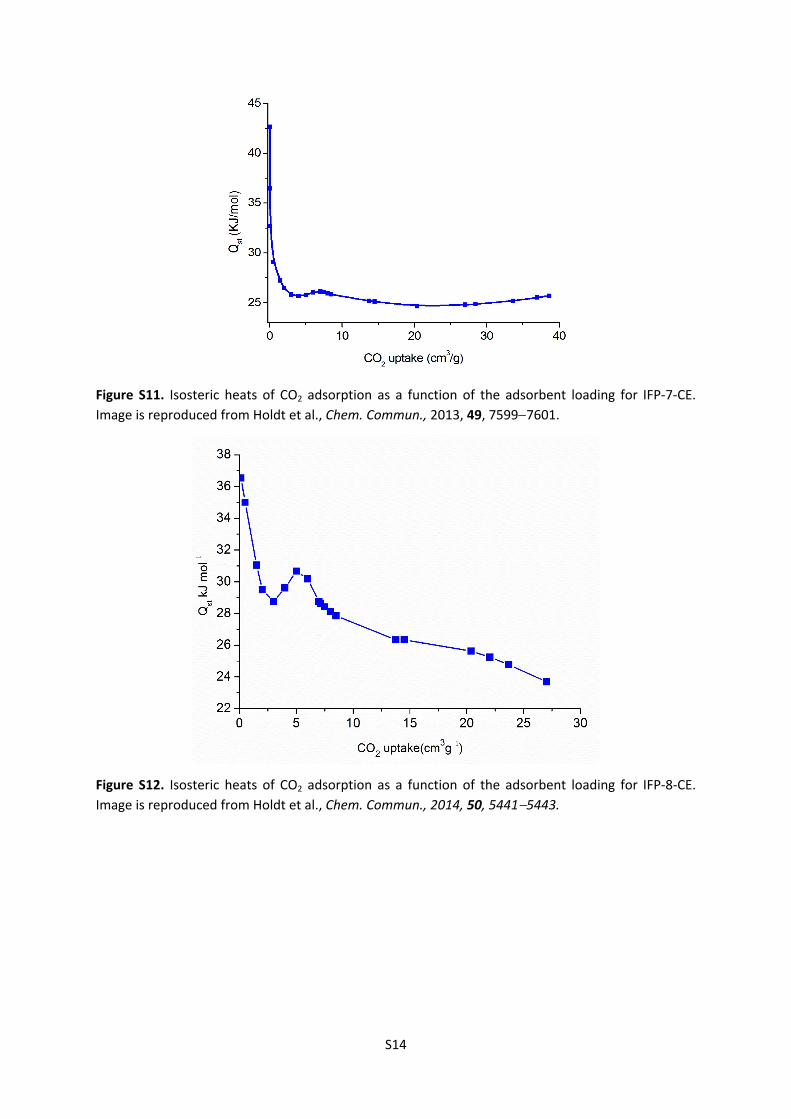
From two adsorption isotherms acquired at different temperatures T1 and T2, the differential heat of adsorption ∆Hads,diff, that is isosteric heat of adsorption Qst can be calculated for any amount of adsorbed substance after determining the required relative pressures p1 and p2. A modified form of the Clausius-Clapeyron equation is used (eq. below).2 ∆Hads,diff was calculated over the whole adsorption range from the 273 K and 298 K isotherms for CO2.
∆𝐻𝑎𝑑𝑠,𝑑𝑖𝑓𝑓= 𝑄𝑠𝑡=‒ 𝑅𝑙𝑛(𝑝2𝑝1)𝑇1𝑇2𝑇2 ‒ 𝑇1
S14
Figure S11. Isosteric heats of CO2 adsorption as a function of the adsorbent loading for IFP-7-CE. Image is reproduced from Holdt et al., Chem. Commun., 2013, 49, 75997601.
Figure S12. Isosteric heats of CO2 adsorption as a function of the adsorbent loading for IFP-8-CE. Image is reproduced from Holdt et al., Chem. Commun., 2014, 50, 54415443.

S15
Figure S13. Two types of pore sizes of IFP-8 (average size: 0.800.10 nm; deviation due to flexible group).
Positron Annihilation Lifetime Spectroscopy
Digital Positron Lifetime Spectrometer
The sample was measured at first in air at RT to see the activation effect on the pore size. The samples were annealed isothermally at 200 °C for periods of 3, 6, 9, 12 hrs at each temperature then the measurements were performed at RT. All measurements were performed upon reaching RT after annealing. We used a 7 Ci 22-Na positron source. Two 40 mm x 22 mm EJ232 plastic scintillators coupled to two Hamamatsu PMTs were used. The system gave one resolution function with 225 ps full width at half maximum. A pre and a turbo pumps used to evacuate the samples. A digital positron annihilation spectroscopy, with two Hamamatsu photomultiplier tubes with two plastic scintillator of 40mm x 22mm dimension and 240 ps resolution (fwhm), was used for these measurements. LT 10 program was used for the LT analysis. The pore size was calculated by using Excited Energy Levels and Various Shapes (EELViS) program,3,4 and the program depends on the Extended Tao-Eldrup model with the following equation:5
1...........................
2sin121
4),(
3
1
13
2
2
2
2
i
kTDi
i
kTDi
SARTE
e
eDi
iD
TD

S16
Figure S14. Instrumental set up of digital positron lifetime spectrometer. We used Na22 as a positron source and its activity is 7 Ci.
Figure S15. Positron lifetime and intensity of IFP-8 at different annealing temperatures as a function of annealing time.
S17
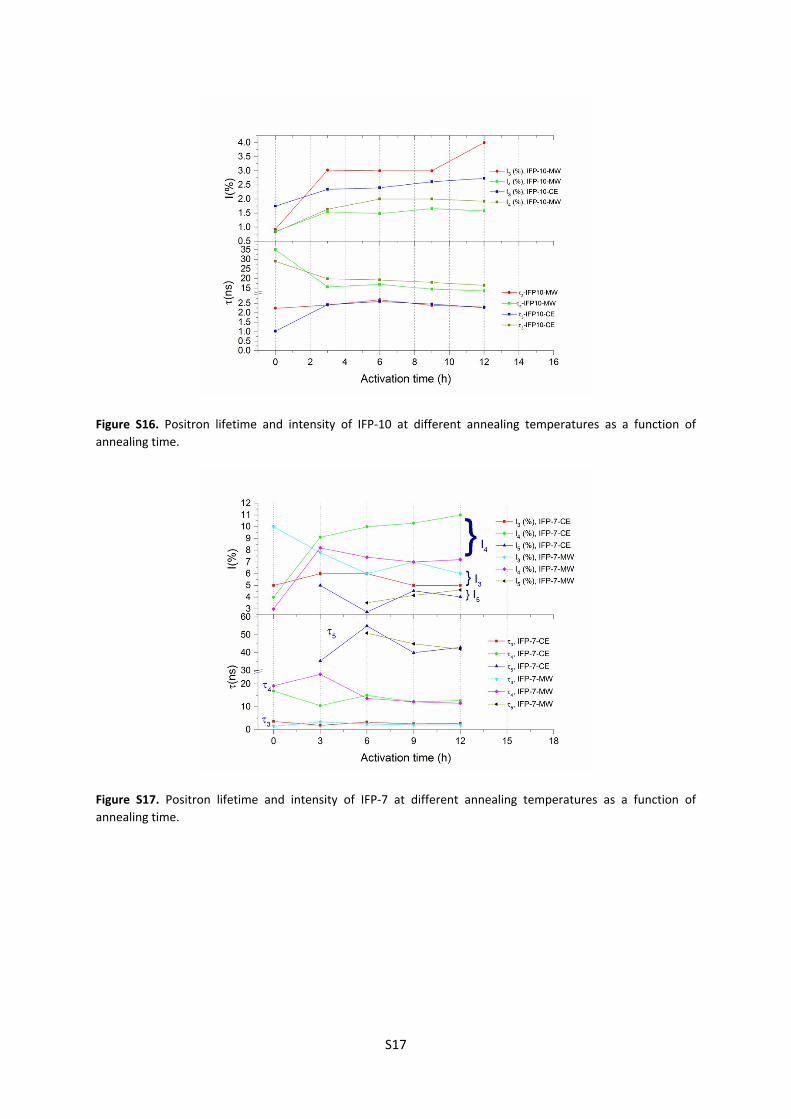
Figure S16. Positron lifetime and intensity of IFP-10 at different annealing temperatures as a function of annealing time.
Figure S17. Positron lifetime and intensity of IFP-7 at different annealing temperatures as a function of annealing time.

S18
Figure S18. Pore sizes for IFP-7 as a function of annealing time (only the largest pore sizes (5) have standard deviations. points without standard deviation mean that their error values (in positron lifetime) are so small and cannot be used as pore size/deviation).
Thermogravimetric analysis
TG measurements were performed in a static air atmosphere from room temperature to 900 °C with a Perkin Elmer TGA 4000 thermal analyzer. We have presented up to 450 °C. The heating rate was 10 °C min1. The samples were placed in ceramic pans.

S19
Figure S19. TGA curves for IFP-10 (black: as-synthesized at CE-conditions; blue: as-synthesized at MW-conditions and red: activated at MW-conditions).
References
1 S. S. Mondal, S. Dey, A. G. Attallah, A. Bhunia, A. Kelling, U. Schilde, R. Krause-Rehberg, C. Janiak and H.-J. Holdt, ChemistrySelect, 2016, 1, 43204325.
2 F. Rouquerol, J. Rouquerol and K. Sing, Adsorption by powders and porous solids, (F. Rouquerol, J. Rouquerol, K. Sing, Eds.), Academic Press, San Diego, 1999, vol. 11.
3 R. Zaleski, J. Wawryszczuk and T. Goworek, Radiat. Phys. Chem., 2007, 76, 243247.
4 http://sourceforge.net/projects/eelvis/
5 D. W. Gidley, T. L. Dull, W. E. Frieze, J. N. Sun and A. F. Yee, J. Phys. Chem. B, 2001, 105, 46574662.