supporting acceptance of automated vehicle
TRANSCRIPT
SUpporting acceptance of automated VEhicle
Deliverable 1.2. Model and guidelines depicting key psychological factors that explain and promote public
acceptability of CAV among different user groups DELIVERABLE IDENTITY
Work Package No. WP1
Work Package Title Assessing and enhancing public acceptance of CAV
Task Investigating the predictive power of identified factors influencing public
acceptability of CAV
Date 2020/09/30
Dissemination level PUBLIC
Category Report
Document status
Draft
Ready for internal review
Project Coordinator accepted
This project has received funding from the European Union’s Horizon 2020 research and innovation programme under grant agreement No. 814999
Document control page
AUTHOR
Participant Partners(s) RuG
Deliverable Leader drs J.M.M. Post
Author(s) drs. J.M.M. Post, dr. A.B. Ünal, dr. J.L. Veldstra,
Revision History
VERSION DATE AUTHOR PARTNER CHANGES MADE
001 2020/08/07 J.M.M. Post RuG First version.
002 2020/09/15 E. Dogan VED Review.
003
2020/09/16 B. Mateo,
N. Palomares
IBV
Review.
004
2020/09/23
J.M.M. Post
RuG Incorporated feedback from reviews.
005 2020/09/29 J.M.M. Post RuG Final version.
100 2020/09/30 N. Palomares IBV Approved.
Legal disclaimer
The content of this publication is the sole responsibility of the authors, and in no way
represents the view of INEA or European Commission.
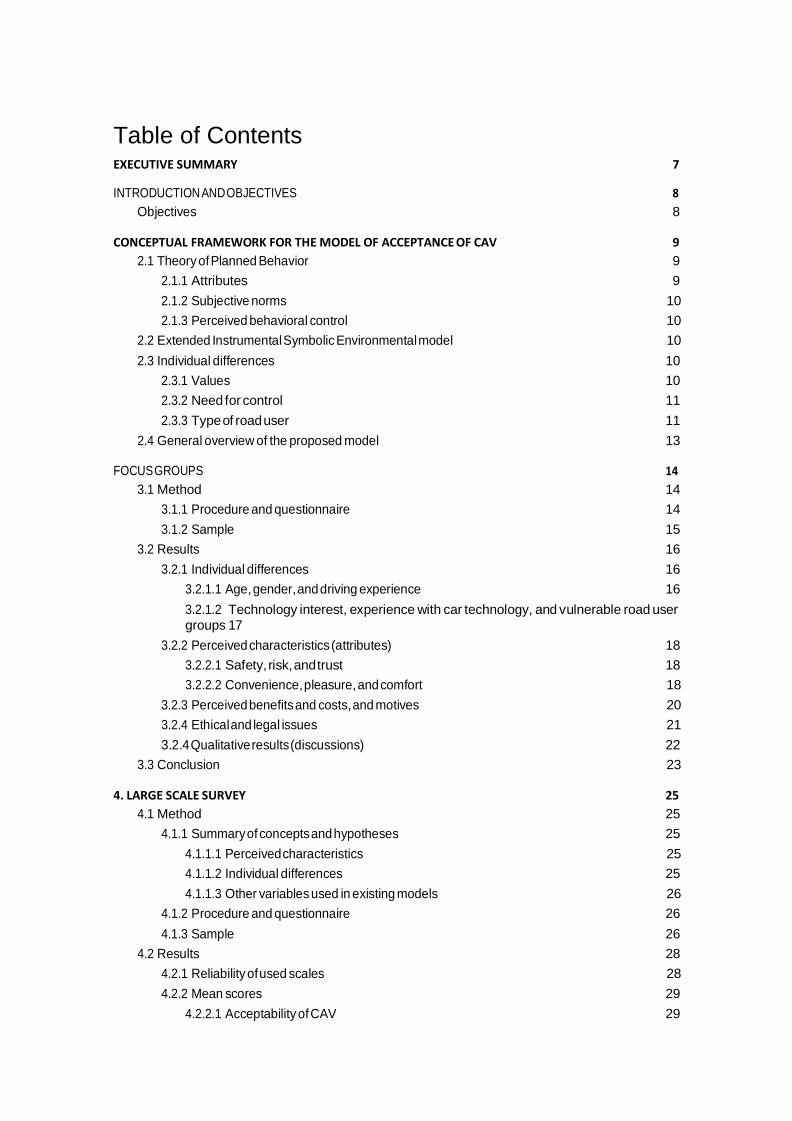
Table of Contents EXECUTIVE SUMMARY 7
INTRODUCTION AND OBJECTIVES 8
Objectives 8
CONCEPTUAL FRAMEWORK FOR THE MODEL OF ACCEPTANCE OF CAV 9
2.1 Theory of Planned Behavior 9
2.1.1 Attributes 9
2.1.2 Subjective norms 10
2.1.3 Perceived behavioral control 10
2.2 Extended Instrumental Symbolic Environmental model 10
2.3 Individual differences 10
2.3.1 Values 10
2.3.2 Need for control 11
2.3.3 Type of road user 11
2.4 General overview of the proposed model 13
FOCUS GROUPS 14
3.1 Method 14
3.1.1 Procedure and questionnaire 14
3.1.2 Sample 15
3.2 Results 16
3.2.1 Individual differences 16
3.2.1.1 Age, gender, and driving experience 16
3.2.1.2 Technology interest, experience with car technology, and vulnerable road user groups 17
3.2.2 Perceived characteristics (attributes) 18
3.2.2.1 Safety, risk, and trust 18
3.2.2.2 Convenience, pleasure, and comfort 18
3.2.3 Perceived benefits and costs, and motives 20
3.2.4 Ethical and legal issues 21
3.2.4 Qualitative results (discussions) 22
3.3 Conclusion 23
4. LARGE SCALE SURVEY 25
4.1 Method 25
4.1.1 Summary of concepts and hypotheses 25
4.1.1.1 Perceived characteristics 25
4.1.1.2 Individual differences 25
4.1.1.3 Other variables used in existing models 26
4.1.2 Procedure and questionnaire 26
4.1.3 Sample 26
4.2 Results 28
4.2.1 Reliability of used scales 28
4.2.2 Mean scores 29
4.2.2.1 Acceptability of CAV 29
4.2.2.2 Expected adoption norm 29
4.2.2.3 Perceived characteristics of CAV 30
4.2.2.4 Importance of perceived characteristics 31
4.2.3 Confirmatory Factor Analysis of perceived characteristics 31
4.2.4 Perceived characteristics influencing acceptability 33
4.2.3.1 Perceived control 33
4.2.3.2 Perceived pleasure 33
4.2.3.3 Perceived safety 33
4.2.3.4 Perceived convenience 34
4.2.3.5 Trust in CAV technology 34
4.2.3.6 Perceived status-enhancement 34
4.2.3.7 Perceived environmental sustainability 34
4.2.3.8 All perceived characteristics 36
4.2.5 Individual differences influencing perceived characteristics 36
4.2.5.1 Values 38
4.2.5.2 Need for control 41
4.2.6 Differences between user groups 42
4.2.6.1 Cycling frequency 43
4.2.6.2 Driving frequency 44
4.2.6.3 Non-drivers versus drivers 46
4.2.6.4 Vulnerable road users 47
4.2.6.5 Gender differences 49
4.2.6.6 Country differences 50
4.2.7 Perceived adoption norm 51
5. TESTING THE MODEL 52
5.1 Measures in the large-scale survey 52
5.2 General overview of the model 52
5.3 Testing the model 53
6. TECHNICAL & SCIENTIFIC IMPACTS 55
6.1 Guidelines 55
7. CONCLUSION 57
8. REFERENCES 58
6 / Deliverable 1.2 Psychological model predicting acceptability of CAV
Terminology and Acronyms
CAV Connected Automated Vehicle
CI Confidence Interval
D Deliverable
df Degrees of Freedom
EU European Commission
ISE model Instrumental Symbolic Environmental model
M Mean
N Number of participants
SD Standard Deviation
TAM Technology Acceptance Model
TPB Theory of Planned Behavior
VRU Vulnerable Road User
/ 7 Deliverable 1.2 Psychological model predicting acceptability of CAV
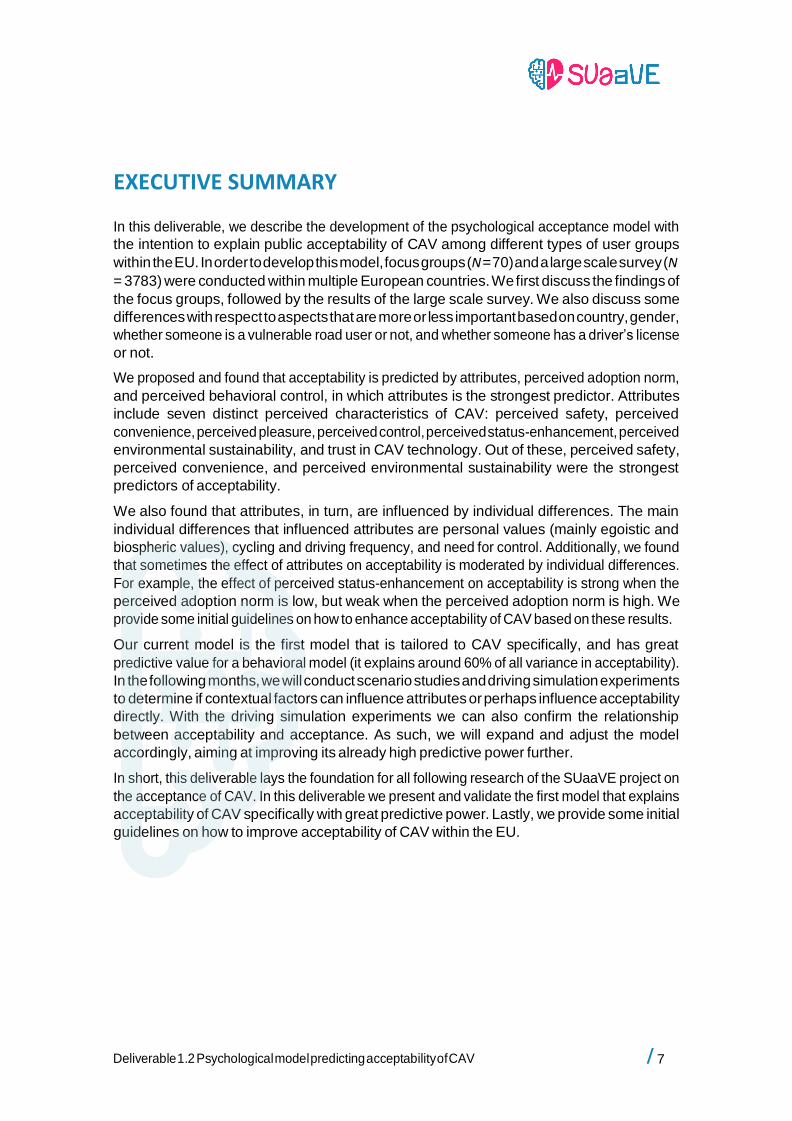
EXECUTIVE SUMMARY
In this deliverable, we describe the development of the psychological acceptance model with
the intention to explain public acceptability of CAV among different types of user groups
within the EU. In order to develop this model, focus groups (N = 70) and a large scale survey (N
= 3783) were conducted within multiple European countries. We first discuss the findings of
the focus groups, followed by the results of the large scale survey. We also discuss some
differences with respect to aspects that are more or less important based on country, gender,
whether someone is a vulnerable road user or not, and whether someone has a driver’s license
or not.
We proposed and found that acceptability is predicted by attributes, perceived adoption norm,
and perceived behavioral control, in which attributes is the strongest predictor. Attributes
include seven distinct perceived characteristics of CAV: perceived safety, perceived
convenience, perceived pleasure, perceived control, perceived status-enhancement, perceived
environmental sustainability, and trust in CAV technology. Out of these, perceived safety,
perceived convenience, and perceived environmental sustainability were the strongest
predictors of acceptability.
We also found that attributes, in turn, are influenced by individual differences. The main
individual differences that influenced attributes are personal values (mainly egoistic and
biospheric values), cycling and driving frequency, and need for control. Additionally, we found
that sometimes the effect of attributes on acceptability is moderated by individual differences.
For example, the effect of perceived status-enhancement on acceptability is strong when the
perceived adoption norm is low, but weak when the perceived adoption norm is high. We
provide some initial guidelines on how to enhance acceptability of CAV based on these results.
Our current model is the first model that is tailored to CAV specifically, and has great
predictive value for a behavioral model (it explains around 60% of all variance in acceptability).
In the following months, we will conduct scenario studies and driving simulation experiments
to determine if contextual factors can influence attributes or perhaps influence acceptability
directly. With the driving simulation experiments we can also confirm the relationship
between acceptability and acceptance. As such, we will expand and adjust the model
accordingly, aiming at improving its already high predictive power further.
In short, this deliverable lays the foundation for all following research of the SUaaVE project on
the acceptance of CAV. In this deliverable we present and validate the first model that explains
acceptability of CAV specifically with great predictive power. Lastly, we provide some initial
guidelines on how to improve acceptability of CAV within the EU.
8 / Deliverable 1.2 Psychological model predicting acceptability of CAV
1. INTRODUCTION AND OBJECTIVES
One of the general goals of SUaaVE is to enhance public acceptance of connected automated vehicles (CAVs) within the EU.
In work package 1, we will develop a social psychological model to explain and promote public
acceptability of CAV among different types of user groups (such as passengers and other road
users). In deliverable 1.1 we conducted a literature review to explore which factors could
potentially influence acceptability of CAV. In the present deliverable we will build upon this
literature review to develop and validate the social psychological model that will help predict
the acceptability of CAV’s.
1.1. Objectives
The key objective of the present deliverable is to describe the development of the psychological model depicting the key predictors of public acceptability for CAV, as well as to test the model fit and to examine the strength of the predictors.
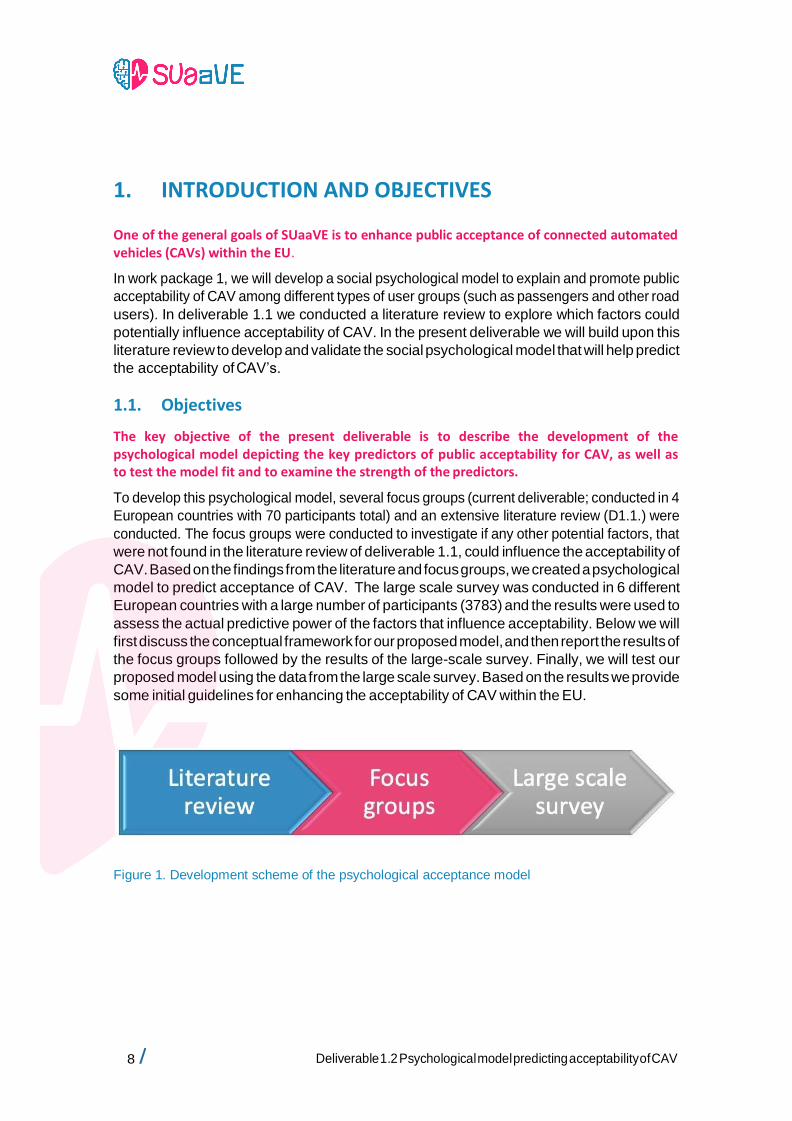
To develop this psychological model, several focus groups (current deliverable; conducted in 4
European countries with 70 participants total) and an extensive literature review (D1.1.) were
conducted. The focus groups were conducted to investigate if any other potential factors, that
were not found in the literature review of deliverable 1.1, could influence the acceptability of
CAV. Based on the findings from the literature and focus groups, we created a psychological
model to predict acceptance of CAV. The large scale survey was conducted in 6 different
European countries with a large number of participants (3783) and the results were used to
assess the actual predictive power of the factors that influence acceptability. Below we will
first discuss the conceptual framework for our proposed model, and then report the results of
the focus groups followed by the results of the large-scale survey. Finally, we will test our
proposed model using the data from the large scale survey. Based on the results we provide
some initial guidelines for enhancing the acceptability of CAV within the EU.
Figure 1. Development scheme of the psychological acceptance model
/ 9 Deliverable 1.2 Psychological model predicting acceptability of CAV
2. CONCEPTUAL FRAMEWORK FOR THE MODEL OF ACCEPTANCE OF CAV
2.1 Theory of Planned Behavior
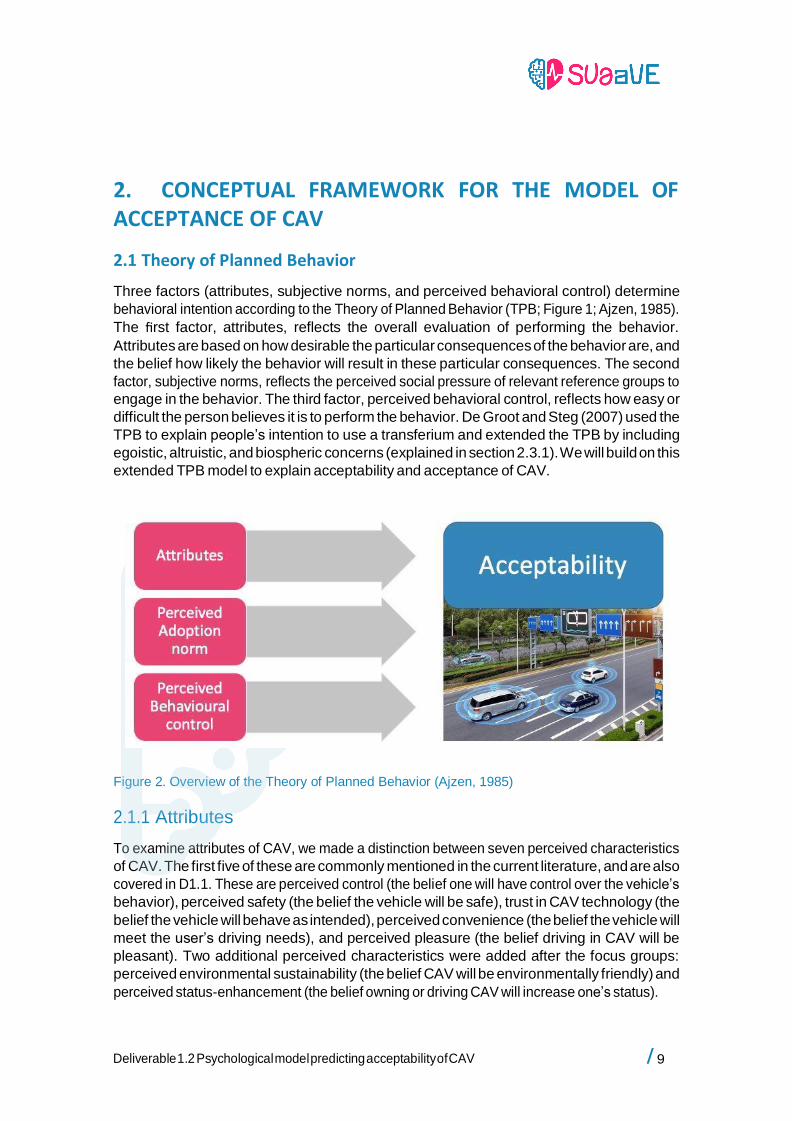
Three factors (attributes, subjective norms, and perceived behavioral control) determine
behavioral intention according to the Theory of Planned Behavior (TPB; Figure 1; Ajzen, 1985).
The first factor, attributes, reflects the overall evaluation of performing the behavior.
Attributes are based on how desirable the particular consequences of the behavior are, and
the belief how likely the behavior will result in these particular consequences. The second
factor, subjective norms, reflects the perceived social pressure of relevant reference groups to
engage in the behavior. The third factor, perceived behavioral control, reflects how easy or
difficult the person believes it is to perform the behavior. De Groot and Steg (2007) used the
TPB to explain people’s intention to use a transferium and extended the TPB by including
egoistic, altruistic, and biospheric concerns (explained in section 2.3.1). We will build on this
extended TPB model to explain acceptability and acceptance of CAV.
Figure 2. Overview of the Theory of Planned Behavior (Ajzen, 1985)
2.1.1 Attributes
To examine attributes of CAV, we made a distinction between seven perceived characteristics
of CAV. The first five of these are commonly mentioned in the current literature, and are also
covered in D1.1. These are perceived control (the belief one will have control over the vehicle’s
behavior), perceived safety (the belief the vehicle will be safe), trust in CAV technology (the
belief the vehicle will behave as intended), perceived convenience (the belief the vehicle will
meet the user’s driving needs), and perceived pleasure (the belief driving in CAV will be
pleasant). Two additional perceived characteristics were added after the focus groups:
perceived environmental sustainability (the belief CAV will be environmentally friendly) and
perceived status-enhancement (the belief owning or driving CAV will increase one’s status).
10 / Deliverable 1.2 Psychological model predicting acceptability of CAV
2.1.2 Subjective norms
As CAV is currently not on the market, examining current subjective norms may be difficult.
Instead, we used the perceived adoption norm from the extended Instrumental Symbolic
Environmental (ISE) model (explained in section 2.2). The perceived adoption norm is the
percentage one expects close others (such as family, friends, coworkers, etc.) will adopt CAV
when it becomes available. We expect that those who think a high percentage of close others
will adopt CAV, are more likely to be accepting of CAV in return.
2.1.3 Perceived behavioral control
TPB posits that the easier it is to perform a behavior, the more likely one will have the
intention to perform it. The idea that the ease of use can influence behavior is also present in
the Technology Acceptance Model (TAM; Davis, 1985), a model to predict system use of
technologies. We have included the perceived behavioral control in our model as well.
However, perceived behavioral control may be different between potential users and other
road users. For potential users, the ease of using CAV may be important, while for other road
users the ease of interacting with CAV may be important.
2.2 Extended Instrumental Symbolic Environmental model
The ISE model posits that adoption likelihood of sustainable behavior is predicted by symbolic
(i.e. related to status), instrumental, and environmental attributes, as well as the adoption
norm (Noppers et al., 2019). The three types of attributes in the ISE model are reflected in our
model for CAV: symbolic attributes are reflected in the current model as perceived
status-enhancement, instrumental attributes are reflected as perceived convenience, and
environmental attributes as perceived environmental sustainability. The extended ISE model
also posits a moderation of the perceived adoption norm on the effect of symbolic attributes
on adoption likelihood. When the perceived adoption norm is low, symbolic attributes become
more important for potential users. While if the perceived adoption norm is high, symbolic
attributes will become less important. We will test for a similar effect in the acceptance of
CAV.
2.3 Individual differences
In D1.1 we found that perceived characteristics of CAV may be influenced by individual
differences. In our model, we have included three types of individual factors (values, need for
control, and type of road user). Other often used variables such as personality and gender
have been found to have no effect, or inconsistent results in the existing literature (please
refer to D1.1). As such, they are not explicitly included in the model. However, we will examine
differences based on gender and country for this deliverable.
2.3.1 Values
Values are guiding principles in life, that can affect beliefs, attitudes, and behaviors, and can
color perceptions and cognitions (Schwartz, 1992). People’s key values and what they deem
important in life may also affect what they find important for CAV. Four major values exist: (1)
hedonic; striving for an exciting life, experiencing new things, enjoying life, (2) egoistic; striving
/ 11 Deliverable 1.2 Psychological model predicting acceptability of CAV
for personal wealth, social power, dominance, (3) altruistic; striving for equality, social justice,
peace, and (4) biospheric; striving for balance with nature, protecting the earth, preventing
pollution (Steg & De Groot, 2012; Steg, Perlaviciute, Van der Werff, & Lurvink, 2014). We
expected that different values are related to the importance of different characteristics of CAV.
We expected that hedonic values may be related to the importance of convenience and
pleasure, that egoistic values may be related to the importance of status-enhancement, that
altruistic values may be related to the importance of safety, and that biospheric values may be
related to the importance of environmental sustainability. We also expected values may
moderate the effect of perceived characteristics on acceptability. For example, we expected
that great biospheric values will make the effect of perceived environmental sustainability on
acceptability stronger.
2.3.2 Need for control
The second individual factor is the need for control. The belief that a person has control over
the environment and events in one’s life is vital for someone’s well-being. The perception of
control is both desirable, as well as a psychological necessity (Leotti, Iyengar, & Ochsner,
2010). People differ on a general level of motivation to control events, in other words the need
for control is an individual difference (Burger & Cooper, 1979). The feeling of being in control is
an integral part of driving. The lack of control over autonomous vehicles may decrease the
acceptability of these vehicles, especially for people with a high need for control. (for example
Howard & Dai, 2014). We expected that people with a high need for control perceive to have
less control over CAV. Moreover, we expected that for people with a high need for control the
effect of perceived control on acceptability becomes stronger.
2.3.3 Type of road user
Figure 3. Different types of persons
What type of road user someone is may influence their perception of CAV. Potential users may
be more focused on how CAV can meet their driving needs, while potential other road users
(such as cyclists and pedestrians) may be more focused on how to interact with CAV on the
road. Moreover, car users may have different perceptions of what a car should be like or how
it should behave.
12 / Deliverable 1.2 Psychological model predicting acceptability of CAV
Cyclists and pedestrians typically rely on non-verbal cues given by the car’s driver (for example
eye contact, waving a hand, and posture) to assess whether it is safe to cross the road (Deb,
Rahman, Strawderman, & Garrison, 2018). When a computer system is controlling the car,
non-verbal communication becomes impossible. Multiple times researchers have suggested
that the inability to communicate with CAV as a pedestrian or cyclist could not only decrease
perceived safety, but affect trust as well (Deb, Rahman, Strawderman, & Garrison, 2018;
Habibovic et al., 2018; Deb, Strawderman, & Carruth, 2018). We therefore expected that those
who frequently cycle may find CAV less safe, have less trust in CAV technology, and find CAV
less acceptable. On the other hand, previous research has found that more experience with
(CAV) technology leads to greater trust and perceived safety of CAV (e.g. Penmetsa et al.,
2019). A qualitative study by Bennett, Vijaygopal, & Kottasz (2019) also indicated physically
disabled people with an interest in technology had greater trust in CAV. We expected that
interest in technology may play a moderating role, in that greater interest in technology
weakens the effect of cycling frequency on perceived safety and trust.
Drivers, compared to non-drivers, expect that automated vehicles can enhance performance
(Qu et al., 2019). The more driving experience a person has, the more often they drive, and the
more often they have been involved in conventional car-based traffic crashes, the more likely
they are to perceive automated vehicles as a safer alternative for their daily transportation
(Montoro et al., 2019). We expected that driving frequency is linked to perceived safety. It has
been found that people prefer manual control over automation if they believe that they are
more capable of executing a behaviour themselves as compared to the automated system (Lee
& Moray, 1994). This could impair their trust in an automated system such as CAV. As such, we
expected that driving frequency will be associated with trust in CAV technology.
Previous research has found that more experience with (CAV) technology leads to greater trust
and perceived safety of CAV (e.g. Penmetsa et al., 2019). A qualitative study by Bennett,
Vijaygopal, & Kottasz (2019) also indicated physically disabled people with an interest in
technology had greater trust in CAV. We expected that both technology interest and
experience with car technology may moderate the effect of driving frequency on perceived
safety and trust in CAV technology.
/ 13 Deliverable 1.2 Psychological model predicting acceptability of CAV
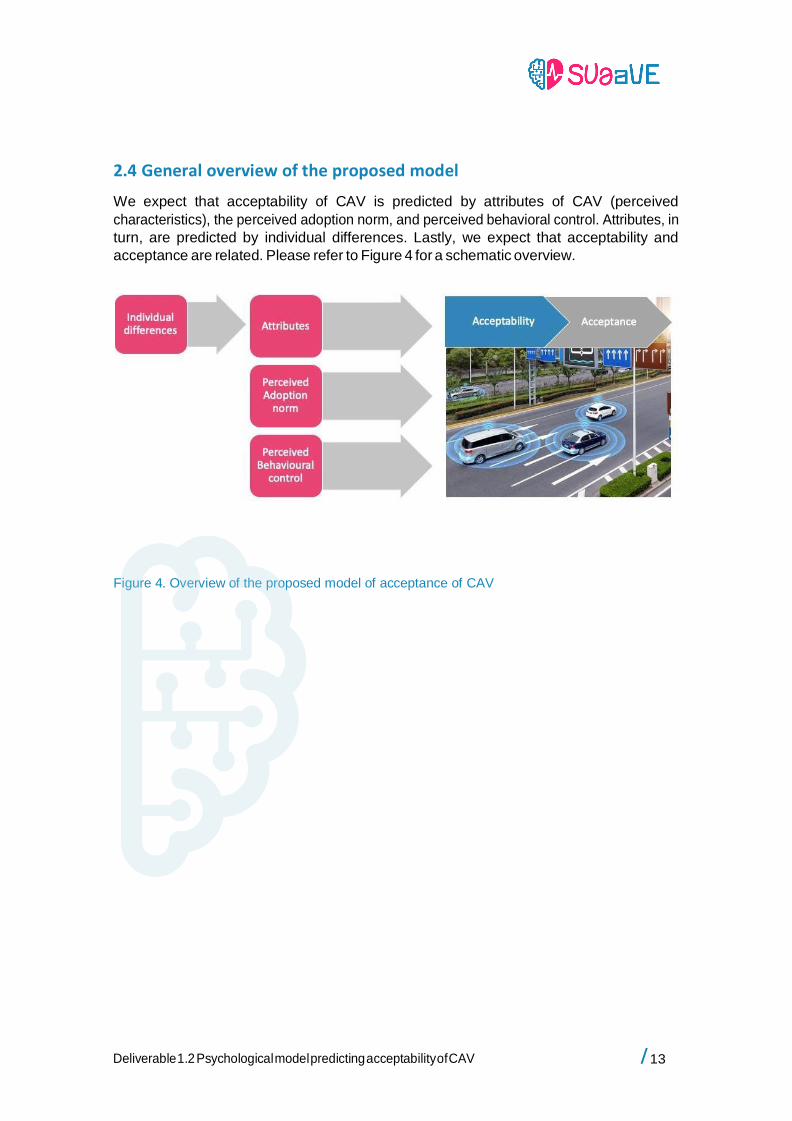
2.4 General overview of the proposed model
We expect that acceptability of CAV is predicted by attributes of CAV (perceived
characteristics), the perceived adoption norm, and perceived behavioral control. Attributes, in
turn, are predicted by individual differences. Lastly, we expect that acceptability and
acceptance are related. Please refer to Figure 4 for a schematic overview.
Figure 4. Overview of the proposed model of acceptance of CAV
14 / Deliverable 1.2 Psychological model predicting acceptability of CAV
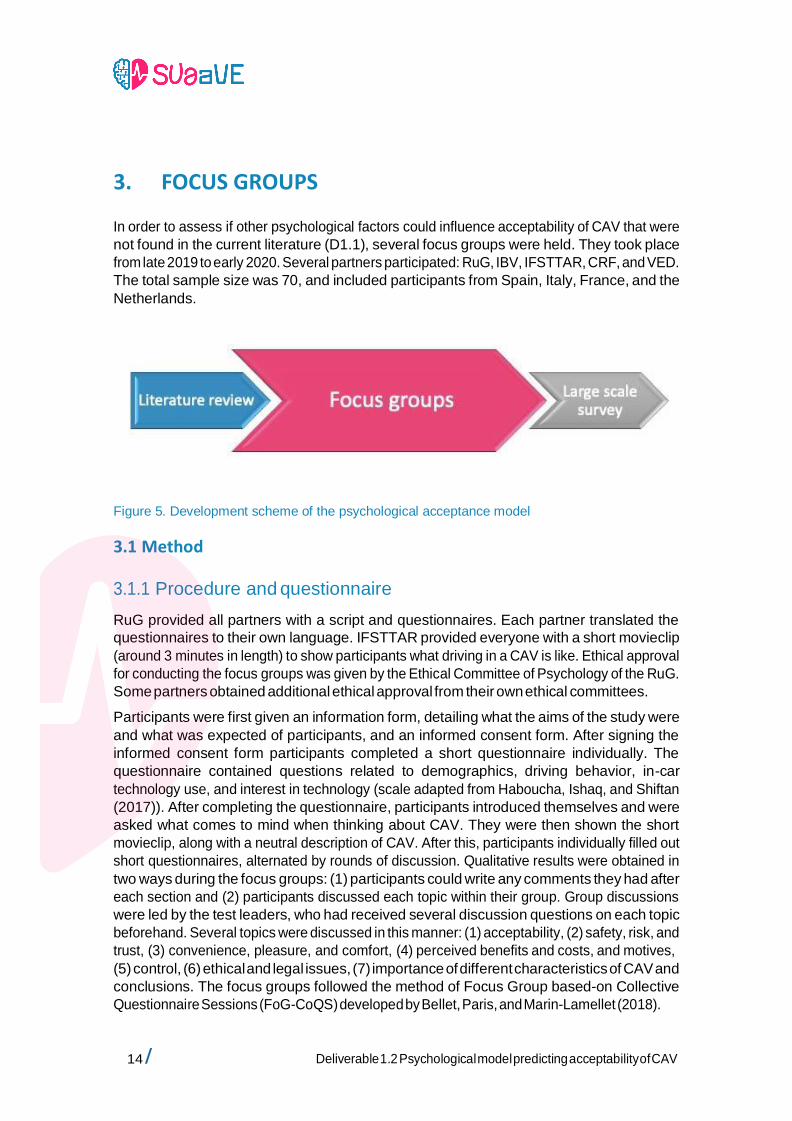
3. FOCUS GROUPS
In order to assess if other psychological factors could influence acceptability of CAV that were
not found in the current literature (D1.1), several focus groups were held. They took place
from late 2019 to early 2020. Several partners participated: RuG, IBV, IFSTTAR, CRF, and VED.
The total sample size was 70, and included participants from Spain, Italy, France, and the
Netherlands.
Figure 5. Development scheme of the psychological acceptance model
3.1 Method
3.1.1 Procedure and questionnaire
RuG provided all partners with a script and questionnaires. Each partner translated the
questionnaires to their own language. IFSTTAR provided everyone with a short movieclip
(around 3 minutes in length) to show participants what driving in a CAV is like. Ethical approval
for conducting the focus groups was given by the Ethical Committee of Psychology of the RuG.
Some partners obtained additional ethical approval from their own ethical committees.
Participants were first given an information form, detailing what the aims of the study were
and what was expected of participants, and an informed consent form. After signing the
informed consent form participants completed a short questionnaire individually. The
questionnaire contained questions related to demographics, driving behavior, in-car
technology use, and interest in technology (scale adapted from Haboucha, Ishaq, and Shiftan
(2017)). After completing the questionnaire, participants introduced themselves and were
asked what comes to mind when thinking about CAV. They were then shown the short
movieclip, along with a neutral description of CAV. After this, participants individually filled out
short questionnaires, alternated by rounds of discussion. Qualitative results were obtained in
two ways during the focus groups: (1) participants could write any comments they had after
each section and (2) participants discussed each topic within their group. Group discussions
were led by the test leaders, who had received several discussion questions on each topic
beforehand. Several topics were discussed in this manner: (1) acceptability, (2) safety, risk, and
trust, (3) convenience, pleasure, and comfort, (4) perceived benefits and costs, and motives,
(5) control, (6) ethical and legal issues, (7) importance of different characteristics of CAV and
conclusions. The focus groups followed the method of Focus Group based-on Collective
Questionnaire Sessions (FoG-CoQS) developed by Bellet, Paris, and Marin-Lamellet (2018).
/ 15 Deliverable 1.2 Psychological model predicting acceptability of CAV
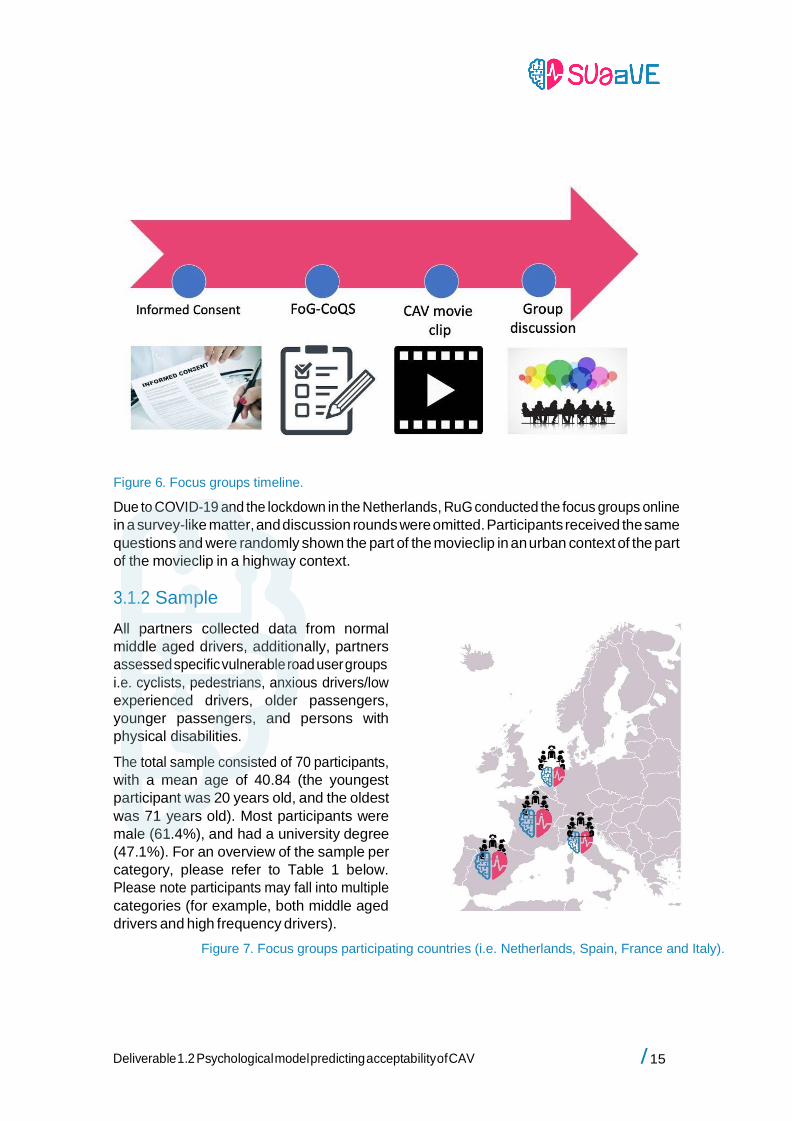
Figure 6. Focus groups timeline.
Due to COVID-19 and the lockdown in the Netherlands, RuG conducted the focus groups online
in a survey-like matter, and discussion rounds were omitted. Participants received the same
questions and were randomly shown the part of the movieclip in an urban context of the part
of the movieclip in a highway context.
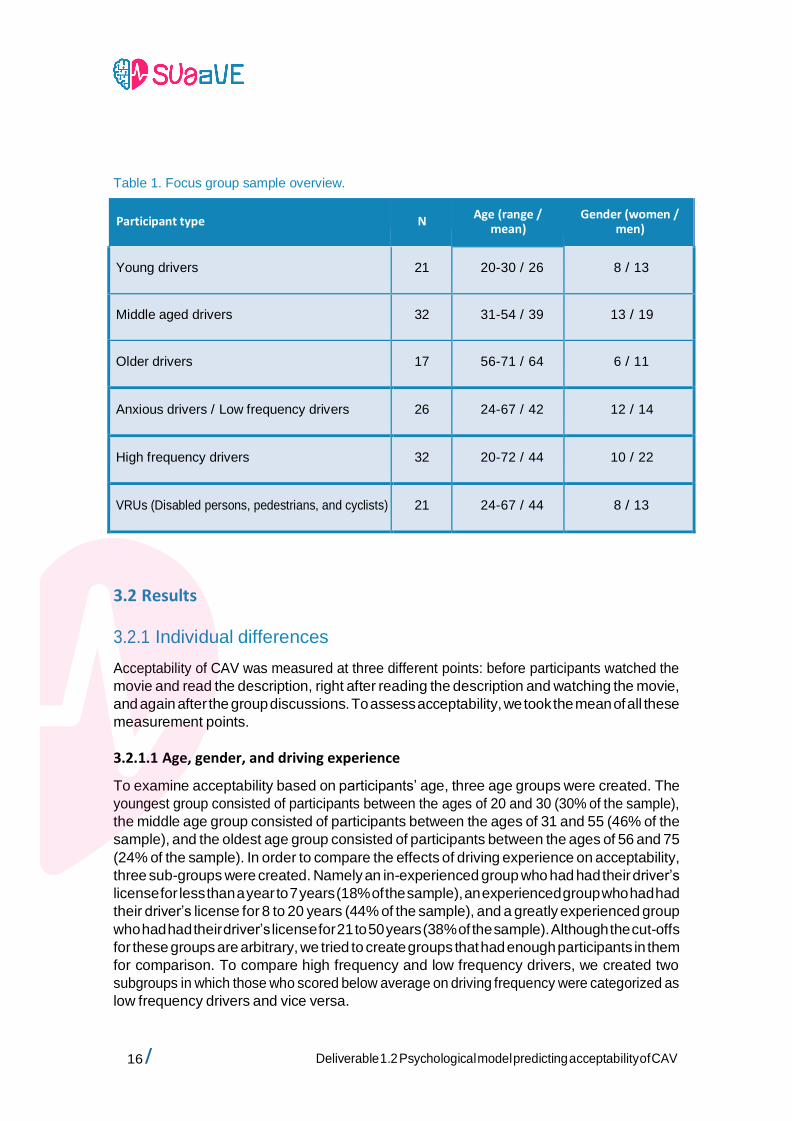
3.1.2 Sample
All partners collected data from normal
middle aged drivers, additionally, partners
assessed specific vulnerable road user groups
i.e. cyclists, pedestrians, anxious drivers/low
experienced drivers, older passengers,
younger passengers, and persons with
physical disabilities.
The total sample consisted of 70 participants,
with a mean age of 40.84 (the youngest
participant was 20 years old, and the oldest
was 71 years old). Most participants were
male (61.4%), and had a university degree
(47.1%). For an overview of the sample per
category, please refer to Table 1 below.
Please note participants may fall into multiple
categories (for example, both middle aged
drivers and high frequency drivers).
Figure 7. Focus groups participating countries (i.e. Netherlands, Spain, France and Italy).
16 / Deliverable 1.2 Psychological model predicting acceptability of CAV
Table 1. Focus group sample overview.
Participant type
N Age (range /
mean) Gender (women /
men)
Young drivers
21
20-30 / 26
8 / 13
Middle aged drivers
32
31-54 / 39
13 / 19
Older drivers
17
56-71 / 64
6 / 11
Anxious drivers / Low frequency drivers
26
24-67 / 42
12 / 14
High frequency drivers
32
20-72 / 44
10 / 22
VRUs (Disabled persons, pedestrians, and cyclists)
21
24-67 / 44
8 / 13
3.2 Results
3.2.1 Individual differences
Acceptability of CAV was measured at three different points: before participants watched the
movie and read the description, right after reading the description and watching the movie,
and again after the group discussions. To assess acceptability, we took the mean of all these
measurement points.
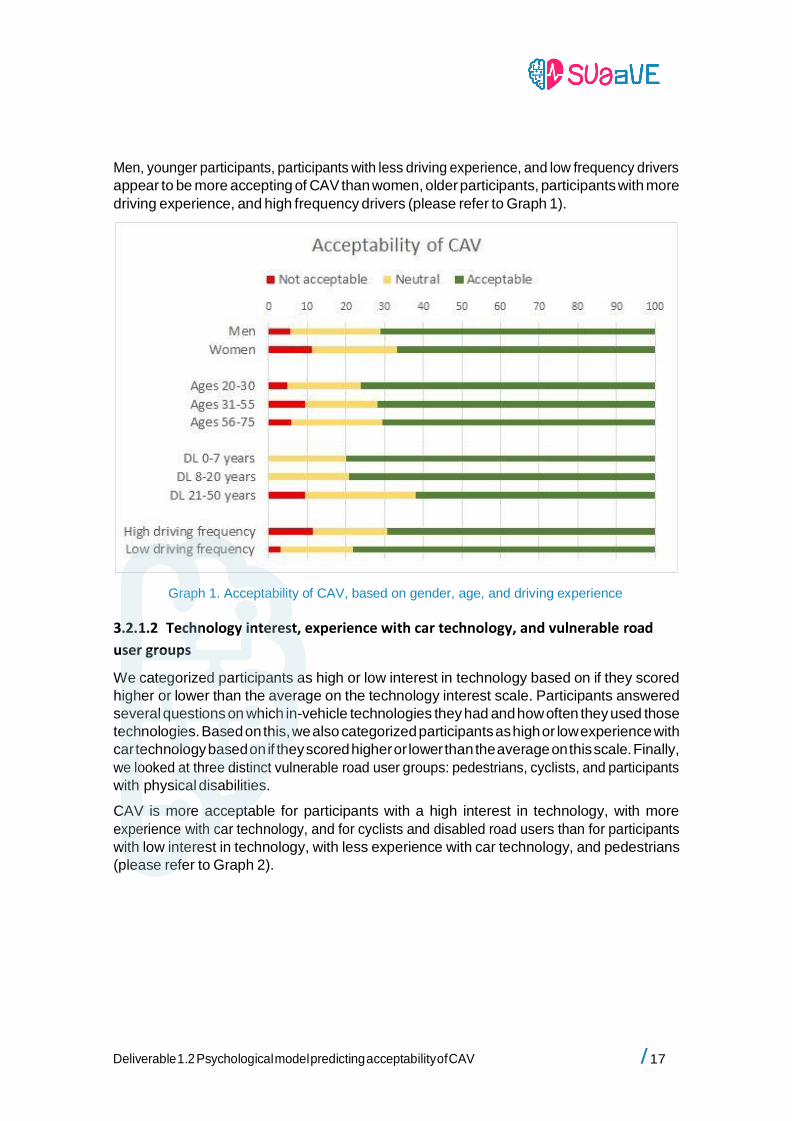
3.2.1.1 Age, gender, and driving experience
To examine acceptability based on participants’ age, three age groups were created. The
youngest group consisted of participants between the ages of 20 and 30 (30% of the sample),
the middle age group consisted of participants between the ages of 31 and 55 (46% of the
sample), and the oldest age group consisted of participants between the ages of 56 and 75
(24% of the sample). In order to compare the effects of driving experience on acceptability,
three sub-groups were created. Namely an in-experienced group who had had their driver’s
license for less than a year to 7 years (18% of the sample), an experienced group who had had
their driver’s license for 8 to 20 years (44% of the sample), and a greatly experienced group
who had had their driver’s license for 21 to 50 years (38% of the sample). Although the cut-offs
for these groups are arbitrary, we tried to create groups that had enough participants in them
for comparison. To compare high frequency and low frequency drivers, we created two
subgroups in which those who scored below average on driving frequency were categorized as
low frequency drivers and vice versa.
/ 17 Deliverable 1.2 Psychological model predicting acceptability of CAV
Men, younger participants, participants with less driving experience, and low frequency drivers
appear to be more accepting of CAV than women, older participants, participants with more
driving experience, and high frequency drivers (please refer to Graph 1).
Graph 1. Acceptability of CAV, based on gender, age, and driving experience
3.2.1.2 Technology interest, experience with car technology, and vulnerable road
user groups
We categorized participants as high or low interest in technology based on if they scored
higher or lower than the average on the technology interest scale. Participants answered
several questions on which in-vehicle technologies they had and how often they used those
technologies. Based on this, we also categorized participants as high or low experience with
car technology based on if they scored higher or lower than the average on this scale. Finally,
we looked at three distinct vulnerable road user groups: pedestrians, cyclists, and participants
with physical disabilities.
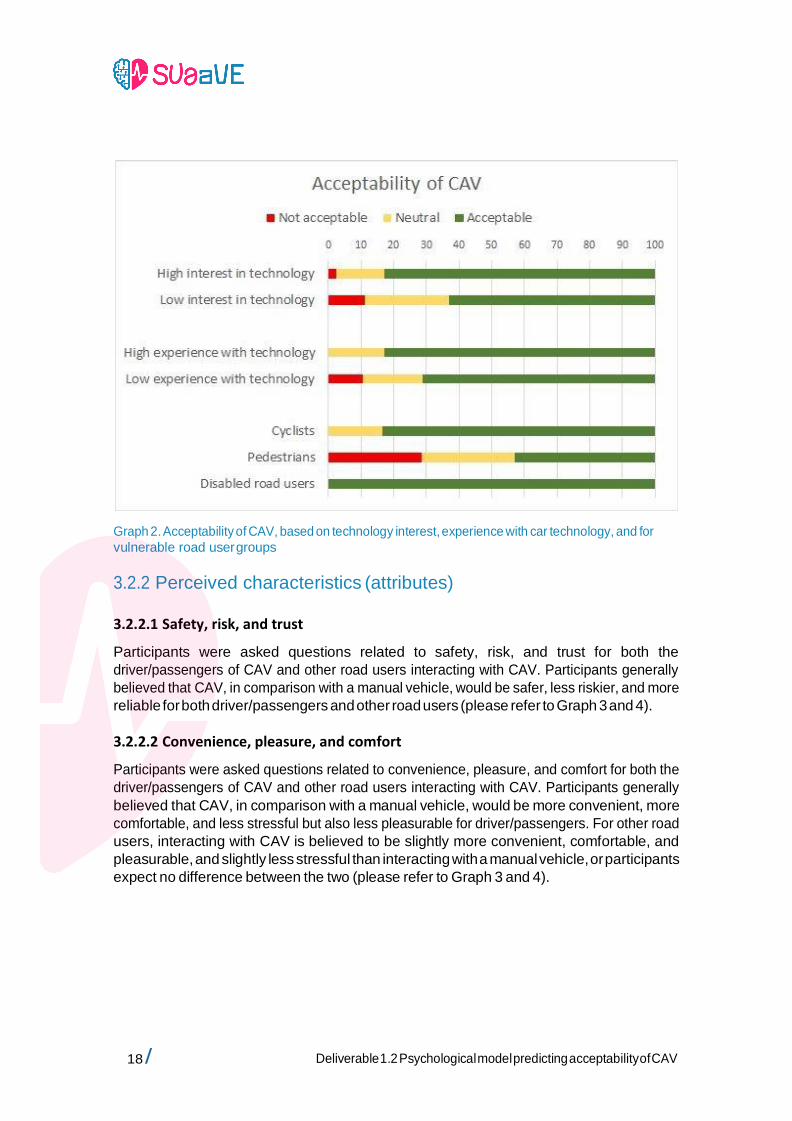
CAV is more acceptable for participants with a high interest in technology, with more
experience with car technology, and for cyclists and disabled road users than for participants
with low interest in technology, with less experience with car technology, and pedestrians
(please refer to Graph 2).
18 / Deliverable 1.2 Psychological model predicting acceptability of CAV
Graph 2. Acceptability of CAV, based on technology interest, experience with car technology, and for
vulnerable road user groups
3.2.2 Perceived characteristics (attributes)
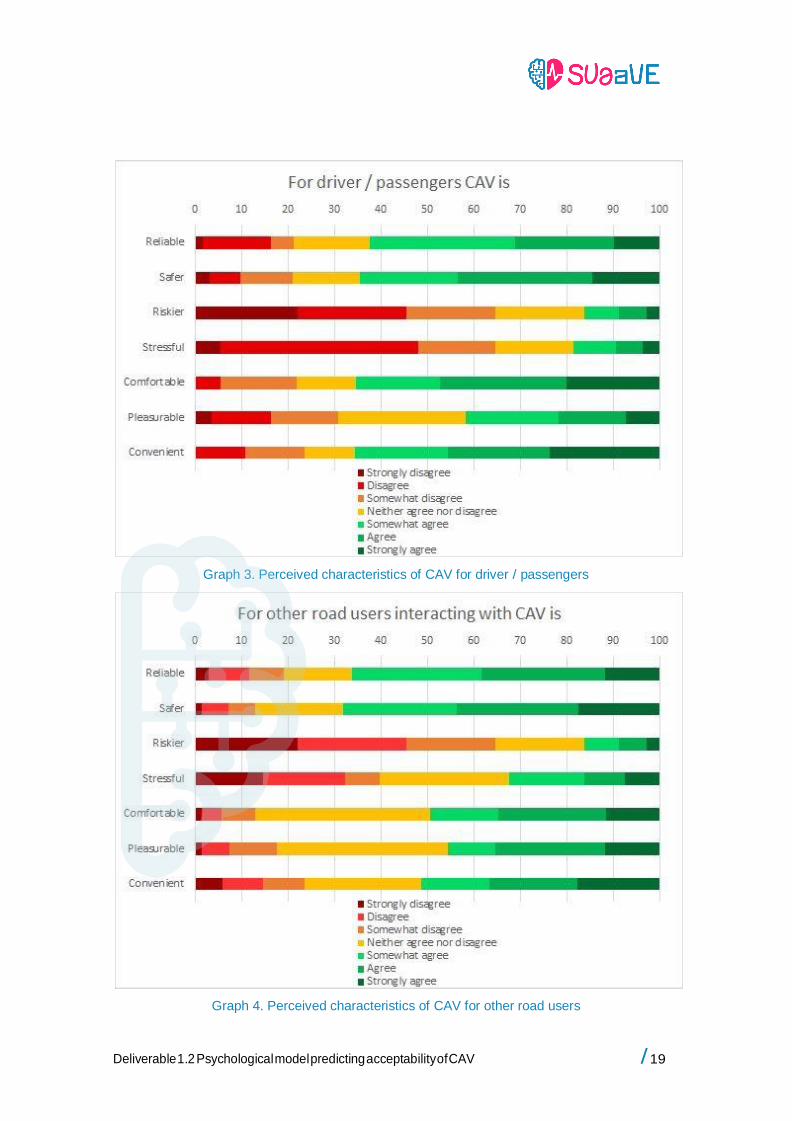
3.2.2.1 Safety, risk, and trust
Participants were asked questions related to safety, risk, and trust for both the
driver/passengers of CAV and other road users interacting with CAV. Participants generally
believed that CAV, in comparison with a manual vehicle, would be safer, less riskier, and more
reliable for both driver/passengers and other road users (please refer to Graph 3 and 4).
3.2.2.2 Convenience, pleasure, and comfort
Participants were asked questions related to convenience, pleasure, and comfort for both the
driver/passengers of CAV and other road users interacting with CAV. Participants generally
believed that CAV, in comparison with a manual vehicle, would be more convenient, more
comfortable, and less stressful but also less pleasurable for driver/passengers. For other road
users, interacting with CAV is believed to be slightly more convenient, comfortable, and
pleasurable, and slightly less stressful than interacting with a manual vehicle, or participants
expect no difference between the two (please refer to Graph 3 and 4).
/ 19 Deliverable 1.2 Psychological model predicting acceptability of CAV
Graph 3. Perceived characteristics of CAV for driver / passengers
Graph 4. Perceived characteristics of CAV for other road users
20 / Deliverable 1.2 Psychological model predicting acceptability of CAV
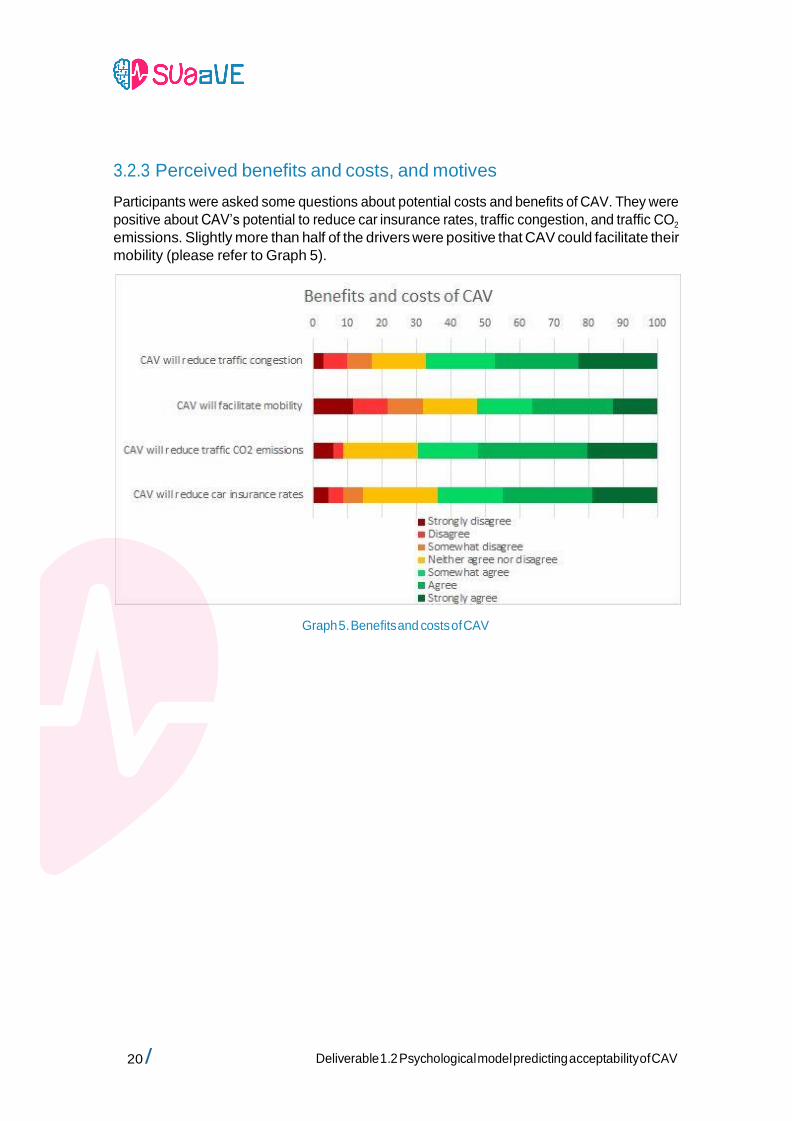
Graph 5. Benefits and costs of CAV
3.2.3 Perceived benefits and costs, and motives
Participants were asked some questions about potential costs and benefits of CAV. They were
positive about CAV’s potential to reduce car insurance rates, traffic congestion, and traffic CO2
emissions. Slightly more than half of the drivers were positive that CAV could facilitate their
mobility (please refer to Graph 5).
/ 21 Deliverable 1.2 Psychological model predicting acceptability of CAV
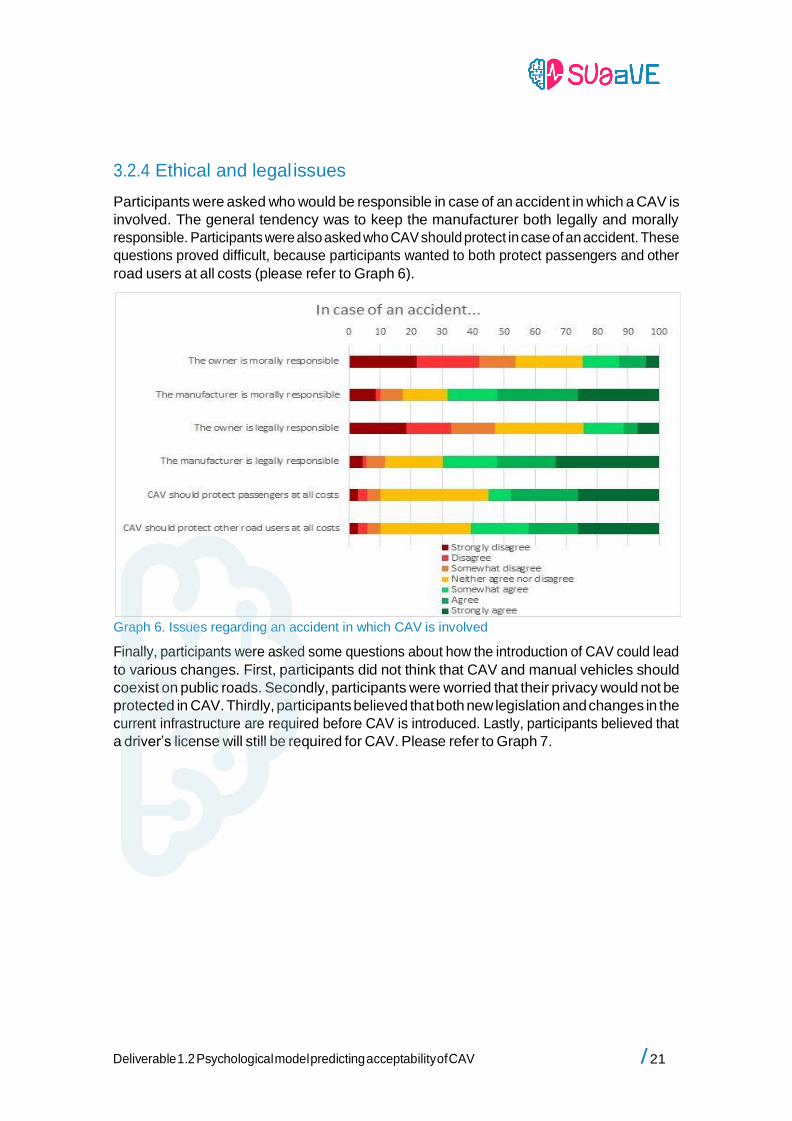
3.2.4 Ethical and legal issues
Participants were asked who would be responsible in case of an accident in which a CAV is
involved. The general tendency was to keep the manufacturer both legally and morally
responsible. Participants were also asked who CAV should protect in case of an accident. These
questions proved difficult, because participants wanted to both protect passengers and other
road users at all costs (please refer to Graph 6).
Graph 6. Issues regarding an accident in which CAV is involved
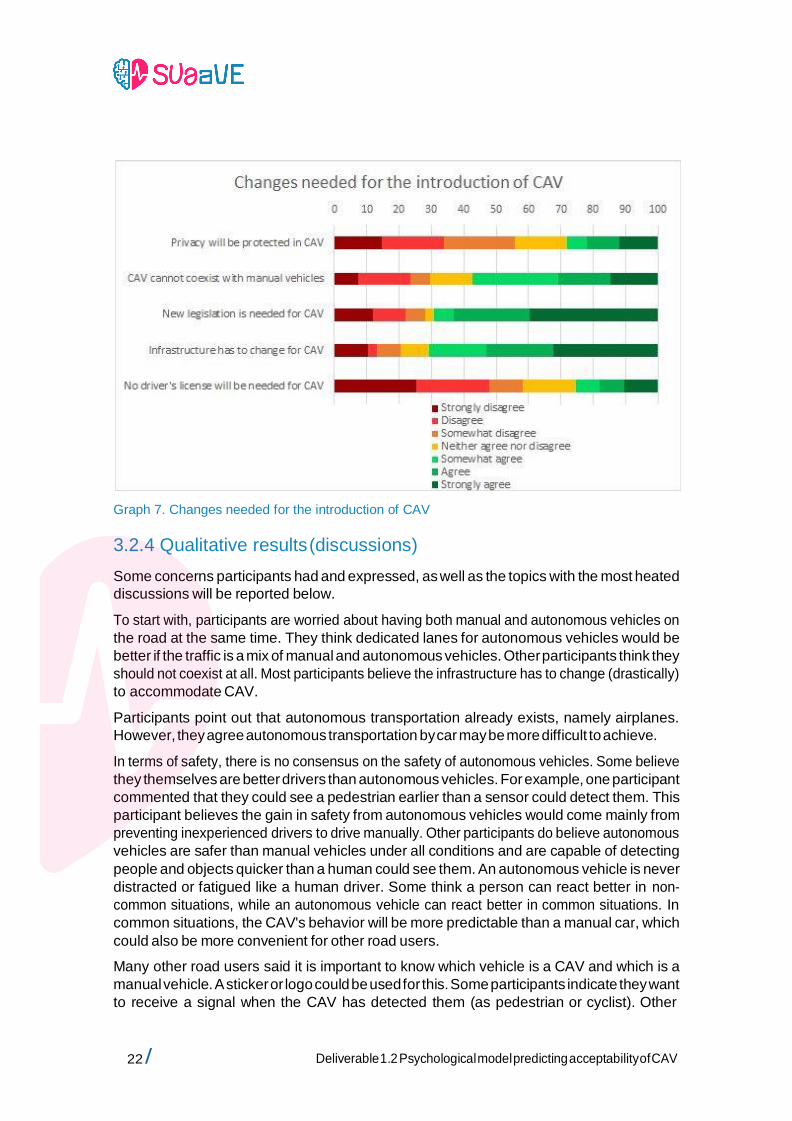
Finally, participants were asked some questions about how the introduction of CAV could lead
to various changes. First, participants did not think that CAV and manual vehicles should
coexist on public roads. Secondly, participants were worried that their privacy would not be
protected in CAV. Thirdly, participants believed that both new legislation and changes in the
current infrastructure are required before CAV is introduced. Lastly, participants believed that
a driver’s license will still be required for CAV. Please refer to Graph 7.
22 / Deliverable 1.2 Psychological model predicting acceptability of CAV
Graph 7. Changes needed for the introduction of CAV
3.2.4 Qualitative results (discussions)
Some concerns participants had and expressed, as well as the topics with the most heated
discussions will be reported below.
To start with, participants are worried about having both manual and autonomous vehicles on
the road at the same time. They think dedicated lanes for autonomous vehicles would be
better if the traffic is a mix of manual and autonomous vehicles. Other participants think they
should not coexist at all. Most participants believe the infrastructure has to change (drastically)
to accommodate CAV.
Participants point out that autonomous transportation already exists, namely airplanes.
However, they agree autonomous transportation by car may be more difficult to achieve.
In terms of safety, there is no consensus on the safety of autonomous vehicles. Some believe
they themselves are better drivers than autonomous vehicles. For example, one participant
commented that they could see a pedestrian earlier than a sensor could detect them. This
participant believes the gain in safety from autonomous vehicles would come mainly from
preventing inexperienced drivers to drive manually. Other participants do believe autonomous
vehicles are safer than manual vehicles under all conditions and are capable of detecting
people and objects quicker than a human could see them. An autonomous vehicle is never
distracted or fatigued like a human driver. Some think a person can react better in non-
common situations, while an autonomous vehicle can react better in common situations. In
common situations, the CAV's behavior will be more predictable than a manual car, which
could also be more convenient for other road users.
Many other road users said it is important to know which vehicle is a CAV and which is a
manual vehicle. A sticker or logo could be used for this. Some participants indicate they want
to receive a signal when the CAV has detected them (as pedestrian or cyclist). Other
/ 23 Deliverable 1.2 Psychological model predicting acceptability of CAV
participants dislike not being able to communicate with the driver, which makes some
participants feel unsafe.
While many participants believed the driving pleasure would be (almost) completely lost, they
think autonomous vehicles will eliminate stress factors and increase comfort for passengers.
Other participants indicate driving autonomously would increase their stress, especially at the
beginning. The stress could decrease if everything goes well. Many indicate the stress response
depends mainly on trust in the vehicle: if they trust the vehicle, it will not lead to more stress.
In terms of legal liability, a few participants indicate legal liability of the vehicle owner could
depend on maintenance. If the vehicle is poorly maintained, the owner is legally responsible;
otherwise the manufacturer is responsible. Most participants think the legislation must
drastically change to make legal liability clear. A few participants think the passengers would
still to some extent be morally responsible in case of an accident, even if the passengers are
not legally responsible. In case of an emergency, many participants believe the CAV should not
prioritize the passengers over other road users. They think the CAV should be 'neutral'. Others
think CAV should prioritize passengers, just like a manual driver would.
In a related vein, some participants think a new type of driver’s license will be required for
CAV. In order to get the license, people should learn how to operate a CAV, how the
administration works, and what to do in case of an error.
Even if the vehicle is 100% autonomous, some drivers would still like to be able to take over
control. On the other hand, some participants indicated a normal driver's license will be
required if the possibility of taking over control remains. This would mean an autonomous
vehicle cannot facilitate the mobility of persons who are unable to get a normal driver's
license. Others also indicate to like the idea of CAV when they are tired or have been drinking,
in which cases they would normally not drive.
In terms of environmental sustainability of CAV, most participants do not think about how CAV could reduce CO2 emission by driving closer to each other (platooning) than manual cars or by
reducing traffic jams. As such, most participants think electric cars would be better to reduce CO2 caused by traffic. They also fear an increase in mobility will increase traffic and congestion,
which will in turn increase CO2 emission. Some suggest making CAV electric.
One of the potential issues of CAV is the sharing of data. Most participants believe the sharing
of data is not problematic, as long as private data is not shared. Only data needed for the
algorithms (and that helps society) and data that is anonymous should be shared. If privacy
cannot be guaranteed, CAV may not be acceptable to several participants.
3.3 Conclusion
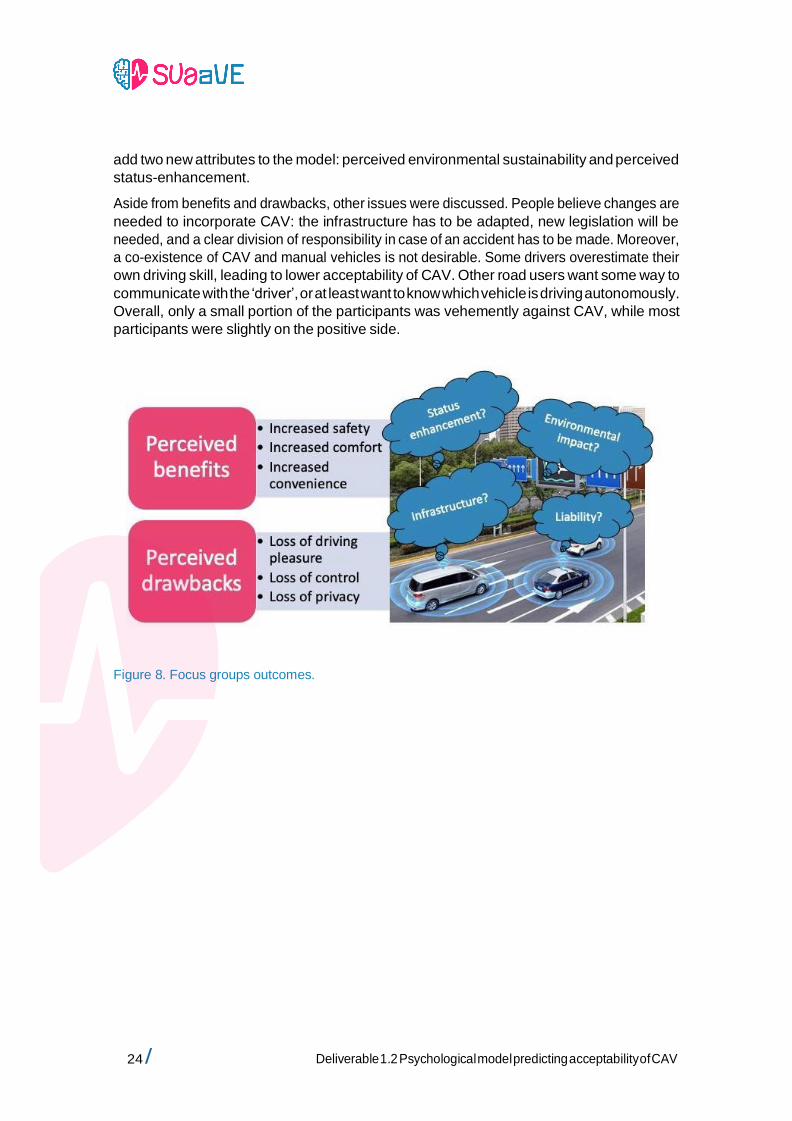
The focus groups show that people see both potential benefits and drawbacks of CAV. The
main benefits that people expect are an increase of safety, convenience and comfort, mainly
for the driver/passengers. The main drawbacks that people expect are a loss of driving
pleasure, control, and privacy (through data-sharing). While these themes were also present in
the literature review (D1.1), some other themes were discussed in the focused groups as well.
For instance, some participants were actively thinking about the environmental impact of CAV
and indicated they would find CAV more acceptable if it was electric. Some participants also
indicated seeing CAV as a status-product, for example by stating CAV would be expensive and
should not be available to everyone. Based on these results of the focus groups, we decided to
24 / Deliverable 1.2 Psychological model predicting acceptability of CAV
add two new attributes to the model: perceived environmental sustainability and perceived
status-enhancement.
Aside from benefits and drawbacks, other issues were discussed. People believe changes are
needed to incorporate CAV: the infrastructure has to be adapted, new legislation will be
needed, and a clear division of responsibility in case of an accident has to be made. Moreover,
a co-existence of CAV and manual vehicles is not desirable. Some drivers overestimate their
own driving skill, leading to lower acceptability of CAV. Other road users want some way to
communicate with the ‘driver’, or at least want to know which vehicle is driving autonomously.
Overall, only a small portion of the participants was vehemently against CAV, while most
participants were slightly on the positive side.
Figure 8. Focus groups outcomes.
/ 25 Deliverable 1.2 Psychological model predicting acceptability of CAV
4. LARGE SCALE SURVEY
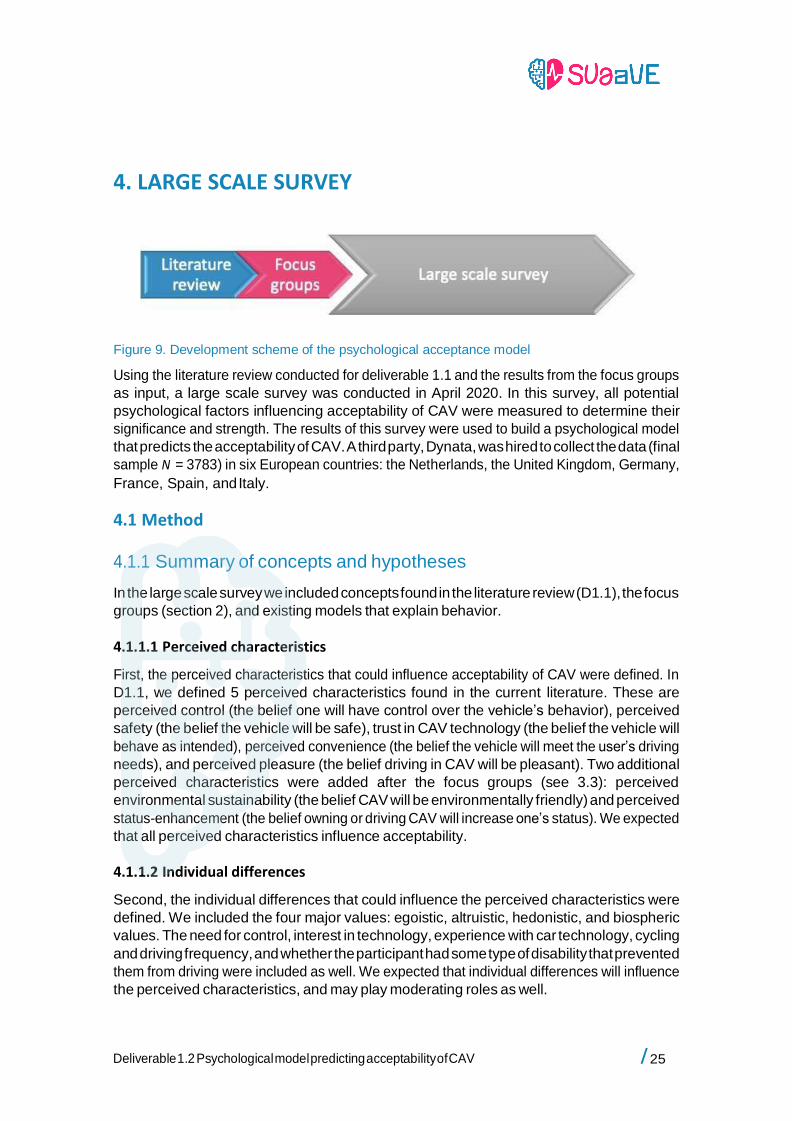
Figure 9. Development scheme of the psychological acceptance model
Using the literature review conducted for deliverable 1.1 and the results from the focus groups
as input, a large scale survey was conducted in April 2020. In this survey, all potential
psychological factors influencing acceptability of CAV were measured to determine their
significance and strength. The results of this survey were used to build a psychological model
that predicts the acceptability of CAV. A third party, Dynata, was hired to collect the data (final
sample N = 3783) in six European countries: the Netherlands, the United Kingdom, Germany,
France, Spain, and Italy.
4.1 Method
4.1.1 Summary of concepts and hypotheses
In the large scale survey we included concepts found in the literature review (D1.1), the focus
groups (section 2), and existing models that explain behavior.
4.1.1.1 Perceived characteristics
First, the perceived characteristics that could influence acceptability of CAV were defined. In
D1.1, we defined 5 perceived characteristics found in the current literature. These are
perceived control (the belief one will have control over the vehicle’s behavior), perceived
safety (the belief the vehicle will be safe), trust in CAV technology (the belief the vehicle will
behave as intended), perceived convenience (the belief the vehicle will meet the user’s driving
needs), and perceived pleasure (the belief driving in CAV will be pleasant). Two additional
perceived characteristics were added after the focus groups (see 3.3): perceived
environmental sustainability (the belief CAV will be environmentally friendly) and perceived
status-enhancement (the belief owning or driving CAV will increase one’s status). We expected
that all perceived characteristics influence acceptability.
4.1.1.2 Individual differences
Second, the individual differences that could influence the perceived characteristics were
defined. We included the four major values: egoistic, altruistic, hedonistic, and biospheric
values. The need for control, interest in technology, experience with car technology, cycling
and driving frequency, and whether the participant had some type of disability that prevented
them from driving were included as well. We expected that individual differences will influence
the perceived characteristics, and may play moderating roles as well.
26 / Deliverable 1.2 Psychological model predicting acceptability of CAV
4.1.1.3 Other variables used in existing models
Lastly, we added additional variables that are included in existing models that predict
behavior. We examined the Theory of Planned Behavior (TPB), a very general model that
explains intentions and behaviors, the Technology Acceptance Model (TAM), a model that
explains acceptance of technological innovations, and the extended Instrumental, Symbolic,
and Environmental (ISE) model, a model that explains adoption likelihood of sustainable
innovations.
We included perceived behavioral control (the belief as to how easy or difficult it would be to
perform the behavior), which is used in both TPB and TAM, expected adoption norm (what
percentage of close others the person believes will adopt CAV), which is used in both TPB and
ISE, and the moderating effect of expected adoption norm from ISE.
4.1.2 Procedure and questionnaire
The large scale survey was conducted as an online questionnaire. The survey was translated by
a professional translator of Dynata to all languages, and the translations were checked by the
partners (native speakers). Participants first received information about the study’s aims and
what was expected of them, and they were asked for informed consent. After giving consent,
the survey started.
Participants were first asked about their values to measure egoistic, altruistic, hedonistic, and
biospheric values (Schwartz, 1992), using the same methodology as Steg, Perlaviciute, van der
Werff, and Lurvink (2012). Next, participants were given a short neutral description of what a
CAV is, followed by 21 statements to which they could agree or disagree (7-point Likert scales).
The statements assessed different characteristics of CAV: (1) perceived control, (2) perceived
pleasure, (3) perceived safety, (4) perceived convenience, (5) trust in CAV technology, (6)
perceived status-enhancement, and (7) perceived environmental sustainability. The
statements were adapted from existing literature or created for this survey. Participants were
also asked to indicate how important each characteristic of CAV is to them.
Next, participants were asked about their driving and cycling behavior, use of in-car
technology, interest in technology (scale adapted from Haboucha, Ishaq, and Shiftan, 2017),
their perceived behavioral control, what percentage of their friends and family they expected
to adopt CAV, acceptability of CAV (scale adapted from De Groot and Steg, 2007), need for
control (scale adapted from Burger and Cooper, 1979), and demographics. Finally, participants
were thanked and could leave any comments they had.
4.1.3 Sample
In total, we aimed at about 650 valid responses per country (total N ~ 3900). In total, 7600
responses were collected. Responses were excluded from the sample if: (1) they completed
less than 80% of the survey, (2) they completed the survey in under 3 minutes (estimated time
of completion was 10-15 minutes), (3) they clicked the same answer on each question
(straightlining) on questions where they were explicitly asked to include variation in their
answers or on reverse-coded questions, (4) they left nonsense (such as random words or
numbers, or comments that clearly indicated they did not fill out the survey seriously) in the
comment box in combination with signs of straightlining. The final sample consisted of 3783
/ 27 Deliverable 1.2 Psychological model predicting acceptability of CAV
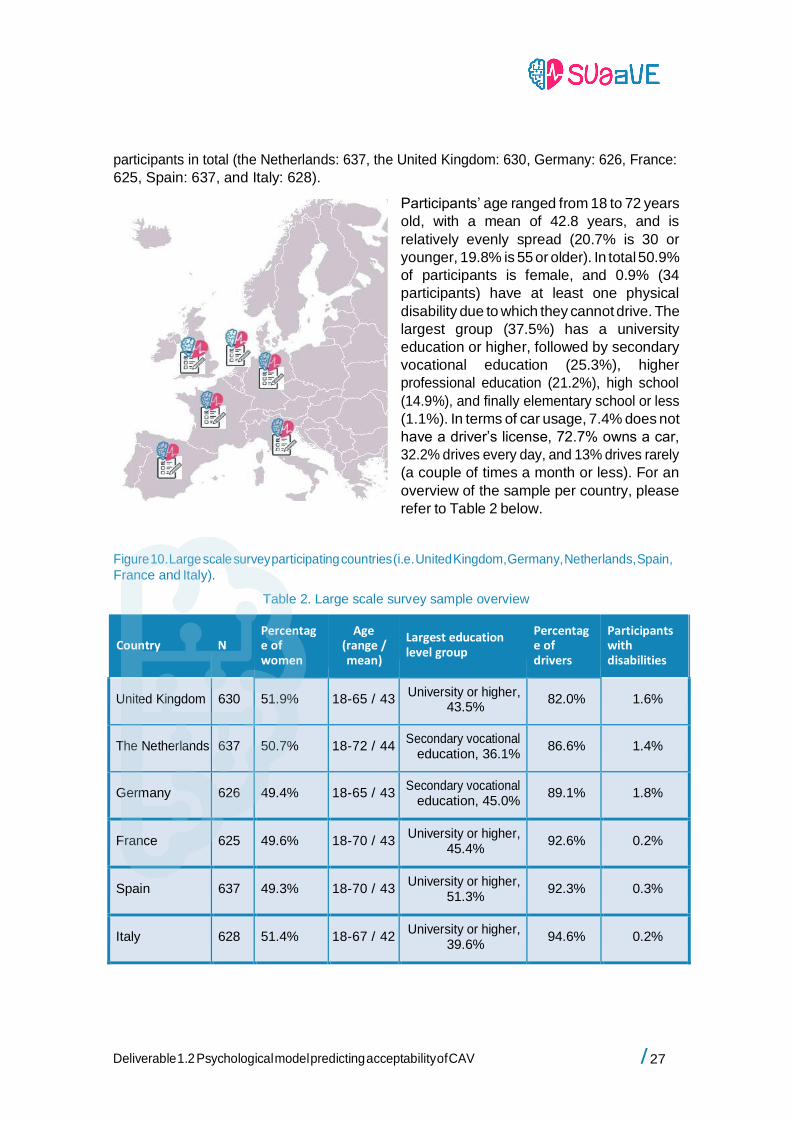
participants in total (the Netherlands: 637, the United Kingdom: 630, Germany: 626, France:
625, Spain: 637, and Italy: 628).
Participants’ age ranged from 18 to 72 years
old, with a mean of 42.8 years, and is
relatively evenly spread (20.7% is 30 or
younger, 19.8% is 55 or older). In total 50.9%
of participants is female, and 0.9% (34
participants) have at least one physical
disability due to which they cannot drive. The
largest group (37.5%) has a university
education or higher, followed by secondary
vocational education (25.3%), higher
professional education (21.2%), high school
(14.9%), and finally elementary school or less
(1.1%). In terms of car usage, 7.4% does not
have a driver’s license, 72.7% owns a car,
32.2% drives every day, and 13% drives rarely
(a couple of times a month or less). For an
overview of the sample per country, please
refer to Table 2 below.
Figure 10. Large scale survey participating countries (i.e. United Kingdom, Germany, Netherlands, Spain,
France and Italy).
Table 2. Large scale survey sample overview
Country
N
Percentag e of women
Age (range / mean)
Largest education level group
Percentag e of drivers
Participants with disabilities
United Kingdom
630
51.9%
18-65 / 43 University or higher,
43.5%
82.0%
1.6%
The Netherlands
637
50.7%
18-72 / 44 Secondary vocational
education, 36.1%
86.6%
1.4%
Germany
626
49.4%
18-65 / 43 Secondary vocational
education, 45.0%
89.1%
1.8%
France
625
49.6%
18-70 / 43 University or higher,
45.4%
92.6%
0.2%
Spain
637
49.3%
18-70 / 43 University or higher,
51.3%
92.3%
0.3%
Italy
628
51.4%
18-67 / 42 University or higher,
39.6%
94.6%
0.2%
28 / Deliverable 1.2 Psychological model predicting acceptability of CAV
4.2 Results
We analyzed the data to test our proposed model. The result section of the large scale survey
is structured in the following manner:
1. Reliability of used scales (4.2.1); to test some concepts we created our own scales, we
tested if these scales were reliable.
2. General inspection of the data (4.2.2); we looked at how participants rated CAV in
general and the mean scores are reported.
3. Confirmatory Factor Analysis (CFA) (4.2.3); we hypothesized that attributes are divided
into 7 independent variables, namely the perceived characteristics. We performed a
CFA to test whether or not they are independent factors.
4. Perceived characteristics (attributes) influencing acceptability (4.2.4); we tested the
first part of the model, namely that attributes influence acceptability. We examined all
perceived characteristics separately, as well as together.
5. Individual differences influencing attributes (4.2.5); we tested the second part of the
model, namely that individual differences (values and need for control) influence
attributes.
6. Differences between user groups (4.2.6); CAV should be acceptable for all kinds of
different user groups. We analyzed acceptability, attributes, and importance of
attributes among several user groups.
7. Perceived adoption norm (4.2.7); we tested the third part of the model, namely that
perceived adoption norm can act as a moderator.
8. The test of the full model is presented in section 5.
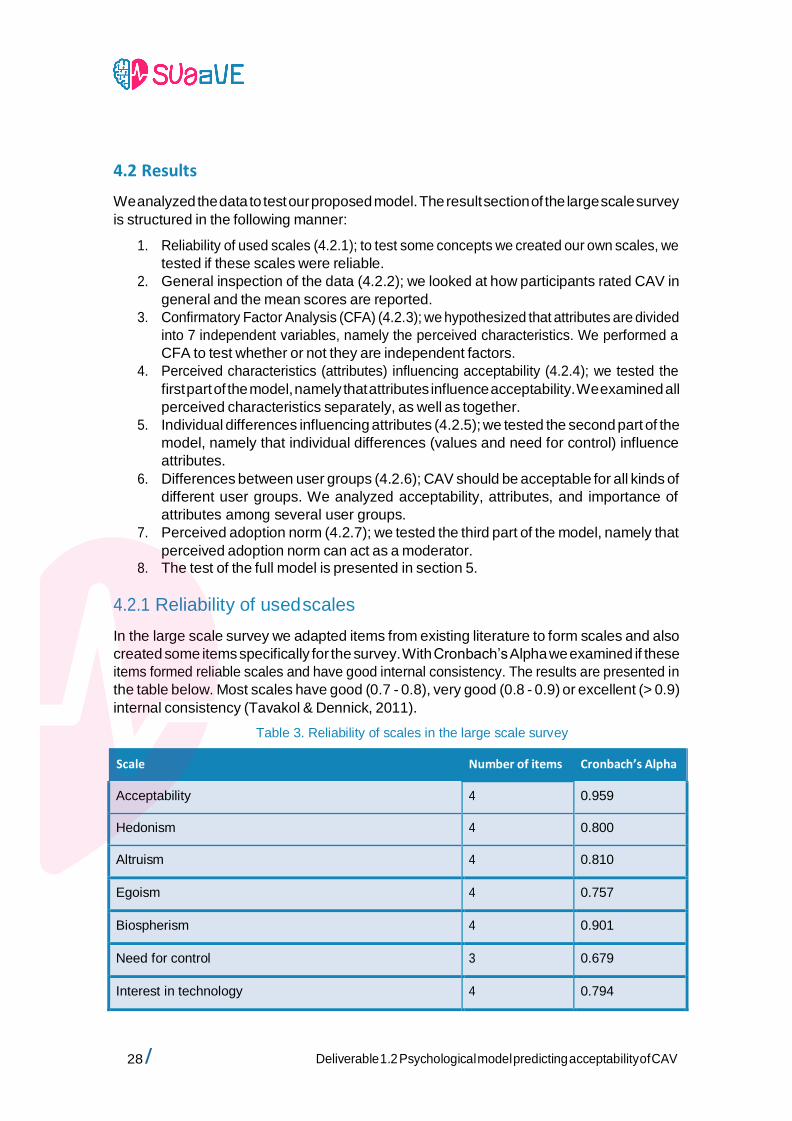
4.2.1 Reliability of used scales
In the large scale survey we adapted items from existing literature to form scales and also
created some items specifically for the survey. With Cronbach’s Alpha we examined if these
items formed reliable scales and have good internal consistency. The results are presented in
the table below. Most scales have good (0.7 - 0.8), very good (0.8 - 0.9) or excellent (> 0.9)
internal consistency (Tavakol & Dennick, 2011).
Table 3. Reliability of scales in the large scale survey
Scale Number of items Cronbach’s Alpha
Acceptability 4 0.959
Hedonism 4 0.800
Altruism 4 0.810
Egoism 4 0.757
Biospherism 4 0.901
Need for control 3 0.679
Interest in technology 4 0.794
/ 29 Deliverable 1.2 Psychological model predicting acceptability of CAV
Experience with car technology 8 0.896
Perceived control 3 0.666
Perceived pleasure 3 0.795
Perceived safety 3 0.729
Perceived convenience 3 0.877
Trust in CAV technology 3 0.885
Perceived status-enhancement 3 0.923
Perceived environmental sustainability 3 0.943
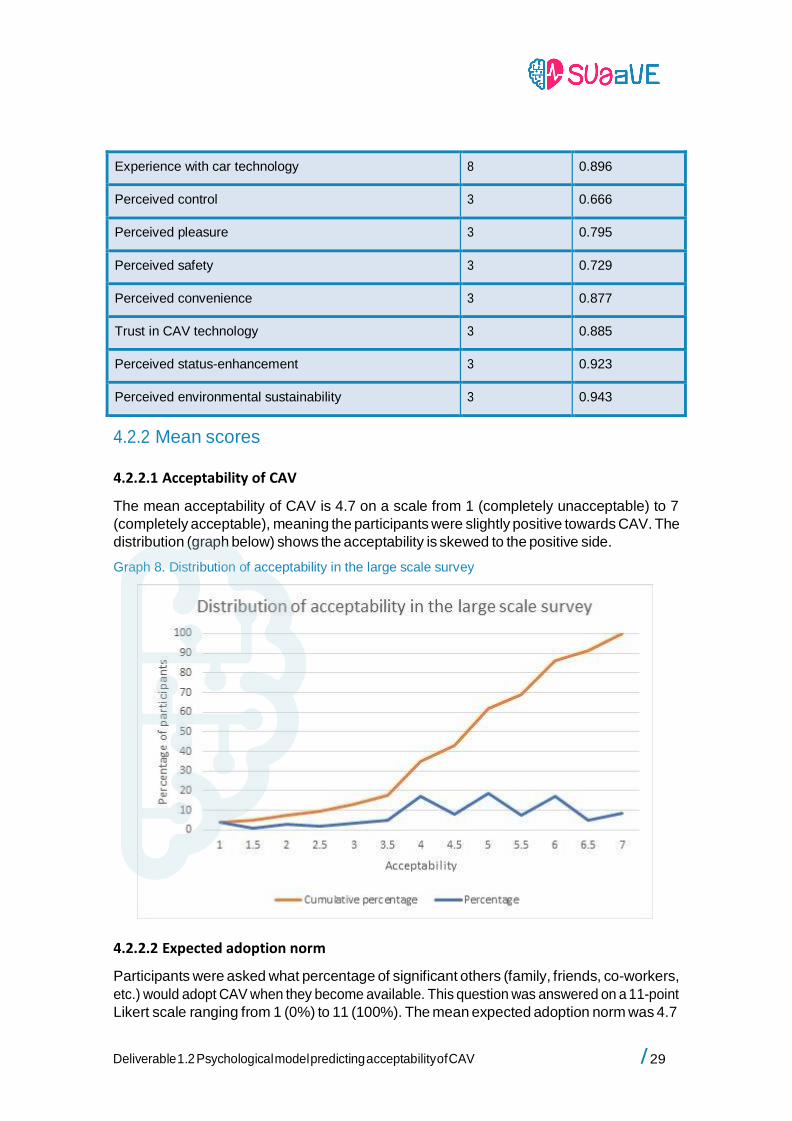
4.2.2 Mean scores
4.2.2.1 Acceptability of CAV
The mean acceptability of CAV is 4.7 on a scale from 1 (completely unacceptable) to 7
(completely acceptable), meaning the participants were slightly positive towards CAV. The
distribution (graph below) shows the acceptability is skewed to the positive side.
Graph 8. Distribution of acceptability in the large scale survey
4.2.2.2 Expected adoption norm
Participants were asked what percentage of significant others (family, friends, co-workers,
etc.) would adopt CAV when they become available. This question was answered on a 11-point
Likert scale ranging from 1 (0%) to 11 (100%). The mean expected adoption norm was 4.7
30 / Deliverable 1.2 Psychological model predicting acceptability of CAV
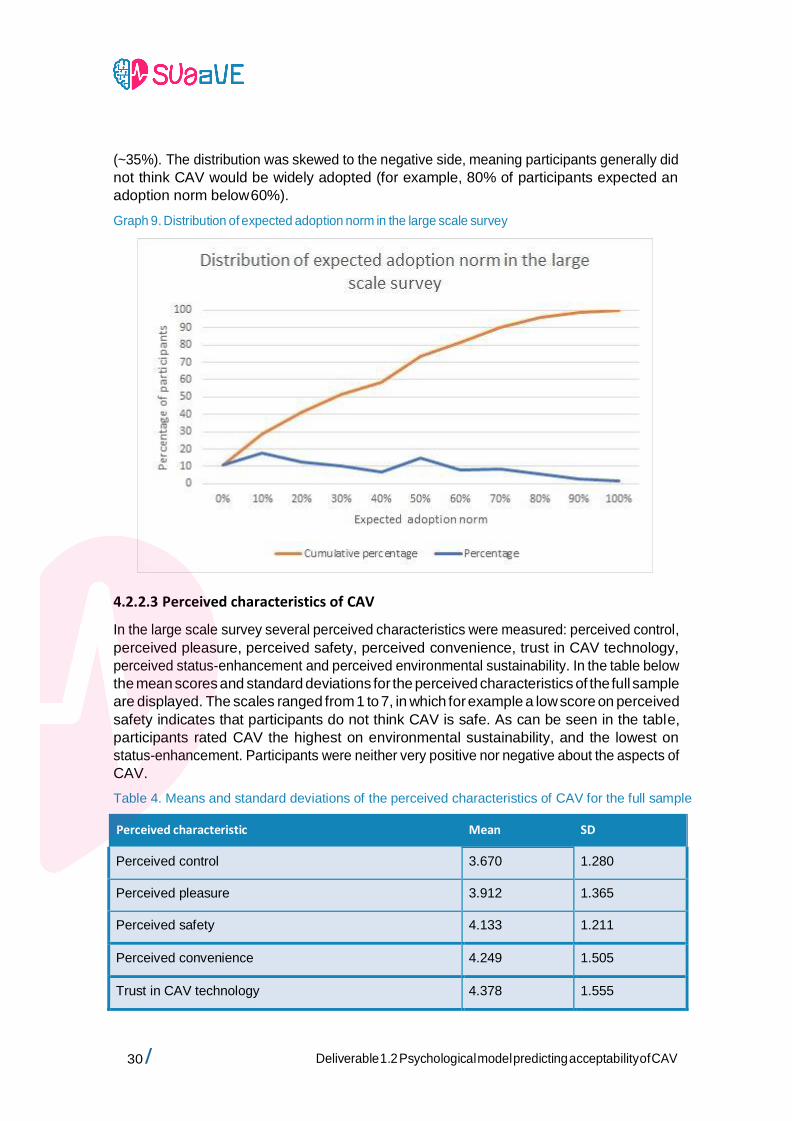
(~35%). The distribution was skewed to the negative side, meaning participants generally did
not think CAV would be widely adopted (for example, 80% of participants expected an
adoption norm below 60%).
Graph 9. Distribution of expected adoption norm in the large scale survey
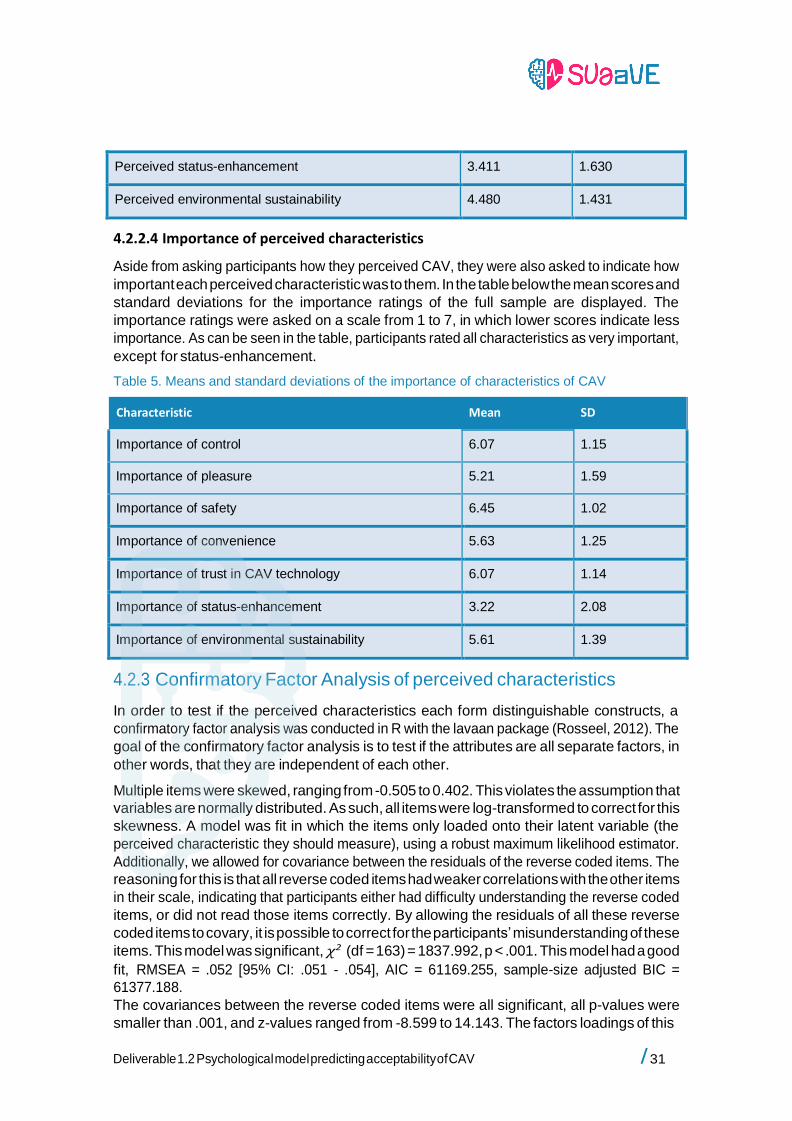
4.2.2.3 Perceived characteristics of CAV
In the large scale survey several perceived characteristics were measured: perceived control,
perceived pleasure, perceived safety, perceived convenience, trust in CAV technology,
perceived status-enhancement and perceived environmental sustainability. In the table below
the mean scores and standard deviations for the perceived characteristics of the full sample
are displayed. The scales ranged from 1 to 7, in which for example a low score on perceived
safety indicates that participants do not think CAV is safe. As can be seen in the table,
participants rated CAV the highest on environmental sustainability, and the lowest on
status-enhancement. Participants were neither very positive nor negative about the aspects of
CAV.
Table 4. Means and standard deviations of the perceived characteristics of CAV for the full sample
Perceived characteristic Mean SD
Perceived control 3.670 1.280
Perceived pleasure 3.912 1.365
Perceived safety 4.133 1.211
Perceived convenience 4.249 1.505
Trust in CAV technology 4.378 1.555
/ 31 Deliverable 1.2 Psychological model predicting acceptability of CAV
Perceived status-enhancement 3.411 1.630
Perceived environmental sustainability 4.480 1.431
4.2.2.4 Importance of perceived characteristics
Aside from asking participants how they perceived CAV, they were also asked to indicate how
important each perceived characteristic was to them. In the table below the mean scores and
standard deviations for the importance ratings of the full sample are displayed. The
importance ratings were asked on a scale from 1 to 7, in which lower scores indicate less
importance. As can be seen in the table, participants rated all characteristics as very important,
except for status-enhancement.
Table 5. Means and standard deviations of the importance of characteristics of CAV
Characteristic Mean SD
Importance of control 6.07 1.15
Importance of pleasure 5.21 1.59
Importance of safety 6.45 1.02
Importance of convenience 5.63 1.25
Importance of trust in CAV technology 6.07 1.14
Importance of status-enhancement 3.22 2.08
Importance of environmental sustainability 5.61 1.39
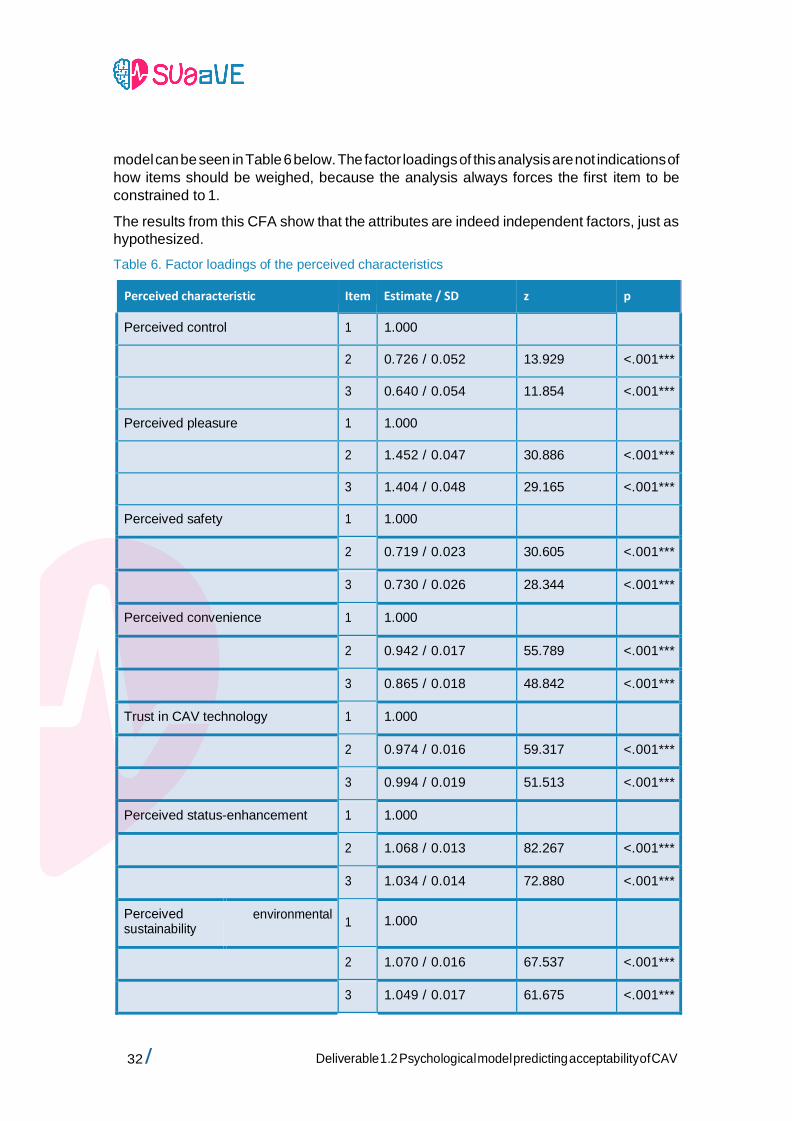
4.2.3 Confirmatory Factor Analysis of perceived characteristics
In order to test if the perceived characteristics each form distinguishable constructs, a
confirmatory factor analysis was conducted in R with the lavaan package (Rosseel, 2012). The
goal of the confirmatory factor analysis is to test if the attributes are all separate factors, in
other words, that they are independent of each other.
Multiple items were skewed, ranging from -0.505 to 0.402. This violates the assumption that
variables are normally distributed. As such, all items were log-transformed to correct for this
skewness. A model was fit in which the items only loaded onto their latent variable (the
perceived characteristic they should measure), using a robust maximum likelihood estimator.
Additionally, we allowed for covariance between the residuals of the reverse coded items. The
reasoning for this is that all reverse coded items had weaker correlations with the other items
in their scale, indicating that participants either had difficulty understanding the reverse coded
items, or did not read those items correctly. By allowing the residuals of all these reverse
coded items to covary, it is possible to correct for the participants’ misunderstanding of these
items. This model was significant, 𝜒2 (df = 163) = 1837.992, p < .001. This model had a good
fit, RMSEA = .052 [95% CI: .051 - .054], AIC = 61169.255, sample-size adjusted BIC =
61377.188.
The covariances between the reverse coded items were all significant, all p-values were
smaller than .001, and z-values ranged from -8.599 to 14.143. The factors loadings of this
32 / Deliverable 1.2 Psychological model predicting acceptability of CAV
model can be seen in Table 6 below. The factor loadings of this analysis are not indications of
how items should be weighed, because the analysis always forces the first item to be
constrained to 1.
The results from this CFA show that the attributes are indeed independent factors, just as
hypothesized.
Table 6. Factor loadings of the perceived characteristics
Perceived characteristic Item Estimate / SD z p
Perceived control 1 1.000
2 0.726 / 0.052 13.929 <.001***
3 0.640 / 0.054 11.854 <.001***
Perceived pleasure 1 1.000
2 1.452 / 0.047 30.886 <.001***
3 1.404 / 0.048 29.165 <.001***
Perceived safety 1 1.000
2 0.719 / 0.023 30.605 <.001***
3 0.730 / 0.026 28.344 <.001***
Perceived convenience 1 1.000
2 0.942 / 0.017 55.789 <.001***
3 0.865 / 0.018 48.842 <.001***
Trust in CAV technology 1 1.000
2 0.974 / 0.016 59.317 <.001***
3 0.994 / 0.019 51.513 <.001***
Perceived status-enhancement 1 1.000
2 1.068 / 0.013 82.267 <.001***
3 1.034 / 0.014 72.880 <.001***
Perceived sustainability
environmental
1
1.000
2 1.070 / 0.016 67.537 <.001***
3 1.049 / 0.017 61.675 <.001***
/ 33 Deliverable 1.2 Psychological model predicting acceptability of CAV
The first item of each scale is always constrained to 1, *** = significant at the .001 level
4.2.4 Perceived characteristics influencing acceptability
In deliverable 1.1 we posited that how participants perceive CAV influences their acceptability
of CAV. In the large scale survey several perceived characteristics were measured: perceived
control, perceived pleasure, perceived safety, perceived convenience, trust in CAV technology,
perceived status-enhancement and perceived environmental sustainability. Each perceived
characteristic was measured using three items. To calculate the values for the perceived
characteristics, we took the average of the all three items. Although we found in the CFA
(4.2.3) that participants had had some difficulties with the reverse coded items, the scales
were still reliable (see section 4.2.1 for Cronbach’s Alpha scores).
First, separate regression analyses were run to investigate if each perceived characteristic
indeed is related to acceptability. Different control variables were included per analysis, based
on the literature review of deliverable 1.1. For a full overview of these separate analyses,
please refer to Table 7 at the end of this paragraph. All analyses were run in two steps: in the
first step the control variables were tested for their influence on acceptability, in the second
step the perceived characteristic was added. This way, the added effect of the perceived
characteristic could be estimated. In all following tables, we always show the results of the
model of the second step. We only use the first step to estimate the additional effect the
perceived characteristic has on top of the control variables.
4.2.3.1 Perceived control
First was tested if greater perceived control is associated with greater acceptability of CAV.
Two control variables were included in this analysis: gender and experience with car
technology. Howard & Dai (2014) found that women were more concerned with low control
than males regarding self-driving cars. Kyriakidis, Happee, and de Winter (2015) found that
drivers who have experience with automation technology in their cars (for example cruise
control) perceived to have greater control over self-driving cars.
The model including the control variables was significant, F (df = 1, 3374) = 250.564, p < .001.
Greater perceived control was related to greater acceptability, controlling for gender and
experience with car technology. Please refer to Table 7 for the coefficients.
4.2.3.2 Perceived pleasure
Next was tested if greater perceived pleasure is associated with greater acceptability of CAV.
Two control variables were included in this analysis: gender and age. Men anticipate more
pleasure when thinking about self-driving cars (Hohenberger, Spörrle, & Welpe, 2016).
Moreover, sensation seeking is higher among males and young people (Becker & Axhausen,
2017), which may be related to pleasure.
The model including the control variables was significant, F (df = 1, 3778) = 855.493, p < .001.
Greater perceived pleasure was related to greater acceptability, controlling for gender and
age. Please refer to Table 7 for the coefficients.
4.2.3.3 Perceived safety
It was tested if greater perceived safety is associated with greater acceptability of CAV. Two
control variables were included in this analysis: education and age. In a previous study, older
34 / Deliverable 1.2 Psychological model predicting acceptability of CAV
people rated the safety of self-driving cars higher than younger people (Gold et al., 2015), and
people with a higher education rated self-driving cars as safer than people with lower
education (Montoro et al., 2019).
The model including the control variables was significant, F (df = 1, 3772) = 627.856, p < .001.
Greater perceived safety was related to greater acceptability, controlling for education and
age. Please refer to Table 7 for the coefficients.
4.2.3.4 Perceived convenience
Following safety, it was tested if greater perceived convenience is associated with greater
acceptability of CAV. Two control variables were included in this analysis: driving frequency
and age. With age comes cognitive decline, which could make driving more difficult, and CAV
more convenient (Gold et al., 2015). Moreover, compared to non-drivers, drivers believe
self-driving cars are more useful, especially if they drive frequently and long distances (Qu et
al., 2019; Shin, Tada, & Managi, 2019).
The model including the control variables was significant, F (df = 1, 3776) = 1251.652, p < .001.
Greater perceived convenience was related to greater acceptability, controlling for driving
frequency and age. Please refer to Table 7 for the coefficients.
4.2.3.5 Trust in CAV technology
Next was tested if greater trust in CAV technology is associated with greater acceptability of
CAV. Two control variables were included in this analysis: experience with car technology and
age. Gold and colleagues (2015) found that drivers with experience with automation car
technology (such as cruise control) also trusted the technology of self-driving cars more. Two
separate studies found that older people had greater trust in CAV than younger people (Regan
et al., 2017; Schaefer et al., 2014).
The model including the control variables was significant, F (df = 1, 3373) = 644.367, p < .001.
Greater trust in CAV technology was related to greater acceptability, controlling for experience
with car technology and age. Please refer to Table 7 for the coefficients.
4.2.3.6 Perceived status-enhancement
It was tested if greater perceived status-enhancement is associated with greater acceptability
of CAV. Two control variables were included in this analysis: gender and age. Status-seeking is
higher among males and younger persons (Goldsmith, Flynn, & Kim, 2010).
The model including the control variables was significant, F (df = 1, 3778) = 371.005, p < .001.
Greater perceived status-enhancement was related to greater acceptability, controlling for
gender and age. Please refer to Table 7 for the coefficients.
4.2.3.7 Perceived environmental sustainability
Finally, it was tested if greater perceived environmental sustainability is associated with
greater acceptability of CAV. Two control variables were included in this analysis: education
and age. People with higher education and younger people are more likely to adopt
sustainable innovations (for example Nguyen et al., 2019).
/ 35 Deliverable 1.2 Psychological model predicting acceptability of CAV
The model including the control variables was significant, F (df = 1, 3774) = 502.419, p < .001.
Greater perceived environmental sustainability was related to greater acceptability, controlling
for education and age. Please refer to Table 7 below for the coefficients.
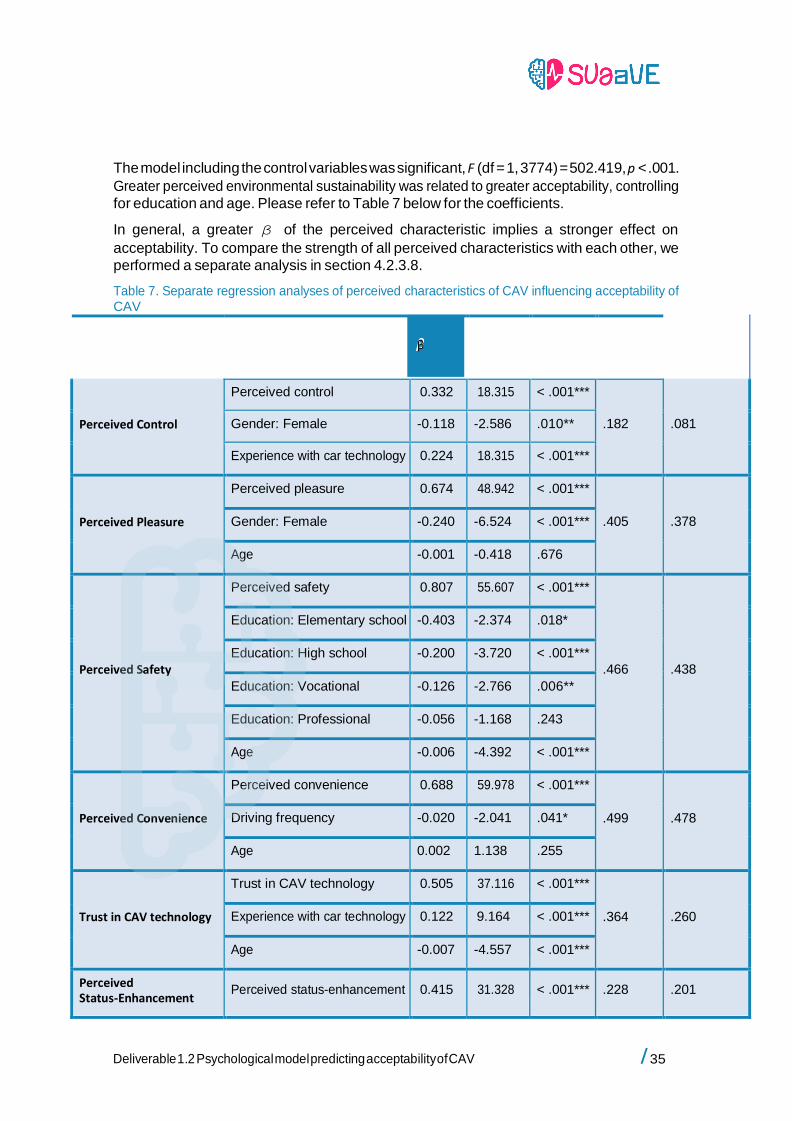
In general, a greater β of the perceived characteristic implies a stronger effect on
acceptability. To compare the strength of all perceived characteristics with each other, we
performed a separate analysis in section 4.2.3.8.
Table 7. Separate regression analyses of perceived characteristics of CAV influencing acceptability of CAV
Perceived characteristic
Control variables
β
t
p
R2 model including control
R2 perceived characteristic only
Perceived Control
Perceived control 0.332 18.315 < .001***
.182
.081 Gender: Female -0.118 -2.586 .010**
Experience with car technology 0.224 18.315 < .001***
Perceived Pleasure
Perceived pleasure 0.674 48.942 < .001***
.405
.378 Gender: Female -0.240 -6.524 < .001***
Age -0.001 -0.418 .676
Perceived Safety
Perceived safety 0.807 55.607 < .001***
.466
.438
Education: Elementary school -0.403 -2.374 .018*
Education: High school -0.200 -3.720 < .001***
Education: Vocational -0.126 -2.766 .006**
Education: Professional -0.056 -1.168 .243
Age -0.006 -4.392 < .001***
Perceived Convenience
Perceived convenience 0.688 59.978 < .001***
.499
.478 Driving frequency -0.020 -2.041 .041*
Age 0.002 1.138 .255
Trust in CAV technology
Trust in CAV technology 0.505 37.116 < .001***
.364
.260 Experience with car technology 0.122 9.164 < .001***
Age -0.007 -4.557 < .001***
Perceived Status-Enhancement
Perceived status-enhancement 0.415 31.328 < .001*** .228 .201
36 / Deliverable 1.2 Psychological model predicting acceptability of CAV
Gender: Female -0.154 -3.659 < .001***
Age -0.003 -1.995 .046*
Perceived Environmental Sustainability
Perceived environmental sustainability
0.606
45.499
< .001***
.372
.344
Education: Elementary -0.424 -2.306 .021*
Education: High school -0.195 -3.361 .001***
Education: Vocational -0.141 -2.851 .004**
Education: Professional -0.084 -1.629 .103
Age -0.006 -4.177 < .001***
The reference category for gender is in all cases male, the reference category for education is in all cases
university; * = significant at the .05 level, ** = significant at the .01 level, *** = significant at the .001 level.
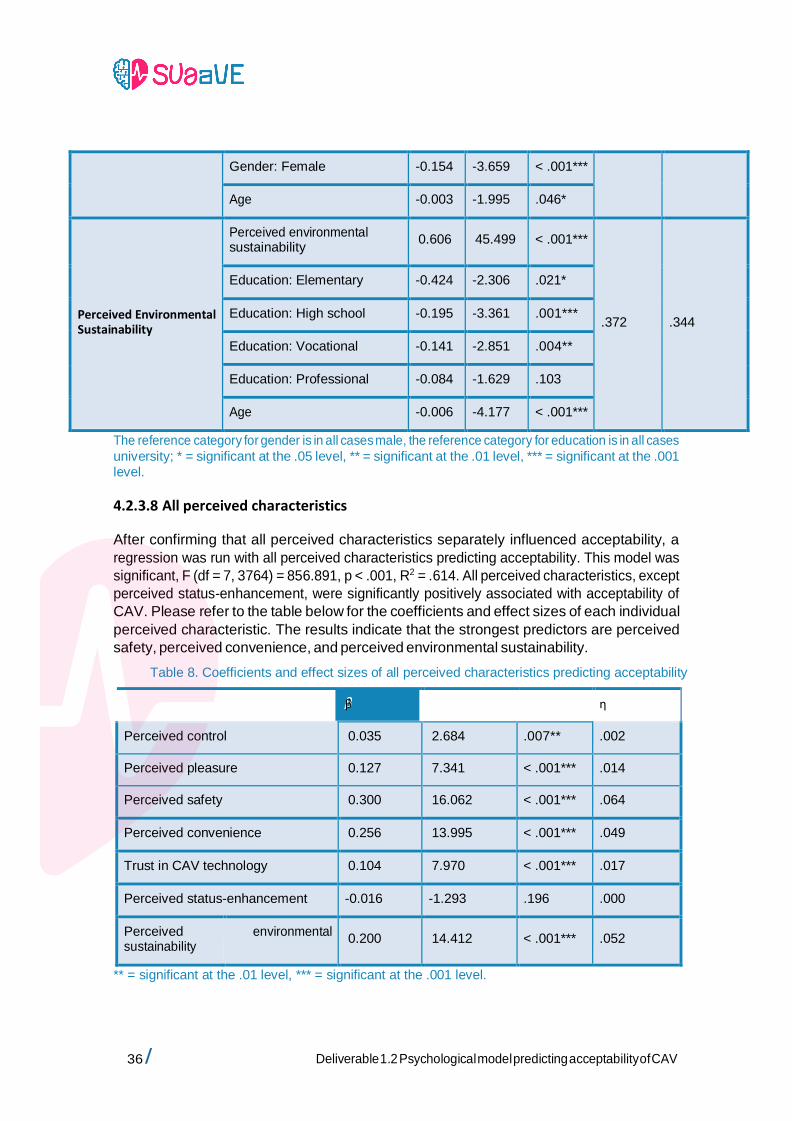
4.2.3.8 All perceived characteristics
After confirming that all perceived characteristics separately influenced acceptability, a
regression was run with all perceived characteristics predicting acceptability. This model was
significant, F (df = 7, 3764) = 856.891, p < .001, R2 = .614. All perceived characteristics, except
perceived status-enhancement, were significantly positively associated with acceptability of
CAV. Please refer to the table below for the coefficients and effect sizes of each individual
perceived characteristic. The results indicate that the strongest predictors are perceived
safety, perceived convenience, and perceived environmental sustainability.
Table 8. Coefficients and effect sizes of all perceived characteristics predicting acceptability
Perceived characteristic β t p η2
Perceived control 0.035 2.684 .007** .002
Perceived pleasure 0.127 7.341 < .001*** .014
Perceived safety 0.300 16.062 < .001*** .064
Perceived convenience 0.256 13.995 < .001*** .049
Trust in CAV technology 0.104 7.970 < .001*** .017
Perceived status-enhancement -0.016 -1.293 .196 .000
Perceived sustainability
environmental
0.200
14.412
< .001***
.052
** = significant at the .01 level, *** = significant at the .001 level.
/ 37 Deliverable 1.2 Psychological model predicting acceptability of CAV
4.2.5 Individual differences influencing perceived characteristics
As appeared from the literature review (see D1.1.), individual differences may influence how
people perceive CAV. In the large scale survey we examined three types of individual
differences that seem to be particularly relevant in studying their influence on CAV: values, the
need for control, and what type of road user someone is. Differences between user groups are
discussed in section 4.2.6.
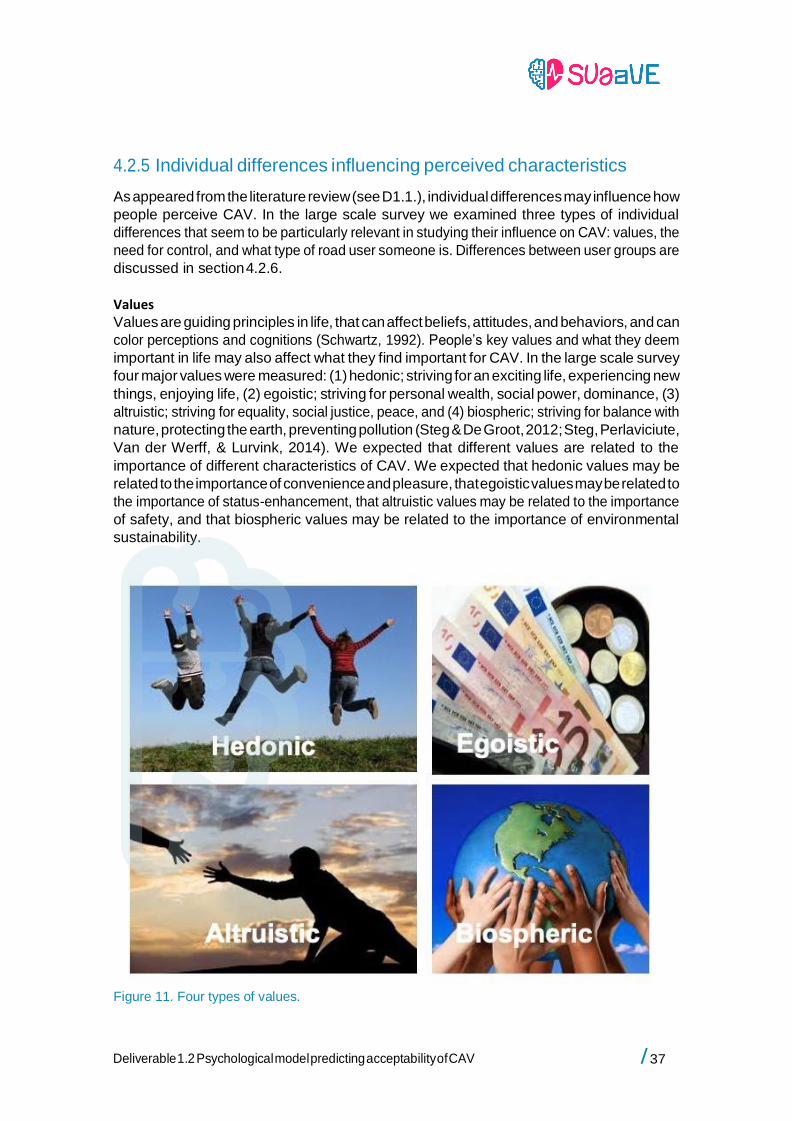
Values Values are guiding principles in life, that can affect beliefs, attitudes, and behaviors, and can
color perceptions and cognitions (Schwartz, 1992). People’s key values and what they deem
important in life may also affect what they find important for CAV. In the large scale survey
four major values were measured: (1) hedonic; striving for an exciting life, experiencing new
things, enjoying life, (2) egoistic; striving for personal wealth, social power, dominance, (3)
altruistic; striving for equality, social justice, peace, and (4) biospheric; striving for balance with
nature, protecting the earth, preventing pollution (Steg & De Groot, 2012; Steg, Perlaviciute,
Van der Werff, & Lurvink, 2014). We expected that different values are related to the
importance of different characteristics of CAV. We expected that hedonic values may be
related to the importance of convenience and pleasure, that egoistic values may be related to
the importance of status-enhancement, that altruistic values may be related to the importance
of safety, and that biospheric values may be related to the importance of environmental
sustainability.
Figure 11. Four types of values.
38 / Deliverable 1.2 Psychological model predicting acceptability of CAV
Need for control The second individual factor is the need for control. The belief that a person has control over
the environment and events in one’s life is vital for someone’s well-being. The perception of
control is both desirable, as well as a psychological necessity (Leotti, Iyengar, & Ochsner,
2010). People differ on a general level of motivation to control events, in other words the need
for control is an individual difference (Burger & Cooper, 1979). The feeling of being in control is
an integral part of driving. The lack of control over autonomous vehicles may decrease the
acceptability of these vehicles (for example Howard & Dai, 2014). We examined if the need for
control affected perceived control of CAV, and in turn affected acceptability.
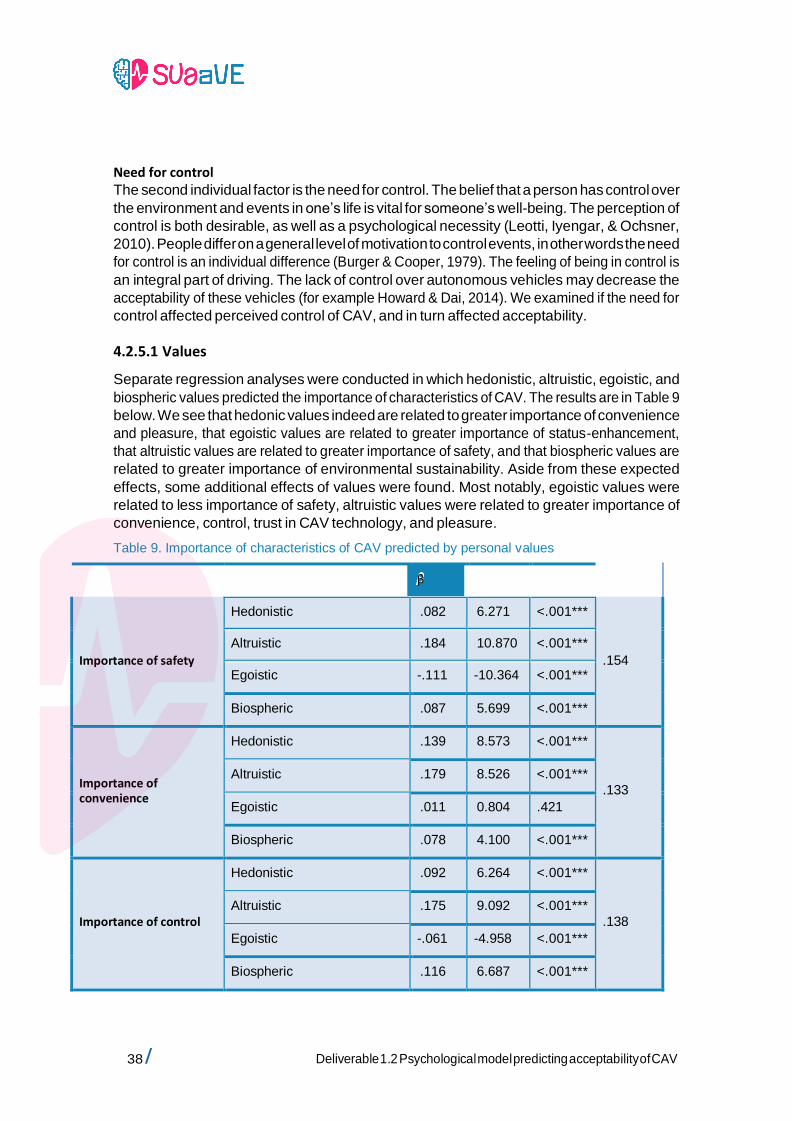
4.2.5.1 Values
Separate regression analyses were conducted in which hedonistic, altruistic, egoistic, and
biospheric values predicted the importance of characteristics of CAV. The results are in Table 9
below. We see that hedonic values indeed are related to greater importance of convenience
and pleasure, that egoistic values are related to greater importance of status-enhancement,
that altruistic values are related to greater importance of safety, and that biospheric values are
related to greater importance of environmental sustainability. Aside from these expected
effects, some additional effects of values were found. Most notably, egoistic values were
related to less importance of safety, altruistic values were related to greater importance of
convenience, control, trust in CAV technology, and pleasure.
Table 9. Importance of characteristics of CAV predicted by personal values
Characteristic Values β t p R2 model
Importance of safety
Hedonistic .082 6.271 <.001***
.154
Altruistic .184 10.870 <.001***
Egoistic -.111 -10.364 <.001***
Biospheric .087 5.699 <.001***
Importance of convenience
Hedonistic .139 8.573 <.001***
.133
Altruistic .179 8.526 <.001***
Egoistic .011 0.804 .421
Biospheric .078 4.100 <.001***
Importance of control
Hedonistic .092 6.264 <.001***
.138
Altruistic .175 9.092 <.001***
Egoistic -.061 -4.958 <.001***
Biospheric .116 6.687 <.001***
/ 39 Deliverable 1.2 Psychological model predicting acceptability of CAV
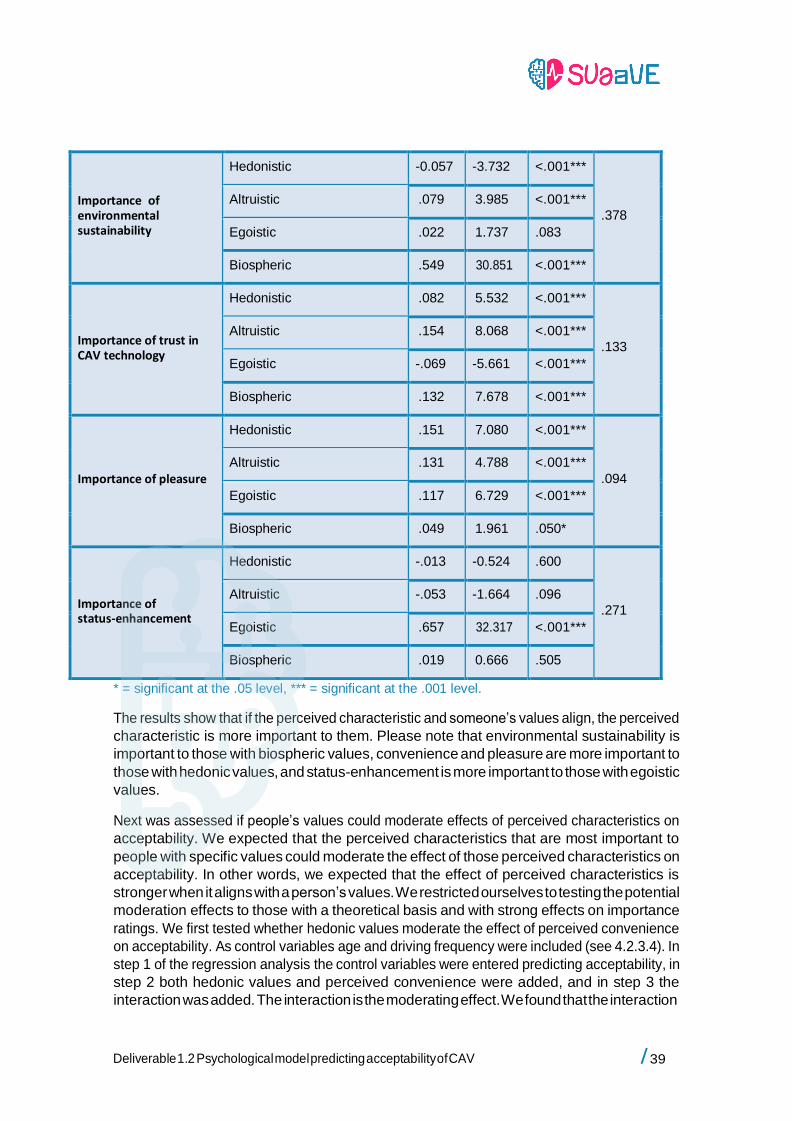
Importance of environmental sustainability
Hedonistic -0.057 -3.732 <.001***
.378
Altruistic .079 3.985 <.001***
Egoistic .022 1.737 .083
Biospheric .549 30.851 <.001***
Importance of trust in CAV technology
Hedonistic .082 5.532 <.001***
.133
Altruistic .154 8.068 <.001***
Egoistic -.069 -5.661 <.001***
Biospheric .132 7.678 <.001***
Importance of pleasure
Hedonistic .151 7.080 <.001***
.094
Altruistic .131 4.788 <.001***
Egoistic .117 6.729 <.001***
Biospheric .049 1.961 .050*
Importance of status-enhancement
Hedonistic -.013 -0.524 .600
.271
Altruistic -.053 -1.664 .096
Egoistic .657 32.317 <.001***
Biospheric .019 0.666 .505
* = significant at the .05 level, *** = significant at the .001 level.
The results show that if the perceived characteristic and someone’s values align, the perceived
characteristic is more important to them. Please note that environmental sustainability is
important to those with biospheric values, convenience and pleasure are more important to
those with hedonic values, and status-enhancement is more important to those with egoistic
values.
Next was assessed if people’s values could moderate effects of perceived characteristics on
acceptability. We expected that the perceived characteristics that are most important to
people with specific values could moderate the effect of those perceived characteristics on
acceptability. In other words, we expected that the effect of perceived characteristics is
stronger when it aligns with a person’s values. We restricted ourselves to testing the potential
moderation effects to those with a theoretical basis and with strong effects on importance
ratings. We first tested whether hedonic values moderate the effect of perceived convenience
on acceptability. As control variables age and driving frequency were included (see 4.2.3.4). In
step 1 of the regression analysis the control variables were entered predicting acceptability, in
step 2 both hedonic values and perceived convenience were added, and in step 3 the
interaction was added. The interaction is the moderating effect. We found that the interaction
40 / Deliverable 1.2 Psychological model predicting acceptability of CAV
was not significant (β = -0.002, t (df = 3771) = -0.288, p = .773), meaning that greater hedonic
values do not result in a stronger effect of perceived convenience on acceptability. However,
both hedonic values (β = 0.047, t (df = 3772) = 3.962, p < .001) and perceived convenience
(β = 0.681, t (df = 3772) = 58.588, p < .001) were significantly positively related to
acceptability.
Second, we tested whether hedonic values moderate the effect of perceived pleasure on
acceptability. As control variables age and gender were included (see 4.2.3.2). The interaction
was not significant (β = -0.011, t (df = 3773) = 1.240, p = .215), meaning that greater hedonic
values do not result in a stronger effect of perceived pleasure on acceptability. However, both
hedonic values (β = 0.099, t (df = 3774) = 7.876, p < .001) and perceived pleasure (β = 0.662,
t (df = 3774) = 48.172, p < .001) were significantly positively related to acceptability.
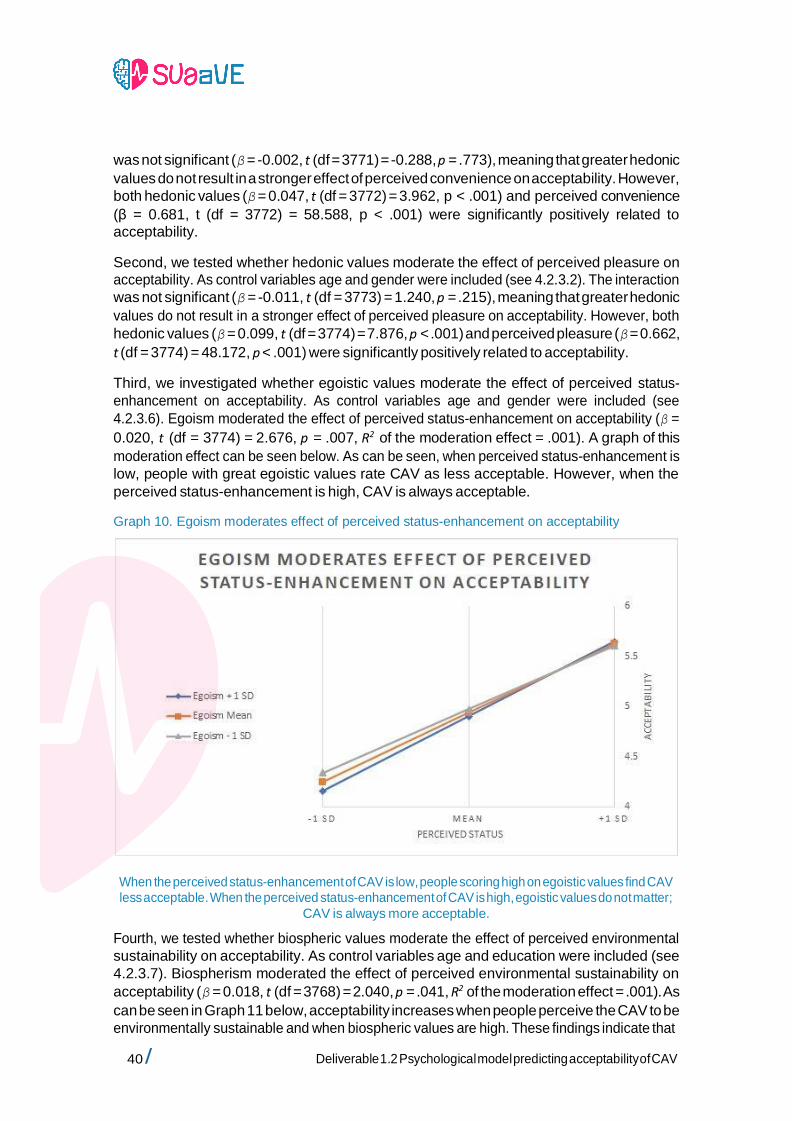
Third, we investigated whether egoistic values moderate the effect of perceived status-
enhancement on acceptability. As control variables age and gender were included (see
4.2.3.6). Egoism moderated the effect of perceived status-enhancement on acceptability (β =
0.020, t (df = 3774) = 2.676, p = .007, R2 of the moderation effect = .001). A graph of this
moderation effect can be seen below. As can be seen, when perceived status-enhancement is
low, people with great egoistic values rate CAV as less acceptable. However, when the
perceived status-enhancement is high, CAV is always acceptable.
Graph 10. Egoism moderates effect of perceived status-enhancement on acceptability
When the perceived status-enhancement of CAV is low, people scoring high on egoistic values find CAV less acceptable. When the perceived status-enhancement of CAV is high, egoistic values do not matter;
CAV is always more acceptable.
Fourth, we tested whether biospheric values moderate the effect of perceived environmental
sustainability on acceptability. As control variables age and education were included (see
4.2.3.7). Biospherism moderated the effect of perceived environmental sustainability on
acceptability (β = 0.018, t (df = 3768) = 2.040, p = .041, R2 of the moderation effect = .001). As
can be seen in Graph 11 below, acceptability increases when people perceive the CAV to be
environmentally sustainable and when biospheric values are high. These findings indicate that
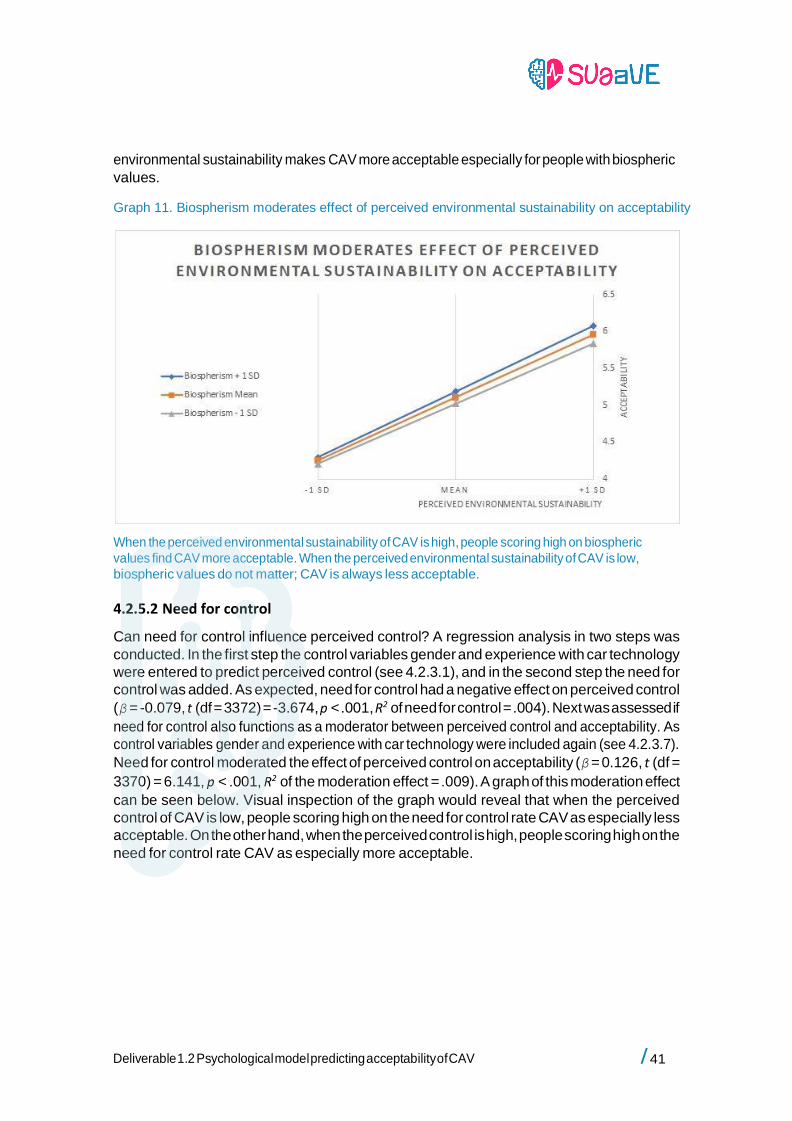
/ 41 Deliverable 1.2 Psychological model predicting acceptability of CAV
environmental sustainability makes CAV more acceptable especially for people with biospheric
values.
Graph 11. Biospherism moderates effect of perceived environmental sustainability on acceptability
When the perceived environmental sustainability of CAV is high, people scoring high on biospheric
values find CAV more acceptable. When the perceived environmental sustainability of CAV is low,
biospheric values do not matter; CAV is always less acceptable.
4.2.5.2 Need for control
Can need for control influence perceived control? A regression analysis in two steps was
conducted. In the first step the control variables gender and experience with car technology
were entered to predict perceived control (see 4.2.3.1), and in the second step the need for
control was added. As expected, need for control had a negative effect on perceived control
(β = -0.079, t (df = 3372) = -3.674, p < .001, R2 of need for control = .004). Next was assessed if
need for control also functions as a moderator between perceived control and acceptability. As
control variables gender and experience with car technology were included again (see 4.2.3.7).
Need for control moderated the effect of perceived control on acceptability (β = 0.126, t (df =
3370) = 6.141, p < .001, R2 of the moderation effect = .009). A graph of this moderation effect
can be seen below. Visual inspection of the graph would reveal that when the perceived
control of CAV is low, people scoring high on the need for control rate CAV as especially less
acceptable. On the other hand, when the perceived control is high, people scoring high on the
need for control rate CAV as especially more acceptable.
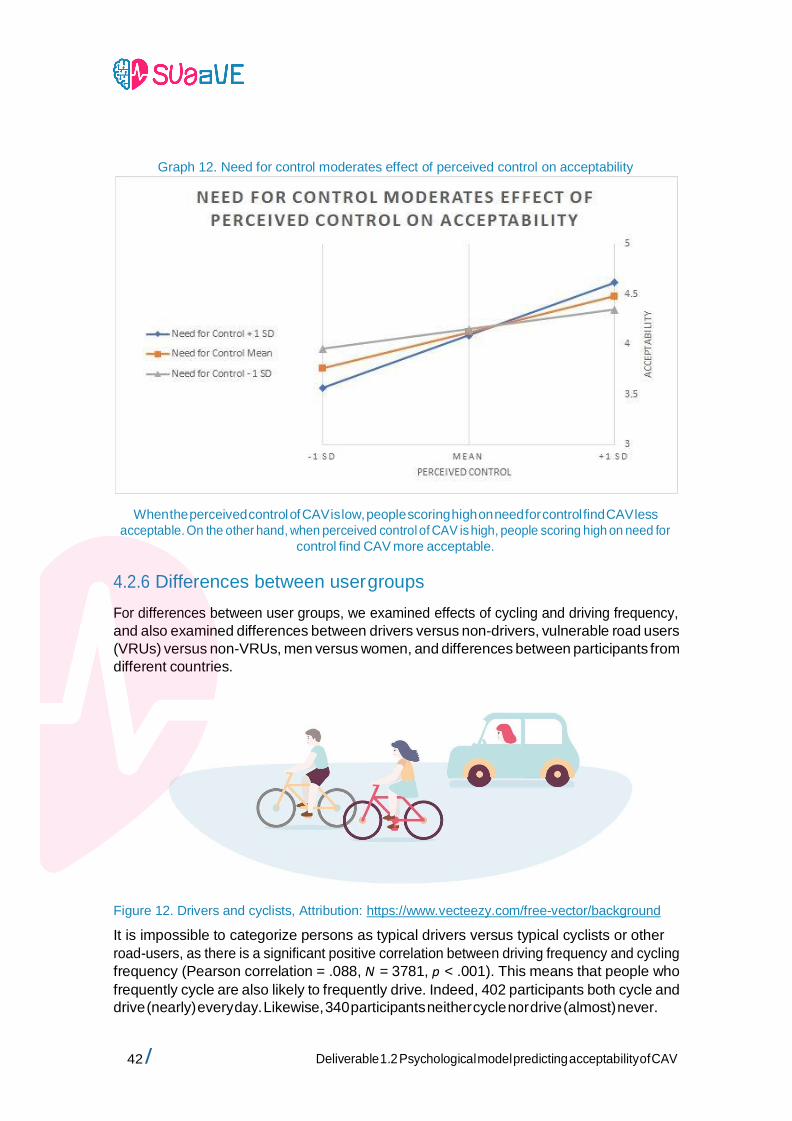
42 / Deliverable 1.2 Psychological model predicting acceptability of CAV
Graph 12. Need for control moderates effect of perceived control on acceptability
When the perceived control of CAV is low, people scoring high on need for control find CAV less
acceptable. On the other hand, when perceived control of CAV is high, people scoring high on need for
control find CAV more acceptable.
4.2.6 Differences between user groups
For differences between user groups, we examined effects of cycling and driving frequency,
and also examined differences between drivers versus non-drivers, vulnerable road users
(VRUs) versus non-VRUs, men versus women, and differences between participants from
different countries.
Figure 12. Drivers and cyclists, Attribution: https://www.vecteezy.com/free-vector/background
It is impossible to categorize persons as typical drivers versus typical cyclists or other
road-users, as there is a significant positive correlation between driving frequency and cycling
frequency (Pearson correlation = .088, N = 3781, p < .001). This means that people who
frequently cycle are also likely to frequently drive. Indeed, 402 participants both cycle and
drive (nearly) every day. Likewise, 340 participants neither cycle nor drive (almost) never.
/ 43 Deliverable 1.2 Psychological model predicting acceptability of CAV
Instead of comparing typical drivers versus typical cyclists, we will focus on cycling and driving
frequency separately. This also allows us to draw a clearer picture of the general population,
instead of focusing on extremes (comparing people who only drive with people who only
cycle).
4.2.6.1 Cycling frequency
First we assessed if cycling frequency influenced how safe CAV is perceived to be. Cyclists and
pedestrians typically rely on non-verbal cues given by the car’s driver (for example eye contact,
waving a hand, and posture) to assess whether it is safe to cross the road (Deb, Rahman,
Strawderman, & Garrison, 2018). When a computer system is controlling the car, non-verbal
communication becomes impossible. Those who frequently cycle may therefore find CAV less
safe and less acceptable.
All analyses in this paragraph were conducted in two steps: in step one the control variables
were entered predicting perceived safety or trust in CAV technology, and in step two the
predictor of interest was added.
As control variables age and education were included (see 4.2.3.3). Greater cycling frequency
was related to lower perceived safety of CAV, controlling for age and education (β = -0.076, t
(df = 3771) = -6.005, p < .001, R2 of cycling frequency = .009). Likewise, greater driving
frequency was related to lower perceived safety of CAV, controlling for age and education (β
= -0.052, t (df = 3771) = -4.199, p < .001, R2 of driving frequency = .005). When both cycling and
driving frequency were added as predictors, they both remained significant, controlling for age
and education (cycling frequency β = -0.072, t (df = 3769) = -5.677, p < .001; driving frequency
β = -0.046, t (df = 3771) = -3.698, p < .001; R2 of driving frequency and cycling frequency =
.013).
Secondly was assessed if cycling frequency influences trust in CAV technology. Multiple times
researchers have suggested that the inability to communicate with CAV as a pedestrian or
cyclist could not only decrease perceived safety, but affect trust as well (Deb, Rahman,
Strawderman, & Garrison, 2018; Habibovic et al., 2018; Deb, Strawderman, & Carruth, 2018).
As control variables age and experience with car technology were included (see 4.2.3.5).
Greater cycling frequency was indeed related to lower trust in CAV technology, controlling for
age (β = -0.092, t (df = 3778) = -5.653, p < .001, R2 of cycling frequency = .008).
Thirdly, moderation effects were assessed. Previous research has found that more experience
with (CAV) technology leads to greater trust and perceived safety of CAV (e.g. Penmetsa et al.,
2019). A qualitative study by Bennett, Vijaygopal, & Kottasz (2019) also indicated physically
disabled people with an interest in technology had greater trust in CAV. Moreover, in the focus
groups we found that participants with great interest in technology were more accepting of
CAV and viewed CAV more positively than people with less interest in technology.
Could interest in technology moderate the effect of cycling frequency on perceived safety? As
control variables age and education were included (see 4.2.3.3). In step 1 the control variables
were entered in the regression to predict perceived safety, in step 2 both cycling frequency
and technology interest were added, and in step 3 the interaction was added. The interaction
is the moderation. The interaction was not significant (β = -0.015, t (df = 3773) = -1.839, p =
.066) meaning that the negative effect of cycling frequency on perceived safety is not different
between people with high and low interest in technology. We also tested if technology interest
moderates the effect of cycling frequency on trust in CAV technology. As control variable age
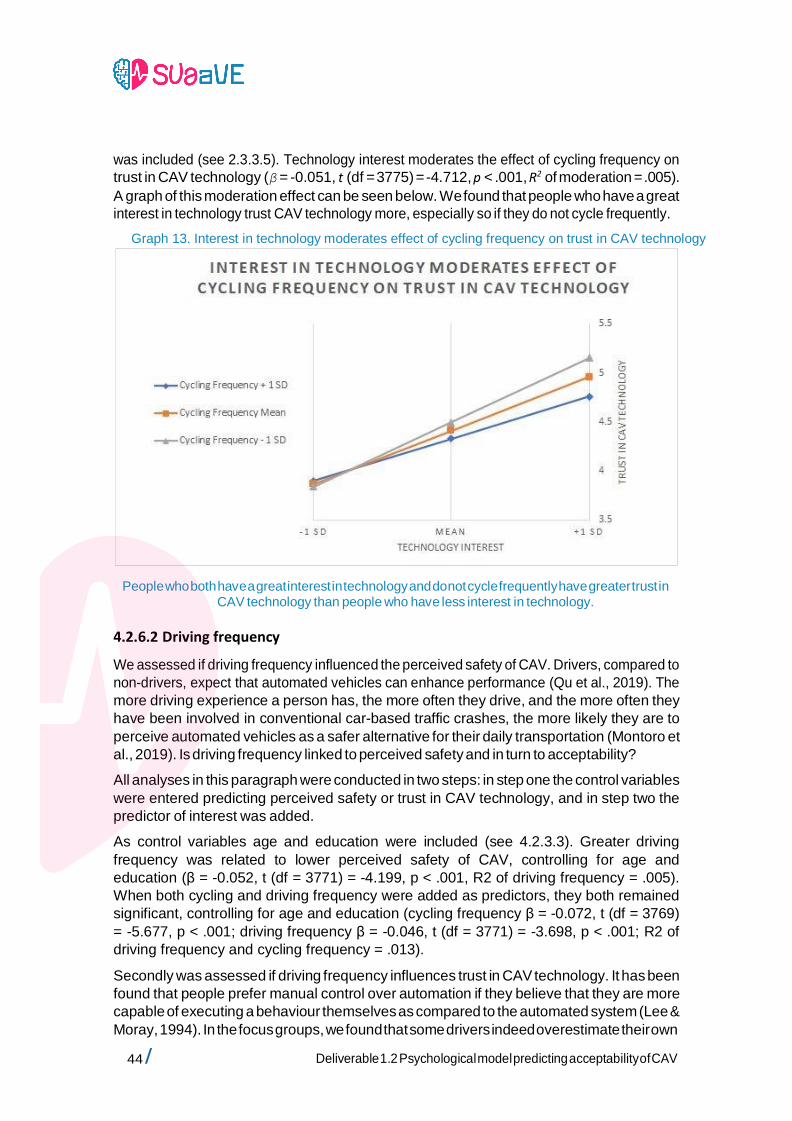
44 / Deliverable 1.2 Psychological model predicting acceptability of CAV
was included (see 2.3.3.5). Technology interest moderates the effect of cycling frequency on
trust in CAV technology (β = -0.051, t (df = 3775) = -4.712, p < .001, R2 of moderation = .005).
A graph of this moderation effect can be seen below. We found that people who have a great
interest in technology trust CAV technology more, especially so if they do not cycle frequently.
Graph 13. Interest in technology moderates effect of cycling frequency on trust in CAV technology
People who both have a great interest in technology and do not cycle frequently have greater trust in CAV technology than people who have less interest in technology.
4.2.6.2 Driving frequency
We assessed if driving frequency influenced the perceived safety of CAV. Drivers, compared to
non-drivers, expect that automated vehicles can enhance performance (Qu et al., 2019). The
more driving experience a person has, the more often they drive, and the more often they
have been involved in conventional car-based traffic crashes, the more likely they are to
perceive automated vehicles as a safer alternative for their daily transportation (Montoro et
al., 2019). Is driving frequency linked to perceived safety and in turn to acceptability?
All analyses in this paragraph were conducted in two steps: in step one the control variables
were entered predicting perceived safety or trust in CAV technology, and in step two the
predictor of interest was added.
As control variables age and education were included (see 4.2.3.3). Greater driving
frequency was related to lower perceived safety of CAV, controlling for age and
education (β = -0.052, t (df = 3771) = -4.199, p < .001, R2 of driving frequency = .005).
When both cycling and driving frequency were added as predictors, they both remained
significant, controlling for age and education (cycling frequency β = -0.072, t (df = 3769)
= -5.677, p < .001; driving frequency β = -0.046, t (df = 3771) = -3.698, p < .001; R2 of
driving frequency and cycling frequency = .013).
Secondly was assessed if driving frequency influences trust in CAV technology. It has been
found that people prefer manual control over automation if they believe that they are more
capable of executing a behaviour themselves as compared to the automated system (Lee &
Moray, 1994). In the focus groups, we found that some drivers indeed overestimate their own
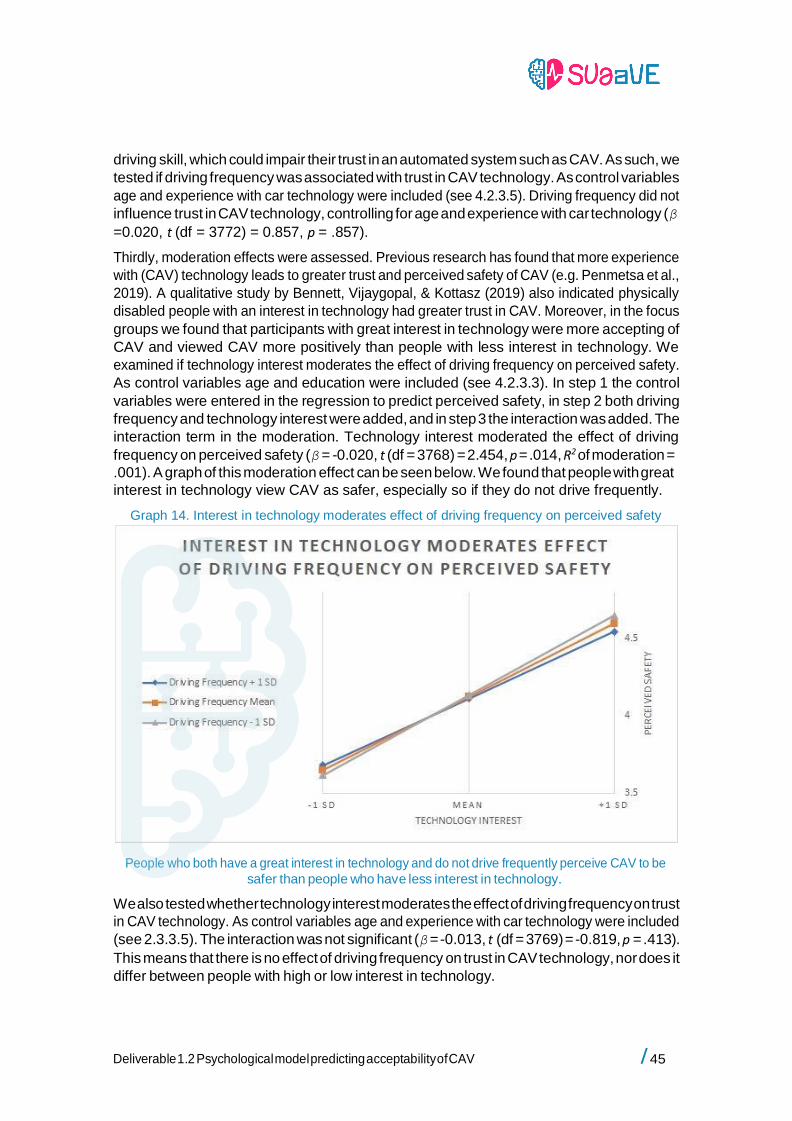
/ 45 Deliverable 1.2 Psychological model predicting acceptability of CAV
driving skill, which could impair their trust in an automated system such as CAV. As such, we
tested if driving frequency was associated with trust in CAV technology. As control variables
age and experience with car technology were included (see 4.2.3.5). Driving frequency did not
influence trust in CAV technology, controlling for age and experience with car technology (β
=0.020, t (df = 3772) = 0.857, p = .857).
Thirdly, moderation effects were assessed. Previous research has found that more experience
with (CAV) technology leads to greater trust and perceived safety of CAV (e.g. Penmetsa et al.,
2019). A qualitative study by Bennett, Vijaygopal, & Kottasz (2019) also indicated physically
disabled people with an interest in technology had greater trust in CAV. Moreover, in the focus
groups we found that participants with great interest in technology were more accepting of
CAV and viewed CAV more positively than people with less interest in technology. We
examined if technology interest moderates the effect of driving frequency on perceived safety.
As control variables age and education were included (see 4.2.3.3). In step 1 the control
variables were entered in the regression to predict perceived safety, in step 2 both driving
frequency and technology interest were added, and in step 3 the interaction was added. The
interaction term in the moderation. Technology interest moderated the effect of driving
frequency on perceived safety (β = -0.020, t (df = 3768) = 2.454, p = .014, R2 of moderation =
.001). A graph of this moderation effect can be seen below. We found that people with great
interest in technology view CAV as safer, especially so if they do not drive frequently.
Graph 14. Interest in technology moderates effect of driving frequency on perceived safety
People who both have a great interest in technology and do not drive frequently perceive CAV to be
safer than people who have less interest in technology.
We also tested whether technology interest moderates the effect of driving frequency on trust
in CAV technology. As control variables age and experience with car technology were included
(see 2.3.3.5). The interaction was not significant (β = -0.013, t (df = 3769) = -0.819, p = .413).
This means that there is no effect of driving frequency on trust in CAV technology, nor does it
differ between people with high or low interest in technology.
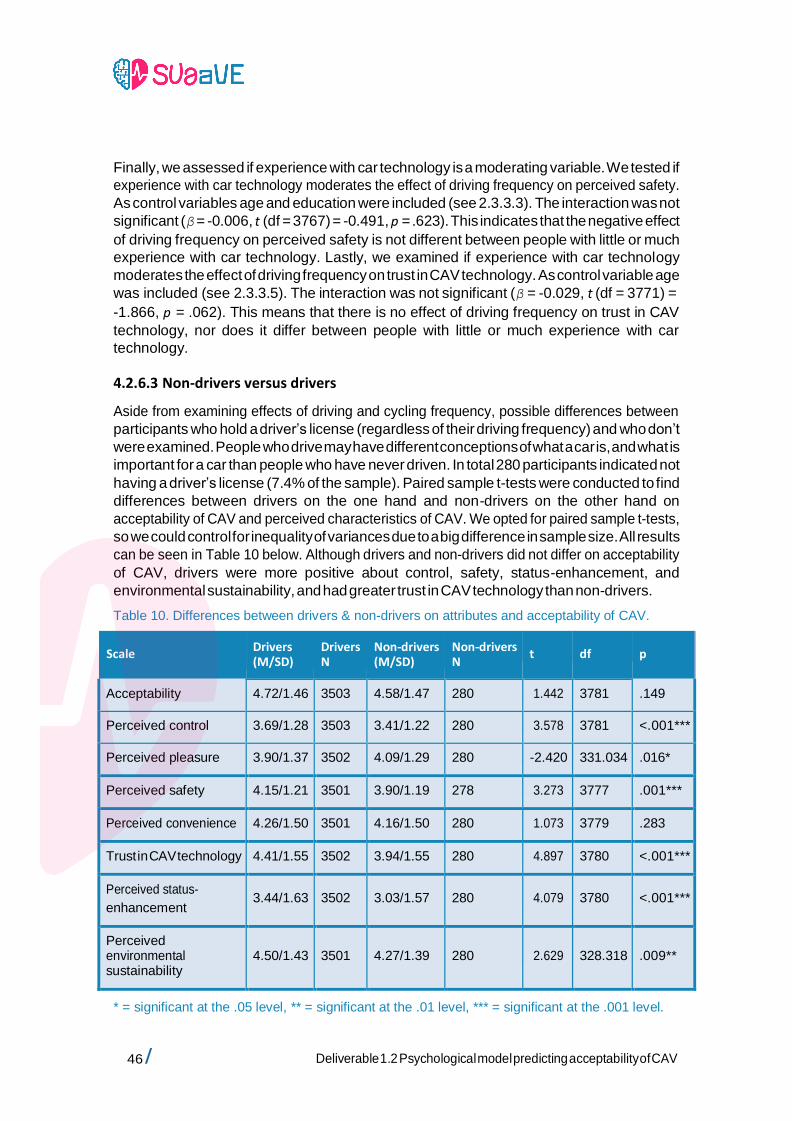
46 / Deliverable 1.2 Psychological model predicting acceptability of CAV
Finally, we assessed if experience with car technology is a moderating variable. We tested if
experience with car technology moderates the effect of driving frequency on perceived safety.
As control variables age and education were included (see 2.3.3.3). The interaction was not
significant (β = -0.006, t (df = 3767) = -0.491, p = .623). This indicates that the negative effect
of driving frequency on perceived safety is not different between people with little or much
experience with car technology. Lastly, we examined if experience with car technology
moderates the effect of driving frequency on trust in CAV technology. As control variable age
was included (see 2.3.3.5). The interaction was not significant (β = -0.029, t (df = 3771) =
-1.866, p = .062). This means that there is no effect of driving frequency on trust in CAV
technology, nor does it differ between people with little or much experience with car
technology.
4.2.6.3 Non-drivers versus drivers
Aside from examining effects of driving and cycling frequency, possible differences between
participants who hold a driver’s license (regardless of their driving frequency) and who don’t
were examined. People who drive may have different conceptions of what a car is, and what is
important for a car than people who have never driven. In total 280 participants indicated not
having a driver’s license (7.4% of the sample). Paired sample t-tests were conducted to find
differences between drivers on the one hand and non-drivers on the other hand on
acceptability of CAV and perceived characteristics of CAV. We opted for paired sample t-tests,
so we could control for inequality of variances due to a big difference in sample size. All results
can be seen in Table 10 below. Although drivers and non-drivers did not differ on acceptability
of CAV, drivers were more positive about control, safety, status-enhancement, and
environmental sustainability, and had greater trust in CAV technology than non-drivers.
Table 10. Differences between drivers & non-drivers on attributes and acceptability of CAV.
Scale Drivers (M/SD)
Drivers N
Non-drivers (M/SD)
Non-drivers N
t
df
p
Acceptability 4.72/1.46 3503 4.58/1.47 280 1.442 3781 .149
Perceived control 3.69/1.28 3503 3.41/1.22 280 3.578 3781 <.001***
Perceived pleasure 3.90/1.37 3502 4.09/1.29 280 -2.420 331.034 .016*
Perceived safety 4.15/1.21 3501 3.90/1.19 278 3.273 3777 .001***
Perceived convenience 4.26/1.50 3501 4.16/1.50 280 1.073 3779 .283
Trust in CAV technology 4.41/1.55 3502 3.94/1.55 280 4.897 3780 <.001***
Perceived status-
enhancement
3.44/1.63
3502
3.03/1.57
280
4.079
3780
<.001***
Perceived environmental sustainability
4.50/1.43
3501
4.27/1.39
280
2.629
328.318
.009**
* = significant at the .05 level, ** = significant at the .01 level, *** = significant at the .001 level.
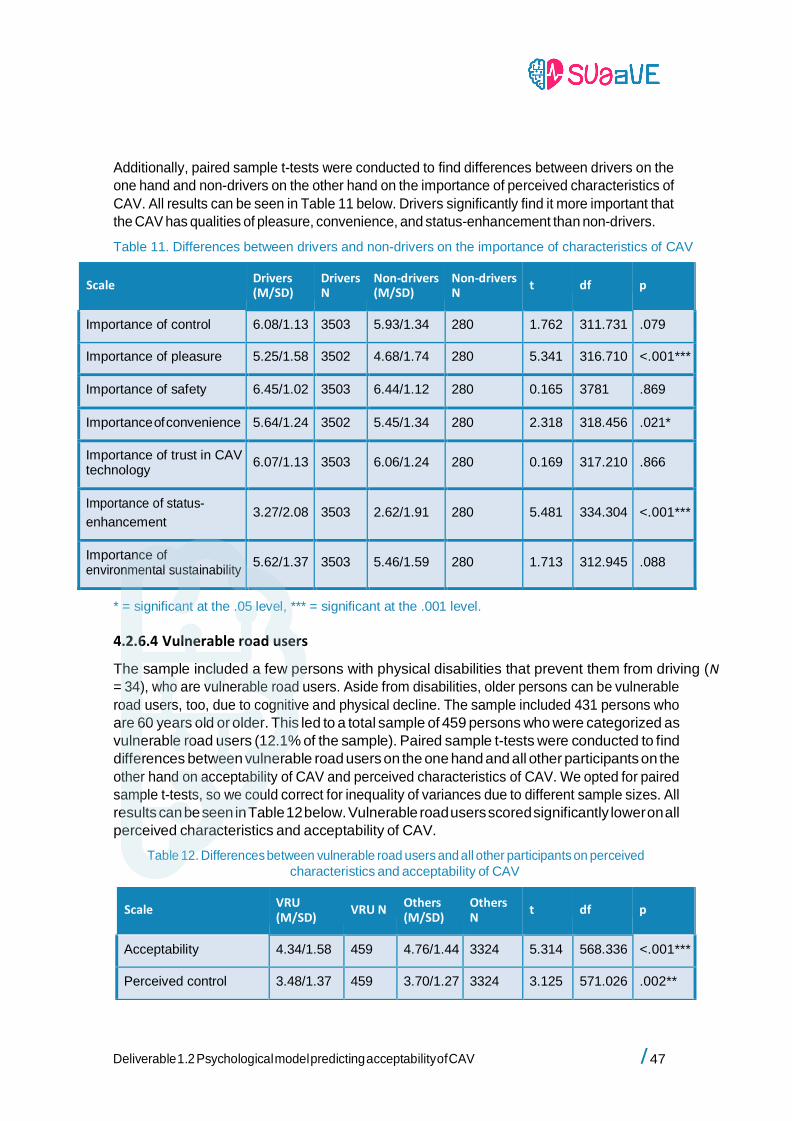
/ 47 Deliverable 1.2 Psychological model predicting acceptability of CAV
Additionally, paired sample t-tests were conducted to find differences between drivers on the
one hand and non-drivers on the other hand on the importance of perceived characteristics of
CAV. All results can be seen in Table 11 below. Drivers significantly find it more important that
the CAV has qualities of pleasure, convenience, and status-enhancement than non-drivers.
Table 11. Differences between drivers and non-drivers on the importance of characteristics of CAV
Scale Drivers (M/SD)
Drivers N
Non-drivers (M/SD)
Non-drivers N
t
df
p
Importance of control 6.08/1.13 3503 5.93/1.34 280 1.762 311.731 .079
Importance of pleasure 5.25/1.58 3502 4.68/1.74 280 5.341 316.710 <.001***
Importance of safety 6.45/1.02 3503 6.44/1.12 280 0.165 3781 .869
Importance of convenience 5.64/1.24 3502 5.45/1.34 280 2.318 318.456 .021*
Importance of trust in CAV technology
6.07/1.13
3503
6.06/1.24
280
0.169
317.210
.866
Importance of status-
enhancement
3.27/2.08
3503
2.62/1.91
280
5.481
334.304
<.001***
Importance of environmental sustainability
5.62/1.37
3503
5.46/1.59
280
1.713
312.945
.088
* = significant at the .05 level, *** = significant at the .001 level.
4.2.6.4 Vulnerable road users
The sample included a few persons with physical disabilities that prevent them from driving (N = 34), who are vulnerable road users. Aside from disabilities, older persons can be vulnerable
road users, too, due to cognitive and physical decline. The sample included 431 persons who
are 60 years old or older. This led to a total sample of 459 persons who were categorized as
vulnerable road users (12.1% of the sample). Paired sample t-tests were conducted to find
differences between vulnerable road users on the one hand and all other participants on the
other hand on acceptability of CAV and perceived characteristics of CAV. We opted for paired
sample t-tests, so we could correct for inequality of variances due to different sample sizes. All
results can be seen in Table 12 below. Vulnerable road users scored significantly lower on all
perceived characteristics and acceptability of CAV.
Table 12. Differences between vulnerable road users and all other participants on perceived
characteristics and acceptability of CAV
Scale VRU (M/SD)
VRU N Others (M/SD)
Others N
t
df
p
Acceptability 4.34/1.58 459 4.76/1.44 3324 5.314 568.336 <.001***
Perceived control 3.48/1.37 459 3.70/1.27 3324 3.125 571.026 .002**
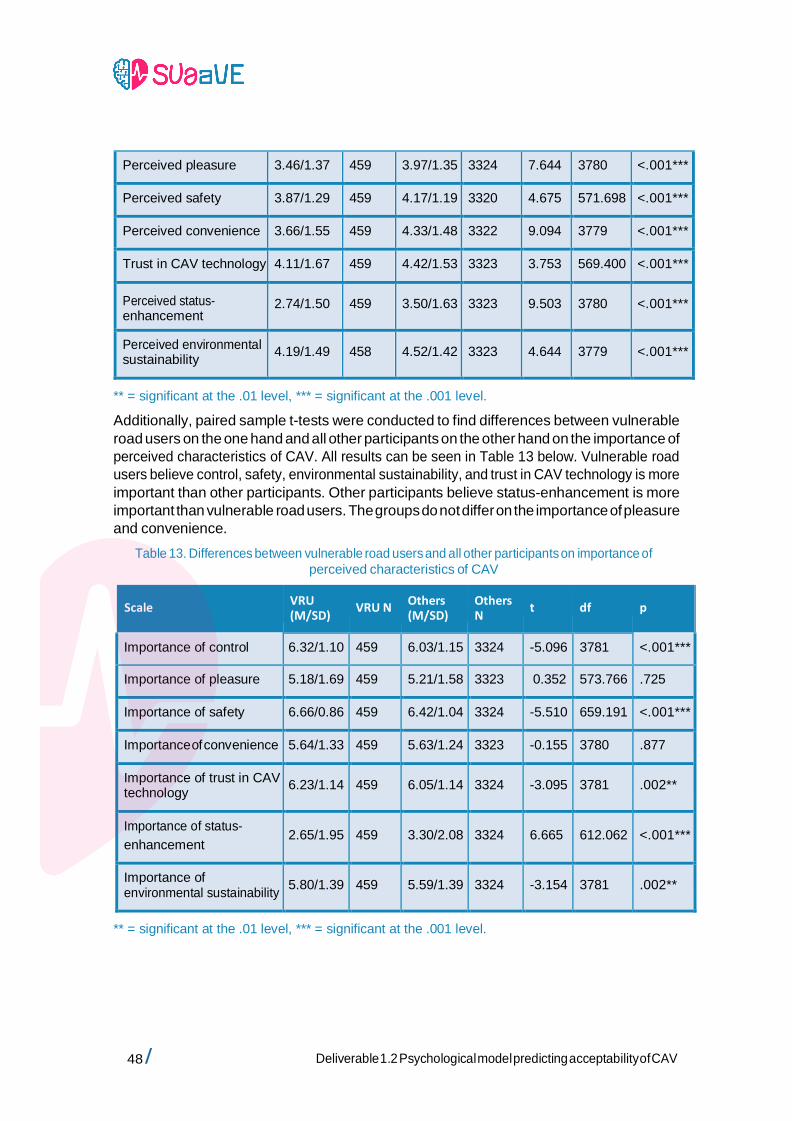
48 / Deliverable 1.2 Psychological model predicting acceptability of CAV
Perceived pleasure 3.46/1.37 459 3.97/1.35 3324 7.644 3780 <.001***
Perceived safety 3.87/1.29 459 4.17/1.19 3320 4.675 571.698 <.001***
Perceived convenience 3.66/1.55 459 4.33/1.48 3322 9.094 3779 <.001***
Trust in CAV technology 4.11/1.67 459 4.42/1.53 3323 3.753 569.400 <.001***
Perceived status- enhancement
2.74/1.50
459
3.50/1.63
3323
9.503
3780
<.001***
Perceived environmental sustainability
4.19/1.49
458
4.52/1.42
3323
4.644
3779
<.001***
** = significant at the .01 level, *** = significant at the .001 level.
Additionally, paired sample t-tests were conducted to find differences between vulnerable
road users on the one hand and all other participants on the other hand on the importance of
perceived characteristics of CAV. All results can be seen in Table 13 below. Vulnerable road
users believe control, safety, environmental sustainability, and trust in CAV technology is more
important than other participants. Other participants believe status-enhancement is more
important than vulnerable road users. The groups do not differ on the importance of pleasure
and convenience.
Table 13. Differences between vulnerable road users and all other participants on importance of
perceived characteristics of CAV
Scale VRU (M/SD)
VRU N Others (M/SD)
Others N
t
df
p
Importance of control 6.32/1.10 459 6.03/1.15 3324 -5.096 3781 <.001***
Importance of pleasure 5.18/1.69 459 5.21/1.58 3323 0.352 573.766 .725
Importance of safety 6.66/0.86 459 6.42/1.04 3324 -5.510 659.191 <.001***
Importance of convenience 5.64/1.33 459 5.63/1.24 3323 -0.155 3780 .877
Importance of trust in CAV technology
6.23/1.14
459
6.05/1.14
3324
-3.095
3781
.002**
Importance of status-
enhancement
2.65/1.95
459
3.30/2.08
3324
6.665
612.062
<.001***
Importance of environmental sustainability
5.80/1.39
459
5.59/1.39
3324
-3.154
3781
.002**
** = significant at the .01 level, *** = significant at the .001 level.
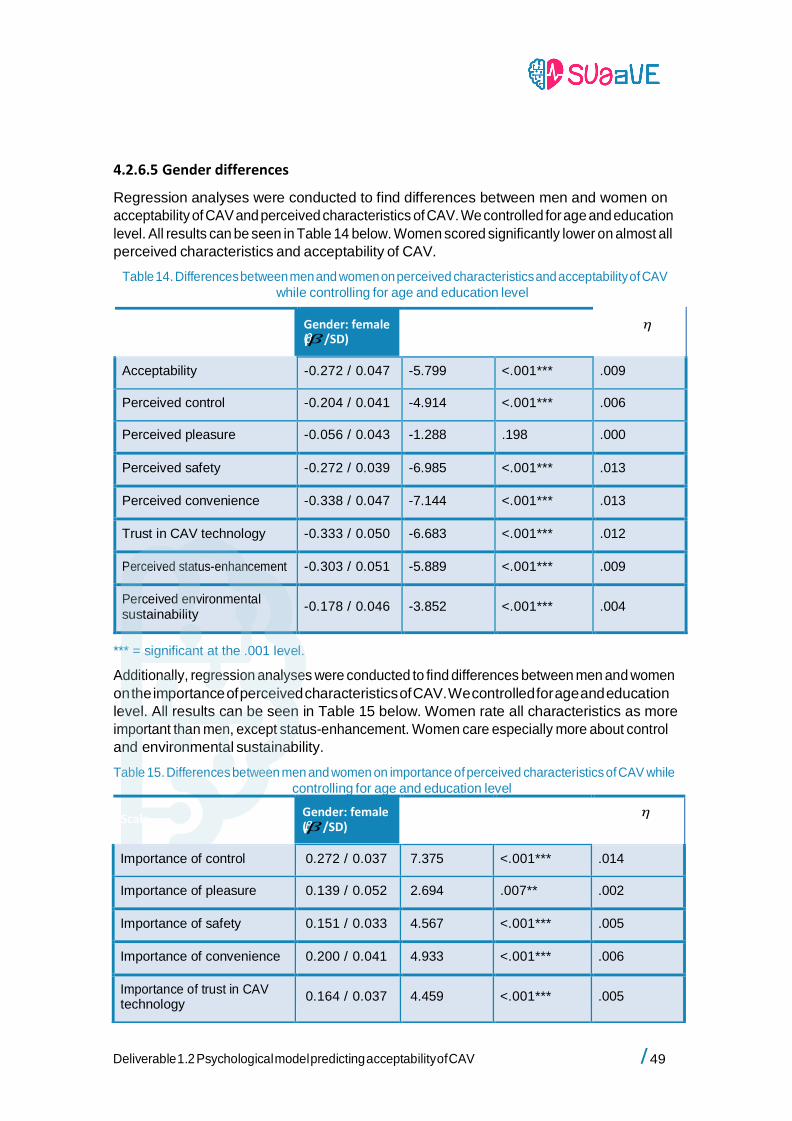
/ 49 Deliverable 1.2 Psychological model predicting acceptability of CAV
4.2.6.5 Gender differences
Regression analyses were conducted to find differences between men and women on
acceptability of CAV and perceived characteristics of CAV. We controlled for age and education
level. All results can be seen in Table 14 below. Women scored significantly lower on almost all
perceived characteristics and acceptability of CAV.
Table 14. Differences between men and women on perceived characteristics and acceptability of CAV
while controlling for age and education level
Scale Gender: female (𝛽/SD)
t
p Partial 𝜂2 of gender
Acceptability -0.272 / 0.047 -5.799 <.001*** .009
Perceived control -0.204 / 0.041 -4.914 <.001*** .006
Perceived pleasure -0.056 / 0.043 -1.288 .198 .000
Perceived safety -0.272 / 0.039 -6.985 <.001*** .013
Perceived convenience -0.338 / 0.047 -7.144 <.001*** .013
Trust in CAV technology -0.333 / 0.050 -6.683 <.001*** .012
Perceived status-enhancement -0.303 / 0.051 -5.889 <.001*** .009
Perceived environmental sustainability
-0.178 / 0.046
-3.852
<.001***
.004
*** = significant at the .001 level.
Additionally, regression analyses were conducted to find differences between men and women
on the importance of perceived characteristics of CAV. We controlled for age and education
level. All results can be seen in Table 15 below. Women rate all characteristics as more
important than men, except status-enhancement. Women care especially more about control
and environmental sustainability.
Table 15. Differences between men and women on importance of perceived characteristics of CAV while
controlling for age and education level
Scale Gender: female (𝛽/SD)
t
p Partial 𝜂2 of gender
Importance of control 0.272 / 0.037 7.375 <.001*** .014
Importance of pleasure 0.139 / 0.052 2.694 .007** .002
Importance of safety 0.151 / 0.033 4.567 <.001*** .005
Importance of convenience 0.200 / 0.041 4.933 <.001*** .006
Importance of trust in CAV technology
0.164 / 0.037
4.459
<.001***
.005
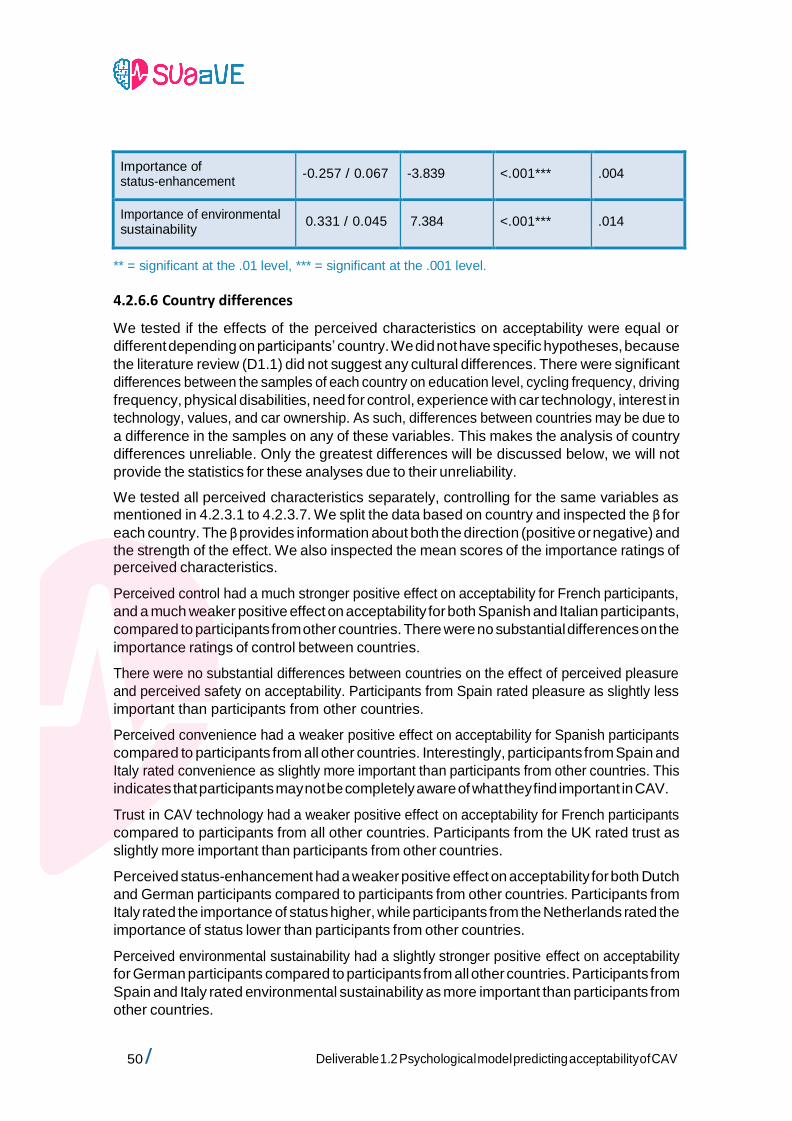
50 / Deliverable 1.2 Psychological model predicting acceptability of CAV
Importance of status-enhancement
-0.257 / 0.067
-3.839
<.001***
.004
Importance of environmental sustainability
0.331 / 0.045
7.384
<.001***
.014
** = significant at the .01 level, *** = significant at the .001 level.
4.2.6.6 Country differences
We tested if the effects of the perceived characteristics on acceptability were equal or
different depending on participants’ country. We did not have specific hypotheses, because
the literature review (D1.1) did not suggest any cultural differences. There were significant
differences between the samples of each country on education level, cycling frequency, driving
frequency, physical disabilities, need for control, experience with car technology, interest in
technology, values, and car ownership. As such, differences between countries may be due to
a difference in the samples on any of these variables. This makes the analysis of country
differences unreliable. Only the greatest differences will be discussed below, we will not
provide the statistics for these analyses due to their unreliability.
We tested all perceived characteristics separately, controlling for the same variables as
mentioned in 4.2.3.1 to 4.2.3.7. We split the data based on country and inspected the β for
each country. The β provides information about both the direction (positive or negative) and
the strength of the effect. We also inspected the mean scores of the importance ratings of perceived characteristics.
Perceived control had a much stronger positive effect on acceptability for French participants,
and a much weaker positive effect on acceptability for both Spanish and Italian participants,
compared to participants from other countries. There were no substantial differences on the
importance ratings of control between countries.
There were no substantial differences between countries on the effect of perceived pleasure
and perceived safety on acceptability. Participants from Spain rated pleasure as slightly less
important than participants from other countries.
Perceived convenience had a weaker positive effect on acceptability for Spanish participants
compared to participants from all other countries. Interestingly, participants from Spain and
Italy rated convenience as slightly more important than participants from other countries. This
indicates that participants may not be completely aware of what they find important in CAV.
Trust in CAV technology had a weaker positive effect on acceptability for French participants
compared to participants from all other countries. Participants from the UK rated trust as
slightly more important than participants from other countries.
Perceived status-enhancement had a weaker positive effect on acceptability for both Dutch
and German participants compared to participants from other countries. Participants from
Italy rated the importance of status higher, while participants from the Netherlands rated the
importance of status lower than participants from other countries.
Perceived environmental sustainability had a slightly stronger positive effect on acceptability
for German participants compared to participants from all other countries. Participants from
Spain and Italy rated environmental sustainability as more important than participants from
other countries.
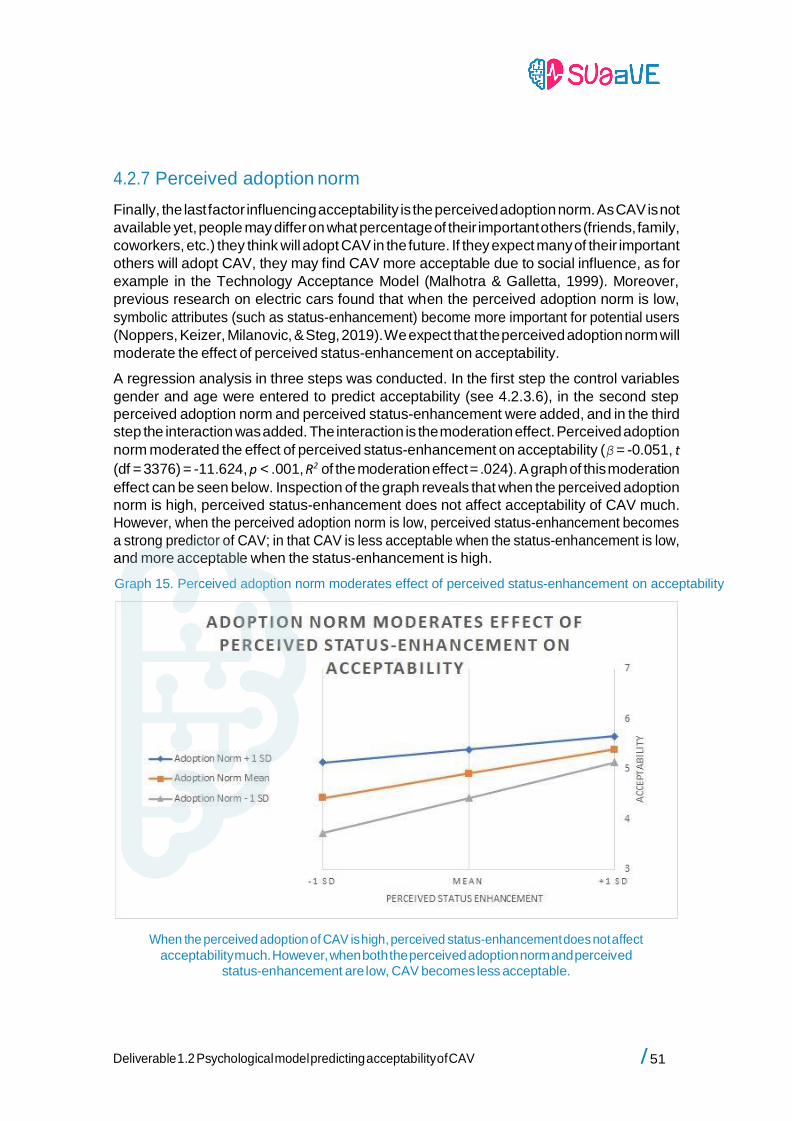
/ 51 Deliverable 1.2 Psychological model predicting acceptability of CAV
4.2.7 Perceived adoption norm
Finally, the last factor influencing acceptability is the perceived adoption norm. As CAV is not
available yet, people may differ on what percentage of their important others (friends, family,
coworkers, etc.) they think will adopt CAV in the future. If they expect many of their important
others will adopt CAV, they may find CAV more acceptable due to social influence, as for
example in the Technology Acceptance Model (Malhotra & Galletta, 1999). Moreover,
previous research on electric cars found that when the perceived adoption norm is low,
symbolic attributes (such as status-enhancement) become more important for potential users
(Noppers, Keizer, Milanovic, & Steg, 2019). We expect that the perceived adoption norm will
moderate the effect of perceived status-enhancement on acceptability.
A regression analysis in three steps was conducted. In the first step the control variables
gender and age were entered to predict acceptability (see 4.2.3.6), in the second step
perceived adoption norm and perceived status-enhancement were added, and in the third
step the interaction was added. The interaction is the moderation effect. Perceived adoption
norm moderated the effect of perceived status-enhancement on acceptability (β = -0.051, t
(df = 3376) = -11.624, p < .001, R2 of the moderation effect = .024). A graph of this moderation
effect can be seen below. Inspection of the graph reveals that when the perceived adoption
norm is high, perceived status-enhancement does not affect acceptability of CAV much.
However, when the perceived adoption norm is low, perceived status-enhancement becomes
a strong predictor of CAV; in that CAV is less acceptable when the status-enhancement is low,
and more acceptable when the status-enhancement is high.
Graph 15. Perceived adoption norm moderates effect of perceived status-enhancement on acceptability
When the perceived adoption of CAV is high, perceived status-enhancement does not affect
acceptability much. However, when both the perceived adoption norm and perceived status-enhancement are low, CAV becomes less acceptable.
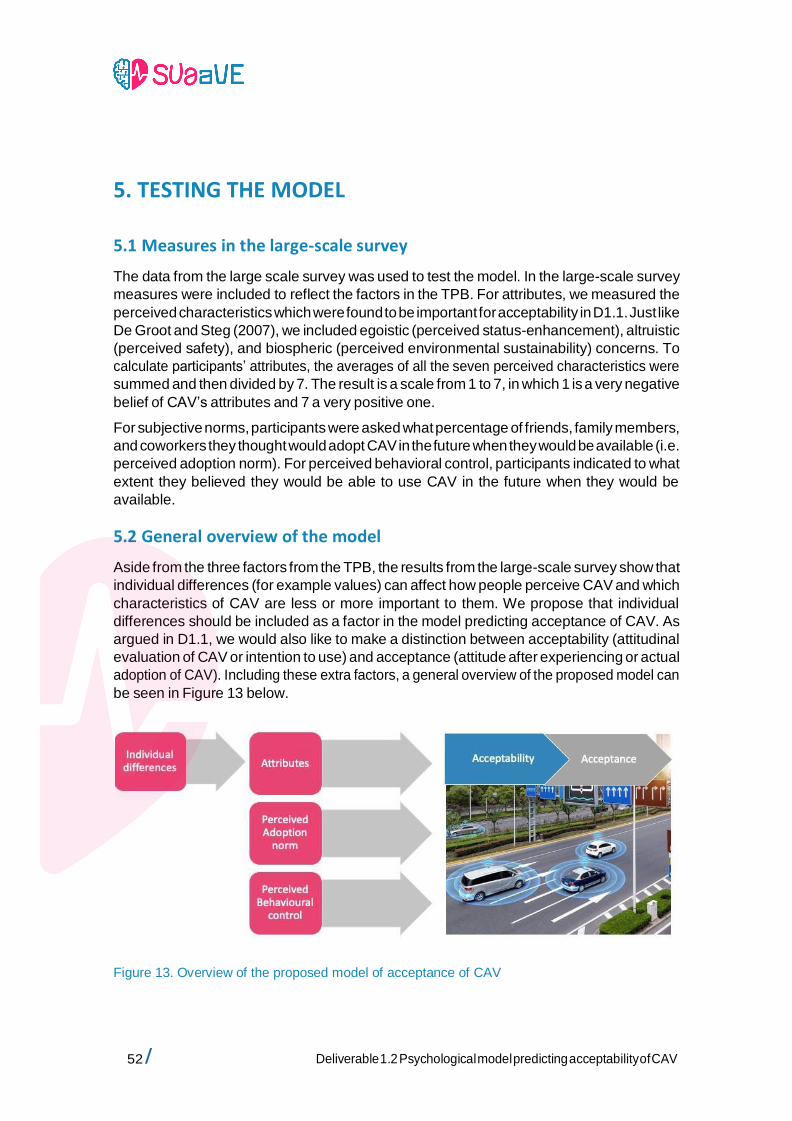
52 / Deliverable 1.2 Psychological model predicting acceptability of CAV
5. TESTING THE MODEL
5.1 Measures in the large-scale survey
The data from the large scale survey was used to test the model. In the large-scale survey
measures were included to reflect the factors in the TPB. For attributes, we measured the
perceived characteristics which were found to be important for acceptability in D1.1. Just like
De Groot and Steg (2007), we included egoistic (perceived status-enhancement), altruistic
(perceived safety), and biospheric (perceived environmental sustainability) concerns. To
calculate participants’ attributes, the averages of all the seven perceived characteristics were
summed and then divided by 7. The result is a scale from 1 to 7, in which 1 is a very negative
belief of CAV’s attributes and 7 a very positive one.
For subjective norms, participants were asked what percentage of friends, family members,
and coworkers they thought would adopt CAV in the future when they would be available (i.e.
perceived adoption norm). For perceived behavioral control, participants indicated to what
extent they believed they would be able to use CAV in the future when they would be
available.
5.2 General overview of the model
Aside from the three factors from the TPB, the results from the large-scale survey show that
individual differences (for example values) can affect how people perceive CAV and which
characteristics of CAV are less or more important to them. We propose that individual
differences should be included as a factor in the model predicting acceptance of CAV. As
argued in D1.1, we would also like to make a distinction between acceptability (attitudinal
evaluation of CAV or intention to use) and acceptance (attitude after experiencing or actual
adoption of CAV). Including these extra factors, a general overview of the proposed model can
be seen in Figure 13 below.
Figure 13. Overview of the proposed model of acceptance of CAV
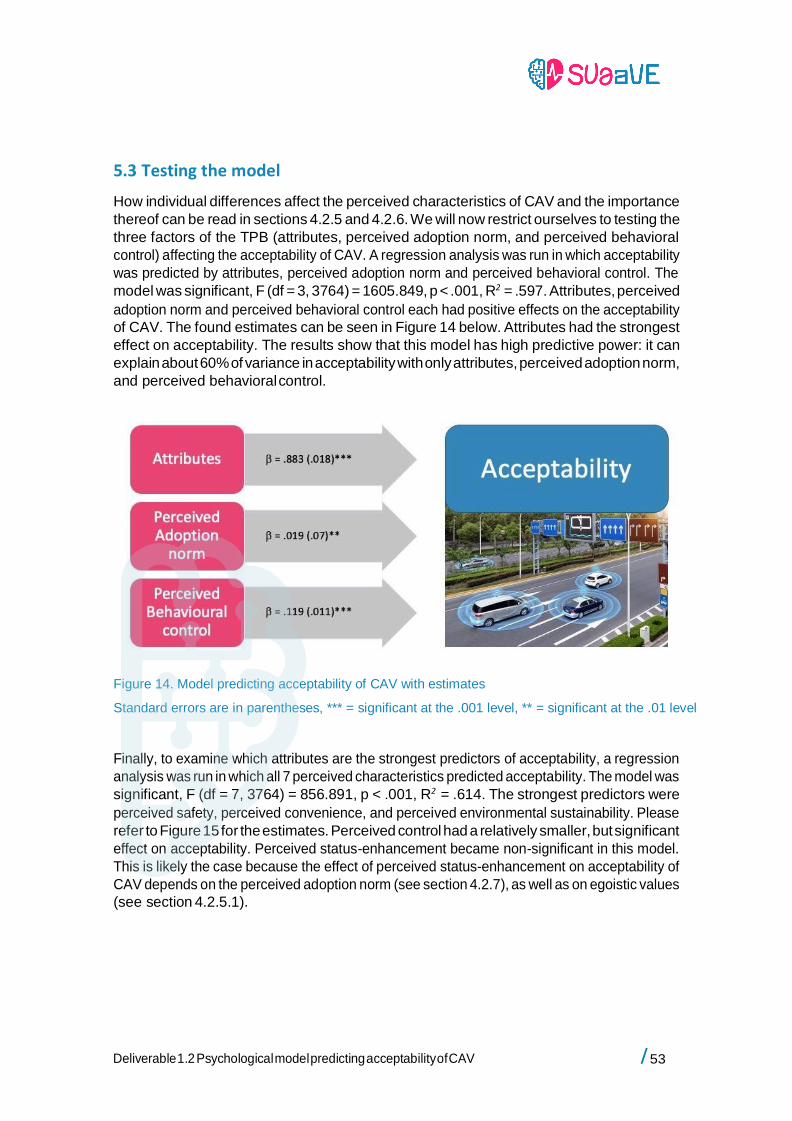
/ 53 Deliverable 1.2 Psychological model predicting acceptability of CAV
5.3 Testing the model
How individual differences affect the perceived characteristics of CAV and the importance
thereof can be read in sections 4.2.5 and 4.2.6. We will now restrict ourselves to testing the
three factors of the TPB (attributes, perceived adoption norm, and perceived behavioral
control) affecting the acceptability of CAV. A regression analysis was run in which acceptability
was predicted by attributes, perceived adoption norm and perceived behavioral control. The
model was significant, F (df = 3, 3764) = 1605.849, p < .001, R2 = .597. Attributes, perceived
adoption norm and perceived behavioral control each had positive effects on the acceptability
of CAV. The found estimates can be seen in Figure 14 below. Attributes had the strongest
effect on acceptability. The results show that this model has high predictive power: it can
explain about 60% of variance in acceptability with only attributes, perceived adoption norm,
and perceived behavioral control.
Figure 14. Model predicting acceptability of CAV with estimates
Standard errors are in parentheses, *** = significant at the .001 level, ** = significant at the .01 level
Finally, to examine which attributes are the strongest predictors of acceptability, a regression
analysis was run in which all 7 perceived characteristics predicted acceptability. The model was
significant, F (df = 7, 3764) = 856.891, p < .001, R2 = .614. The strongest predictors were
perceived safety, perceived convenience, and perceived environmental sustainability. Please
refer to Figure 15 for the estimates. Perceived control had a relatively smaller, but significant
effect on acceptability. Perceived status-enhancement became non-significant in this model.
This is likely the case because the effect of perceived status-enhancement on acceptability of
CAV depends on the perceived adoption norm (see section 4.2.7), as well as on egoistic values
(see section 4.2.5.1).
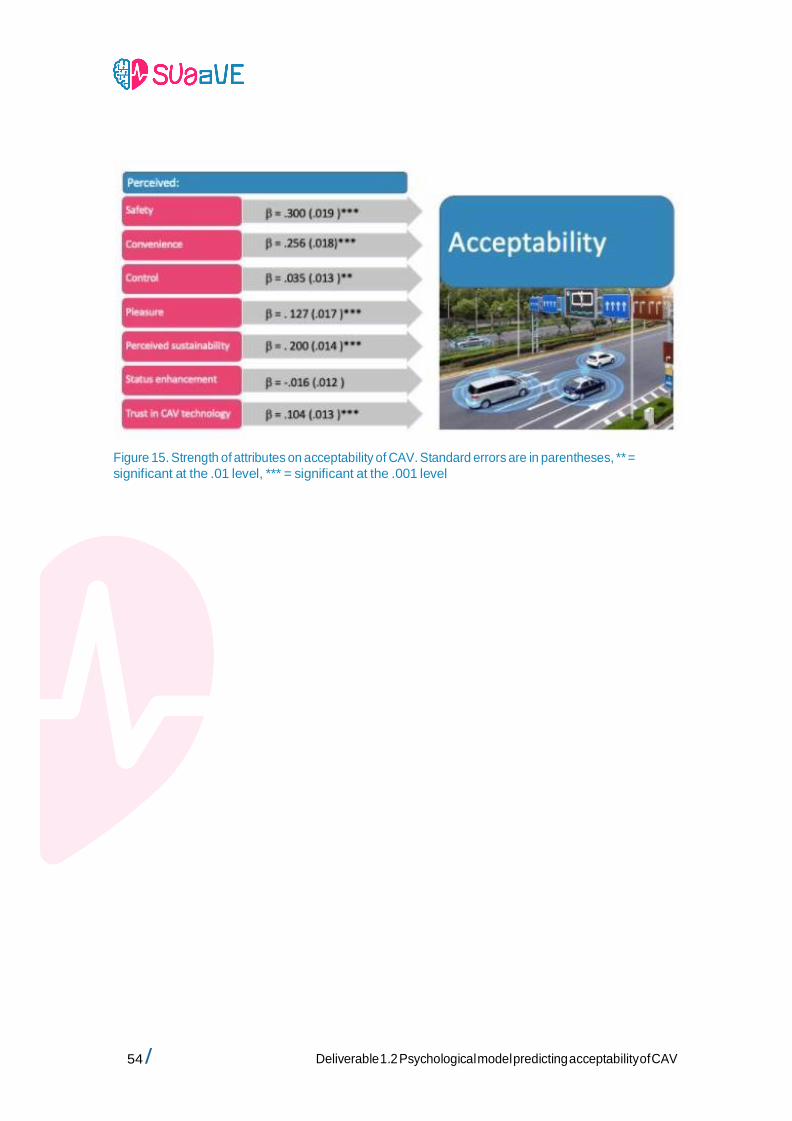
54 / Deliverable 1.2 Psychological model predicting acceptability of CAV
Figure 15. Strength of attributes on acceptability of CAV. Standard errors are in parentheses, ** =
significant at the .01 level, *** = significant at the .001 level
/ 55 Deliverable 1.2 Psychological model predicting acceptability of CAV
6. TECHNICAL & SCIENTIFIC IMPACTS
In this deliverable we have proposed and validated a social psychological model that explains
acceptability of CAV. This is the first model that is tailored to the acceptability of CAV
specifically, which means this model is an innovation compared to general behavioral models.
Moreover, this model has very high predictive power (nearly 60% of all variance in
acceptability can be explained with only attributes, perceived behavioral control, and
perceived adoption norm). With this model, we have gained insight into what aspects of CAV
are the most important for acceptability. These insights can be used by manufacturers and
marketers to increase acceptability of CAV. For this purpose we have compiled some initial
guidelines in section 6.1.
The model lays the foundation for all following research of the SUaaVE project on acceptance.
The results described in this deliverable are also the first step to determine how to increase
acceptance of CAV. This is a scientific advancement; no psychological model that explains the
acceptability of CAV specifically existed.
6.1 Guidelines
Based on the results described in this deliverable, we can provide some initial guidelines on
how to improve acceptability of CAV within the EU.
● Attributes have the strongest impact on acceptability, so manufacturers and
marketers should strive to enhance the perceived characteristics of CAV.
● More specifically, the most effective attributes are perceived safety, perceived convenience, and perceived environmental sustainability. Enhancing these should be
the focus for manufacturers and marketers. For instance, these attributes could be
emphasized in marketing, advertising, and information campaigns.
● Perceived status-enhancement can improve acceptability of CAV when the perceived adoption norm is low. This means that at the deployment of CAV, we could enhance
acceptability by framing it as a status product. However, the effectiveness of perceived
status-enhancement decreases if the perceived adoption norm is high. Once CAV has
managed to gain a decent foothold in the market-share of personal vehicles, CAV does
not have to be seen as a status product anymore to enhance acceptability. Hence, emphasizing the status-enhancing aspect of CAV would particularly be effective in the early adoption phase of this innovation.
● Perceived environmental sustainability is a strong predictor of acceptability, and
environmental issues were widely discussed in the focus groups. It seems some people would prefer CAV to be an electric vehicle, or to at least be a partially non-fossil
fuelled vehicle. Both designing CAV accordingly, as well as emphasizing the environmental sustainability of CAV in marketing, advertising, and information campaigns may enhance acceptability.
● People with great interest in technology are more accepting of CAV. On the contrary,
greater driving and cycling frequency are related to lower perceived safety of CAV, as
well as lower trust in CAV technology. Technology interest sometimes moderates
these effects. Perhaps acceptability can be increased by presenting CAV as a
56 / Deliverable 1.2 Psychological model predicting acceptability of CAV
technological gadget, or by showing excellent safety ratings in real road environments.
● Marketers could design different promotional materials based on the target audience.
People with high biospheric values find CAV generally more acceptable if it is environmentally friendly. People with high egoistic values find CAV more acceptable if it could enhance their status. Lastly, people with a high need for control find CAV
more acceptable if they believe they have some control over the vehicle’s behavior.
/ 57 Deliverable 1.2 Psychological model predicting acceptability of CAV
7. CONCLUSION
We have developed and tested the social psychological model to explain and promote public
acceptability of CAV among different types of user groups. We have also provided some initial
guidelines to enhance acceptability of CAV. The project has achieved the objectives of this
deliverable.
We find that acceptability is predicted by attributes of CAV, perceived adoption norm, and
perceived behavioral control, in which attributes is the strongest predictor. Attributes of CAV
consist of seven distinct perceived characteristics of CAV: perceived safety, perceived
convenience, perceived pleasure, perceived control, perceived status-enhancement, perceived
environmental sustainability, and trust in CAV technology. Out of these perceived
characteristics, perceived safety, perceived convenience, and perceived environmental
sustainability are the strongest predictors of public acceptability of CAV.
We also find that attributes are influenced by individual differences, and sometimes the effect
of attributes on acceptability is moderated by individual differences as well. The main individual differences that influence attributes are values (mainly egoistic and biospheric), cycling and driving frequency, and need for control.
The data from the large scale survey supports the proposed model. Nearly 60% of all variance in acceptability can be explained by only attributes, perceived behavioral control, and
perceived adoption norm. This is a rather high percentage of explained variance for a
behavioral model. Our model is an innovation because this is the first model that is tailored to
CAV specifically, and it has high predictive value. Moreover, the data from 6 different
European countries support the model.
58 / Deliverable 1.2 Psychological model predicting acceptability of CAV
8. REFERENCES
Ajzen, I. (1985). From intentions to actions: A theory of planned behavior. In J. Kuhl & J.
Beckman (Eds.). Action–control: From cognition to behavior (pp. 11–39). Heidelberg, Germany:
Springer.
Becker, F., & Axhausen, K. W. (2017). Literature review on surveys investigating the acceptance
of automated vehicles. Transportation, 44(6), 1293-1306.
Bellet, T., Paris, J. C., & Marin-Lamellet, C. (2018). Difficulties experienced by older drivers
during their regular driving and their expectations towards Advanced Driving Aid Systems and
vehicle automation. Transportation Research Part F: Traffic Psychology and Behavior, 52,
138-163.
Burger, J. M., & Cooper, H. M. (1979). The desirability of control. Motivation and Emotion, 3(4),
381-393.
Davis, F. D. (1986). A technology acceptance model for empirically testing new end-user
information systems: Theory and results. Ph.D. dissertation, Massachusetts Institute of
Technology.
De Groot, J., & Steg, L. (2007). General beliefs and the theory of planned behavior: The role of
environmental concerns in the TPB. Journal of Applied Social Psychology, 37(8), 1817-1836.
Gold, C., Körber, M., Hohenberger, C., Lechner, D., & Bengler, K. (2015). Trust in automation –
Before and after the experience of take-over scenarios in a highly automated vehicle. Procedia Manufacturing, 3, 3025-3032.
Goldsmith, R. E., Flynn, L. R., & Kim, D. (2010). Status consumption and price sensitivity.
Journal of Marketing Theory and Practice, 18(4), 323-338.
Haboucha, C. J., Ishaq, R., & Shiftan, Y. (2017). User preferences regarding autonomous
vehicles. Transportation Research Part C: Emerging Technologies, 78, 37-49.
Hohenberger, C., Spörrle, M., & Welpe, I. M. (2016). How and why do men and women differ in
their willingness to use automated cars? The influence of emotions across different age
groups. Transportation Research Part A: Policy and Practice, 94, 374-385.
Howard, D., & Dai, D. (2014). Public perceptions of self-driving cars: The case of Berkeley,
California. In Transportation Research Board 93rd Annual Meeting 14, (4502) 1-16.
Kyriakidis, M., Happee, R., & de Winter, J. C. (2015). Public opinion on automated driving:
Results of an international questionnaire among 5000 respondents. Transportation Research
Part F: Traffic Psychology and Behaviour, 32, 127-140.
Leotti, L. A., Iyengar, S. S., & Ochsner, K. N. (2010). Born to choose: The origins and value of the
need for control. Trends in Cognitive Sciences, 14(10), 457-463.
Malhotra, Y., & Galletta, D. F. (1999, January). Extending the technology acceptance model to
account for social influence: Theoretical bases and empirical validation. In Proceedings of the
/ 59 Deliverable 1.2 Psychological model predicting acceptability of CAV
32nd Annual Hawaii International Conference on Systems Sciences. 1999. HICSS-32. Abstracts
and CD-ROM of Full Papers (pp. 14-pp). IEEE.
Montoro, L., Useche, S. A., Alonso, F., Lijarcio, I., Bosó-Seguí, P., & Martí-Belda, A. (2019).
Perceived safety and attributed value as predictors of the intention to use autonomous
vehicles: A national study with Spanish drivers. Safety Science, 120, 865-876.
Nguyen, N., Greenland, S., Lobo, A., & Nguyen, H. V. (2019). Demographics of sustainable
technology consumption in an emerging market: the significance of education to energy
efficient appliance adoption. Social Responsibility Journal, 15(6), 803-818.
Noppers, E., Keizer, K., Milovanovic, M., & Steg, L. (2019). The role of adoption norms and
perceived product attributes in the adoption of Dutch electric vehicles and smart energy
systems. Energy Research & Social Science, 57, 101237.
Qu, W., Xu, J., Ge, Y., Sun, X., & Zhang, K. (2019). Development and validation of a
questionnaire to assess public receptivity toward autonomous vehicles and its relation with
the traffic safety climate in China. Accident Analysis & Prevention, 128, 78-86.
Regan, M., Cunningham, M., Dixit, V., Horberry, T., Bender, A., Weeratunga, K., & Hassan, A.
(2017). Preliminary findings from the first Australian national survey of public opinion about
automated and driverless vehicles. Australia and New Zealand Driverless Vehicle Initiative online at https://s3-ap-southeast-2.amazonaws.com/cdn-advi/wp-content
Rosseel, Y. (2012). lavaan: An R Package for Structural Equation Modeling. Journal of Statistical Software, 48(2), 1–36. http://www.jstatsoft.org/v48/i02/.
Schaefer, K. E., Billings, D. R., Szalma, J. L., Adams, J. K., Sanders, T. L., Chen, J. Y., & Hancock, P.
A. (2014). A meta-analysis of factors influencing the development of trust in automation:
Implications for human-robot interaction (No. ARL-TR-6984). Army Research Lab Aberdeen.
Shin, K. J., Tada, N., & Managi, S. (2019). Consumer demand for fully automated driving
technology. Economic Analysis and Policy, 61, 16-28.
Schwartz, S. H. (1992). Universals in the content and structure of values: Theoretical advances
and empirical tests in 20 countries. In M. Zanna (Ed.), Advances in Experimental Social
Psychology (Vol. 25, pp. 1-65). Orlando, FL: Academic Press.
Steg, L., & De Groot, J. I. (2012). Environmental values. In The Oxford Handbook of Environmental and Conservation Psychology.
Steg, L., Perlaviciute, G., Van der Werff, E., & Lurvink, J. (2014). The significance of hedonic
values for environmentally relevant attitudes, preferences, and actions. Environment and
Behavior, 46(2), 163-192.
Tavakol, M., & Dennick, R. (2011). Making sense of Cronbach's alpha. International Journal of Medical Education, 2, 53-55.