support rand for more information€¦ · published 2008 by the rand corporation 1776 main street,...
TRANSCRIPT

This document and trademark(s) contained herein are protected by law as indicated in a notice appearing later in this work. This electronic representation of RAND intellectual property is provided for non-commercial use only. Unauthorized posting of RAND PDFs to a non-RAND Web site is prohibited. RAND PDFs are protected under copyright law. Permission is required from RAND to reproduce, or reuse in another form, any of our research documents for commercial use. For information on reprint and linking permissions, please see RAND Permissions.
Limited Electronic Distribution Rights
Visit RAND at www.rand.org
Explore the RAND National Defense
Research Institute
View document details
For More Information
This PDF document was made available
from www.rand.org as a public service of
the RAND Corporation.
6Jump down to document
THE ARTS
CHILD POLICY
CIVIL JUSTICE
EDUCATION
ENERGY AND ENVIRONMENT
HEALTH AND HEALTH CARE
INTERNATIONAL AFFAIRS
NATIONAL SECURITY
POPULATION AND AGING
PUBLIC SAFETY
SCIENCE AND TECHNOLOGY
SUBSTANCE ABUSE
TERRORISM AND HOMELAND SECURITY
TRANSPORTATION ANDINFRASTRUCTURE
WORKFORCE AND WORKPLACE
The RAND Corporation is a nonprofit research organization providing objective analysis and effective solutions that address the challenges facing the public and private sectors around the world.
Purchase this document
Browse Books & Publications
Make a charitable contribution
Support RAND
This product is part of the RAND Corporation monograph series.
RAND monographs present major research findings that address the
challenges facing the public and private sectors. All RAND mono-
graphs undergo rigorous peer review to ensure high standards for
research quality and objectivity.
Titus Galama, James Hosek
Prepared for the Office of the Secretary of DefenseApproved for public release; distribution unlimited
NATIONAL DEFENSE RESEARCH INSTITUTE
U.S. Competitiveness in Science and Technology
The RAND Corporation is a nonprofit research organization providing objective analysis and effective solutions that address the challenges facing the public and private sectors around the world. RAND’s publications do not necessarily reflect the opinions of its research clients and sponsors.
R® is a registered trademark.
© Copyright 2008 RAND Corporation
All rights reserved. No part of this book may be reproduced in any form by any electronic or mechanical means (including photocopying, recording, or information storage and retrieval) without permission in writing from RAND.
Published 2008 by the RAND Corporation1776 Main Street, P.O. Box 2138, Santa Monica, CA 90407-2138
1200 South Hayes Street, Arlington, VA 22202-50504570 Fifth Avenue, Suite 600, Pittsburgh, PA 15213-2665
RAND URL: http://www.rand.orgTo order RAND documents or to obtain additional information, contact
Distribution Services: Telephone: (310) 451-7002; Fax: (310) 451-6915; Email: [email protected]
Library of Congress Cataloging-in-Publication Data is available for this publication.
ISBN 978-0-8330-4424-2
The research described in this report was prepared for the Office of the Secretary of Defense (OSD). The research was conducted in the RAND National Defense Research Institute, a federally funded research and development center sponsored by the OSD, the Joint Staff, the Unified Combatant Commands, the Department of the Navy, the Marine Corps, the defense agencies, and the defense Intelligence Community under Contract W74V8H-06-C-0002.

iii
Preface
Concern has grown that the United States is losing its position as a global leader in science and technology (S&T). The factors driving this concern include the globalization of S&T, the rise of science centers in developing countries such as China and India, and the perception that the United States is not investing enough in its future given the existing pressures on its S&T enterprise. A loss of leadership in S&T could hurt the U.S. economy, living standards, and national security. The Under Secretary of Defense for Personnel and Readiness asked the National Defense Research Institute (NDRI) at the RAND Cor-poration to convene a meeting to review the evidence and hear the views of experts with relevant knowledge on the perception that the United States is losing its edge in S&T and on the potential impli-cations for national security. The meeting was held on November 8, 2006, in Washington, D.C. Papers prepared for the meeting have been published in a companion volume, Perspectives on U.S. Competitiveness in Science and Technology (Galama and Hosek, 2007), and are available online through the RAND Web site. The present volume, which draws on and adds to the papers prepared for the November 8 meeting, aims to provide an overview of facts, challenges, and questions posed by the possible erosion of U.S. S&T leadership and to discuss policy implica-tions and provide recommendations.
This report may be useful to those in government, business, research and development, academic institutions, national security, and policy research with an interest in U.S. competitiveness in S&T. This research was sponsored by the Office of the Under Secretary of

iv U.S. Competitiveness in Science and Technology
Defense for Personnel and Readiness and conducted within the Forces and Resources Policy Center of the RAND National Defense Research Institute, a federally funded research and development center spon-sored by the Office of the Secretary of Defense, the Joint Staff, the Uni-fied Combatant Commands, the Department of the Navy, the Marine Corps, the defense agencies, and the defense Intelligence Community.
For more information on the RAND Forces and Resources Policy Center, contact the Director, James Hosek. He can be reached by email at [email protected]; by phone at 310-393-0411, extension 7183; or by mail at the RAND Corporation, 1776 Main Street, Santa Monica, California 90407-2138. More information about RAND is available at www.rand.org.
v
Contents
Preface . . . . . . . . . . . . . . . . . . . . . . . . . . . . . . . . . . . . . . . . . . . . . . . . . . . . . . . . . . . . . . . . . . . . . . . . . . . . . iiiFigures . . . . . . . . . . . . . . . . . . . . . . . . . . . . . . . . . . . . . . . . . . . . . . . . . . . . . . . . . . . . . . . . . . . . . . . . . . . . . ix Tables . . . . . . . . . . . . . . . . . . . . . . . . . . . . . . . . . . . . . . . . . . . . . . . . . . . . . . . . . . . . . . . . . . . . . . . . . . . . . . xi Summary . . . . . . . . . . . . . . . . . . . . . . . . . . . . . . . . . . . . . . . . . . . . . . . . . . . . . . . . . . . . . . . . . . . . . . . . . xiiiAcknowledgments . . . . . . . . . . . . . . . . . . . . . . . . . . . . . . . . . . . . . . . . . . . . . . . . . . . . . . . . . . . . . xxixAbbreviations and Glossary. . . . . . . . . . . . . . . . . . . . . . . . . . . . . . . . . . . . . . . . . . . . . . . . . xxxi
CHAPTER ONE
Introduction . . . . . . . . . . . . . . . . . . . . . . . . . . . . . . . . . . . . . . . . . . . . . . . . . . . . . . . . . . . . . . . . . . . . . . . 1The Basis for Perceptions of America’s Diminishing Edge in S&T . . . . . . . . . . 3What If the United States Loses Its Edge in S&T? . . . . . . . . . . . . . . . . . . . . . . . . . . . 4The Perception of an S&T Threat Started a Groundswell of Policy
Action . . . . . . . . . . . . . . . . . . . . . . . . . . . . . . . . . . . . . . . . . . . . . . . . . . . . . . . . . . . . . . . . . . . . . . . . . . . 7Is the Clarion Call Warranted? . . . . . . . . . . . . . . . . . . . . . . . . . . . . . . . . . . . . . . . . . . . . . . . . . . . 9Purpose of This Report . . . . . . . . . . . . . . . . . . . . . . . . . . . . . . . . . . . . . . . . . . . . . . . . . . . . . . . . . . 12Organization of This Report . . . . . . . . . . . . . . . . . . . . . . . . . . . . . . . . . . . . . . . . . . . . . . . . . . . . . 13
CHAPTER TWO
What Are the Implications of the Globalization of S&T and the Rise of Other Nations for U.S. Performance in S&T? . . . . . . . . . . 15
2.1. What Facts Suggest That Other Nations or Regions Are Developing Significant Strength in S&T While the United States Is Falling Behind? . . . . . . . . . . . . . . . . . . . . . . . . . . . . . . . . . . . . . . . . . . . . . . . . . . . . . . . . . . . 16
Is R&D Rapidly Increasing in Major Nations or Regions Other Than the United States? . . . . . . . . . . . . . . . . . . . . . . . . . . . . . . . . . . . . . . . . . . . . . . . . . . . 21
Is S&T Employment Growing More Rapidly in Other Nations or Regions? . . . . . . . . . . . . . . . . . . . . . . . . . . . . . . . . . . . . . . . . . . . . . . . . . . . . . . . . . . . . . . . . . . . . 24

vi U.S. Competitiveness in Science and Technology
Are Other Nations or Regions Educating Their Populations in S&T More Rapidly Than the United States? . . . . . . . . . . . . . . . . . . . . . . . . . . . . . . . . . . 25
Is Innovation and Scientific Discovery Increasingly Taking Place Elsewhere? . . . . . . . . . . . . . . . . . . . . . . . . . . . . . . . . . . . . . . . . . . . . . . . . . . . . . . . . . . . . . . . . . 28
Are Other Nations or Regions Becoming More Capable of Acquiring and Implementing New Technology and Information? . . . . . . . . . . . . . . . 35
Discussion . . . . . . . . . . . . . . . . . . . . . . . . . . . . . . . . . . . . . . . . . . . . . . . . . . . . . . . . . . . . . . . . . . . . . . . . . 382.2. Will the Globalization of S&T and the Rise of Other Nations
Make It More Difficult for the United States to Be Successful in S&T? . . . . . . . . . . . . . . . . . . . . . . . . . . . . . . . . . . . . . . . . . . . . . . . . . . . . . . . . . . . . . . . . . . . . . . . 39
Are American S&T Jobs Likely to Go Overseas? . . . . . . . . . . . . . . . . . . . . . . . . . 42Does the Changing Nature of Innovation Pose a Threat to
America’s Strong Performance in S&T? . . . . . . . . . . . . . . . . . . . . . . . . . . . . . . . . 44Conclusion . . . . . . . . . . . . . . . . . . . . . . . . . . . . . . . . . . . . . . . . . . . . . . . . . . . . . . . . . . . . . . . . . . . . . . . . . 52
CHAPTER THREE
What Evidence Suggests That the United States Has Been Underinvesting in S&T? . . . . . . . . . . . . . . . . . . . . . . . . . . . . . . . . . . . . . . . . . . . . . . . . . . . 55
3.1. Is the United States Investing Enough in R&D to Return to, or Sustain, Its Leadership Position in S&T? . . . . . . . . . . . . . . . . . . . . . . . . . . . . . . . . . 57
Are Total R&D Expenditures Growing More Slowly Than in the Past? . . . . . . . . . . . . . . . . . . . . . . . . . . . . . . . . . . . . . . . . . . . . . . . . . . . . . . . . . . . . . . . . . 60
Are R&D Expenditures on Basic Research—Both Federally and Privately Funded—in Decline? . . . . . . . . . . . . . . . . . . . . . . . . . . . . . . . . . . . . . . . . . . . 61
Has Federally Funded Research in General Decreased? . . . . . . . . . . . . . . . . . . . 61Has Funding for Academic Research Slowed?. . . . . . . . . . . . . . . . . . . . . . . . . . . . . . . 63Has Federal Funding for Research in the Physical Sciences,
Mathematics, and Engineering Declined? . . . . . . . . . . . . . . . . . . . . . . . . . . . . . 64Discussion and Conclusion . . . . . . . . . . . . . . . . . . . . . . . . . . . . . . . . . . . . . . . . . . . . . . . . . . . . . 663.2. Will the U.S. K–12 Education System Be Able to Generate
the Talent in Science and Math to Meet the Future Demands of the Global Marketplace? . . . . . . . . . . . . . . . . . . . . . . . . . . . . . . . . . . . . . . . . . . . . . . . . . 69
How Does U.S. Spending on Education Compare with Other Nations? . . . . . . . . . . . . . . . . . . . . . . . . . . . . . . . . . . . . . . . . . . . . . . . . . . . . . . . . . . . . 72
How Are K–12 Students Performing in Science and Math— Both by National Standards and Relative to Other Nations? . . . . . . . . 72

Contents vii
What Is the Past, Present, and Future Education Attainment of the U.S. Population? . . . . . . . . . . . . . . . . . . . . . . . . . . . . . . . . . . . . . . . . . . . . . . . . . . . . 76
Discussion and Conclusion . . . . . . . . . . . . . . . . . . . . . . . . . . . . . . . . . . . . . . . . . . . . . . . . . . . . . . 823.3. Can America Continue to Meet the Demand for Well-Trained,
Well-Prepared S&E Workers? . . . . . . . . . . . . . . . . . . . . . . . . . . . . . . . . . . . . . . . . . . . . . 84Have S&E Careers Become Increasingly Unattractive to
U.S. Citizens? . . . . . . . . . . . . . . . . . . . . . . . . . . . . . . . . . . . . . . . . . . . . . . . . . . . . . . . . . . . . . . 88Is There a Shortage of Qualified Scientists and Engineers? . . . . . . . . . . . . . . . . 95Is the United States Becoming Increasingly Reliant on Foreign
S&E Professionals? . . . . . . . . . . . . . . . . . . . . . . . . . . . . . . . . . . . . . . . . . . . . . . . . . . . . . . . . 97Are Foreign Scientists and Engineers Working in the United States
Increasingly Returning Home? . . . . . . . . . . . . . . . . . . . . . . . . . . . . . . . . . . . . . . . . . 103Do Foreign Professionals Working in the United States Appear
to Be as Productive as Native S&E Professionals? . . . . . . . . . . . . . . . . . . . 107Do Foreign Professionals Working in the United States Reduce
Wages for S&E Jobs? . . . . . . . . . . . . . . . . . . . . . . . . . . . . . . . . . . . . . . . . . . . . . . . . . . . . 111Discussion and Conclusion . . . . . . . . . . . . . . . . . . . . . . . . . . . . . . . . . . . . . . . . . . . . . . . . . . . 113
CHAPTER FOUR
Discussion and Recommendations . . . . . . . . . . . . . . . . . . . . . . . . . . . . . . . . . . . . . . . . . 119Infrastructure . . . . . . . . . . . . . . . . . . . . . . . . . . . . . . . . . . . . . . . . . . . . . . . . . . . . . . . . . . . . . . . . . . . . 124Education . . . . . . . . . . . . . . . . . . . . . . . . . . . . . . . . . . . . . . . . . . . . . . . . . . . . . . . . . . . . . . . . . . . . . . . . 126S&E Workforce . . . . . . . . . . . . . . . . . . . . . . . . . . . . . . . . . . . . . . . . . . . . . . . . . . . . . . . . . . . . . . . . . 128Recommendations for Policy- and Decisionmakers . . . . . . . . . . . . . . . . . . . . . . . . 134
Appendix: Current Population Survey Data Analysis . . . . . . . . . . . . . . . . . . 139
References . . . . . . . . . . . . . . . . . . . . . . . . . . . . . . . . . . . . . . . . . . . . . . . . . . . . . . . . . . . . . . . . . . . . . . . 143


ix
Figures
1.1. GDP at PPP Current International $ . . . . . . . . . . . . . . . . . . . . . . . . . . . . . . 5 2.1. Selected Indicators for Research and Innovation
Input/Activity, Output, and Outcomes . . . . . . . . . . . . . . . . . . . . . . . . . . 20 2.2. R&D Funding in Current Dollars at PPP as Percentage
of World Total . . . . . . . . . . . . . . . . . . . . . . . . . . . . . . . . . . . . . . . . . . . . . . . . . . . . . . . 22 2.3. R&D Intensity: Gross Domestic Expenditure on R&D
as Percentage of Gross Domestic Product, 1985–2005 . . . . . . . . 23 2.4. Full-Time Equivalent Researchers . . . . . . . . . . . . . . . . . . . . . . . . . . . . . . . . 24 2.5. First University Degrees in S&E, 2002 . . . . . . . . . . . . . . . . . . . . . . . . . 26 2.6. Triadic Patents in 1985, 1993, and 2003, by Nation/Region . . . 29 2.7. Share of World S&T Publications . . . . . . . . . . . . . . . . . . . . . . . . . . . . . . . . . 31 2.8. Share of World S&T Citations . . . . . . . . . . . . . . . . . . . . . . . . . . . . . . . . . . . . . 32 2.9. Share of World’s Top 1 Percent Most-Cited
S&T Publications . . . . . . . . . . . . . . . . . . . . . . . . . . . . . . . . . . . . . . . . . . . . . . . . . . . . 33 2.10. Research Footprints . . . . . . . . . . . . . . . . . . . . . . . . . . . . . . . . . . . . . . . . . . . . . . . . 34 2.11. Per Capita Gross Domestic Product at PPP . . . . . . . . . . . . . . . . . . . . . . 47 3.1. Total U.S. R&D Expenditures, by Character of Work,
1953–2004 . . . . . . . . . . . . . . . . . . . . . . . . . . . . . . . . . . . . . . . . . . . . . . . . . . . . . . . . . . . . 61 3.2. Total U.S. R&D Expenditures, by Funding Source,
1953–2004 . . . . . . . . . . . . . . . . . . . . . . . . . . . . . . . . . . . . . . . . . . . . . . . . . . . . . . . . . . . 62 3.3. Share of Total U.S. R&D Expenditures, by Performer,
1953–2004 . . . . . . . . . . . . . . . . . . . . . . . . . . . . . . . . . . . . . . . . . . . . . . . . . . . . . . . . . . . . 63 3.4. Federal Defense and Non-Defense R&D Outlays,
1949–2006 . . . . . . . . . . . . . . . . . . . . . . . . . . . . . . . . . . . . . . . . . . . . . . . . . . . . . . . . . . . 64 3.5. Federal Obligations for Basic Research, by Field,
1970–2003 . . . . . . . . . . . . . . . . . . . . . . . . . . . . . . . . . . . . . . . . . . . . . . . . . . . . . . . . . . . . 65 3.6. Federal Basic and Applied Research Outlays, 1990–2006 . . . . . 66

x U.S. Competitiveness in Science and Technology
3.7. Annual Expenditures per Student Relative to GDP per Capita for Elementary and Secondary and Postsecondary Education in Selected OECD Countries, 2002 . . . . . . . . . . . . . . . . . . . . . . . . . . . . . . . . . . . . . . . . . . . . . . . . . . . . . . . . . . . . . . . . . . . 73
3.8. Reading Average Scale Scores Ages 9, 13, and 17 . . . . . . . . . . . . . . . . 74 3.9. Mathematics Average Scale Scores Ages 9, 13, and 17 . . . . . . . . . . 75 3.10. High School Completion Rate . . . . . . . . . . . . . . . . . . . . . . . . . . . . . . . . . . . . 77 3.11. Percentage of Public High School Students Taking
Selected Courses in Mathematics and Science . . . . . . . . . . . . . . . . . . . 79 3.12. College Enrollment Rate Total and by Ethnicity,
1972–2004 . . . . . . . . . . . . . . . . . . . . . . . . . . . . . . . . . . . . . . . . . . . . . . . . . . . . . . . . . . . 80 3.13. 2000 Median Earnings, by Occupation and Degree . . . . . . . . . . . . 89 3.14. Median Salary of Scientists and Engineers, by Field . . . . . . . . . . . . 91 3.15. Foreign Share of S&E Degrees, by Degree and Field . . . . . . . . . . . 93 3.16. Foreign Fraction of S&E Degrees . . . . . . . . . . . . . . . . . . . . . . . . . . . . . . . . . 94 3.17. Unemployment Rate. . . . . . . . . . . . . . . . . . . . . . . . . . . . . . . . . . . . . . . . . . . . . . . . 97 3.18. Median Salary of Scientists, Engineers, Doctors,
and Lawyers . . . . . . . . . . . . . . . . . . . . . . . . . . . . . . . . . . . . . . . . . . . . . . . . . . . . . . . . . 98 3.19. Annual Average Growth Rate of Degree Production and
Occupational Employment, by S&E Field . . . . . . . . . . . . . . . . . . . . . . 99 3.20. Percentage of Non-U.S. Citizens . . . . . . . . . . . . . . . . . . . . . . . . . . . . . . . . . 101 3.21. Percentage of Non-U.S. S&E Workers, by Age Group . . . . . . . . 102 3.22. Percentage of Foreign PhD Recipients in S&E from
U.S. Universities with Definite Plans to Stay . . . . . . . . . . . . . . . . . . . 104 3.23. Foreign Recipients of U.S. S&E Doctorates Who Were
in the United States Two Years after Graduation, 1989–2003 . . . . . . . . . . . . . . . . . . . . . . . . . . . . . . . . . . . . . . . . . . . . . . . . . . . . . . . . . . 105
3.24. Median U.S. Citizen Salaries Versus Percentage of Non-U.S. Citizens in the Workforce . . . . . . . . . . . . . . . . . . . . . . . . . . . . 109
3.25. Median Salaries of U.S. Citizens Versus Those of Non-U.S. Citizens . . . . . . . . . . . . . . . . . . . . . . . . . . . . . . . . . . . . . . . . . . . . . . . . . 110
3.26. Percentage of Non-U.S. S&E Workers, by Income Percentile . . . . . . . . . . . . . . . . . . . . . . . . . . . . . . . . . . . . . . . . . . . . . . . . . . . . . . . . . . . . 111
3.27. Average Salaries of U.S. and Non-U.S. S&E Workers, by Percentiles . . . . . . . . . . . . . . . . . . . . . . . . . . . . . . . . . . . . . . . . . . . . . . . . . . . . . . . 112
xi
Tables
2.1. Earned Doctoral Degrees in S&E, by Nation/Region . . . . . . . . . 27 3.1. R&D Expenditures, by Type . . . . . . . . . . . . . . . . . . . . . . . . . . . . . . . . . . . . . . 60 3.2. Total Degrees Awarded in Any Field . . . . . . . . . . . . . . . . . . . . . . . . . . . . . 92 3.3. Degrees Awarded in Science and Engineering: Total and as a
Percentage of All Degrees Awarded in Any Field . . . . . . . . . . . . . . . 92 3.4. Earned U.S. Doctoral Degrees in S&E, by Citizenship . . . . . . 106 3.5. Employed, Foreign-Born Scientists and Engineers in
the United States, with a Bachelor’s Degree or Higher Degrees and with PhDs . . . . . . . . . . . . . . . . . . . . . . . . . . . . . . . . . . . . . . . . . . . 108
A.1. Occupational Categories . . . . . . . . . . . . . . . . . . . . . . . . . . . . . . . . . . . . . . . . . . 141 A.2. CPS Sample, Total S&E Records . . . . . . . . . . . . . . . . . . . . . . . . . . . . . . . . 141 A.3. CPS Sample, Total Non-S&E Records . . . . . . . . . . . . . . . . . . . . . . . . . 141


xiii
Summary
The purpose of this report is to present and consider information related to whether the United States is losing its edge in science and technology (S&T). Claims have been made about insufficient expen-ditures on research and development (R&D) (particularly on basic research), problems with U.S. education in science and engineering (S&E),1 a shortage of S&E workers in the United States, increasing reliance on foreigners in the workforce, and decreasing attractiveness of S&E careers to U.S. citizens. A loss of leadership in S&T could diminish U.S. economic growth, standard of living, and national security.
This report cites arguments made to support the contention of a creeping S&T crisis in the United States, contrasts the argu-ments with relevant data, and considers them from additional angles. Specifically, we review literature on the topic of U.S. leadership in S&T and input from various experts who attended the November 8, 2006, meeting, organized by the National Defense Research Institute (NDRI) at the RAND Corporation, to review the evidence on the perception that the United States is losing its edge in S&T and on the potential implications for national security.2 The literature research
1 We use the terms science and technology (S&T) and science and engineering (S&E) mostly interchangeably. When referring to science prowess indicators, one commonly refers to sci-ence and technology indicators, but when referring to people or the workforce, it is common to refer to scientists and engineers (rather than scientists and technologists).2 Throughout this report, we refer to this meeting as the “NDRI meeting on U.S. competi-tiveness in S&T” or simply the “NDRI meeting.”
xiv U.S. Competitiveness in Science and Technology
encompasses reports published by U.S. and international S&T, eco-nomic, and governmental organizations as well as academic research publications, newspaper articles, opinion pieces, Congressional testi-mony, and Web logs. NDRI meeting participants included analysts, policymakers, military officers, professors, and business leaders. In addition to the literature review and expert input, this report draws on various data analyses, e.g., of time-series data on R&D investment and other S&T indicators, and of Current Population Survey (CPS) and Census data on salaries, size, composition, and education of the S&E workforce, data that distinguishes between U.S.- and foreign-born scientists and engineers.
Questions We Consider
We have sought to address the following research questions:
1. What are the implications of the globalization of S&T and the rise of other nations for U.S. performance in S&T?
1.1. What facts suggest that other nations or regions are develop-ing significant strength in S&T while the United States is fall-ing behind? Is R&D rapidly increasing in major nations or regions other than the United States? Is S&T employment growing more rapidly in other nations or regions? Are other nations or regions educating their populations in S&T more rapidly than the United States? Is innovation and scientific discovery increasingly taking place elsewhere? Are other nations or regions becoming more capable of acquiring and implementing new technology and information?
1.2. Will the globalization of S&T and the rise of other nations make it more difficult for the United States to be successful in S&T? Are American S&T jobs likely to go overseas? Does the changing nature of innovation pose a threat to Ameri-ca’s strong performance in S&T?
Summary xv
2. What evidence suggests that the United States has been underinvesting in S&T?
2.1. Is the United States investing enough in R&D to return to, or sustain, its leadership position in S&T? Are total R&D expen-ditures growing more slowly than in the past? Are R&D expenditures on basic research—both federally and privately funded—in decline? Has federally funded research in gen-eral decreased? Has funding for academic research slowed? Has federal funding for research in the physical sciences, mathematics, and engineering declined?
2.2. Will the U.S. K–12 education system be able to generate the talent in science and math to meet the future demands of the global marketplace? How does U.S. spending on education compare with other nations? How are K–12 students per-forming in science and math—both by national standards and relative to other nations? What is the past, present and future education attainment of the U.S. population?
2.3. Can America continue to meet the demand for well-trained, well-prepared S&E workers? Have S&E careers become increasingly unattractive to U.S. citizens? Is there a shortage of qualified scientists and engineers? Is the United States becoming increasingly reliant on foreign S&E professionals? Are foreign scientists and engineers working in the United States increasingly returning home? Do foreign profession-als working in the United States appear to be as productive as native S&E professionals? Do foreign professionals work-ing in the United States reduce wages for S&E jobs?
Findings
We find that the United States continues to lead the world in science and technology. The United States grew faster in many measures of S&T capability than did Japan and Europe, and developing nations such as China, India, and South Korea showed rapid growth in S&T output measures, but they are starting from a small base. These devel-

xvi U.S. Competitiveness in Science and Technology
oping nations do not yet account for a large share of world innovation and scientific output, which continues to be dominated by the United States, Europe, and Japan.
The United States accounts for 40 percent of total world R&D spending and 38 percent of patented new technology inventions by the industrialized nations of the Organisation for Economic Co-operation and Development (OECD), employs 37 percent (1.3 million) of OECD researchers (FTE), produces 35 percent, 49 percent, and 63 percent, respectively, of total world publications, citations, and highly cited publications, employs 70 percent of the world’s Nobel Prize win-ners and 66 percent of its most-cited individuals, and is the home to 75 percent of both the world’s top 20 and top 40 universities and 58 percent of the top 100.
A comparison of S&T indicators for the United States with those of other nations/regions reveals the following:
Other nations/regions are not significantly outpacing the United States in R&D expenditures. China and South Korea, which are showing rapid growth in R&D expenditures, are starting from a small base, and the EU-15 and Japan are growing slower than the United States. Other nations/regions are not outpacing the United States in S&T employment, as growth in researchers in the EU-15 was compa-rable to, and that of Japan considerably lower than, that of the United States. China, however, added about the same number of researchers as the United States did and overtook Japan during the period 1995 to 2002. Other nations/regions are rapidly educating their populations in S&T, with the EU-15 and China graduating more scientists and engineers than the United States. China, India, and South Korea are starting to account for a sig-nificant portion of the world’s S&T inputs and activities (R&D funding in dollars at purchasing power parity, research jobs, S&T education, etc.) and are showing rapid growth in outputs and out-comes, yet they account for a very small share of patents, S&T publications, and citations.

Summary xvii
One sign of U.S. slippage is a 3-percentage-point loss in world share in publications, citations, and top 1 percent highly cited publications between 1993–1997 and 1997–2001. On measures such as additions to the S&T workforce and pat-ented innovations, U.S. growth in S&T was on par with, or above, world average trends. By comparison, Japan grew more slowly in additions to the S&T workforce, and both the EU-15 and Japan had slower growth in patented innovations.
High growth in R&D expenditures, patents, and S&E employ-ment, combined with continuing low unemployment of S&E workers, suggest that U.S. S&E has remained vibrant. These signs do not sup-port the notion that jobs are being lost at substantial rates as a result of the outsourcing and offshoring of S&T. U.S. gains in S&T occur against a backdrop in which R&D expenditures, S&E employment, and patents are also increasing in the EU-15, Japan, China, Korea, and many other nations/regions. Studies of the offshoring of high-skill work suggest that it does not result in job losses in the originating country, as it is increasingly driven by the need to access scarce talent, but rather that the overall number of jobs is increasing.
A future in which a significant share of new technologies is invented elsewhere will benefit the United States as long as it maintains the capability to acquire and implement technologies invented abroad. Technology is an essential factor of productivity, and the use of new technology (whether it was invented in the United States or elsewhere) can result in greater efficiency, economic growth, and higher living standards. The impact of globalization on U.S. innovative activity is less clear. On the one hand, significant innovation and R&D elsewhere may increase foreign and domestic demand for U.S. research and inno-vation if the United States keeps its comparative advantage in R&D. On the other hand, the rise of populous, low-income countries may threaten this comparative advantage in R&D in certain areas if such countries develop the capacity and institutions necessary to apply new technologies and have a well-educated, low-wage S&T labor force.
Looking only at federal expenditures on R&D a few years ago might have left the impression that the United States was underinvest-
xviii U.S. Competitiveness in Science and Technology
ing in R&D at the end of the Cold War: Total federal R&D spending grew at 2.5 percent per year from 1994 to 2004, much lower than its long-term average of 3.5 percent per year from 1953 to 2004 (in real terms, i.e., after correction for inflation). Yet federal R&D accounted for only $86 billion of $288 billion total U.S. R&D expenditures in 2004. Industrial R&D expenditures, the largest source of R&D, grew rapidly, at an average rate of 5.4 percent and 5.3 percent per year for the periods 1953–2004 and 1994–2004, respectively, and accounted for most of the growth in total R&D (4.7 percent and 4.4 percent for the periods 1953–2004 and 1994–2004, respectively). As a result, growth in total R&D was on par with the world’s average growth: Measured in dollars at purchasing power parity (PPP), U.S. R&D expenditures grew at an average rate of 5.8 percent per annum from 1993 to 2003, close to the world’s average of 6.3 percent. Further, total basic research showed the greatest rate of increase, at an average of 6.2 percent and 5.1 percent per year (4.7 percent and 4.4 percent for total R&D) for the periods 1953–2004 and 1994–2004, respectively. Also, federally funded basic research grew by 3.4 percent per year over the period 1970–2003 and 4.7 percent per year over the period 1993–2003. As industrial and federal R&D grew, universities and colleges managed to increase their R&D by an average of 6.6 percent and 5.1 percent per year for 1953–2004 and 1994–2004, respectively. This is reassuring, given the importance of basic and academic research to innovation.
However, most of the increase in federally funded basic research was in the life sciences, whereas basic research funding for the physi-cal sciences was essentially flat. The allocation of federal R&D dollars presumably was based on an assessment that the potential payoffs were far higher in the life sciences than in the physical sciences, just as physi-cal sciences had received the major portion of federal R&D funds in the decade after Sputnik. Still, taken as a whole, total basic research and federally funded basic research have increased rapidly in real terms (constant dollars) on average, by between 3 percent and 6 percent per year for the last three decades.
U.S. expenditures per student on elementary and secondary edu-cation are comparable with those of other industrialized nations and commensurate with the high U.S. per capita gross domestic product

Summary xix
(GDP). In postsecondary education, the United States spends signifi-cantly more per student than other industrialized nations (nearly twice the OECD industrialized nations’ average). U.S. students performed relatively well in reading literacy, i.e., their scores were similar to those of other OECD industrialized nations. U.S. students compare relatively well in mathematics and science at the lower grades, but older stu-dents demonstrate lower achievement than most of their peers in other industrialized nations. Various high-level groups have pointed to the low student achievement of older students in mathematics and science as a matter of concern. In addition, recent research has emphasized the importance of early childhood education as a crucial foundation for cognitive, social, and emotional development, and there is reason to consider increasing public and private investments in children.
The education attainment of the U.S. population has continued to increase. The percentage of the U.S. population (ages 25–64) that has attained at least upper secondary education, 88 percent, compares favorably with an average of 67 percent for the OECD industrialized nations. Trends in the United States and abroad suggest that global competition for college-educated workers will intensify in the future, as a result of forecasted changes in demographics. Past research shows that between 1980 and 2000 the United States added 20 million work-ers with college degrees to the labor force, which more than doubled the college-educated workforce, but between 2000 and 2020 only 8 million additions to this workforce are anticipated, as baby boomers are beginning to retire and fewer prime-age workers will join the labor force. The United States is not the only region with an aging popula-tion, however, and Europe, Japan, and China appear to be worse off in this respect.
Scientists and engineers are paid substantially more (about a 25 percent wage premium) and have the same unemployment as the non-S&E workforce for similar levels of education. Judging by recent versus past wage and unemployment trends, there is no evidence of a current shortage of S&E workers. At any given time, a firm or set of firms within an industry may be unable to fill their S&E job openings, but that is true for non-S&E positions as well. More broadly, despite the higher wages available in S&E jobs, the number of U.S.-born graduates

xx U.S. Competitiveness in Science and Technology
in S&E has grown slowly. Much of the growth in S&E employment has come from foreign-born S&E workers who have studied in the United States or who migrated to the United States after completing graduate studies in their home country. The share of non-U.S. citizens in the sci-ence and engineering workforce increased from 6 percent in 1994 to 12 percent in 2006.3 But alternative pathways, such as an increasing share of S&E graduates entering S&E jobs, the return of individuals holding S&E degrees who had earlier left for non-S&E jobs, and individuals without S&E degrees entering S&E jobs, may have also contributed.
Given the current choice of many U.S.-born students to not study S&T, some observers are skeptical that scholarships and improved ele-mentary and secondary science teaching will do much to expand the number of students studying S&T. The reasoning is that students will ultimately not enter (and stay) in S&E jobs unless their pay and intan-gible rewards are increased relative to non-S&E jobs.
With rapid growth in R&D worldwide and aging populations, increased global competition for skilled S&E workers may result in slower growth of the workforce, more firms unable to fill their S&E job openings, and higher wages for S&E workers (i.e., increased cost of conducting R&D). While not apparent in the data yet, such potential trends are worth monitoring.
The United States has benefited from the inflow of foreign S&E students. Foreigners have helped to enable the fast growth in S&E employment (about 4.2 percent per year since 1980) in the face of rela-tively slow growth in S&E degree production (about 1.5 percent per year). This also suggests that foreigners have helped to hold down S&E wage increases, thereby reducing the cost of U.S. research. Further, because many foreign students come to the United States with a sec-ondary education or a college education, the United States has not had to bear the cost of that education. Technological and scientific innova-tion is the engine of U.S. economic growth, and human talent is the main input that generates this growth. Immigration of highly skilled scientists and engineers allows the United States to draw the best and
3 In contrast, the share of non-U.S. citizens in the non-S&E workforce remained constant at 5 percent for similar levels of education (bachelor’s degree and higher).
Summary xxi
brightest from a global rather than domestic pool of talent. Finally, wage data suggest that the quality of the foreign S&E workforce is as good as that of U.S. citizens, in that comparable workers are paid the same.
However, the diminishing share of degrees awarded to U.S. citi-zens, particularly for the higher degrees such as doctorate and master’s, suggests that S&E careers are becoming less attractive to U.S. citizens or, alternatively, that U.S. citizens encounter more competition (from foreigners) in applying for a limited number of desirable spots at S&E colleges and universities. The case for increasing the number of U.S.-born S&E graduates rests on whether the increased employment of foreign-born S&E workers makes the U.S. economy and its national security vulnerable to foreign competitors and adversaries. Wage data, for example, do not show a premium for U.S.-born graduates, i.e., there appears to be no market preference for native versus foreign-born sci-entists and engineers. National security–related jobs requiring U.S.-born S&E workers are apparently a small portion of the market (Butz et al., 2004). Further, while some immigrants eventually return home, many remain in the United States indefinitely. While anecdotal evi-dence may suggest that foreign scientists and engineers are increas-ingly returning home, various studies indicate that the numbers are still small and that the United States remains a net recipient of highly skilled foreign talent. Today, about 70 percent of foreign recipients of U.S. doctorate degrees in S&E stay in the United States for at least two years, up from 50 percent in the 1990s. Research has further shown that long-term (ten-year) stay rates do not differ much from short-term stay rates, suggesting that about 70 percent of recent PhD graduates in S&E may stay in the U.S. indefinitely. Nevertheless, it is worth watch-ing trends in the number of foreign S&E workers returning home. The recent reduction of the annual cap on H1-B visas for skilled labor could reduce stay rates and skilled immigrant worker inflows. In addition, given that stay rates are currently higher for developing than for devel-oped nations, significant economic development of China and India, whose nationals contribute significantly to the U.S. S&E workforce, could offer increasingly attractive opportunities “back home,” which may increase return migration and reduce stay rates.
xxii U.S. Competitiveness in Science and Technology
Wage and unemployment trends do not show the traditional signs of a shortage of scientists and engineers. Unemployment has not been decreasing but has been steadily low, as is typical in professional occupations. Also, wages have not been increasingly rapidly relative to trend. Nevertheless, low unemployment, the relatively steady wage growth in S&E, and claims of shortages can plausibly be reconciled by off shoring and outsourcing. If firms cannot fill their S&E positions in the United States, they may decide to offshore or outsource R&D to take advantage of foreign S&E labor pools. In addition, firms may prefer to set up foreign production and research activities as part of a strategy of gaining entry to foreign markets. Moving operations to for-eign countries and drawing on their S&E workers may be less costly and strategically more advantageous than bidding up S&E wages in the United States in an effort to hire S&E workers. Thus, offshoring and outsourcing are options that can slow wage increases and remove shortages. That is, shortages in the United States have not materialized, or have been mitigated, by these means. Under this explanation, it also follows that reducing the inflow of foreign high-skilled S&E workers (e.g., by reducing the H1-B visa cap) will likely increase offshoring and outsourcing. It may not even induce sufficient numbers of U.S. citizens to join the S&E workforce, as wage growth will still be slowed by the decision to offshore or outsource the work. Increasing the inflow of for-eign high skill S&E workers may, in contrast, increase investment and employment at home as well as provide local spillover benefits.
Given the benefits associated with the foreign S&E workforce, the United States would likely be worse off if foreign access to U.S. gradu-ate education and S&E jobs were limited. Presumably, to establish the opposite, i.e., that the United States is negatively affected overall by its growing reliance on foreign-born S&E graduates, a case would have to be made along any of the following lines (and perhaps others): that the expansion of foreign-born scientists and engineers in the U.S. work-force has led to faster and more widespread transmission of U.S. tech-nological discoveries to foreign countries, who are now capitalizing on them by developing new or cheaper products to the detriment of U.S. firms; that sensitive technology and know-how are flowing to poten-tial adversaries, who will use it against the United States; or that by
Summary xxiii
holding down wage growth in S&E, the expansion of the foreign-born S&E workforce has reduced the supply of new U.S.-born S&E work-ers, some of whom would have entered hard-to-fill national security positions. Possibilities such as these may warrant further study.
In this report, we have focused primarily on U.S. competitiveness in S&T, without considering the implications for national security. Past research indicates that globalization of S&T complicates national security: The United States is less capable of denying other nations access to advanced technology to maintain a wide military capability gap between itself and potential adversaries. Technological capability is more widely diffused to potential competitors and may provide adver-saries with capability to pursue nontraditional strategies and tactics on the battlefield or through insurgency and terrorism. Nevertheless, past research concludes that attempts to regulate or limit the diffusion of some (but not all) sensitive defense technology might have harmful long-term consequences and might not even be beneficial in the short term.
In short, our assessment of the measures we have examined indi-cates that the U.S. S&T enterprise is performing well. We find that the United States leads the world in S&T and has kept pace or grown faster than the rest of the world in many measures of S&T. Although devel-oping nations such as China, India, and South Korea showed rapid growth in S&T, these nations still account for a small share of world innovation and scientific output. Furthermore, we find that the con-sequences of the globalization of S&T and the rise of S&T capability in other nations are more likely to be economically beneficial to the United States than harmful. We also find that the United States has continued to invest in its S&T infrastructure and that the S&E work-force has managed to keep up with the demand for highly skilled S&E workers through immigration. However, there are potential weaknesses in the persistent underperformance of older K–12 students in math and science, in the limited attractiveness of S&E careers to U.S. students, and in the heavy focus of federal research funding on the life sciences, and we do not yet fully understand the consequences of an increasing reliance on foreign-born workers in S&E.

xxiv U.S. Competitiveness in Science and Technology
While the United States is still performing at or near the top in many measures of S&T leadership, this leadership must not be taken for granted. Institutions and incentives to foster the creation of new S&T discoveries, the education and training of new generations of S&T workers, the nurturing of academic and industrial research cen-ters of excellence, the protection of intellectual property, and, at the same time, the production and dissemination of basic scientific dis-coveries have all contributed to the unparalleled S&T leadership of the United States. Such institutions need to be sustained and, as needed, adapted to the global economy. We make the following recommenda-tions for policy and decisionmakers to consider:
Establish a permanent commitment to a funded, chartered entity responsible for periodically monitoring, critically reviewing, and analyzing U.S. S&T performance and the condition of the S&E workforce.
Fundamental steps toward ensuring that the United States continues to benefit from its strength in S&T are to sustain U.S. leadership in basic and applied research and to keep salaries and job conditions competitive so that the United States remains an attractive place for the world’s scientists and engineers to live and work. Regular monitoring and analysis of S&T performance and the condition of the S&E workforce will provide timely, relevant, objective information to policymakers to aid them in addressing adverse trends and improving U.S. S&T.
The National Science Foundation (NSF) already collects and monitors relevant information, the Office of Science and Tech-nology Policy (OSTP) advises the President and others within the Executive Office of the President on the effects of science and technology on domestic and international affairs, and numerous organizations have established committees of experts and stake-holders that provide their assessment of particular issues relating to U.S. S&T. Yet critical review and assessment of information on S&T performance and the condition of the S&E workforce has proved difficult. For example, shortages of S&E workers have been predicted, but the predictions have proved inaccurate.

Summary xxv
The plethora of advice, the sometimes fragmented nature of the advice (that is addressing one particular issue rather than S&T as a whole), and the closeness of some organizations to stakeholders or the executive office points to the need for a coherent, centrally coordinated, objective and independent research agenda with a long-term view on S&T and the S&E workforce.
The entity to carry out the agenda could be, for example, a nonpartisan commission appointed every four years by the President, an interagency commission, or a nonfederal, nonprofit foundation. The commitment to convene such an entity should be permanent because U.S. leadership in science and technology and the strength of the U.S. science and engineering workforce are enduring concerns. The entity should be funded so that it can commission and fund studies relevant to whatever issues are cur-rent. Such studies, conducted by experts in academia and research organizations, should be published and also would serve as input into a final, published report on U.S. S&T performance and the condition of the S&E workforce. Finally, the entity should be chartered not only as a matter of defining its purpose, objective, and scope but also to enable it to operate independently and pro-duce objective, rigorous, nonpartisan analyses. Research topics that could be covered are the demand and supply of S&E work-ers, education, quality of education, training, employment, career progression, wages, in-migration, out-migration, offshoring, out-sourcing, and the condition, performance, and economic impact of the S&T enterprise, e.g., in terms of patents, publications, cita-tions, and innovative products and services. Facilitate the temporary and indefinite stay of foreigners who graduated in S&E from U.S. universities, for example, by offer-ing them one-year automated visa extensions to seek work in the United States after completion of their study. Research on stay rates of foreign recipients of U.S. doctorate degrees suggests that conditions (employment and immigration) at the time of com-pleting the doctorate degree are crucial in determining the likeli-hood of a long stay.

xxvi U.S. Competitiveness in Science and Technology
Facilitate the immigration of highly skilled labor, in particu-lar in S&E, to ensure that the benefits of expanded innovation, including spillovers, accrue to the United States and to ensure that the United States remains competitive in research and inno-vation. Immigration allows the United States to draw from the best and brightest of a global rather than national talent pool, likely reduces the offshoring of R&D (being driven by the need both for cost reductions and to access highly skilled talent), and keeps the cost of research down. While immigration may reduce the attractiveness of S&E careers to U.S. citizens, at the same time, the total number of highly skilled individuals (foreigners plus U.S. citizens) has likely increased through immigration, and human talent is the main input that generates growth in today’s knowledge driven economy.Increase capacity to learn from science centers in Europe, Japan, China, India, and other countries to benefit from scientific and technological advances made elsewhere. The United States could do this by promoting joint ventures, encouraging collaborative research with researchers in other countries, supporting U.S. researchers and students to participate in foreign R&D centers (e.g., through fellowships, positions in foreign laboratories of multinationals, graduate studies abroad, sabbaticals, postdoctoral positions, etc.), and establishing informal networks with S&E workers who studied in the United States. Foreign-born S&E workers may also help in establishing links to foreign centers of R&D excellence. Continue to improve K–12 education in general and S&T educ-tion in particular, as human capital is a main driver of economic growth and well-being. In this regard, recent research on early childhood development emphasizes the importance of certain investments during early childhood as a foundation for invest-ments during later childhood. This new research on childhood development offers a novel viewpoint that substantially alters and enlarges the usual perspective regarding “interventions” to develop science and math skills and understanding in children and teens. It raises the possibility of placing more emphasis on early child-

Summary xxvii
hood development as a means to improve education attainment in general and more specifically in S&T. This possibility may deserve rigorous investigation through pilot programs or through the analysis of data from naturally occurring treatments.
In this research, we have encountered additional areas for which substantial knowledge appears to be lacking and that may benefit from further research. We recommend that consideration be given to research on the following:
factors affecting the recruiting and retention of foreign S&E talent (i.e., a study on the decision of foreign students to do graduate and undergraduate work in the United States and to seek work in the United States after graduation, and on the decision of foreign S&E employees or recent graduates to seek work in the United States and to stay in the United States)the idea that U.S. leadership in S&E resides in a relatively small number of highly talented individuals (i.e., studying the nature of this leadership, the ability of the United States to continue to attract these individuals, and the consequences of not being able to do so)whether and how increased employment of foreign-born S&E workers makes the United States vulnerable even as such workers add to the strength of the U.S. economy.


xxix
Acknowledgments
We are pleased to acknowledge the insights and support provided by David S. C. Chu, Under Secretary of Defense for Personnel and Readiness. We are grateful to Jeanne Fites, Deputy Under Secretary of Defense (Program Integration; Personnel and Readiness), for her guid-ance on planning the NDRI meeting on U.S. competitiveness in S&T and communicating the findings. We thank Sloan Fader of RAND for his assistance in organizing the meeting and preparing this doc-ument, and we appreciate the excellent research assistance provided by Lindsay Daugherty and Meg Blume-Kohout. We are also pleased to thank Heather Krull and Qui-fei Ma for assistance in conducting the data analysis of wage and employment trends. We are indebted to Susan Bohandy, who offered valuable advice on the structure and writ-ing of this report and who drafted the chapter introductions. Finally, we thank Richard Silberglitt and Samuel Kortum for their careful, thoughtful reviews of this report.


xxxi
Abbreviations and Glossary
AAAS American Academy for the Advancement of ScienceCAGR compounded annual growth rate
CAGR is calculated by taking the nth root of the total per-centage growth rate, where n is the number of years in the period being considered. CAGR describes the rate at which the quantity of interest grew as though it had grown at a steady rate.
CMMP condensed-matter and materials physicsCPS Current Population SurveyDoD U.S. Department of DefenseDoE U.S. Department of EnergyDSB Defense Science Board ED U.S. Department of EducationERC European Research CouncilEU European Union EU-15 European Union 15
The EU-15 consists of Austria, Belgium, Denmark, Finland, France, Germany, Greece, Ireland, Italy, Lux-embourg, The Netherlands, Portugal, Spain, Sweden, and the United Kingdom.
FTE full-time equivalentGDP gross domestic product

xxxii U.S. Competitiveness in Science and Technology
GED General Educational DevelopmentGERD gross domestic expenditure on research and
developmentGWP gross world productNAE National Academy of EngineeringNAS National Academy of Sciences NASA National Aeronautics and Space AdministrationNCES National Center for Education StatisticsNDRI RAND National Defense Research InstituteNIH National Institutes of HealthNSF National Science FoundationOECD Organization for Economic Co-operation and
DevelopmentPIRLS Progress in International Reading Literacy StudyPISA Program for International Student AssessmentPPP purchasing power parity
A purchasing power parity exchange rate equalizes the purchasing power of different currencies in their home countries for a given basket of goods. These special exchange rates are often used to compare the standards of living of two or more countries. The adjustments are meant to give a better picture than comparing GDPs using market exchange rates.
R&D research and development S&E science and engineering S&T science and technology STEM science, technology, engineering, and mathematicsTIMSS Trends in International Mathematics and Science StudyUSDA U.S. Department of Agriculture
1
CHAPTER ONE
Introduction
On October 20, 2005, House Science Committee Chairman Sherwood Boehlert took to the podium before his committee colleagues and made a dramatic pronouncement: “Complacency will kill us. If the United States rests on its withering laurels in this competitive world, we will witness the slow erosion of our pre-eminence, our security, and our standard of living. It’s a sobering message” (Boehlert, 2005). Boehlert was opening a hearing of the House Science Committee, titled “Sci-ence, Technology, and Global Economic Competitiveness.” He drew his grim warning from a report by the National Academy of Sciences (NAS) being unveiled that day titled Rising Above the Gathering Storm: Energizing and Employing America for a Brighter Future (NAS, 2006). This document came to be the most well known of a wave of reports that had preceded—and which followed—it, all cautioning that the United States is at grave risk of being unable to compete in the 21st-century global marketplace because of its steadily declining leadership in science and technology (S&T).
Addressing their opening letter “To Leaders Who Care About America’s Future,” the authors of a 2005 Business Roundtable docu-ment warn:
Today . . . [o]ne of the pillars of American economic prosperity—our scientific and technological superiority—is beginning to atrophy even as other nations are developing their own human capital.
2 U.S. Competitiveness in Science and Technology
If we wait for a dramatic event—a 21st-century version of Sputnik—it will be too late. There may be no attack, no moment of epiphany, no catastrophe that will suddenly demonstrate the threat. Rather, there will be a slow withering, a gradual decline, a widening gap between a complacent America and countries with the drive, commitment and vision to take our place.” (Business Roundtable, 2005)
Other reports bear such disquieting titles as Tough Choices or Tough Times (The New Commission on the Skills of the American Workforce, 2007), The Looming Workforce Crisis (National Association of Manufacturers, 2005), The Knowledge Economy: Is the United States Losing Its Competitive Edge? (Task Force on the Future of American Innovation, 2005), and Offshore Outsourcing and America’s Competi-tive Edge: Losing Out in the High Technology R&D and Services Sector (Office of Senator Joseph I. Liebermann, 2004). Coming from mul-tiple corners—the private sector, academia, government, and policy think tanks—they provide an abundance of data all pointing to the same conclusion: The effects of globalization,1 combined with an ero-sion of the nation’s domestic S&T enterprise, may spell serious trouble for the United States.
On the heels of the 2006 National Academies of Sciences report, the press took up this message in similarly gripping terms. “The wolves have not encircled us yet,” wrote a Denver Post journalist in his article, “Signs America’s Scientific Edge Is Slipping,” “But there’s no deny-ing the sounds of scratching at the door” (Farrel, 2006). An op-ed columnist in the Seattle Times spoke of the urgent need to “[s]teer the Titanic of American competitiveness out of danger” (Peters 2006), while a U.S. News & World Report reporter declared, “The next time there’s a moon shot, don’t expect the United States to take the prize. . . . [B]usiness leaders, top academics, and other experts . . . increasingly see America as a nation that has pulled into the slow lane, while upstarts
1 Throughout this report, we use the term globalization mostly in its economic context of the lowering of international trade barriers, increased international investment, decreased transactions and communications costs as a result of information technology, decreased shipping cost, and the increasingly rapid diffusion of technology.

Introduction 3
in a hurry outhustle Americans in the race for technological, industrial, and entrepreneurial supremacy” (Newman, 2006). Journalists referred to the 2006 NAS and other reports as they spread the alarm to the public at large that, without immediate and decisive action, globaliza-tion, foreign competition, and declining U.S. S&T capabilities could mean “gloom and doom” (Broache, 2006) for “American economic prosperity, and indeed the whole U.S. power base.”
With the heightened media attention—and its influence on pop-ular opinion—this issue leapt to the top of the agenda of many poli-cymakers. Boehlert’s committee hearing was just one event in a flurry of activity in Washington that began in late 2005. “Innovation and global competition have become veritable buzzwords in the political sphere in recent months, with both Democrats and Republicans in Congress unveiling proposals geared toward bolstering the nation’s stance,” observed a writer for CNet News in March 2006 (Broache, 2006). Policy initiatives related to the issue continue to be introduced to this day.
The Basis for Perceptions of America’s Diminishing Edge in S&T
Policy proposals by and large responded directly to the recommenda-tions made in the reports being released. To support their warning, the reports espouse either one or both of two central claims.
First is that the effects of globalization—including the growing strength of other nations in S&T—will make it much more difficult in the future for the United States to maintain a leadership position in S&T. Advocates of this viewpoint cite the quickly rising S&T capacity of rival powers, the heightened competition presented by white-collar workers in S&T in lower-wage countries, the ability for new technolo-gies and information to be rapidly transmitted around the globe, and changes in the nature of innovation, which is increasingly driven by private investment and international clusters of emerging tech firms, capital markets, and research universities (e.g., Segal, 2004), rather than by large corporate laboratories—such as Bell, GE, and IBM—

4 U.S. Competitiveness in Science and Technology
located in the United States and by U.S. scientists supported by U.S. government funds.
Second, it is argued that the domestic building blocks of S&T leadership are eroding. For a nation to be a strong performer in S&T, certain elements must be in place:
Infrastructure: This includes physical infrastructure—such as laboratories, equipment, and user facilities such as national and industrial laboratories—as well as substantial investment in research and development (R&D) and laws, policies, and regu-lations to support that investment (e.g., tax policies, intellectual property rights, efficient labor markets, etc.). Today, those laws would include favorable immigration policies for foreign S&T talent.Education: The education system should be able to provide high-quality instruction in the sciences, engineering, and mathemat-ics. This includes both K–12 and higher education. Also, stu-dents should have the counseling, support, and financial aid to help them make well-informed decisions and to finance their education. Workforce: S&T capability depends on having a well-trained, well-prepared, and sizeable S&T workforce, and this depends in part on the challenges, incentives, and rewards, both monetary and nonmonetary, found in S&T careers.
Advocates contend that the United States has for decades invested too little in sustaining its S&T leadership, and that is particularly so given the increased pressures on the United States resulting from globalization.
What If the United States Loses Its Edge in S&T?
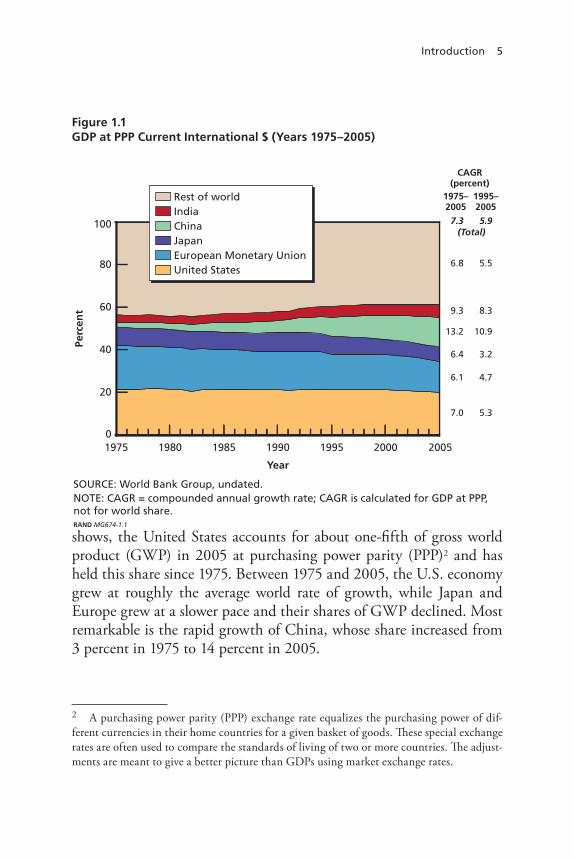
The U.S. economy is the world’s largest, with a gross domestic product (GDP) of more than $13 trillion in 2006, and much of the size of the U.S. economy is attributed to technological progress. As Figure 1.1
Introduction 5
shows, the United States accounts for about one-fifth of gross world product (GWP) in 2005 at purchasing power parity (PPP)2 and has held this share since 1975. Between 1975 and 2005, the U.S. economy grew at roughly the average world rate of growth, while Japan and Europe grew at a slower pace and their shares of GWP declined. Most remarkable is the rapid growth of China, whose share increased from 3 percent in 1975 to 14 percent in 2005.
2 A purchasing power parity (PPP) exchange rate equalizes the purchasing power of dif-ferent currencies in their home countries for a given basket of goods. These special exchange rates are often used to compare the standards of living of two or more countries. The adjust-ments are meant to give a better picture than GDPs using market exchange rates.
Figure 1.1GDP at PPP Current International $ (Years 1975–2005)
Perc
ent
SOURCE: World Bank Group, undated.NOTE: CAGR = compounded annual growth rate; CAGR is calculated for GDP at PPP,not for world share.RAND MG674-1.1
80
60
40
20
100
0
CAGR(percent)
1975–2005
1995–2005
(Total)
200019951990198519801975 2005
Year
7.3 5.9
6.1 4.7
7.0 5.3
13.2 10.9
6.4 3.2
9.3 8.3
6.8 5.5
Rest of worldIndiaChinaJapanEuropean Monetary UnionUnited States

6 U.S. Competitiveness in Science and Technology
Labor, capital, and natural resources alone are not sufficient to explain the U.S. share of world product. The United States has only 5 percent of the world’s population and a small share of the world’s arable land and oil (see, e.g., Eaton and Kortum, 2007).
In traditional views on the nature of economic strength, a nation’s labor supply, capital, and natural resources drive its wealth. Econo-mists of the 1930s and 1940s explained long-term economic growth as a combined function of investments in capital and natural increases in the labor supply resulting from population growth (e.g., Domar, 1946). Although population growth and increases in savings are associ-ated with increased output (e.g., Kendrick, 1956), these models could not explain a large part of the observed variation in nations’ economic productivity.
In 1956, Robert Solow introduced a Nobel Prize–winning eco-nomic model that attributed growth in production over time not just to increases in capital and labor, but also to technological change. Indeed, Solow reasoned that technological progress could account for the large residual of economic growth not attributable to increases in capital and labor. He estimated that technological progress accounted for 80 percent of the growth in output per worker in the United States since the turn of the 20th century (Solow, 1956, 1957). While subsequent estimates of the role of technological change have been lower, Solow’s insight into the importance of technological progress endures. Analysts and policymakers now realize that human capital and knowledge/technology3 are a substantial source of national wealth (e.g., Warsh, 2006, 2007; Eaton and Kortum, 2007).
Solow’s model assumed that technological change occurred at a given rate determined by outside factors (Solow, 1957). Eaton and Kortum (2007) suggest that until the industrial revolution, economic progress seems to have taken this form, where economies grew simply through the serendipitous arrival of ideas. But with the industrial revo-lution came active and systematic efforts to discover and apply new
3 Knowledge consists of facts and theories, while technology refers to the equipment, tech-niques, and expertise that can be applied to produce a good or service (including new knowl-edge and technology).

Introduction 7
technologies. Innovation today results from substantial R&D invest-ments by firms. Romer (1990) introduced a model in which the pace of technological discovery is driven by economic agents in response to market incentives, and his model implicitly places importance on the institutional infrastructure—laws, policies, and regulations—that sup-port research and innovation.
Thus, capability to innovate and adopt new technologies, includ-ing those invented elsewhere, is crucial to the employment, sales, and profitability of U.S. firms and hence to the U.S. economy and standard of living. Science and technology have historically contributed signifi-cantly not only to economic growth but also to well-being (improved public health, longer life expectancy, better diagnoses and treatments of many illnesses, etc.), standard of living (refrigerators, cars, iPods, etc.), and national security (atomic bomb, radar, sonar, etc.). The strength of the U.S. economy and military provide it with the foundation for its global leadership. If claims of diminishing U.S. leadership in S&T are true and its future ability to compete globally is in question, the prog-nosis is indeed serious. S&T is directly linked not only to America’s economic strength but also to its global strategic leadership.
The Perception of an S&T Threat Started a Groundswell of Policy Action
Many policymakers accepted the contention that America’s S&T enter-prise was in jeopardy—and the belief that the impact on the nation’s future would be dire—and responded by proposing legislation that would take many of the actions called for in the reports. November and December of 2005 were busy months for S&T policy on Capitol Hill. In those two months alone, at least four major initiatives were unveiled, with titles reflecting the prevailing sentiment in Washington:
Innovation Agenda: A Commitment to Competitiveness to Keep America #1 (November 2005): An initiative from House Demo-crats that called for, among other things, the addition of 100,000 new scientists, mathematicians, and engineers to America’s work-
8 U.S. Competitiveness in Science and Technology
force in the next four years (Office of Speaker Nancy Pelosi, 2005)10,000 Teachers, 10 Million Minds Science and Math Scholarship Act (introduced December 2005): House legislation that would implement most of the 2006 National Academies of Sciences report’s recommendations for K–12 science education (109th Congress, H.R. 4434, 2005).National Innovation Act (introduced December 2005): A biparti-san Senate bill that would establish the “Innovation Acceleration Grants Program” to promote high-risk scientific research. It also called for funding for the National Science Foundation (NSF) to nearly double by 2011 (109th Congress, S. 2109, 2005). Sowing the Seeds through Science and Engineering Research Act (introduced December 2005): House legislation that would for-tify long-term basic research in line with the 2006 NAS report (109th Congress, H.R. 4596, 2005).
The executive branch also responded. President Bush’s State of the Union message in January 2006 announced the creation of the American Competitiveness Initiative. Its policies are aimed at enabling the United States “to build on [its] successes and remain a leader in sci-ence and technology” so as to “improve the quality of life and standard of living for generations to come” (Domestic Policy Council, 2006, introductory letter from President Bush). These policies echoed the rec-ommendations of the 2006 NAS report by earmarking large federal investments to address the nation’s allegedly growing deficiencies in K–12 education, S&T workforce training, and R&D.
More legislation followed fast on the heels of the President’s speech. The Protecting America’s Competitive Edge (PACE) Act (109th Congress, S. 2197, 2006), introduced in January 2006, was a bipartisan Senate package with a first bill focused on strengthening research in energy technology, a second intended to fortify K–12 math and science education, and a third to provide tax incentives to encour-age research, development, and innovation. The Right Time to Rein-vest in America’s Competitiveness and Knowledge (Right TRACK) Act (109th Congress, S. 2357, 2006), introduced in March 2006, was
Introduction 9
Senate legislation focused on U.S. job-market and workforce issues in light of globalization. By the following year, more than two dozen bills had been brought to the floor in Congress.
A number of House and Senate hearings took place in tandem with the legislation. CEOs, researchers, and politicians gave testimony that reinforced the same view—that, as former executive Norman Augustine told one committee, “[W]ith regard to [America’s] future competitiveness . . . we appear to be on a losing path” (Augustine, 2005).4 In April 2006, as Sherwood Boehlert urged a House Appropri-ations Subcommittee to fund the American Competitiveness Initiative, his message was once again blunt: “We can pay now,” he warned, “or we will pay later” (House Science and Technology Committee, 2006).
Is the Clarion Call Warranted?5
Despite the rhetoric and the intensive action on the Hill, some voices called for restraint. The reports and testimony making a case for or arguing against an S&T crisis are part of an ongoing policy debate.
One line of counterargument is that such warnings are far from unprecedented and have never resulted in the crisis anticipated. The author of a Washington Watch article noted that “similar fears of a STEM6 workforce crisis in the 1980s were ultimately unfounded” (Andres, 2006). Neal McCluskey, a policy analyst from the Cato Insti-tute, noted that similar alarm bells were sounded decades earlier (and in his view, have had underlying political agendas):
Using the threat of international economic competition to bol-ster federal control of education is nothing new. It happened in
4 Prominent Nobel Laureates added their voices at a House Committee on Science and Technology hearing, “Views of NIST Nobel Laureates on Science Policy,” on May 24, 2006 (U.S. House of Representatives, 2006).5 The phrase “clarion call” is used in the report by the President’s Council of Advisors on Science and Technology (June 2004), and also appears in other source material on this topic. 6 STEM is an acronym for “science, technology, engineering, and mathematics.”

10 U.S. Competitiveness in Science and Technology
1983, after the federally commissioned report A Nation at Risk admonished that ‘our once unchallenged preeminence in com-merce, industry, science, and technological innovation is being overtaken by competitors throughout the world,’ as well as the early 1990s, when George Bush the elder called for national aca-demic standards and tests in order to better compete with Japan. (McCluskey, 2006)
Roger Pielke of the University of Colorado observed that such issues as poor student performance have an even longer history, with no negative outcomes. Arguments that “certain other countries produce a greater proportion of scientist and engineering students or that those students fare better on tests of achievement . . . have been made for almost 50 years,” he stated, “yet over that time frame the U.S. economy has done quite well” (Pielke, 2006).
Another opposing view suggests that fears of a looming S&T crisis may result from a misunderstanding of concepts driving the issue. The July 2006 Economist noted the “wide range of potential rem-edies” being suggested to the purported S&T problem, which include “getting more Americans to study science and engineering, bigger tax breaks for research and development, and trade protection to prevent the innovative hordes from China and India from storming America’s gates” (The Economist, 2006). The piece continues by citing a new paper by Amar Bhidé, of Columbia University’s business school, who
argues that these supposed remedies, and the worries that lie behind them, are based on a misconception of how innovation works and of how it contributes to economic growth. . . .This consists, first, of paying too much attention to the upstream development of new inventions and technologies by scientists and engineers, and too little to the downstream process of turn-ing these inventions into products that tempt people to part with their money, and, second, of the belief that national leadership in upstream activities is the same thing as leadership in generat-ing economic value from innovation. . . . Mr Bhidé argues that this downstream innovation . . . is the most valuable kind and what America is best at . . . that most of the value of innovations accrues to their users not their creators—and stays in the coun-

Introduction 11
try where the innovation is consumed. So if China and India do more invention, so much the better for American consumers. (The Economist, 2006)
In work published over a decade ago, economist Paul Krugman questions whether the notion of competition in S&T is even relevant. He argues that the idea that nations “compete” is incorrect; coun-tries are not like corporations and “are [not] to any important degree in economic competition with each other” (Krugman, 1994). Major industrial nations sell products that compete with each other, yet these nations are also each other’s main export markets and each other’s main suppliers of useful imports. More broadly, international trade is not a zero-sum game. For example, if the European economy does well, this helps the United States by providing it with larger markets and goods of superior quality at lower prices. Further, he argues that the growth rate of U.S. living standards essentially equals the growth rate of domestic productivity, not U.S. productivity relative to competitors; and enhancing domestic productivity is in the hands of Americans, not foreigners. Part of the reason for this, Krugman argues, is that the world is not as interdependent as one would think: 90 percent of the U.S. economy consists of goods and services produced for domestic use, i.e., produced by Americans, for Americans. But this is not to deny the importance of technological progress, and beneath it, science and technology, as a determinant of economic progress and improvement in the standard of living.
In general, critics agree that more careful evaluation of the data is in order before new policies are implemented:
Some beltway insiders are questioning the need for [STEM work-force] initiatives, given the difficulty in predicting future work-force demands and graduation rates. . . . [T]he current bipartisan support for new, expensive initiatives comes before contradic-tory projections about the STEM workforce have been fully rec-onciled. Why are so many business leaders and decisionmakers motivated to address a workforce innovation ‘crisis’ that might not develop? (Andres 2006)

12 U.S. Competitiveness in Science and Technology
Pielke offers an example involving Congressman Frank Wolf (Repub-lican, Virginia). In the March 2006 American Physical Society News, Wolf described how in meeting with groups that advocate for busi-ness, education, and research and development he had been “alarmed to learn that three key measuring sticks show America on a down-ward slope: patents awarded to American scientists, papers published by American scientists, and Nobel Prizes won by American scientists” (Pielke, 2006). “What do the data say?” Pielke continues, “Actually, the opposite: Patents granted: Not decreasing, but increasing. Papers published: Not decreasing, but increasing. Nobel Prizes: Not declin-ing, US dominant” (Pielke, 2006). Wolf was strongly urging a dra-matic increase in the nation’s innovation budget. “I wonder if anyone is going to let Congressman Wolf know that he is basing policy on a complete misunderstanding of the ‘problem’?” Pielke concludes.
So, who is right? Is U.S. leadership in S&T in jeopardy?
Purpose of This Report
This report offers what we hope will be a constructive addition to the policy debate around this question. We review the arguments made to support the contention of a creeping S&T crisis in the United States, contrast the arguments with relevant data, and consider them from additional angles. Specifically, we ask:
Are the claims commonly made to demonstrate a progressive loss of S&T leadership supported by evidence?If so, do these arguments give cause for a high level of alarm?
The study began when, motivated by claims that U.S. S&T capa-bility and leadership might be eroding, the Under Secretary of Defense for Personnel and Readiness asked the National Defense Research Institute (NDRI) at the RAND Corporation to convene a meeting to review the evidence and hear the views of experts. The NDRI meeting was held on November 8, 2006, in Washington, D.C.
Introduction 13
In preparation for the NDRI meeting, we began to review the lit-erature on U.S. leadership in S&T to identify the various issues and to identify experts for the NDRI meeting. Our sources included reports published by U.S. and international S&T, economic, and govern-mental organizations as well as academic research, newspaper articles, opinion pieces, Congressional testimony, and Web logs. We sought to determine the appropriate research questions for each issue and the approach we would use to address them. Certain issues required fairly straightforward collection and presentation of data, such as our com-parison of various S&T indicators with the past and internationally. Other, more complex issues required a review of academic and research publications for insight, such as the issue of whether globalization and the rise of other countries would lead to the demise of U.S. leadership in S&T. For the more complex issues, we also drew on the input of the experts who attended the November 8th NDRI meeting, which they provided through the papers they prepared7 and through presentations and panel discussions at the meeting. For some issues relating to the S&T labor force, we did not find relevant prior research but instead did our own analysis with Current Population Survey (CPS) and Census data on wages and employment of the S&E workforce.
Organization of This Report
Chapters Two and Three address the two central claims in the argu-ment that the United States is losing its edge in S&T. Chapter Two investigates the question of whether the effects of globalization—including the growing strength of other nations in S&T—will make it more difficult for the United States to be successful in S&T in the
7 These papers appear in a companion volume to this report, Perspectives on U.S. Com-petitiveness in Science and Technology (Galama and Hosek, 2007). They cover a broad range of topics, including science policy, the quantitative assessment of science and technology capability, globalization, the rise of Asia (particularly China and India), innovation, trade, technology diffusion, the increase in foreign-born PhDs working in the United States, new directions in the management and compensation of federal science and technology workers, and national security and the defense industry.

14 U.S. Competitiveness in Science and Technology
future. We present and discuss a broad set of time-series data on S&T indicators to assess whether other nations are developing significant strength in S&T while the United States is falling behind. We then draw on that discussion and economic theory to consider the potential consequences for the United States of the globalization of S&T and the rise of other nations in terms of S&T strength. Chapter Three analyzes select claims made in support of the idea that the domestic building blocks of S&T in the United States are eroding. We look at each of the building blocks—infrastructure, education and the S&E workforce—in turn, to assess whether they are weakening. In the case of research infrastructure, we focus on the issue of investment in R&D. We ana-lyze various types of U.S. R&D expenditures and contrast them with the past. In K–12 education, we focus on the performance of America’s students in science and math and relevant demographic trends. For the S&E workforce we analyze CPS and Census data on salaries, size, com-position, and education of the S&E workforce and on whether increas-ing reliance on foreigners poses a threat to U.S. S&T performance. We conclude with a discussion and recommendations in Chapter Four.

15
CHAPTER TWO
What Are the Implications of the Globalization of S&T and the Rise of Other Nations for U.S. Performance in S&T?
“There is little doubt that America’s leadership in science and technology is facing significant challenges in an increasingly global economy.”
—Ralph W. Wyndrum, Jr., President, Institute of Electrical and Electronics Engineers–USA (Wyndrum, 2006)
Those who warn that the United States faces an imminent S&T crisis point to globalization as one of two primary causes. Their concern lies in the belief that various effects of globalization are beginning to impede the ability of the United States to compete in S&T. “Today, Americans are feeling the gradual and subtle effects of globalization that challenge the economic and strategic leadership that the United States has enjoyed since World War II,” opens the National Academies of Sciences (2006) report Rising Above the Gathering Storm. Similarly, “We face complex changes in the increasingly globalized economy that put significant stress on [our innovation ecosystem]” (President’s Council of Advisors on Science and Technology, 2004) so that “the United States can no longer take its supremacy [in scientific discovery and innovation] for granted” (Task Force on the Future of American Innovation, 2005). If America’s leadership economically and strategi-cally depends on its ability to dominate in S&T, any threat to its strong S&T performance is also a threat to its leadership in those spheres.
Reports that take up the globalization theme focus on four effects of globalization that they contend will endanger America’s ability to retain its S&T leadership: the growing strength of other nations in S&T, heightened competition from high-skill workers in low-wage
16 U.S. Competitiveness in Science and Technology
countries that may lead toward offshoring of American S&T jobs, the changing nature of innovation, and the increased global diffusion of technology.
Our discussion begins with other nations’ growing capacity in S&T. We ask: What facts suggest that other nations or regions are developing considerable strength in S&T while the United States is falling behind? We then turn to the question of the potential conse-quences. If the United States is falling behind in terms of the strength of its S&T enterprise—or even if it is not—will globalization of S&T and the rise of other nations make it more difficult for the United States to be a strong performer in S&T in the decades to come?
2.1. What Facts Suggest That Other Nations or Regions Are Developing Significant Strength in S&T While the United States Is Falling Behind?
Reports, testimonies, and news articles contain many references to the rapidly growing strength of other nations in S&T and the failure of the United States to keep pace. These sources may be based on specific cases, anecdote, or expert opinion, all of which can be valuable sources of information and which can work together to feed a public percep-tion. We will present some quotations to indicate the pervasive nature of these views. We will then draw on reputable, open data sources to see whether they corroborate the quotations.
“The United States is in a fierce contest with other nations to remain the world’s scientific leader,” opens a Business Roundtable report, “But other countries are demonstrating a greater commitment to building their brainpower” (Business Roundtable, 2005). A journal-ist in U.S. News & World Report uses more colorful language: “Over the past century, Americans have become accustomed to winning every global battle that mattered. . . . It was nice while it lasted. Today . . . the land of the free is slowly, but unmistakably, yielding advantages earned over decades to foreigners who work harder, expect less, and often, are better educated. . . . ‘Every one of the early warning signals is trending downward,’ frets Intel Chairman Craig Barrett. ‘We’re all fat, dumb,

The Implications of Globalization and the Rise of Other Nations in S&T 17
and happy, which is one reason why this is so insidious’” (Newman 2006).
An official statement from the National Summit on Competi-tiveness calls attention to “the resources that other countries are pour-ing into building their science and technology enterprises” (National Summit on Competitiveness, 2005). China and India are the most notorious examples of nations on the rise: “The major development since the mid-1990s was the rapid emergence of Asian economies out-side of Japan as increasingly strong players in the world’s S&T system. . . . China is growing at the most rapid pace. . . . Fragmentary data on India suggest that it is also seeking rapid technological development” (National Science Board, 2006a).
According to economist Richard Freeman, this does not bode well for the United States: “[A]s China and India grow and join Europe, Japan and other high-tech competitors, the U.S. scientific advantage ‘is going down pretty rapidly and it’s going to continue to fall’” (Farrell, 2006).
Other nations/regions certainly have ambitions to strengthen their competitiveness as knowledge-based economies. China and the Euro-pean Union (EU) are two examples. In January 2006, China initiated a 15-year “Medium- to Long-Term Plan for the Development of Sci-ence and Technology.” China aims to become an “innovation-oriented society” by 2020 and a world leader in science and technology by 2050, develop indigenous innovation capabilities, leap-frog1 into leading positions in new science-based industries, increase R&D expenditures to 2.5 percent of GDP by 2020 (from 1.34 percent in 2005), increase the contribution to economic growth from technological advances to 60 percent, limit dependence on imported technology to 30 percent, and become one of the top five countries in the world in the number of patents granted (Cao, Suttmeier, and Simon, 2006).
In March 2000, the EU heads of states and governments agreed to make the EU “the most competitive and dynamic knowledge-based
1 A game in which one player bends over while the next in line leaps over him or her. In this context, it has the meaning of moving forward to today’s level of technology without having to pass though the intervening stages.
18 U.S. Competitiveness in Science and Technology
economy in the world” by 2010—the so-called Lisbon Strategy (Eurac-tiv, 2004a). Two years later, the EU set a goal to increase its average research investment level from 1.9 percent to 3 percent of GDP by 2010, of which two-thirds should be funded by the private sector as compared with 56 percent at the time. Concern that the reform pro-cess was not going fast enough led to a relaunch of the Lisbon Strategy in March 2005 (Euractiv, 2004b). Some of the initiatives under way include
European Research Council (ERC): The ERC, modeled after the National Science Foundation, will be the first pan-European funding agency for frontier research. Investigators from across Europe will be able to compete for ERC grants with scientific excellence as the sole criterion for funding. The European Coun-cil of Ministers approved in June 2006 a budget of €7.5 billion (U.S. $9.7 billion) over seven years2 (Abbott, 2006).European Institute of Technology (EIT): The European Commission proposed in 2005 the creation of a European Institute of Technol-ogy, with the goal of becoming the most prestigious institute of technology in the world, with access to world-class research facili-ties, hosting top scientists from across the world, and training the researchers of tomorrow.European Roadmap for Research Infrastructures: The Roadmap, pre-sented October 2006, will allow a common European approach to the development of large-scale research infrastructures, support the definition of priorities, and aid the pooling of the financial resources needed for their development.
While China is viewed as a threat primarily because of its large manufacturing base built on low-wage labor, rapid economic develop-ment, and growing military, the EU represents a different type of chal-lenge, namely, a set of advanced countries competing with the United
2 For comparison, the National Science Foundation proposed FY 2007 annual budget was $6.02 billion.

The Implications of Globalization and the Rise of Other Nations in S&T 19
States in science and technology. Still, China is also investing heavily in certain areas of science, such as nanotechnology.
Given the viewpoints and information above, we want to place them in the context of data series on S&T relevant to the following questions:
Is R&D rapidly increasing in major nations or regions other than the United States? Is S&T employment growing more rapidly in other nations or regions? Are other nations or regions educating their populations in S&T more rapidly than the United States? Is innovation and scientific discovery increasingly taking place elsewhere? Are other nations or regions becoming more capable of acquiring and implementing new technology and information?
Quantitative S&T Indicators. One approach to judging whether the United States is falling behind in S&T is to compare it with other countries with respect to quantitative indicators. One can obtain a gen-eral picture of the world’s nations’ S&T prowess by piecing together information from several indicators, as long as various indicators are not in huge disagreement with one another.
Given the complexity of the problem, economists and policymakers do not know what the “right” amount of effort and investment in S&T is for a nation; at a minimum, we can compare the United States with other nations to learn how much they have chosen to invest and with what results, and reflect on that in considering how much the United States should invest. The comparison with other countries is made from this perspective and not from the viewpoint of competition between nations in S&T, which is the more common motivation for such com-parisons. As we discussed earlier, the notion of competition can be mis-leading when applied to a comparison of countries. Neither interna-tional trade nor S&T progress is a zero-sum game, and improvement in one country does not necessarily imply a loss for another country.
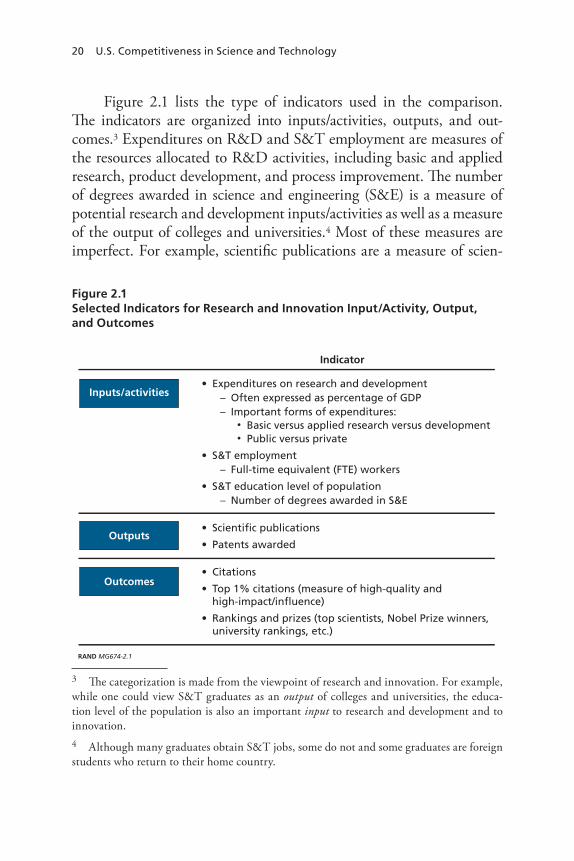
20 U.S. Competitiveness in Science and Technology
Figure 2.1 lists the type of indicators used in the comparison. The indicators are organized into inputs/activities, outputs, and out-comes.3 Expenditures on R&D and S&T employment are measures of the resources allocated to R&D activities, including basic and applied research, product development, and process improvement. The number of degrees awarded in science and engineering (S&E) is a measure of potential research and development inputs/activities as well as a measure of the output of colleges and universities.4 Most of these measures are imperfect. For example, scientific publications are a measure of scien-
3 The categorization is made from the viewpoint of research and innovation. For example, while one could view S&T graduates as an output of colleges and universities, the educa-tion level of the population is also an important input to research and development and to innovation.4 Although many graduates obtain S&T jobs, some do not and some graduates are foreign students who return to their home country.
Figure 2.1Selected Indicators for Research and Innovation Input/Activity, Output, and Outcomes
RAND MG674-2.1
Indicator
Inputs/activities
Outputs
Outcomes
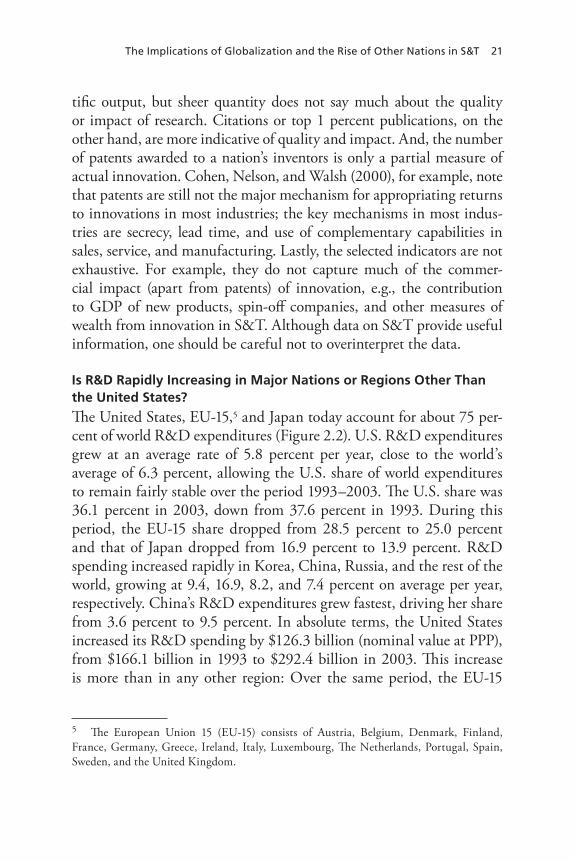
The Implications of Globalization and the Rise of Other Nations in S&T 21
tific output, but sheer quantity does not say much about the quality or impact of research. Citations or top 1 percent publications, on the other hand, are more indicative of quality and impact. And, the number of patents awarded to a nation’s inventors is only a partial measure of actual innovation. Cohen, Nelson, and Walsh (2000), for example, note that patents are still not the major mechanism for appropriating returns to innovations in most industries; the key mechanisms in most indus-tries are secrecy, lead time, and use of complementary capabilities in sales, service, and manufacturing. Lastly, the selected indicators are not exhaustive. For example, they do not capture much of the commer-cial impact (apart from patents) of innovation, e.g., the contribution to GDP of new products, spin-off companies, and other measures of wealth from innovation in S&T. Although data on S&T provide useful information, one should be careful not to overinterpret the data.
Is R&D Rapidly Increasing in Major Nations or Regions Other Than the United States?
The United States, EU-15,5 and Japan today account for about 75 per-cent of world R&D expenditures (Figure 2.2). U.S. R&D expenditures grew at an average rate of 5.8 percent per year, close to the world’s average of 6.3 percent, allowing the U.S. share of world expenditures to remain fairly stable over the period 1993–2003. The U.S. share was 36.1 percent in 2003, down from 37.6 percent in 1993. During this period, the EU-15 share dropped from 28.5 percent to 25.0 percent and that of Japan dropped from 16.9 percent to 13.9 percent. R&D spending increased rapidly in Korea, China, Russia, and the rest of the world, growing at 9.4, 16.9, 8.2, and 7.4 percent on average per year, respectively. China’s R&D expenditures grew fastest, driving her share from 3.6 percent to 9.5 percent. In absolute terms, the United States increased its R&D spending by $126.3 billion (nominal value at PPP), from $166.1 billion in 1993 to $292.4 billion in 2003. This increase is more than in any other region: Over the same period, the EU-15
5 The European Union 15 (EU-15) consists of Austria, Belgium, Denmark, Finland, France, Germany, Greece, Ireland, Italy, Luxembourg, The Netherlands, Portugal, Spain, Sweden, and the United Kingdom.
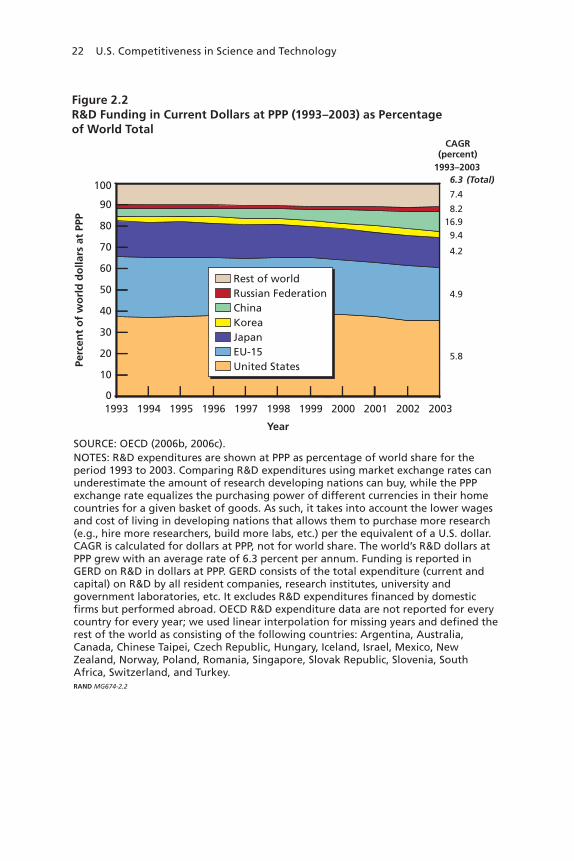
22 U.S. Competitiveness in Science and Technology
Figure 2.2R&D Funding in Current Dollars at PPP (1993–2003) as Percentage of World Total
Perc
ent
of
wo
rld
do
llars
at
PPP
SOURCE: OECD (2006b, 2006c). NOTES: R&D expenditures are shown at PPP as percentage of world share for theperiod 1993 to 2003. Comparing R&D expenditures using market exchange rates canunderestimate the amount of research developing nations can buy, while the PPPexchange rate equalizes the purchasing power of different currencies in their homecountries for a given basket of goods. As such, it takes into account the lower wagesand cost of living in developing nations that allows them to purchase more research(e.g., hire more researchers, build more labs, etc.) per the equivalent of a U.S. dollar.CAGR is calculated for dollars at PPP, not for world share. The world’s R&D dollars atPPP grew with an average rate of 6.3 percent per annum. Funding is reported inGERD on R&D in dollars at PPP. GERD consists of the total expenditure (current andcapital) on R&D by all resident companies, research institutes, university andgovernment laboratories, etc. It excludes R&D expenditures financed by domesticfirms but performed abroad. OECD R&D expenditure data are not reported for everycountry for every year; we used linear interpolation for missing years and defined therest of the world as consisting of the following countries: Argentina, Australia,Canada, Chinese Taipei, Czech Republic, Hungary, Iceland, Israel, Mexico, NewZealand, Norway, Poland, Romania, Singapore, Slovak Republic, Slovenia, SouthAfrica, Switzerland, and Turkey.RAND MG674-2.2
80
60
40
20
100
0
CAGR(percent)
1993–2003
200219971996199519941993 2003
Year
(Total)6.3
4.9
5.8
9.4
4.2
16.9
7.4
8.290
70
50
30
10
2001200019991998
Rest of worldRussian FederationChinaKoreaJapanEU-15United States

The Implications of Globalization and the Rise of Other Nations in S&T 23
added $76.6 billion, Japan added $38.3 billion, and China added $60.8 billion.
Figure 2.3 shows R&D intensity measured as the ratio of gross domestic expenditure on R&D (GERD) to gross domestic product for the period 1985 to 2005 for selected countries. R&D intensity is rela-tively high for the United States, at 2.6 percent, and fairly stable over time. Only Japan has had a consistently higher R&D intensity than the United States, and it has been rising. The R&D intensities of Korea and China have also been rising, with Korea’s increasing from 1.8 per-cent to 2.8 percent and China’s increasing from 0.7 percent to 1.2 per-cent between 1991 and 2004. The rapid increases in Korea and espe-cially China are consistent with the decline in the share of world R&D spending from the United States, EU-15, and Japan shown in Figure 2.3. Perhaps surprisingly, the only country showing a decline in R&D
Figure 2.3R&D Intensity: Gross Domestic Expenditure on R&D as Percentage of Gross Domestic Product, 1985–2005
SOURCE: Reproduced from Eaton and Kortum (2007); OECD (2006b, 2006c). Used with permission.RAND MG674-2.3
1985 2000
Year
19951990
R&
D/G
DP
in p
erce
nt
3.0
1.5
1.0
0.5
3.5
0
2.5
2.0
ChinaGermanyJapanKorea
UKUnited StatesUSSR/Russia
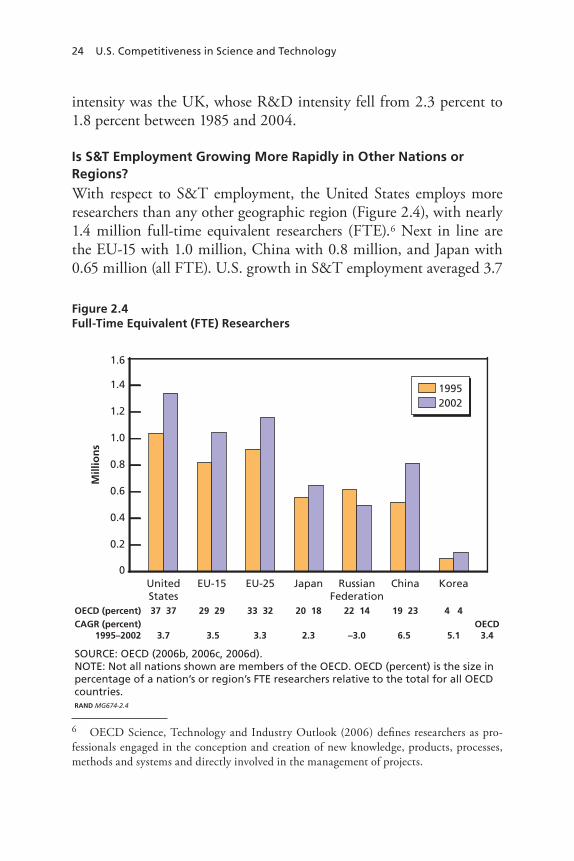
24 U.S. Competitiveness in Science and Technology
intensity was the UK, whose R&D intensity fell from 2.3 percent to 1.8 percent between 1985 and 2004.
Is S&T Employment Growing More Rapidly in Other Nations or Regions?
With respect to S&T employment, the United States employs more researchers than any other geographic region (Figure 2.4), with nearly 1.4 million full-time equivalent researchers (FTE).6 Next in line are the EU-15 with 1.0 million, China with 0.8 million, and Japan with 0.65 million (all FTE). U.S. growth in S&T employment averaged 3.7
6 OECD Science, Technology and Industry Outlook (2006) defines researchers as pro-fessionals engaged in the conception and creation of new knowledge, products, processes, methods and systems and directly involved in the management of projects.
Figure 2.4Full-Time Equivalent (FTE) Researchers
Mill
ion
s
SOURCE: OECD (2006b, 2006c, 2006d).NOTE: Not all nations shown are members of the OECD. OECD (percent) is the size inpercentage of a nation’s or region’s FTE researchers relative to the total for all OECD countries.RAND MG674-2.4
1.4
1.2
1.0
0.8
0.6
0.4
0.2
1.6
ChinaRussianFederation
JapanEU-15 EU-25UnitedStates
Korea0
CAGR (percent)1995–2002
OECD (percent)
3.4 6.5–3.02.33.3 5.13.7 3.5
19 2322 1420 1833 32 4 437 37 29 29OECD
19952002
The Implications of Globalization and the Rise of Other Nations in S&T 25
percent per year from 1995–2002 and was close to the OECD average of 3.4 percent and the EU-15 of 3.5 percent, and above that of Japan, 2.3 percent. China surpassed Japan in S&T employment and showed rapid growth of 6.5 percent per year. The United States added a large number of researchers, 299,000, between 1995 and 2003, while China added nearly as many, 289,000, the EU-15 added 220,000, and Japan added 95,000.
Are Other Nations or Regions Educating Their Populations in S&T More Rapidly Than the United States?
Freeman (2006, 2007) argues that the rest of the world has begun to catch up with the United States in higher education in general but par-ticularly so in S&E fields. In 2001–2002, United Nations Educational, Scientific and Cultural Organization (UNESCO) data show that the United States enrolled 14 percent of the world’s tertiary level students, less than half the U.S. share 30 years earlier. Moreover, the propor-tion of those degrees earned in natural sciences and engineering (17 percent) is considerably lower than the world average (27 percent) and in China (52 percent). In addition, U.S. production of PhDs in S&E has remained relatively constant, while that in the EU and in China has increased (see also Section 3.3). The EU granted 40 percent more S&E PhDs than the United States in 2001, and China exhibits strong growth, potentially producing more S&E doctorates by 2010 than the United States. Further, the foreign-born share of U.S. S&E doctorate degrees has increased substantially, from 6 percent in 1966 to 39 per-cent in 2000. The noncitizen share of bachelor’s degrees in S&E has also increased, although by a smaller amount (see Section 3.3).
National Science Board data (Figure 2.5) indicate that in 2002 the EU-15 and China graduated more scientists and engineers than did the United States. The EU-15 and China had about 500,000 and 530,000, respectively, versus 430,000 for the United States. However, estimates of the number of graduates are hindered by differences in science and engineering classification as well as by international differ-ences in degrees (for example, the Anglo-Saxon bachelor’s degree versus the German Diplom), in the quality of education, and in the duration of programs. For example, the OECD reports 298,761 Tertiary type-A
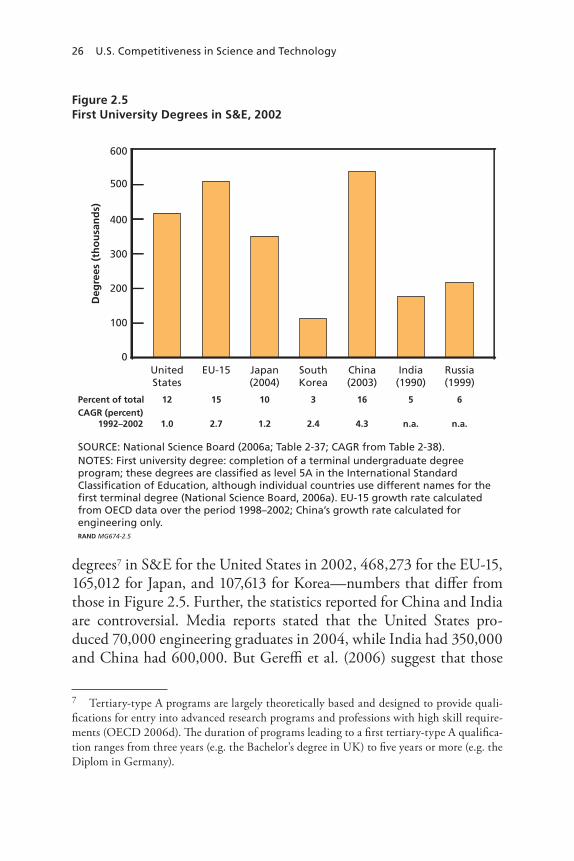
26 U.S. Competitiveness in Science and Technology
degrees7 in S&E for the United States in 2002, 468,273 for the EU-15, 165,012 for Japan, and 107,613 for Korea—numbers that differ from those in Figure 2.5. Further, the statistics reported for China and India are controversial. Media reports stated that the United States pro-duced 70,000 engineering graduates in 2004, while India had 350,000 and China had 600,000. But Gereffi et al. (2006) suggest that those
7 Tertiary-type A programs are largely theoretically based and designed to provide quali-fications for entry into advanced research programs and professions with high skill require-ments (OECD 2006d). The duration of programs leading to a first tertiary-type A qualifica-tion ranges from three years (e.g. the Bachelor’s degree in UK) to five years or more (e.g. the Diplom in Germany).
Figure 2.5First University Degrees in S&E, 2002
Deg
rees
(th
ou
san
ds)
SOURCE: National Science Board (2006a; Table 2-37; CAGR from Table 2-38).NOTES: First university degree: completion of a terminal undergraduate degreeprogram; these degrees are classified as level 5A in the International StandardClassification of Education, although individual countries use different names for thefirst terminal degree (National Science Board, 2006a). EU-15 growth rate calculatedfrom OECD data over the period 1998–2002; China’s growth rate calculated forengineering only. RAND MG674-2.5
500
400
300
200
100
600
0
CAGR (percent)1992–2002
Percent of total
India(1990)
n.a.
5
China(2003)
4.3
16
SouthKorea
2.4
3
Japan(2004)
1.2
10
Russia(1999)
n.a.
6
UnitedStates
1.0
12
EU-15
2.7
15

The Implications of Globalization and the Rise of Other Nations in S&T 27
often-cited numbers are misleading. The authors compare in depth the number of degrees awarded in engineering, computer science, and information technology. In these fields, they find 137,000, 112,000 and 351,000, respectively, for bachelor’s degrees awarded in the United States, India, and China in 2004. Including sub-baccalaureate degrees expands the numbers to 222,335 degrees for the United States, 215,000 for India, and 644,106 for China in 2004. Regardless of the differences in the numbers reported, the various sources consistently find that the European Union and China graduate more scientists and engineers than the United States does.
In addition, the EU-15 dominates in the supply of PhDs in sci-ence and engineering, awarding 41,000 doctorates in 2002 compared with 27,000 for the United States, 10,000 for Russia, and 8,000 for China and Japan (Table 2.1), and both China and the EU are on a high-growth trajectory. Freeman (2006) forecasts that by 2010, at cur-rent growth rates, the EU will produce nearly twice as many PhDs in
Table 2.1Earned Doctoral Degrees in S&E, by Nation/Region (2002 or Most Recent Year)
Nation/RegionEarned Doctoral Degrees in S&E Percentagea
EU-15 40,776 33
United States 26,891 22
Russia 10,409 8
China 8,153 7
Japan 7,581 6
India 5,527 4
Romania 4,544 4
South Korea 3,225 3
Canada 2,475 2
Brazil 2,176 2
Australia 2,154 2
All Other 11,100 9
All Recipientsb 125,011 100
SOURCE: National Science Board (2006a; table 2-40).a Column may not sum to 100 because of rounding.b Selected regions (not all countries included).

28 U.S. Competitiveness in Science and Technology
S&E as the United States, and China will produce about 25 percent more than the United States. Related to these trends, the percentage of U.S. S&E degrees awarded to foreigners is high and increasing with the level of education. In 2002, 41 percent of total U.S. PhD graduates in S&E were foreigners (temporary and permanent residents; National Science Board, 2006a). Many foreign scientists and engineers remain in the United States following their graduation, and research suggests that stay rates are at all-time highs and average about 70 percent (Finn, 2005). Nevertheless, taking into account foreigners leaving the United States after graduation, the actual supply to the U.S. workforce of sci-entists and engineers freshly graduated from U.S. universities is smaller than the total numbers suggest. We provide more facts and discussion of the role of foreigners in the U.S. S&E workforce in Chapter Three.
Is Innovation and Scientific Discovery Increasingly Taking Place Elsewhere?
Patents Awarded. Patents are one of the most commonly used indicators to measure innovative activity. Patents are used to protect inventions by businesses and public research organizations by provid-ing the inventor with the exclusive right to exploit the invention com-mercially and to exclude others from using it over a limited period of time within the country where the application is made. Thus the number of patents issued is a useful, albeit imperfect,8 indicator of the output of research and development and of the commercial application of new technologies.
The vast majority of triadic patents are awarded to the United States, EU-15, and Japan (Figure 2.6). Triadic patent families are a set of inventions that are patented broadly in the United States, Europe, and Japan (innovations that are thought to be particularly significant or valuable are patented in several countries, particularly the United
8 A technological innovation can be defined as a commercially successful invention. Thus, patents remain an intermediate indicator of an innovative result, as getting a patent granted does not guarantee commercial success. And, as noted before, patents are still not the major mechanism for appropriating returns to innovations in most industries; the key mechanisms in most industries are secrecy, lead time, and use of complementary capabilities in sales, ser-vice, and manufacturing (Cohen, Nelson and Walsh, 2000).

The Implications of Globalization and the Rise of Other Nations in S&T 29
States, Europe, and Japan).9 The United States accounted for about 38 percent of industrialized nations’ (OECD countries) triadic patents in
9 Patent indicators are commonly constructed on the basis of information from a single patent office and as a result suffer from the “home” advantage bias, that is, domestic appli-cants tend to file more patents in their home country than foreign applicants do and are thus overrepresented. Also, indicators based on a single patent office are influenced by fac-tors other than technology, such as patenting procedures, economic conditions in the home country, etc. In addition, many patents are of low value and simple patent counts would therefore not represent “true” inventive activity and be biased toward patent offices that grant patents more easily. To avoid these biases, the OECD has developed a set of indicators based on triadic patent families (see Dernis and Khan, 2004). According to the OECD Compen-dium of Patent Statistics, “Triadic patent families are a set of patents taken at the European Patent Office (EPO), Japan Patent Office (JPO) and the United States Patent and Trade-mark Office (USPTO) that share one or more priorities. In terms of statistical analysis, they improve the international comparability of patent-based indicators, as only patents applied for in the same set of countries are included in the ‘family’: home advantage and influence of geographical location are therefore eliminated. Second, patents included in the family are
Figure 2.6Triadic Patents in 1985, 1993, and 2003, by Nation/Region
Pate
nts
(p
erce
nt)
SOURCE: OECD (2006b, 2006c); see also Eaton and Kortum (2007).NOTES: Numbers above bars denote percentages of OECD triadic patents; triadicpatent families are a set of inventions that are patented broadly in the United States,Europe, and Japan. RAND MG674-2.6
18,000
16,000
14,000
12,000
10,000
8,000
6,000
4,000
2,000
20,000
ChinaRussiaJapanEU-15UnitedStates
1985–20031993–2003
Korea
3437
33
31
24
28
26
12
34
38
0
CAGR(percent)
4.85.7
10.628.5
6.27.7
5.34.9
3.75.1
29.517.9
5.36.6
OECD
198519932003

30 U.S. Competitiveness in Science and Technology
2003, Europe 31 percent, and Japan 26 percent. Between 1993 and 2003 U.S. growth in new triadic patents averaged 6.6 percent per year, which was faster than the EU-15 (5.1 percent), Japan (4.1 percent), and the OECD average (5.7 percent). China and Korea had remarkably high patent growth rates of 18 percent and 30 percent per year but started from a tiny base of less than 1 percent. Besides greater innova-tive activity, the large increase in triadic patents could reflect increased use of patents as part of legal and business strategies to protect against piracy or to improve competitive position by blocking market entry or impeding rivals’ innovation.
Scientific Publications. Publication and citation counts have become a common means of assessing nations’ relative scientific prow-ess. King (2004) compares the research output and outcomes of 31 countries, including the G8 and EU-15, using research publication and citation data from Thomson ISI. These 31 countries account for more than 98 percent of the world’s highly cited papers, which are defined by Thomson ISI as the most-cited 1 percent by field and year of publica-tion. King also compares scientific outputs and outcomes with various inputs and wealth to provide insight into the scientific “productivity” and “efficiency” of countries and the various factors needed to produce science and economic growth (see also May, 1997, 1998).
The United States, EU-15, and Japan dominate the world’s S&T publications, citations, and top 1 percent most-cited publications, as seen in Figures 2.7, 2.8, and 2.9. This leadership is in keeping with the fact that these three spend the most on R&D (Figure 2.2).
The United States and EU-15 lead the world in the volume of publications, with 35 percent and 37 percent, respectively, of the world total over 1997 to 2001.10 While the EU-15 and U.S. publication vol-umes are comparable, the United States performed significantly better on measures of the influence and impact of science production, such as citations, highly cited papers (top 1 percent of papers by field), top
typically of higher value: patentees only take on the additional costs and delays of extending protection to other countries if they deem it worthwhile” (OECD, 2007). 10 Publications and citations are allocated once to every country in which an author is based and hence the sum of the shares of national publications and citations exceeds 100 percent.

The Implications of Globalization and the Rise of Other Nations in S&T 31
international science prizes, top 100 most cited individuals in each sci-entific field, etc. The United States accounts for 49 percent of citations, 63 percent of highly cited publications, and employs 70 percent of the world’s Nobel Prize winners and 66 percent of the most-cited indi-viduals. According to the Shanghai Institute of Education, the United States is the home of 75 percent of the world’s top 20 universities, 75 percent of the top 40, and 58 percent of the top 100. By such mea-sures of influence and impact, the United States has maintained its world leadership in science and engineering.
However, the EU-15 and other geographic regions gained on the United States in the past decade. The EU-15 and Japan had average annual growth rates of 3–4 percent per year in publications and above 5 percent in top 1 percent most-cited publications between 1993–1997 and 1997–2001. Over the same period, U.S. growth rates were flat and
Figure 2.7Share of World S&T Publications
Perc
ent
SOURCE: King (2004).NOTES: CAGR is calculated (based on mid-point years 1995 and 1999) for actualpublications, not for world share. The world’s volume of publications grew at anaverage rate of 2.2 percent per annum. RAND MG674-2.7
35
30
25
20
15
10
5
40
ChinaRussiaJapanEU-15 IndiaUnitedStates
Korea0
CAGR (percent) 2.213.91.40.43.8 20.00.3 3.3
Worldaverage
1993–19971997–2001

32 U.S. Competitiveness in Science and Technology
below the world average rates of 2.2 percent and 2.3 percent, respec-tively, in publications and top 1 percent most-cited publications. The EU-15 surpassed the United States in the number of scientific pub-lications. Smaller global science players, China and Korea, starting from a tiny base,11 showed significant annual growth in publications (13 percent and 20 percent, respectively) and in top 1 percent most-cited publications (25 percent and 37 percent). India had little growth in publications but substantial growth in top 1 percent most-cited pub-lications (16 percent). As a result, the U.S. shares of world publica-tions, citations, and top 1 percent highly cited publications decreased by nearly 3 percentage points of world share each between 1993–1997
11 A small base of 2.1 percent (China) and 0.8 percent (Korea) world share in publications and a 0.4 percent (China) and 0.3 percent (Korea) world share in top 1 percent citations for 1993–1997.
Figure 2.8Share of World S&T Citations
SOURCE: King (2004).NOTES: We do not provide CAGR calculations as the total number of citationsreported in King (2004) nearly halved between 1993–1997 and 1997–2001. Thiswas most likely a result of a shorter follow-up period for 1997–2001 publications. RAND MG674-2.8
ChinaRussiaJapanEU-15 IndiaUnitedStates
Korea
Perc
ent
50
40
30
20
10
60
0
1993–19971997–2001

The Implications of Globalization and the Rise of Other Nations in S&T 33
and 1997–2001, while the EU-15, Japan, China, and Korea gained world share.
The company Evidence, LTD, provides an alternative way to compare the research input, activity, and output of the G8 and select members of the rest of the world. Evidence produces so-called research footprints for a select set of indicators: public R&D as a share of GDP, share of OECD PhDs, share of world publications, share of world cita-tions, lead citation share by research field, and researchers per thousand of the workforce. The footprints are shown in Figure 2.10, in which the dashed polygon represents the average of the comparator group of 25 countries.
These research footprints summarize the key S&T indicators for 2004 and suggest that U.S. S&T compares well with other countries. The EU-15 has a higher share of OECD PhDs, but fewer researchers
Figure 2.9Share of World’s Top 1 Percent Most-Cited S&T Publications
Perc
ent
SOURCE: King (2004).NOTES: CAGR is calculated (based on mid-point years 1995 and 1999) for actualpublications, not for world share. The world’s volume of publications grew at anaverage rate of 2.3 percent per annum. RAND MG674-2.9
60
50
40
30
20
10
70
ChinaRussiaJapanEU-15 IndiaUnitedStates
Korea0
CAGR (percent) 2.325.116.38.25.8 32.01.1 5.5
Worldaverage
1993–19971997–2001

34 U.S. Competitiveness in Science and Technology
per thousand in the workforce. Despite higher numbers of publica-tions, EU-15 citations are fewer and the lead citation share is much smaller than that of the United States. China’s footprint is quite small, lacking substantial science impact in the form of citations and lead citations. China’s publication volume is close to the comparator average (which includes many smaller nations), and public R&D expenditures are below the average. While China may have significant numbers of
Figure 2.10Research Footprints
SOURCE: Office of Science and Technology (2005); Adams (2007). Used with permission.NOTE: PUBERD = Public expenditure on R&D.RAND MG674-2.10
Leadcitationshare byresearch
field
Share ofOECD PhDs
Shareof worldcitations
Shareof worldsources
Researchersper thousand
workforcePUBERDper GDP
Leadcitationshare byresearch
field
Share ofOECD PhDs
Shareof worldcitations
Shareof worldsources
Researchersper thousand
workforcePUBERDper GDP
Leadcitationshare byresearch
field
Share ofOECD PhDs
Shareof worldcitations
Shareof worldsources
PUBERDper GDP
Leadcitationshare byresearch
field
Share ofOECD PhDs
Shareof worldcitations
Shareof worldsources
Researchersper thousand
workforcePUBERDper GDP
USA EU-15
Japan China
Researchersper thousand
workforce

The Implications of Globalization and the Rise of Other Nations in S&T 35
researchers, when expressed as a share of the workforce, the numbers are small. Size (population, economy, etc.) is important in area graphs as a number of indicators, such as world or OECD share of publica-tions or PhDs, are, all else equal, greater the greater the region. China has a small footprint, but note that area graphs are slightly deceiving in that they tend to visually amplify the differences between low and high performers (area versus linear plots).
Are Other Nations or Regions Becoming More Capable of Acquiring and Implementing New Technology and Information?
We have discussed the ambitions of China and the European Union to increase their S&T establishment. But, what are the institutions, formal and informal, that allow nations to acquire and implement technology? Are these conditions present or likely to be created in other countries?
Silberglitt et al. (2006a, 2006b) studied 29 countries in terms of their ability to acquire and implement a select set of new technology applications by 2020. Their study can provide insight into the capabil-ity of nations to absorb and implement new technologies and how this capability is expected to develop over the next 15 years. The authors focused on 16 technologies and describe ten factors likely to influence the acquisition and implementation of these technologies.12 These fac-tors are quoted below from their report:
Cost and financing: The cost of acquiring the technology applica-tion and building the physical infrastructure and human capital to introduce and sustain its use, the mechanisms and resources avail-able to access the needed funds, and the costs of those funds.Laws and policies: Legislation and policies that either pro-mote, discourage, or prohibit the use of a particular technology application.Social values, public opinion, and politics: Religious beliefs, cul-tural customs, and social mores that affect how a technology
12 The set consists of 16 out of 56 technology applications that the authors identified as possible by 2020 and that have the greatest combined likelihood of being widely available commercially, enjoying a significant market demand, and affecting multiple sectors.
36 U.S. Competitiveness in Science and Technology
application is perceived within a society; compatibility of a new application with dominant public opinions; and the politics and economics underlying debates about an application.Infrastructure: Physical infrastructure at a consistent threshold of quality that can be maintained, upgraded, and expanded over time.Privacy concerns: Social values toward privacy in a country and personal preferences about the availability and use of personal data that arise from an individual’s ideological inclinations and experience with the privacy issue.Use of resources and environmental health: Availability and accessi-bility of natural resources, concerns about pollution and its impact on humans, and social attitudes and politics about conservation and preserving land and wildlife.R&D investment: Funding to educate and train scientists, engi-neers, and technicians; build research laboratories, computer net-works, and other facilities; conduct scientific research and develop new technologies; transfer technologies to commercial applica-tions; and enter technology applications into the marketplace.Education and literacy: Levels of general education and literacy adequate to make a population comfortable with technology and able to interface with it, and the availability of sufficiently high-quality postsecondary education and training in the sciences to stock a workforce comfortable with developing, using, and main-taining technology applications.Population and demographics: Overall size, average age, and growth rate of the population and the relative size of different age groups within a population.Governance and political stability: Degree of effectiveness or cor-ruption within all levels of government; the influence of gover-nance and stability on the business environment and economic performance; and the level of internal strife and violence, as well as external aggression; number and type of security threats.
Silberglitt et al. (2006a, 2006b) then attempted to identify the major barriers and drivers for the 29 countries in their study. They

The Implications of Globalization and the Rise of Other Nations in S&T 37
find that scientifically advanced nations such as the United States, the EU, and Japan will be highly capable of implementing new technology and that China and India have partial capability, but are well ahead of Latin America, the Middle East, and Africa.
Scientifically advanced nations—the United States, Canada, Ger-many (representing Western Europe), Japan, South Korea, Australia, and Israel—will be highly capable of implementing new technology applications. These countries will have excellent S&T capacity, along with the highest number of positive factors and lowest number of barriers.
Among scientifically proficient nations, China will fall below these top seven countries; however, it will lead the group of scientifi-cally proficient nations, with a high level of S&T capacity and many drivers. India, Poland (representing Eastern Europe), and Russia—the other three scientifically proficient countries—will be less capable than China of implementing the applications they can acquire. In these countries, although the S&T capacity will be high, in the authors’ esti-mation the number of barriers will slightly exceed the number of driv-ers, making it more difficult to introduce and sustain the full range of possible technology applications.
Silberglitt et al. (2006a, 2006b) point to the technological pre-eminence of the scientifically advanced countries in North America, Western Europe, and Asia; the emergence of China and India as rising technological powers, with the scientifically proficient countries of Eastern Europe not far behind; the relative slippage of Russia; the wide variation in technological capability among the scientifically develop-ing countries of Southeast Asia and Latin America; the large scientific and technological gap between the scientifically developing countries of Latin America, as well as Turkey and South Africa, and the rising technological powers, China and India; and the enormous scientific and technological gap between the scientifically lagging countries of Africa, the Middle East, and Oceania and the scientifically advanced nations of North America, Western Europe, and Asia.

38 U.S. Competitiveness in Science and Technology
Discussion
The United States still leads the world in science and technology. The United States accounts for 40 percent of total world R&D spending, 38 percent of industrialized nations’ (OECD countries) triadic patents, and employs 37 percent of OECD researchers (1.3 million FTE). It produces 35 percent, 49 percent, and 63 percent of world publications, citations, and highly cited publications, employs 70 percent of the world’s Nobel Prize winners, 66 percent of its most cited individuals, and is home to 75 percent of the world’s top 20 and top 40 universities and 58 percent of its top 100.
R&D spending is rapidly increasing in developing nations such as China and Korea. But despite this rapid growth, the U.S. share of world R&D spending (dollars at PPP) fell only by 1.5 percent to 36.1 percent between 1993 and 2003, while the EU-15 and Japan lost significant ground. In absolute terms, the United States increased its R&D spend-ing by $126.3 billion (nominal value at PPP), from $166.1 billion in 1993 to $292.4 billion in 2003. This increase is more than in any other region: Over the same period, the EU-15 added $76.6 billion, Japan added $38.3 billion, and China added $60.8 billion.
S&T employment is not growing more rapidly in other nations/regions than in the United States, though China showed remark-able growth. The United States added a large number of researchers (299,000) between 1995 and 2003, suggesting a vibrant R&D sector. At the same time, China added nearly as many (289,000), the EU-15 added 220,000, and Japan added 95,000. Both the EU-15 and China graduated more scientists and engineers than the United States.
While developing nations (China and India in particular) are starting to account for a significant portion of the world’s S&T inputs and activities (R&D funding in dollars at PPP, research jobs, S&T education, etc.) and are showing rapid growth in outputs and out-comes, they still account for a very small share of triadic patents, S&T publications, and citations. Innovation and scientific discovery are still led by the United States, EU 15, and Japan. The United States did lose 3 percentage points in its world share in publications, citations, and top 1 percent highly cited publications between 1993–1997 and

The Implications of Globalization and the Rise of Other Nations in S&T 39
1997–2001. But on measures such as additions to the S&T workforce and patented innovations, U.S. growth in S&T was in line with or above average world trends. By comparison, Japan grew more slowly in additions to the S&T workforce, and both the EU-15 and Japan had slower growth in patented innovations.
High growth in R&D expenditures, employment of scientists and engineers, and patents suggests that U.S. S&T has remained vigorous. These U.S. developments occur at a time when increases (though at different rates) in each of these measures are also seen in the EU-15, Japan, China, Korea, and many other nations/regions. In other words, strong growth of R&D activity, S&E employment, and innovation in many countries suggests a future of significant innovation activity, and, because of the greater diffusion of technology in a globalized world, the promise of economic growth for those nations that are capable of absorbing (making economic use of) the new technology. Scientifically advanced nations and regions such as the United States, the EU, and Japan are highly capable of implementing new technology and will benefit from it. Developing nations such as China and India have par-tial capability, but are well ahead of Latin America, the Middle East, and Africa. Though, as we will discuss in more detail later, develop-ing nations can continue to grow their economies rapidly by absorbing existing technology in addition to new technology.
2.2. Will the Globalization of S&T and the Rise of Other Nations Make It More Difficult for the United States to Be Successful in S&T?
Our review of the data suggests that the United States is not close to the brink of losing its leadership in S&T. But even so, will the effects of globalization—including the growing S&T capacity of other nations—make it more difficult for the United States to be a strong global player in S&T in the coming decades?
Those who warn of a crisis would seemingly answer yes. In addi-tion to helping build the S&T capacity of other nations, globalization has other consequences, reports contend, that will also considerably

40 U.S. Competitiveness in Science and Technology
boost the level of competition. One example is an apparent trend in which growing numbers of American S&T jobs are being offshored or outsourced, as similarly qualified workers in lower-wage countries become increasingly available. “You lost your job,” opens a Fox News article, “It’s probably one of the most dreaded things you’ll ever hear from your boss. . . . Then you find out that your white-collar position moved to the other side of the globe—to India” (Wedekind, 2006). Certain policymakers, such as Senator Joseph Lieberman, were early to raise this concern:
Job offshoring is no longer restricted to basic service tasks such as data entry and processing, but has expanded to include sophisti-cated work such as knowledge services, decision analysis, design, engineering, research and development. . . . High tech companies are now offshore[,] outsourcing high paying professional jobs like integrated circuit design . . . automotive and aerospace design . . . and nanotechnology research. (Office of Senator Lieberman, 2004)
More recently, voices from the private sector have been reinforc-ing this perception. General Electric Vice Chairman David Calhoun, for example, observes, “When we have to look for deep technical talent, not just 10 or 20 people—especially in high technology—the places you can go and know you can hire somebody every day are India and China” (quoted in Newman, 2006). Those who foresee an immi-nent crisis fear that fewer jobs in the United States for American S&T employees will in turn undermine the nation’s ability to compete in the S&T sphere: “The danger is not only the loss of potential new jobs, but that expertise in key disciplines will be moving overseas and that fur-ther innovation in these fields will not occur here but elsewhere” (Presi-dent’s Council of Advisors on Science and Technology, June 2004).
Others who believe that the United States will have trouble retain-ing its position of leadership in S&T point to the changes that global-ization has brought to the nature of innovation. According to the 2006 National Academies of Sciences study, in the past, some of the most important S&T research took place in large corporate laboratories—such as Bell, GE, and IBM—with a single location in the United States.
The Implications of Globalization and the Rise of Other Nations in S&T 41
The federal government was the other major funder of S&T research in the United States, much of which was done in national labs such as the National Institutes of Health and the National Institute for Stan-dards and Technology. But globalization is changing innovation from a national endeavor supported largely with public funds or by domes-tic companies into the product of multinational teams of researchers working in international clusters of emerging tech firms, capital mar-kets, and research universities (e.g., Segal, 2004). Thus, innovation is gaining increased freedom from the national control or influence that regulations or protectionist measures impose.
As a result, runs this line of reasoning, American companies can easily and profitably ship advanced R&D overseas: “U.S. corporations are moving sophisticated design and R&D overseas to their own subsid-iaries abroad or contracting the work to third parties. . . . Data collected by the Department of Commerce shows that the rate at which R&D is shifting abroad has accelerated. . . . The continued shift of corporate R&D to overseas is a threat to our economic prosperity and national security” (Office of Senator Lieberman, 2004). A Seattle Times colum-nist states that “[b]y 2010, some U.S. companies estimate that as much as 90 percent of their research, development and manufacturing will be done in China and India” (Peters, 2006).
In this new innovation environment, offshoring is not the only problem. The concern is that foreign STEM professionals who might have formerly lent their talents to American S&T may choose to return home. Also, highly skilled American workers are being courted by foreign and multinational companies and are moving overseas: “The United States . . . used to be the first and last stop for the world’s finest talent, in areas ranging from electronics to medicine to chemistry and physics. . . . But as fast-growing foreign companies have begun to con-quer new markets, they have been luring away top managers and sci-entists looking for exciting new challenges.” (Newman, 2006) Further, “As global competition for technical talent intensifies . . . the United States will have a difficult time meeting its skill needs. . . . [T]he pool of high tech labor and, therefore, the capacity to innovate in the United States becomes more limited, threatening long-term economic viabil-ity” (Office of Senator Lieberman, 2004).
42 U.S. Competitiveness in Science and Technology
The increasingly rapid flow of information across national borders is yet another effect of globalization that some contend is raising the bar on S&T performance for the United States. The Internet, the low cost of telecommunications, and cheaper transportation have dramati-cally facilitated the spread of knowledge, scientific discoveries, and new technologies around the world. The concern lies in the idea that when many countries have access to the same technologies, the United States will no longer hold the advantage in S&T innovation.
New technologies tend to get developed in markets where there’s infrastructure that supports them and customers who demand them, which often spurs further innovation and the high-paying jobs that come with it. When Internet service provider Earth-link was looking for a partner . . . it began scouting . . . in South Korea, where the government has aggressively pushed broadband connectivity to every home, advanced cellular technology, and other innovations. (Newman, 2006)
In light of these concerns, we look at two questions in particular:
Are American S&T jobs likely to go overseas? Does the changing nature of innovation pose a threat to Ameri-ca’s strong performance in S&T?
Are American S&T Jobs Likely to Go Overseas?
High growth in R&D expenditures, triadic patents, and S&E employ-ment, combined with low unemployment of S&E workers (see Sec-tion 3.3), suggest that U.S. S&E has remained vigorous and does not support the notion that, as a result of outsourcing R&D to overseas firms and offshoring S&E jobs, domestic S&E jobs are being lost at substantial rates. These U.S. developments occur at a time when R&D expenditures, S&E employment, and patents are also increasing in the EU-15, Japan, China, Korea, and many other nations/regions. While it is possible that growth in R&D expenditures, patents, innovation, and S&E employment would have been greater without outsourcing and offshoring, it is plausible that the globalization of R&D is creating jobs both in the United States and in those nations/regions that are or are
The Implications of Globalization and the Rise of Other Nations in S&T 43
becoming R&D-intensive. As mentioned before, this is not a zero-sum game, and everyone may benefit from the globalization of R&D.
A study based on the 2006 Duke/Booz Allen Hamilton Offshor-ing Research Network Survey (Couto et al., 2006) suggests that the offshoring of high-skill content work does not result in job losses in the originating country but rather that the overall job pool is increas-ing. Offshoring used to be a tactical labor cost–saving exercise but is increasingly driven by the need to access scarce talent as, according to the study, “the supply of higher-skilled engineers, computer scientists, software developers, and other scientists in the talent pool has not kept pace with demand onshore.” While cost reduction is still considered to be the most important cause of offshoring, the need to access quali-fied personnel is in close second position and is increasingly (compared with the 2004 and 2005 surveys) mentioned as a major driver of the decision to offshore. Further, the study finds that the more sophisti-cated or high-skilled the function, the lower is the impact of offshoring on employment in the originating country. “No domestic jobs were lost in three out of every four offshoring implementations involving R&D, sales and marketing, product design or engineering. In contrast, offshoring routine back-office functions does result in lost jobs approxi-mately half the time.” This is in line with economic research that finds that skilled labor and capital are complements, whereas unskilled labor and capital are substitutes (e.g., Autor, Katz, and Kearney 2006). Also, the study reported job gains onshore in R&D. Companies look else-where for high-skill talent because they cannot get it at home. The report raises the concern that the sharp reduction in the annual H1B visa cap, allowing skilled foreigners to be employed temporarily in spe-cialty occupations, from 195,000 to 65,000 is likely to result in short-ages for scientists and engineers in the United States.
There is even the possibility that the market for S&E workers will, at the extreme, become global in the sense that the market for oil is global, i.e., the salary for S&E workers in a given field and of a given quality will be the same worldwide, just as there is one price for a barrel of oil. If physical proximity is not a factor and communica-tion is immediate, then a firm considering offshoring its R&D should be willing to pay up to what it would cost to engage S&E workers at

44 U.S. Competitiveness in Science and Technology
home. However, if the supply of S&E workers is plentiful, the workers will compete with one another for higher-paying jobs, thereby hold-ing down the salary prevailing in the market. The reality appears to be somewhere between these extremes. Physical proximity is probably important; telecommunication, although far lower in cost than ever before, is unlikely to remove the importance of face-to-face contact. Further, the supply of S&E workers is limited in the short run even in China and India, and there is evidence of upward pressure on S&E salaries. The Wall Street Journal reports,
Mr. Shah, who leads a California start-up called Riya Inc., had opened an office in India’s technology capital of Bangalore in 2005, hiring about 20 skilled software developers. . . . Then Indian salaries soared. Last year, Mr. Shah paid his engineers in India about half of Silicon Valley levels. By early this year, it was 75%. “Taking into account the time difference with India,” he says, “we weren’t saving any money by being there anymore.” . . . Across Silicon Valley, some technology companies, particu-larly start-up and midsize ones, are beginning to turn away from India for low-cost labor to do sophisticated tech work. . . . Some tech start-ups are choosing other low-wage foreign locales, such as Romania and Poland. (Tam and Range, 2007)
Does the Changing Nature of Innovation Pose a Threat to America’s Strong Performance in S&T?
Segal (2004, 2007) observes that globalization is affecting the way innovation occurs. He argues that private sector innovation is shift-ing from corporate laboratories working individually to international networks of technology firms, capital markets, and research universi-ties. This change is propelled by the decreasing cost of advanced com-munications technologies and an increasing pool of well-educated sci-entists and engineers in other countries, which allows U.S. high-tech corporations to operate more globally, contract out to foreign produc-ers, and transfer technological knowledge to foreign partners. Accord-ing to Segal, not only labor-intensive manufacturing but also advanced research is increasingly sent to Asian technology hubs such as Shanghai and Bangalore, and emerging technology clusters in Asia have started

The Implications of Globalization and the Rise of Other Nations in S&T 45
supporting innovation of their own. Local technology companies have developed, research institutes have been founded, and Asian scientists and engineers with training and work experience in the United States have returned home.
Technology Absorption: The theory of convergence in economics states that poorer economies tend to grow faster than richer economies and that, as a result, all economies will eventually converge in terms of per capita income. In simple terms, the theory of convergence states that in a frictionless world in which goods, services, and factors of production can be freely exchanged, nations should be able to acquire factors of production (such as knowledge) such that all nations end up roughly with equal productivity and equal wealth. Empirical analysis does not support the theory of convergence,13 yet the theory is useful in drawing attention to the role of trade and technology diffusion as elements of economic growth.
Technology is a significant determinant of factor productivity, and globalization increases its diffusion to other nations. This will lead to economic growth, higher GDP per capita, and higher living standards for nations that are able to acquire and implement those technologies. As Eaton and Kortum (2007) discuss, the pool of new technology, not yet acquired and not yet implemented at home, is much larger for devel-oping nations than it is for already developed nations, allowing devel-oping nations to increase productivity and hence grow much more rap-
13 Baumol (1986) observed that, at least among industrial nations, the technological spill-overs from leading economies to followers are significant and increasing with globalization. Exports are an increasing fraction of industrial nations’ output, and industries in foreign nations increasingly encounter direct competition with their products. The pressure to inno-vate, imitate, or substitute is likewise increasing, and no innovation edge can be maintained if immediate, free flows of goods, services, and factors of production (e.g., knowledge, capi-tal, labor, etc.) occur. Baumol’s (1986) analysis supporting global convergence in productiv-ity has been criticized because the 16 nations he chose to compare were all relatively rich ex post and had grown quickly. DeLong’s (1988) less biased ex ante sample, selecting those nations with the highest per capita income in 1870, found no such evidence: “[the data] do not support the claim that those nations which should have been able to rapidly assimilate industrial technology have all converged.” Even among the OECD nations, time-series anal-ysis does not support convergence; rather, it appears “there is a set of common long-run fac-tors which jointly determines international output growth among these OECD economies” (Bernard and Durlauf, 1995).
46 U.S. Competitiveness in Science and Technology
idly. Developed nations must rely mostly on recent innovations made at home or abroad (a much smaller pool of new technology) to increase productivity, and thus are growing slower. Eaton and Kortum (2007) suggest that China’s rapid growth has resulted from absorbing foreign technology rather than from domestic innovation.
Figure 2.11 shows GDP per capita at PPP for the years 1985–2005 on a logarithmic scale in GDP per capita, such that the slope of the line represents the growth rate. The United States has the highest GDP per capita, followed by Japan and Europe. The geographic regions with the highest GDP per capita tend to grow relatively slowly at 2–3 percent per year, while some of the developing countries, such as China, Korea, and India grow at much higher rates. The rest of the world has the lowest growth rate, suggesting that the gap between rich and poorer nations has widened for most of the world. Russia suffered from the collapse of the Soviet Union but is catching up.
The rise of R&D and innovation activity in other nations sug-gests that the pool of technology created outside the United States may be growing more rapidly than in the past, and given U.S. capability to utilize new technology, the United States is likely to benefit from this technology. This is true regardless of the fact that most goods and ser-vices consumed in the United States are produced in the United States; approximately 90 percent of gross national product is domestic. Tech-nology does not depend on trade to be transmitted from one country to another. In addition, the United States can continue to rely on its own inventive activity (we discuss below whether globalization impacts the United States’ ability to invent and innovate).
There is no reason to believe that the globalization of S&T and the rise of other nations affects the capability of the United States to absorb and apply new technology directly, as this capability is to a large extent determined by business incentives, consumers’ willingness to try new technologies, and the legal and regulatory framework. Some technology applications may not require much S&T capacity, or much knowledge of S&T within the user community or the general public. For example, solar collectors or filters for water purification can sig-nificantly enhance the productivity of workers in a developing coun-try without the need for workers to understand their workings. But

The Implications of Globalization and the Rise of Other Nations in S&T 47
many technology applications do require S&T capacity (Silberglitt et al., 2006a, 2006b). Rural wireless communications requires little S&T capacity. Radio frequency identification (RFID) tagging, on the other hand, requires some basic knowledge and some industrial sophistica-tion. And, ubiquitous information access, pervasive sensors, and wear-able computers require substantial infrastructure and a high degree of sophistication. An advanced S&T capacity enables developed countries to implement a wide range of new technology, and, by the same token, the absence of such capacity helps to explain why developing nations may be slower to implement certain technology. Further, improvements in developing countries’ capacity to absorb technology will not under-cut U.S. capacity to absorb technology. But some production may shift to these countries if they can produce more cheaply with their newly adopted technology than other countries, and the freed-up resources in the other countries will need to be reallocated to other uses.
Figure 2.11Per Capita Gross Domestic Product at PPP
SOURCE: Eaton and Kortum (2007). Used with permission.RAND MG674-2.11
1985 1987 20052003200119991997
Year
1995199319911989
$ p
er p
erso
n a
t PP
P
10,000
100,000
1,000
United StatesEuropeChina/Hong KongJapan
KoreaRussiaIndiaRest of world
48 U.S. Competitiveness in Science and Technology
Thus, U.S. economic growth and standard of living are likely to continue to improve, with more foreign countries reaching higher levels of prosperity than they have at present, and the U.S. economy is likely to account for a smaller share of gross world product as developing nations grow faster than the United States. Although the United States will have a smaller share of world economic output, this will likely reflect the rise of other countries rather than the decline of the U.S. economy, standard of living, and S&T capability. As the size of the pie increases, the United States may benefit from increases in the amount of technology at hand resulting from inventions made abroad.
We next consider the possibility that U.S. economic growth might slow and its S&T leadership might erode because technology devised in the United States diffuses more rapidly to other countries includ-ing developing countries. Our discussion draws on recent, contrasting work by Eaton and Kortum (2006) and Freeman (2006, 2007).
Invention and Innovation: While nations may increase produc-tivity and standard of living through usage of technology invented abroad, countries receive royalties on usage abroad of inventions they make, piracy aside, while they pay royalties on usage of inventions made abroad. Further, nations compete with one another on the basis of comparative advantage,14 and international leadership in science and technology gives the United States its comparative advantage in the
14 The concept of comparative advantage, first formalized by David Ricardo in 1817 in his book On the Principles of Political Economy and Taxation, is not immediately intuitive. It explains that, even though one country may have an absolute advantage in producing goods (e.g., the country can both produce more wine and more cloth per laborer, as in Ricardo’s original example) compared with another country, both countries will still trade as they both gain from trade (i.e., both countries end up with more wine and more cloth in a situation with trade than without trade). To understand this counterintuitive outcome, one has to look at the opportunity cost. The opportunity cost of cloth production is defined as the amount of wine that must be given up in order to produce one more unit of cloth. Thus, the less produc-tive nation would have the comparative advantage in cloth production if it must give up less wine to produce another unit of cloth than the amount of wine the more productive nation would have to give up to produce another unit of cloth. According to the theory, countries will always have a comparative advantage in some good or service relative to some other country (except for the theoretical case where neither country has a comparative advantage relative to one another, i.e., where factor availability, factor cost, and production technology are identical in the countries).
The Implications of Globalization and the Rise of Other Nations in S&T 49
global economy. Loss of comparative advantage could hurt the United States, as it may have to reallocate resources, reduce wages, and forgo market-leader rents from new products or innovations.
So, what might be the consequences of globalization of S&T and the rise of other nations on the United States’ innovation activity (which we broadly equate with strong performance in S&T)? Eaton and Kortum (2006) explore innovation activity of nations using a two-country (North and South) Ricardian model of innovation, technol-ogy diffusion, and trade, with each country having two sectors, one producing R&D and the other producing a tradable good (see Box 2.1). The model is solved for the equilibrium in trade, R&D, and rela-tive wage, and the results suggest some surprising implications of the greater diffusion of ideas and lower trade barriers associated with glo-balization: As long as trade barriers are not too high, faster diffusion shifts research activity toward the country that does it better (currently this still is the United States in many areas of research, as Section 2.1 suggests). This shift in research activity raises the relative wage there. It can even mean that, with more diffusion, the country better at research attains a larger share of technologies in its exclusive domain. In other words, globalization and significant innovation and R&D elsewhere may in fact increase foreign and domestic demand for U.S. R&D, rais-ing wages, creating employment, and increasing the pool of technology on which it earns royalties.
Freeman (2006, 2007), however, warns of a long period of adjust-ment for U.S. workers, as changes in the global job market for S&T workers are eroding U.S. dominance in S&T and diminishing its com-parative advantage in high-tech production. Freeman’s approach is not based on an equilibrium model but rather on reasoning about the con-sequences of current economic trends for the U.S. S&E labor market and U.S. leadership in S&T. Freeman argues that the U.S. share of the world’s science and engineering graduates is declining rapidly (see Sec-tion 2.1), the S&E workforce in the United States is becoming increas-ingly reliant on foreign-born talent (see Section 3.3), and the job market has worsened for young workers in S&T fields relative to many other high-level occupations (see Section 3.3 for a more detailed discussion of Freeman’s argument and for analysis of S&E labor data). Further,

50 U.S. Competitiveness in Science and Technology
Box 2.1: Summary of Findings from Eaton and Kortum’s (2007) Model of Innovation, Technology Diffusion, and Trade
In the model, technology diffusion is a process in which a country adopts a foreign technology and pays royalties to the inventor country. Innovation is endogenous and can take place in either country. Coun-tries may differ in research productivity, ideas can diffuse between countries resulting in technologies common to both countries, and trade barriers are modeled as a “cost of trade” (in order to transport a unit of a good, d ≥ 1 units need to be shipped from the source). The authors introduce endogenous inventive activity by first calculating the value of ideas in each country to determine the returns to innovation and subsequently modeling inventive activity as a function of the trade-off between the returns to innovation and the returns to production. The higher the return to innovation, the greater the amount of innova-tion activity. The model provides insight into the impact of globaliza-tion (increasing technology diffusion, lowering trade barriers) on inno-vative activity and wages. Because of the complexity of the solutions the authors limit the discussion to four cases:
No diffusion: When technology diffusion is ruled out by assumption, each country must use its own technologies (ideas) and all countries do the same amount of research relative to their labor force regardless of their size or research productivity.
Instantaneous diffusion: In this case, all technologies are common and innovation and production depend on the relative research pro-ductivity of workers in the North and the South. If workers in the North are more productive at research than workers in the South such that productivity differences exceed trade barriers, the South will find research not worthwhile and will run a trade surplus with the North to pay for the ideas from the North that it uses in production.
No trade: Under the assumption of no trade (due to high trade barri-ers) and time-lagged (finite) diffusion, the authors find two competing effects. On the one hand, diffusion allows added opportunities for earn-ing royalties abroad, which increases the incentive to do research. On the other hand, diffusion allows foreign ideas to compete with domestic
The Implications of Globalization and the Rise of Other Nations in S&T 51
Freeman points out, populous low-income countries such as China and India can compete with the United States in high tech by having many S&T workers, even though they are only a small fraction of the work-force, and by having a low wage advantage. Even if the developing country has somewhat lower quality scientists and engineers or lacks some research infrastructure resulting in less productive laboratories, it can still have a cost advantage in research and development because of the lower wages of scientists and engineers. Freeman reasons that this threatens to undo the “North-South” pattern of trade, in which advanced countries dominate high tech while developing countries specialize in less-skilled manufacturing. Loss of comparative advan-
Box 2.1—Continued
ones at home, reducing research incentives. Which effect dominates depends on the share of the labor force in research, the labor force growth rate, and the shape of the distribution of the cost of technolo-gies. Interestingly, for different sets of parameters the model may favor big countries versus small countries as well as the other way around. Large countries face less competition from foreign ideas, but have smaller foreign markets in which to earn royalties. The authors suggest that this may explain the fact that small countries (e.g., Finland) as well as large countries (e.g., the United States) can both be highly spe-cialized in research.
Costless trade: Without trade barriers, the authors find that for many parameters the South will end up doing no research at all. Focusing on outcomes for which both countries conduct research, the authors, interestingly, find that greater technology diffusion shifts research in the direction of greater research productivity (e.g., to the North) and increases relative wages (in the North). This is because of two compet-ing effects. First, while increased diffusion initially would reduce the amount of technology exclusively available to the North, it also raises the demand for Northern workers as researchers. More research by the North thereby mitigates the effect of diffusion. In fact, more diffusion can have the paradoxical effect of lowering the fraction of technologies available to the South as greater Northern research increases the pool of exclusively Northern technologies.

52 U.S. Competitiveness in Science and Technology
tage in the high-tech sector to a low wage competitor can substantially harm an advanced country, as it has to shift resources to less desirable sectors and the rents from new products or innovations shift from the advanced to the poorer country.
Freeman argues that several indicators suggest that this form of globalization threatens U.S. technological and economic leadership. First, major high-tech firms are locating new research and development facilities in China and India. Second, some forms of skilled work are being offshored, such as information technology jobs to India. Third, indices of technological prowess show a huge improvement in the tech-nological capability of China, in particular. Finally, data on production and exports of high-tech products show that the improved capability of China in high tech has begun to appear in production and sales in the global market. Freeman recommends that the United States develop new ways of monitoring and benefiting from scientific and technologi-cal advances in other countries.
Conclusion
High growth in R&D expenditures, triadic patents, and S&E employ-ment, combined with low unemployment of S&E workers, suggest that U.S. demand for scientists and engineers remains strong and does not support the notion that, as a result of outsourcing and offshoring, jobs are being lost at substantial rates. These U.S. developments occur at a time when R&D expenditures, S&E employment, and patents are also increasing in the EU-15, Japan, China, Korea, and many other nations/regions. Studies of offshoring of high-skill content work suggest that it does not result in job losses in the originating country but rather that the overall job pool is increasing. Offshoring used to be a tactical labor cost–saving exercise but is increasingly driven by the need to access scarce talent, and, as this occurs, offshore salaries can be expected to increase, reducing the cost advantage of offshoring. The more sophis-ticated or higher-skilled the function, the lower the impact that off-shoring has on employment in the originating country; substitutes for highly specialized, experienced S&E are not readily available at home

The Implications of Globalization and the Rise of Other Nations in S&T 53
or abroad. An implication of this is that policymakers have reason to facilitate the immigration of highly skilled labor. This will slow the increase in the wages of such labor, as we discuss further in the next chapter, and it will increase their supply and thereby help companies to capture gains from expanding the scale and scope of their R&D and advanced manufacturing activities in the United States.
The innovation model is changing as a result of globalization and, according to Segal (2004), today it is private, collaborative, and global. China and the European Union are two examples of regions with strong ambitions to use S&T to develop their economies. Like Japan and South Korea, China and India are developing centers of excellence in R&D.
Such new foreign R&D centers can accelerate innovation and increase the pool of new technology. As other countries increase their capability to innovate and conduct R&D, the global pool of tech-nology will increase, technology will diffuse, and countries that are capable of acquiring and implementing such technology will do so. Technology is a major determinant of productivity, and the increased diffusion of technology that accompanies globalization and increased trade can enable both developed and developing nations to increase productivity and hence economic growth relative to a world with less trade and diffusion. The increased global pool of technology can also help in addressing social issues that are global in scope, such as prevent-ing disease, improving health care, increasing the supply of food, and solving environmental problems.
As mentioned, a future in which significant innovation and R&D takes place elsewhere may benefit the United States if it has the capa-bility to acquire and implement technologies invented abroad. In addi-tion, significant innovation and R&D elsewhere may increase foreign and domestic demand for U.S. R&D if the United States keeps its comparative advantage in R&D. It is not clear that the United States would necessarily lose its innovation edge (which we broadly equate with strong performance in S&T) as a result of the globalization of R&D. Eaton and Kortum’s (2006) model of innovation, technology diffusion, and trade suggests that as long as trade barriers are not too high, faster diffusion shifts research activity toward the country that

54 U.S. Competitiveness in Science and Technology
does it better (i.e., the United States). This shift in research activity raises the relative wage there. It can even mean that, with more diffu-sion, the country better at research ends up with a larger share of tech-nologies in its exclusive domain. The potential gains from the diffusion of technology depend on the size and productivity of the technology sector. Eaton and Kortum’s (2006) model suggests that policies that promote innovation, facilitate the diffusion of technology, support pay-ment for intellectual property, and deter piracy of intellectual property are helpful.
But if U.S. leadership in science and technology weakens, the United States is at risk of losing its comparative advantage in R&D. The consequences of this will be felt in the R&D sector, with fewer discoveries and innovations, lower wages and employment, less cap-ital investment, and less income resulting from patent licenses, and will extend to the entire economy, with U.S. firms and workers losing their technology-driven edge in productivity and hence at risk of losing market share, employment, firm value, and worker wages. Freeman (2006, 2007) argues that populous low income countries such as China and India can compete with the United States in high tech by focusing in a specific area and by having many science and engineering workers, even though they are only a small fraction of their workforces.
In other words, there are competing effects of globalization. The faster creation and wider availability of technology may benefit the U.S. economy and standard of living, and the United States may con-tinue to be the premier provider of R&D if the United States keeps its comparative advantage in R&D. But the rise of R&D capability in populous low-income countries may threaten this comparative advan-tage in R&D in certain areas.

55
CHAPTER THREE
What Evidence Suggests That the United States Has Been Underinvesting in S&T?
“Americans are living off the economic and security benefits of the last three generations’ investment in science and education, but we are now consuming capital. Our systems of basic scientific research and education are in serious crisis.”
—U.S. Commission on National Security/21st Century (2001)
For decades, the United States has boasted the world’s leading system of science and technology. The domestic building blocks that formed the bedrock of this system were sturdy and stable. Now, however, experts are worried that they are slowly, but steadily, crumbling. “[T]he com-mittee is deeply concerned that the scientific and technological building blocks critical to our economic leadership are eroding at a time when many other nations are gathering strength,” reads the central finding of the National Academies of Sciences (2006) report. “The call is clear,” the President’s Council of Advisors on S&T declares, “we must protect and enhance the U.S. innovation ecosystem that has put our Nation in the global economic leadership position it currently enjoys. . . . Unless we take action to maintain our global advantages . . . we run the risk of losing our competitive advantage. . . . [T]his issue . . . is of the utmost importance and failure is not an option.” (President’s Council of Advi-sors on Science and Technology, 2004)
Reports that make this line of argument typically focus on one or more of three principal S&T1 building blocks: the research infrastruc-
1 We use the terms science and technology (S&T), science and engineering (S&E), and sci-ence and mathematics more or less interchangeably, for the following reasons. When referring to science prowess indicators, one commonly refers to science and technology indicators (Chapter Two), but when referring to people or the workforce (Section 3.3) it is common to

56 U.S. Competitiveness in Science and Technology
ture in the United States, K–12 education in science and math, and the science and engineering workforce. All of these blocks are inter reliant and equally important: “If any of the elements of our innovation eco-system is neglected . . . we risk undermining the whole” (President’s Council of Advisors on Science and Technology, 2004). Recommenda-tions almost invariably emphasize the pressing need to refortify these building blocks to prepare for the ever-intensifying competition in S&T in the decades to come. How is this best accomplished? The answer of many who perceive a “creeping crisis” (National Academy of Sciences, 2006) is substantial policy action and government investment.
We look at each of these building blocks in turn, asking whether it is, indeed, really eroding and if so, whether it is to such a degree that it might jeopardize America’s future performance in S&T. In the case of research infrastructure, we focus specifically on the issue of invest-ment in R&D and in K–12 education, on the performance of Ameri-ca’s students in science and math. We ask the following:
Is the United States investing enough in R&D to return to, or sustain, its leadership position in science and technology? Will the U.S. K–12 education system be able to generate the talent in science and math to meet the future demands of the global marketplace? Can America continue to meet the demand for well-trained, well-prepared S&E workers?
refer to scientists and engineers or the S&E workforce (rather than “scientists and technolo-gists”). Sometimes this workforce is referred to as the science, technology, engineering, and mathematics (STEM) workforce, but we use the briefer “S&E” abbreviation. Also, in K–12 education (Section 3.1), it is common to refer to science and mathematics (rather than to education in technology or engineering).

Has the United States Been Underinvesting in S&T? 57
3.1. Is the United States Investing Enough in R&D to Return to, or Sustain, Its Leadership Position in S&T?
One vital component of a strong research infrastructure is ample fund-ing. Those who foresee an S&T crisis warn that the total funding needed to maintain U.S. strength in S&T is falling into short supply. First, by some accounts, federal funding in general has waned. “Independent sci-entific research provides the foundation for innovation and future tech-nologies,” state Democratic policymakers in their Innovation Agenda legislation, “but U.S. federal funding for research and development has declined steadily over the last decade” (Office of Congresswoman Nancy Pelosi, 2005). This trend, voices claim, weakens America’s ability to compete in S&T: “If the United States does not invest significantly more in public research and development, it will be eclipsed by others” (U.S. Commission on National Security/21st Century, 2001).
On first glance, the private sector has seemingly picked up some of the slack. A report of the Task Force on the Future of American Inno-vation (2005) observes that “U.S. private sector investment in R&D now far exceeds federal investment in R&D, providing over 68 percent of all R&D.” But that change is not without considerable problems. “Private funding tends to cycle with business patterns and focus on short-term results” (Task Force on the Future of American Innovation, 2005), causing companies to favor development over basic research. Increasingly, notes Senator Joseph Lieberman, “R&D activities con-ducted in private industry largely consist of the development phase of innovation. For example, in 2000, 71 percent of the industrial R&D funds were used to develop products and services rather than conduct basic research” (Office of Senator Lieberman, 2004).
In this environment, arguments run, responsibility for basic research—often the wellspring of innovation—falls primarily to the government: “It is from investment in basic science . . . that the most valuable long-run dividends are realized. The government has a critical role to play in this regard” (U.S. Commission on National Security/21st Century, 2001). But here, according to those warning of a crisis, the federal government has fallen woefully short. Unveiling the Innova-tion Agenda, then Representative Nancy Pelosi admonished, “We are
58 U.S. Competitiveness in Science and Technology
allowing [our] commitment [to long-term research and development] to falter. Our federal support of basic research peaked in 1987, and has been flat or falling ever since” (Office of Congresswoman Nancy Pelosi, 2005).
Slowing or declining basic academic research spending would indeed be of significant concern, not only because of its direct contribu-tion to knowledge but also because of its influence on industry R&D. James Adams (2002) finds that R&D spillovers are partly determined by firms (actively through the firm’s decision to allocate resources to learning about new technologies) rather than solely by the structure of the economic environment (which is beyond a firm’s control). Just as firms decide how much to spend on advertising, or how and where to invest, firms also decide how much to learn from external R&D, i.e., firms affect how much knowledge spills over to their business.2 Adams tests his model3 with data based on a survey of R&D man-agers of 600 industrial R&D laboratories (response rate 37 percent), for which R&D expenditures, sales, and patent information is avail-able. He finds that even though industrial R&D is much larger than academic research expenditures, academic spillovers increase the R&D performed by industry significantly and have a comparable effect on patents. Academic research does seem to have a potent influence on the rate of innovation and the amount of learning carried out by the firm.
Certain scientific disciplines have allegedly been hit harder than others: “In the United States, since 1970, funding for basic research in the physical sciences has declined by half (from 0.093 percent to 0.046 percent) as a percentage of the gross domestic product (GDP),”
2 The full effect of academic and industrial spillovers on the research productivity of firms, he argues, exceeds that of the structural effect (spillovers being exogenously determined only), as it includes the firm’s “active learning” response (i.e., learning about others’ research).3 Adams’s (2002) analytical framework separates a firm laboratory’s total R&D into three components: expenditures on learning from academia, learning from industry, and inter-nal research. He then provides a simple relationship between the output of research—the number of innovations—and its various inputs: expenditures on learning from academia, industry and internal research, exogenous spillovers from academia and from industry, and the firm’s stock of knowledge. In his model, learning expenditures transmit the effect of spill-overs by amplifying the exogenous effect with an endogenous component due to the firm’s learning effort.

Has the United States Been Underinvesting in S&T? 59
states a Business Roundtable report (2005). Basic research in math-ematics and engineering has also been hurt. Critics maintain that this has generally changed the federal funding atmosphere for the worse: “Many believe that federal funding agencies—perhaps influenced by the stagnation of funding levels in the physical sciences, mathematics, and engineering—have become increasingly risk-averse and focused on short-term results” (National Academy of Sciences, 2006).
To gain insight into the validity of these contentions, we examine U.S. R&D expenditures, comparing them with historical and interna-tional trends. Specifically, we investigate the following:
Are total R&D expenditures growing more slowly than in the past?Are R&D expenditures on basic research—both federally and privately funded—in decline?Has federally funded research in general decreased?Has funding for academic research slowed?Has federal funding for research in the physical sciences, math-ematics, and engineering declined?
R&D Expenditures: U.S. R&D expenditures have continued to increase rapidly in real terms, with expenditures on basic research show-ing the greatest increase (Table 3.1). Although federally funded R&D grew by less than $20 billion from 1984 to 2004 (in constant 2000 dollars), from $69 billion to $86 billion, nonfederal R&D increased by $120 billion, from $82 billion to $202 billion. And, basic R&D grew from $20 billion to $54 billion. That is, both nonfederal R&D and basic R&D increased by 150 percent. However, Duga, Grueber, and Studt (2007) note that it is somewhat of a distortion to combine indus-trial support of basic research with that of other sources: Industrial basic research is not the type of activity that pursues the expansion of knowledge and that has as its objective the understanding of phenom-ena just for the satisfaction of understanding. It is perhaps better termed “directed basic research,” i.e., aligned with existing or planned applica-tions and product lines (we will discuss federally funded basic research and research performed by colleges and universities in detail below).
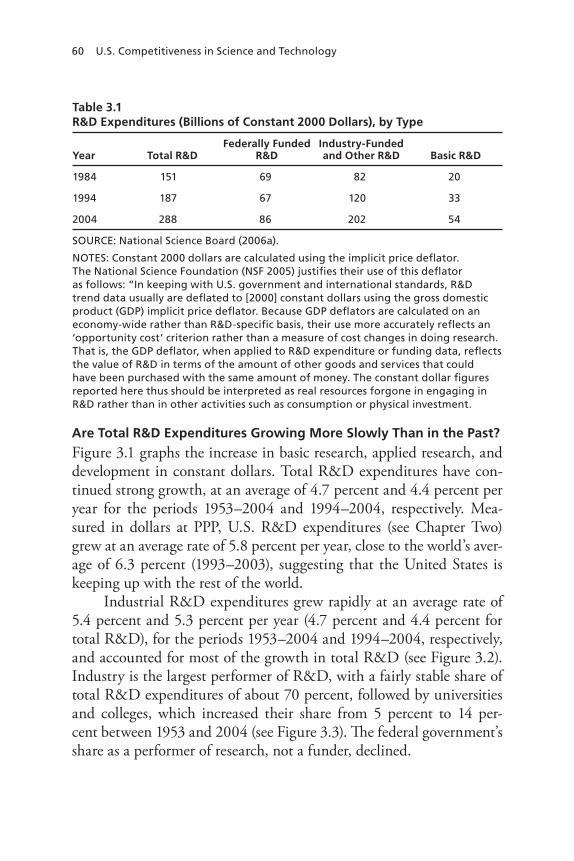
60 U.S. Competitiveness in Science and Technology
Are Total R&D Expenditures Growing More Slowly Than in the Past?
Figure 3.1 graphs the increase in basic research, applied research, and development in constant dollars. Total R&D expenditures have con-tinued strong growth, at an average of 4.7 percent and 4.4 percent per year for the periods 1953–2004 and 1994–2004, respectively. Mea-sured in dollars at PPP, U.S. R&D expenditures (see Chapter Two) grew at an average rate of 5.8 percent per year, close to the world’s aver-age of 6.3 percent (1993–2003), suggesting that the United States is keeping up with the rest of the world.
Industrial R&D expenditures grew rapidly at an average rate of 5.4 percent and 5.3 percent per year (4.7 percent and 4.4 percent for total R&D), for the periods 1953–2004 and 1994–2004, respectively, and accounted for most of the growth in total R&D (see Figure 3.2). Industry is the largest performer of R&D, with a fairly stable share of total R&D expenditures of about 70 percent, followed by universities and colleges, which increased their share from 5 percent to 14 per-cent between 1953 and 2004 (see Figure 3.3). The federal government’s share as a performer of research, not a funder, declined.
Table 3.1R&D Expenditures (Billions of Constant 2000 Dollars), by Type
Year Total R&DFederally Funded
R&DIndustry-Funded and Other R&D Basic R&D
1984 151 69 82 20
1994 187 67 120 33
2004 288 86 202 54
SOURCE: National Science Board (2006a).
NOTES: Constant 2000 dollars are calculated using the implicit price deflator. The National Science Foundation (NSF 2005) justifies their use of this deflator as follows: “In keeping with U.S. government and international standards, R&D trend data usually are deflated to [2000] constant dollars using the gross domestic product (GDP) implicit price deflator. Because GDP deflators are calculated on an economy-wide rather than R&D-specific basis, their use more accurately reflects an ‘opportunity cost’ criterion rather than a measure of cost changes in doing research. That is, the GDP deflator, when applied to R&D expenditure or funding data, reflects the value of R&D in terms of the amount of other goods and services that could have been purchased with the same amount of money. The constant dollar figures reported here thus should be interpreted as real resources forgone in engaging in R&D rather than in other activities such as consumption or physical investment.

Has the United States Been Underinvesting in S&T? 61
Are R&D Expenditures on Basic Research—Both Federally and Privately Funded—in Decline?
Total expenditures on basic research show the greatest rate of increase, at an average of 6.2 percent and 5.1 percent per year (compared with 4.7 percent and 4.4 percent for total R&D) for the periods 1953–2004 and 1994–2004, respectively (see Figure 3.1). Federal spending on basic research (constant 2000 dollars) grew by 3.4 percent per annum for the period 1970–2003 and by 4.7 percent between 1993 and 2003 (see Figure 3.5). In other words, both federally and privately funded basic research have grown rapidly, with more rapid growth in federal spending on basic research this last decade.
Has Federally Funded Research in General Decreased?
Federal funding growth, on the other hand, slowed down in the 1960s and grew by only 3.5 percent and 2.5 percent for the periods 1953–2004 and 1994–2004, respectively (see Figure 3.2). Thus, the federal fund-
Figure 3.1Total U.S. R&D Expenditures (Constant 2000 Dollars, Billions), by Character of Work, 1953–2004
R&
D e
xpen
dit
ure
s ($
bill
ion
s)
SOURCE: National Science Board (2006a).RAND MG674-3.1
250
200
150
100
50
300
0
CAGR(percent)
1953–2004
1994–2004
(Total)
1998199319881983197819731968196319581953 2003
Year
4.7 4.4
6.2 5.1
4.3 4.2
4.5 4.3
DevelopmentApplied researchBasic research

62 U.S. Competitiveness in Science and Technology
ing growth rate was one-third lower in 1994–2004 than its average over the preceding three decades.
This slowing in the federal funding growth rate is commonly attributed to the end of the Cold War, when defense R&D outlays declined from $56 billion in 1988 to $46 billion in 2000 (in constant 2000 dollars). But in the 2000s, defense R&D outlays have surged (see Figure 3.4). Between 2001 and 2005 they grew from $48 billion to $70 billion, while federal nondefense R&D rose from $42 to $52 billion.4 At the same time, the fraction of the defense budget spent on
4 The source for Figures 3.4 and 3.6 is the American Academy for the Advancement of Science (AAAS), whereas the source for other figures on U.S. R&D funding is the National Science Foundation. The amounts and percentage growth rates in R&D sometimes differ between the AAAS and NSF-based figures, and the difference apparently derives from AAAS’s use of outlays (actual expenditures in a given year) and NSF’s use of appropriations (funding obligated in a given year, spendable in that year and future years).
Figure 3.2Total U.S. R&D Expenditures (Constant 2000 Dollars, Billions), by Funding Source, 1953–2004
R&
D e
xpen
dit
ure
s ($
bill
ion
s)
SOURCE: National Science Board (2006a).RAND MG674-3.2
250
200
150
100
50
300
0
CAGR(percent)
1953–2004
1994–2004
(Total)
1998199319881983197819731968196319581953 2003
Year
4.7 4.4
5.4 5.3
3.5 2.5
6.6 6.0OtherFederal governmentIndustry

Has the United States Been Underinvesting in S&T? 63
basic research has remained fairly constant, between 2.5 percent and 4.3 percent of total R&D obligations between 1970 and 2001.5
Has Funding for Academic Research Slowed?
Despite slow growth in federal funding of R&D, R&D at universities grew on average 6.6 percent and 5.1 percent per year for 1953–2004 and 1994–2004, respectively (see Figure 3.3).6 This high growth rate of academic research is significant not only because of its direct contribu-
5 NSF Science Resources Statistics (SRS) Survey of Federal Funds for Research and Development.6 Duga, Grueber, and Studt (2007) note that over 2005 and 2006, growth in academic R&D stalled and was nearly flat in inflation-adjusted terms. They attribute this to a drop in U.S. industrial funding support.
Figure 3.3Share of Total U.S. R&D Expenditures, by Performer, 1953–2004
Perc
ent
of
R&
D e
xpen
dit
ure
s
SOURCE: National Science Board (2006a).NOTES: FFRDCs = federally funded research and development centers. Growth rates (CAGR) based on constant 2000 dollars.RAND MG674-3.3
80
60
40
20
100
0
CAGR(percent)
1953–2004
1994–2004
(Total)
1998199319881983197819731968196319581953 2003
Year
4.7 4.4
6.0 6.6
6.6 5.1
5.7 2.6
2.8 2.44.7 4.5
Nonprofit organizationsFFRDCsUniversities and collegesFederal governmentIndustry
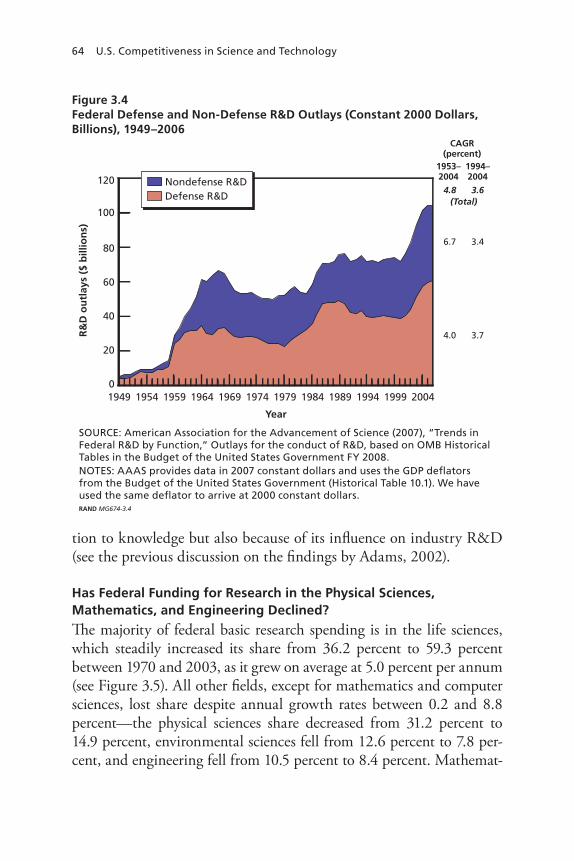
64 U.S. Competitiveness in Science and Technology
tion to knowledge but also because of its influence on industry R&D (see the previous discussion on the findings by Adams, 2002).
Has Federal Funding for Research in the Physical Sciences, Mathematics, and Engineering Declined?
The majority of federal basic research spending is in the life sciences, which steadily increased its share from 36.2 percent to 59.3 percent between 1970 and 2003, as it grew on average at 5.0 percent per annum (see Figure 3.5). All other fields, except for mathematics and computer sciences, lost share despite annual growth rates between 0.2 and 8.8 percent—the physical sciences share decreased from 31.2 percent to 14.9 percent, environmental sciences fell from 12.6 percent to 7.8 per-cent, and engineering fell from 10.5 percent to 8.4 percent. Mathemat-
Figure 3.4Federal Defense and Non-Defense R&D Outlays (Constant 2000 Dollars, Billions), 1949–2006
R&
D o
utl
ays
($ b
illio
ns)
100
80
60
40
20
120
0
CAGR(percent)
1953–2004
1994–2004
1994 1999198919841979197419691964195919541949 2004
Year
4.8 3.6
4.0 3.7
6.7 3.4
Nondefense R&DDefense R&D (Total)
SOURCE: American Association for the Advancement of Science (2007), “Trends inFederal R&D by Function,” Outlays for the conduct of R&D, based on OMB HistoricalTables in the Budget of the United States Government FY 2008.NOTES: AAAS provides data in 2007 constant dollars and uses the GDP deflatorsfrom the Budget of the United States Government (Historical Table 10.1). We haveused the same deflator to arrive at 2000 constant dollars. RAND MG674-3.4

Has the United States Been Underinvesting in S&T? 65
ics and computer sciences increased its share from 3.1 percent to 4.1 percent.
Basic research funding for the physical sciences was essentially flat, growing at 1.2 percent and 0.8 percent per year, respectively, for the periods 1970–2003 and 1993–2003. Over the same two periods, mathematics and computer sciences grew by 4.3 percent and 6.3 per-cent and engineering grew by 2.7 percent and 3.8 percent.
A similar picture emerges in funding by agency. Measured in 2000 dollars, federal outlays for basic and applied research (i.e., exclud-ing appropriations for development) have increased substantially in the past 15 years, growing from $26 billion in 1990, with about $9 bil-lion going to the National Institutes of Health (NIH), to $50 billion
Figure 3.5Federal Obligations (All Agencies) for Basic Research (Constant 2000 Dollars, Billions), by Field, 1970–2003
Fed
eral
ob
ligat
ion
s ($
bill
ion
s)
SOURCE: National Science Foundation, Division of Science Resources Statistics, FederalFunds for Research and Development: Fiscal Years 1970–2003; Federal Obligations forResearch by Agency and Detailed Field of Science and Engineering, NSF 04-335,Project Officer, Ronald L. Meeks (Arlington, Va., 2004).NOTE: 2002 and 2003 data are preliminary.RAND MG674-3.5
25
15
10
5
30
0
CAGR(percent)
1970–2003
1993–2003
(Total)
199519901985198019751970 2000
Year
3.4 4.7
4.3 5.3
1.2 0.8
1.9 0.7
5.0 7.2
1.7 1.9
2.7 3.90.2 2.68.8 2.5
20
Other sciencesSocial sciencesEngineeringMath and computer sciencesEnvironmental sciencesPhysical sciencesPsychologyLife sciences

66 U.S. Competitiveness in Science and Technology
in 2006, with nearly half going to NIH (see Figure 3.6). This large increase was actually attained by 2003, and the fact that appropria-tions for basic and applied research were flat from 2003 to 2006 may have fueled concern that the United States was allowing its leadership in science and technology to dwindle (despite the large increases from 1998 to 2003).
Discussion and Conclusion
A few years ago, looking only at federal expenditures on R&D might have left the impression that the United States was underinvesting in
Figure 3.6Federal Basic and Applied Research Outlays (Constant 2000 Dollars), 1990–2006
Res
earc
h o
utl
ays
($ b
illio
ns)
SOURCE: American Association for the Advancement of Science, AAAS Reports Ithrough XXXII (1976–2007), based on OMB and agency R&D budget data.NOTES: AAAS provides data in 2007 constant dollars and uses the GDP deflatorsfrom the Budget of the United States Government (Historical Table 10.1). We haveused the same deflator to arrive at 2000 constant dollars. RAND MG674-3.6
40
20
60
0
CAGR(percent)
1994–2004
19981996199419921990 2006
Year
(Total)5.3
4.4
9.4
1.73.3
1.9
2.31.7
50
30
10
200420022000
All otherUSDADoDNASADoENSFNIH

Has the United States Been Underinvesting in S&T? 67
R&D because of the end of the Cold War: Total federal R&D spending grew at 2.5 percent per year from 1994–2004, much lower than its long-term average of 3.5 percent per year from 1953–2004 (Figure 3.2).
Yet federal R&D accounted for only $86 billion of $288 bil-lion total U.S. R&D expenditures in 2004. Industrial R&D expen-ditures, the largest source of R&D, grew rapidly, at an average rate of 5.4 percent and 5.3 percent per year for the periods 1953–2004 and 1994–2004, respectively, and accounted for most of the growth in total R&D (4.7 percent and 4.4 percent for the periods 1953–2004 and 1994–2004, respectively). As a result, growth in total R&D was on par with the world’s average growth: Measured in dollars at PPP, U.S. R&D expenditures (see Chapter Two) grew at an average rate of 5.8 percent per annum, which compares with the world’s average of 6.3 percent (1993–2003).
Further, total basic research showed the greatest rate of increase, at an average of 6.2 percent and 5.1 percent per year (4.7 percent and 4.4 percent for total R&D) for the periods 1953–2004 and 1994–2004, respectively. And, federally funded basic research grew by 3.4 percent per year over the period 1970–2003 and 4.7 percent per year over the period 1993–2003. Despite slow growth in federal funding of R&D, universities and colleges managed to increase their R&D by on average 6.6 percent and 5.1 percent per year for 1953–2004 and 1994–2004, respectively. This is reassuring given the importance of basic and aca-demic research to innovation.
Most of the increase in federally funded basic research was in the life sciences, which grew by 5.0 percent and 7.2 percent per year, respectively, for the periods 1970–2003 and 1993–2003. Basic research funding for the physical sciences grew slowly, at 1.2 percent and 0.8 percent per year, mathematics and computer sciences grew by 4.3 per-cent and 6.3 percent and engineering grew by 2.7 percent and 3.8 per-cent over the same two periods. The differences in funding between the various science and engineering fields may reflect the importance and potential of these fields as perceived by policymakers and peer-review committees. Given the exploratory nature of basic research, the alloca-tion of basic research funds involves planning under uncertainty, and despite the astounding progress in the life sciences in the past 25 years,

68 U.S. Competitiveness in Science and Technology
one might wonder what discoveries would have been made in the phys-ical sciences if more funding had been allocated to them. Even though the allocations of federal basic research funds may have been done with the best of intentions and with reference to the latest research findings and opportunities in each area, the relatively low level of funding for the physical sciences raises the possibility that they are being under-funded. A study of the condition of and outlook for condensed-matter and materials physics (CMMP; National Research Council, 2007) finds that while the United States remains a leader in CMMP world-wide, its premier position is in jeopardy, as other parts of the world are investing heavily in CMMP and industrial involvement in CMMP has declined. Further, the large increase of R&D expenditures in the life sciences appears to have had the unintended consequence of producing an oversupply of life science PhDs (see Section 3.3), worsening young investigators’ career prospects in academia. Still, taken as a whole, total basic research and federally funded basic research have increased rap-idly in real terms (constant dollars), on average by between 3 percent and 6 percent per year for the last three decades.7
In short, if one followed federal R&D expenditures alone, there would have been reason to worry that the United States was under-investing in its future. But, the slow growth in federal spending and decline in defense R&D from the peak in the 1980s were mitigated by the strong growth in total R&D, total basic R&D, federally funded basic R&D, and universities’ and colleges’ R&D. Growth in total R&D was in line with that of the world’s average.
7 Support for the physical sciences and engineering may increase in the near future. The American Competitiveness Initiative (ACI), for example, promises a 10-year doubling (by 2016) of research in key federal agencies (e.g., the National Science Foundation, the Depart-ment of Energy, and the National Institute of Standards and Technology) that support basic research programs in the physical sciences and engineering.

Has the United States Been Underinvesting in S&T? 69
3.2. Will the U.S. K–12 Education System Be Able to Generate the Talent in Science and Math to Meet the Future Demands of the Global Marketplace?
The claim that K–12 education in science and math suffers from severe and growing short comings is one of the most recurrent and highly charged themes in the debate about a looming S&T crisis in the United States. “The Nation is now well into the 21st century and not since the Soviet Union’s launch of the Sputnik satellite—47 years ago—has the need to improve science and mathematics education in America been as clear and urgent as it is today,” declares a National Science Board (2006b) report. The reason driving this need, it is said, is two-fold: America’s “science and math education is slipping” (Ehlers, 2005), at the same time that the need for it is burgeoning:
Economists and other experts agree that education—especially in math and science—is a critical way for workers to stay competi-tive. . . . ‘The United States has a lot of catching up to do,’ said Jacob Kirkegaard, an economist at the Institute for International Economics. (Associated Press, 2006)
The National Science Board (2006b) report links education and national competitiveness even more starkly: “America’s competi-tive edge in this ‘flat [global] world,’ its strength and versatility, all depend on an education system capable of producing young people and productive citizens who are well prepared in science and math-ematics.” But John Morgridge, chairman of the board of Cisco Sys-tems, summed up the views of many when he testified before a House committee that “[u]nfortunately, America’s children are not receiving the necessary training in math and science to compete for high-paying technology jobs of the future” (Morgridge, 2005).
The “alarming domestic trends” (Business Roundtable, 2005, p. 1) that those who warn of an S&T crisis claim the United States is experiencing in education include a sizable underinvestment on the part of the federal government, a critical deficit of qualified science and math teachers, and progressively poor performance from K–12 stu-dents. Underinvestment is a common theme. Organizations that have

70 U.S. Competitiveness in Science and Technology
studied the education issue have pointed to “the shortage of resources going to math and science education. . . . Improving the nation’s math and science education will take more resources, and more well-spent resources” (Research and Policy Committee of the Committee for Economic Development, 2003). Warren Washington, chairman of the National Science Board, links underinvestment with what he deems a “widely recognized systemic failure,” whose “intractability . . . is alarming. . . . Our Nation must devote the necessary resources now to revitalize our pre-college STEM education system” (National Science Board, 2006b, cover letter).
With regard to teachers, the line of argument is that there are too few math and science teachers and that they are not as well prepared as they should be. In Maryland in 2005, there was apparently “a gap between qualified teachers lost and qualified teachers gained . . . in sci-ences like physics and chemistry,” as well as in math (Wedekind, 2006). Many reports offer accounts of the dwindling pool of teacher talent in math and science—because of, for example, higher earnings potential, more attractive compensation systems, and better working conditions in the private sector (Business Roundtable, 2005; President’s Council of Advisors on Science and Technology, 2004). The National Academy of Sciences (2006) report states: “[M]athematics and science teachers are, as a group, largely ill-prepared,” teaching out of field and without full certification.
The third allegation frequently made is that American students are not being well educated in these subjects so critical to future S&T leadership. “U.S. students exhibit alarmingly low science and math capabilities,” warns a report by the President’s Council of Advisors on Science and Technology (2004). National standardized tests are one piece of the evidence for this claim: “Most national measures of K–12 student achievement in math and science yield disappointing results” (Research and Policy Committee of the Committee for Economic Development, 2003). Scores on the National Assessment of Education Progress (NAEP) exams are commonly cited. In 2000, for example, “less than 1/3 of all U.S. students in grades 4, 8, and 12 performed at or above the proficient level in mathematics and science” (President’s Council of Advisors on Science and Technology, 2004).

Has the United States Been Underinvesting in S&T? 71
U.S. students are apparently underperforming by international standards as well. At a Capitol Hill briefing in 2006, panelists from the National Science Board “expressed concern that today’s K–12 students in science and mathematics are not improving their learning relative to international peers, boding a potential loss for the United States of its global prominence in discovery and innovation” (National Science Foundation, 2006). International standardized tests8 are the principal measure. Speaking at the briefing, board member Jo Anne Vasquez cautioned,
Our nation’s pre-college students still continue to slip further behind in science achievement, and are just near average in mathematics compared to international peers. And our very best 15-year-olds are near the bottom internationally on a test of prac-tical applications of science and mathematical skills. (National Science Foundation, 2006)
With “the problems of poor student performance . . . exacerbated by poor expectations and poor curriculum,” the President’s Council report concludes, “[c]learly, the U.S. has a critical issue with respect to K–12 math and science education” (President’s Council of Advisors on Sci-ence and Technology, 2004).
We first look briefly at the issue of federal investment, asking whether the United States is spending as much on education as other countries do. We then focus primarily on the question of whether American students are being well educated in science and math. To answer this question, we investigate more specifically:9
How does U.S. spending on education compare with other nations?
8 For example, the Program for International Student Assessment (PISA), the test to which the following quote refers, and the Trends in Mathematics and Science Study (TIMSS).9 For statistics and discussion on education issues that go beyond the scope of our report, we suggest the following sources: The Condition of Education 2006, National Center for Edu-cation Statistics (NCES; 2006); Digest of Education Statistics (NCES, annual); the NCES Web site (NCES, undated); U.S. Census Bureau Current Population Survey (U.S. Census Bureau, 2007).

72 U.S. Competitiveness in Science and Technology
How are K–12 students performing in science and math—both by national standards and relative to other nations?What is the past, present, and future education attainment of the U.S. population?
How Does U.S. Spending on Education Compare with Other Nations?
U.S. expenditures per student on elementary and secondary education (Figure 3.7) are higher than the industrialized OECD nations in the sample, except for Switzerland, but commensurate with the high U.S. per capita GDP (compared with the trend line). In postsecondary edu-cation, the United States spends nearly twice the industrialized OECD nations’ average per student and more than the OECD countries in the sample (well above the trend line), except again for Switzerland. But, are the higher expenditures reflected in superior student performance?
How Are K–12 Students Performing in Science and Math—Both by National Standards and Relative to Other Nations?
Oyer (2007) is concerned about the quality of education in general, not just that of education in S&E. Oyer stresses the importance of general macroeconomic health to keep the United States an attractive place to work for scientists (including foreign talent). He argues that if poor schools produce poorly skilled workers, the economy as a whole will suffer. Therefore, the nation should be concerned about the quality of education in general, not just education in science and engineering. Further, he argues, there are two reasons why, despite increased spend-ing on public schools, there is the perception of less value for money: (1) Salaries of college-educated employees have increased significantly and (2) so has the price of real estate. As a result, it costs much more now to provide education. But while costs have risen, there is less infor-mation to suggest that quality has risen; the additional outlays on edu-cation may have mainly gone to cover the higher costs.
Following Oyer’s suggestion, we broaden the scope of our dis-cussion to include the general level of education in the United States, rather than focusing only on science and mathematics. Also, discuss-ing the general level of education in other subjects than science and

Has the United States Been Underinvesting in S&T? 73
Figure 3.7Annual Expenditures per Student Relative to GDP per Capita for Elementary and Secondary (Top) and Postsecondary (Bottom) Education in Selected OECD Countries, 2002
SOURCE: NCES (2006, Table 43-1).NOTES: Per-student expenditures are based on public and private full-timeequivalent enrollment figures and on current expenditures and capital outlaysfrom both public and private sources where data are available. PPP indices areused to convert other currencies to U.S. dollars (i.e., absolute terms). Within-countryconsumer price indices are used to adjust the PPP indices to account for inflationbecause the fiscal year has a different starting date in different countries. Canada,Germany, Luxembourg, New Zealand, and Turkey are not included because ofmissing data on expenditures per student. The OECD average for GDP per capitafor each figure is based on the number of countries with data available. (NCES, 2006, notes to Table 43-1.)RAND MG674-3.7
0 5,000
GDP per capita
40,00035,00030,00025,00020,00015,00010,000
Korea Spain
France
United States
Norway
Switzerland
OECD mean
United Kingdom
MexicoHungary
KoreaSpain France
United States
Norway
Switzerland
OECD meanUnited Kingdom
Mexico
Hungary
Exp
end
itu
res
per
stu
den
t ($
)
8,000
6,000
4,000
2,000
12,000
0
10,000
0 5,000
GDP per capita
40,00035,00030,00025,00020,00015,00010,000
Exp
end
itu
res
per
stu
den
t ($
)
20,000
15,000
10,000
5,000
25,000
0

74 U.S. Competitiveness in Science and Technology
mathematics allows us to assess the relative performance of students in science and mathematics with respect to that in other fields.
Figure 3.8 and Figure 3.9 show average scale scores for ages 9, 13, and 17 in reading and mathematics. Both in reading and mathematics, scores appear to be fairly stable for the age-17 group and increasing for ages 9 and 13.
However, it is difficult to assess the quality of U.S. education in S&E based on simple statistics such as historical test results. Such mea-sures may be affected by grade inflation, changes in testing, etc. It is therefore of interest to compare U.S. student performance internation-ally. The U.S. participates in several international assessments, offering an opportunity to compare the performance of U.S. students with that of their peers in other countries. An overview of international assessments in which the United States participates, and a summary of U.S. relative performance, can be found in The Condition of Education 2006 (NCES, 2006). For convenience, we highlight some of the findings here.
Figure 3.8Reading Average Scale Scores Ages 9, 13, and 17 (1971–2004)
*Significantly different from 2004.
SOURCE: NCES (2004). NOTE: See NCES (2004) for further explanation of data.RAND MG674-3.8
19731971 1994 1997 200019851982
Year
19791976
208* 215*211* 212*
209*211* 211* 212 212*
219
210*
255*
258 257 257257260 258 258 259 259
256*
285 285289* 290* 290* 290 288* 288* 288* 285
286
Scal
e sc
ore 260
240
220
300
200
280
19911988 2003
Age 17Age 13Age 9

Has the United States Been Underinvesting in S&T? 75
U.S. students performed relatively well in reading literacy. The Progress in International Reading Literacy Study (PIRLS) and the Program for International Student Assessment (PISA) assess, respec-tively, fourth grade and 15-year-old reading literacy. U.S. fourth grad-ers had higher average literacy scores than the international average and than students in 23 of the 34 other participating countries in 2001. PISA 2000 results, however, show that the United States scored at the OECD average and that U.S. scores were not significantly different from those in most other industrialized nations. A larger number of developing countries participate in PIRLS than do in PISA, which nat-urally affects the comparison and may explain the apparent discrep-ancy between PIRLS and PISA results.
U.S. students compare relatively well in mathematics and science at the lower grades, but older students demonstrate less achievement than most of their peers in other industrialized nations. The Trends in International Mathematics and Science Study (TIMSS) assesses
Figure 3.9Mathematics Average Scale Scores Ages 9, 13, and 17 (1973–2004)
*Significantly different from 2004.
SOURCE: NCES (2004). NOTE: See NCES (2004) for further explanation of data.RAND MG674-3.9
1973 1994 1997 200019851982
Year
19791976
219* 219*222*
230* 230* 231* 231* 232*
241
219*
266* 269* 269* 270*273* 274* 274* 276*
281
264*
304298
302305 307 306 307 308 307
300
Scal
e sc
ore
260
240
220
320
200
300
280
19911988 2003
Age 17Age 13Age 9

76 U.S. Competitiveness in Science and Technology
fourth and eighth grade knowledge of and skills in mathematics and science, and PISA assesses that of 15-year-olds. Also, TIMSS contains a large number of developing countries, but limiting the comparison to OECD countries still indicates that U.S. students performed relatively well.10 However, the performance of U.S. 15-year-olds ranks 24th in mathematics literacy and 19th in science literacy out of 29 OECD countries. These statistics suggest that U.S. students are not as well prepared for careers in science and engineering. The relatively poor test performance of U.S. students has been a persistent aspect of the U.S. education system:
The first systematic cross-national assessment of mathemati-cal competencies was conducted in 1964 and included 13- and 17-year-olds from 12 industrialized nations. The results of this study indicated that American adolescents were among the most poorly educated mathematics students in the industrialized world. Of the 12 participating nations, the American 13-year-olds ranked 10th and 11th, across two comparisons. The assessment of the 17-year-olds was based on students who were enrolled in a math-intensive college preparatory high school curriculum, that is, each country’s best prepared students: The American 17-year-olds ranked last. (Geary and Hamson, 2007)
What Is the Past, Present, and Future Education Attainment of the U.S. Population?
The educational attainment of the U.S. population continues to increase. High school completion rates have increased from 83 percent in 1972 to 87 percent in 2004 (see Figure 3.10). While Blacks and His-panics continue to lag Whites, who had completion rates of 92 percent in 2004, both of the former two groups have made great improvements in high school completion rates: Black completion rates increased from
10 U.S. students ranked 6th out of 11 (fourth grade) and 8th out of 13 (eight grade) OECD countries in mathematics (TIMSS) and 3rd out of 11 (fourth grade) and 5th out of 13 (eighth grade) in science literacy.

Has the United States Been Underinvesting in S&T? 77
72 percent in 1972 to 83 percent in 2004, and Hispanic rates increased from 56 percent in 1972 to 70 percent in 2004.11
U.S. levels of high school attainment are considerably higher than the OECD average. The percentage of the U.S. population (ages 25–64) that has at least attained upper secondary education is 88 per-cent, compared with an OECD average of 67 percent, and the United States ranks 3rd (ages 25–64) and 11th (ages 25–34), respectively, out of 34 countries (30 OECD countries and 4 partner countries; OECD, 2006a, Table A1.2a).
11 Mishel and Roy (2006) discuss various issues associated with data sources and meth-odology in calculating high school completion rates. According to the authors, there are large discrepancies between the official estimates of high school graduation rates reported in Department of Education (ED) publications and unofficial estimates from various studies. The authors suggest, though, that ED statistics are reasonable when compared with state-of-the-art alternative methods.
Figure 3.10High School Completion Rate
SOURCE: Laird, DeBell, and Chapman (2006).NOTES: Status completion rates measure the percentage of 18- through 24-year-oldswho are not enrolled in high school and who also hold a high school diploma orequivalent credential such as a General Educational Development (GED) certificate.Those still enrolled in high school are excluded from the analysis.RAND MG674-3.10
1972 1993 1996 199919841981
Year
19781975
Perc
ent 60
30
20
10
100
0
90
80
70
50
40
19901987 2002
TotalWhiteBlackHispanic

78 U.S. Competitiveness in Science and Technology
The increased uptake of S&E-related courses by high school stu-dents between 1982 and 2000 seems promising (see Figure 3.11) and likely reflects the impact of stricter high school graduation requirements by an increasing number of states in mathematics and science (National Science Board, 2006a) and, possibly, stricter requirements for college enrollment. This will not necessarily translate into more students choos-ing mathematics and science majors in college, although it should tend to increase the mathematics and science literacy of the students.
An increasing percentage of those that complete high school con-tinue their education. Figure 3.12 (left-hand side) shows the total col-lege enrollment rate—the percentage of high school graduates,12 ages 16–24, enrolling in college the year following high school graduation. The college enrollment rate grew from about 49 percent in 1972 to around 67 percent in 2004, indicating that the accessibility of and the value placed on college education continues to increase.
Figure 3.12 (right-hand side) shows the college enrollment by eth-nicity. Whites show higher rates of college enrollment than Blacks and Hispanics. Whites and Blacks have seen steady increases of the enroll-ment rate, while the Hispanic rate has remained flat or appears to be modestly increasing with time. Note that the Hispanic rate is more erratic, due in part to the small sample size.
Rapid growth of the Hispanic population has raised concerns about the impact of these demographic changes on the average educa-tion attainment of the U.S. workforce, given the relatively lower level of high school completion and college enrollment of Hispanics (Tienda and Mitchell, 2006; Chapa and Valencia, 1993; Chapa and De La Rosa 2004; Suro and Passel, 2003). According to the U.S. Census, the esti-mated Hispanic population of the United States as of July 1, 2005, was 42.7 million, or 14 percent of the nation’s total population, making people of Hispanic origin the nation’s largest ethnic or race minor-ity. The Hispanic population is the fastest-growing ethnic group in the United States. It grew by 3.3 percent between July 1, 2004, and
12 The percentage of high school completers are defined as those who completed 12 years of school for Current Population Survey years 1972–1991 and those who earned a high school diploma or equivalent (e.g., GED certificate) for years since 1992.

Has the United States Been Underinvesting in S&T? 79
Figure 3.11Percentage of Public High School Students Taking Selected Courses in Mathematics and Science
SOURCE: NCES (2002). NOTES: These data only report the percentage of students who earned credit in eachmathematics course while in high school and do not count those students who tookthese courses prior to entering high school. The tabulations exclude pre-algebraand include algebra/trigonometry and algebra/geometry. RAND MG674-3.11
Biolo
gy
AP/honors
biolo
gy
Chemist
ry
Astronom
y
Engin
eerin
g
AP/honors
physics
Phys
ics
AP/honors
chem
istry
Geolo
gy/ear
th
scien
ce
Perc
ent
40
20
100
0
80
60
19822000
19822000
Algeb
ra I
Algeb
ra II
Geom
etry
AP calc
ulus
Calculu
s
Stat
istics
/
probab
ility
Analysis
/
pre-ca
lculu
s
Trig
onomet
ry
Perc
ent
40
20
100
0
80
60

80 U.S. Competitiveness in Science and Technology
July 1, 2005, and is projected to reach 102.6 million as of July 1, 2050. According to this projection, Hispanics will constitute 24 percent of the nation’s total population on that date.
While the previous discussion suggests that the educational attain-ment of the U.S. population continues to improve, it ignores important demographic information. The United States added 20 million college-degree workers to the labor force, and the college-educated workforce more than doubled between 1980 and 2000 (Heckman, 2006; DeLong et al., 2003; Ellwood, 2001). This was the result of significantly more-educated younger cohorts entering the workforce (the fraction of the population with a college or higher degree increased from 22 percent to 30 percent of the workforce between 1980 and 2000) and high growth of the overall labor force (up by 35 percent between 1980 and 2000) and the prime-age workforce (ages 25–54, up by 54 percent) because of (1) the baby boom, (2) prime–age women entering the labor force
Figure 3.12College Enrollment Rate Total and by Ethnicity, 1972–2004
SOURCE: NCES (2006, Table 29-1). NOTE: Includes those ages 16–24 completing high school in a given year. Dotted lines represent trends. RAND MG674-3.12
1972 2002
Year
19841978
Perc
ent
30
20
10
80
0
70
40
60
50
WhiteBlackHispanic
1990
Total
1996 1972 2002
Year
19841978 1990 1996

Has the United States Been Underinvesting in S&T? 81
(participation rates grew from 0.65 to nearly 0.80, but flattened during the 1990s), and (3) immigration.
But high growth of the college-educated workforce is unlikely to be sustained—only 8 million additions to this workforce are antic-ipated between 2000 and 2020 (Ellwood, 2001). Baby boomers are beginning to retire, and the demographics are such that the labor force will add few prime age workers between 2000 and 2020.13 Further, female labor force participation rates are already high (about 0.80) and are flattening, educational attainment stagnated during the 1970s and 1980s and new cohorts take considerable time to age through, and the fraction of the population with a college or higher degree is fore-cast to increase only marginally, to between 31 and 35 percent of the workforce.
However, the United States is not the only region with an aging population, and in fact other regions appear to be worse off in this respect. The college-age population decreased in Europe, the United States, China, and Japan in the 1990s and is projected to continue to decrease in Europe, Japan, and China, while that of the United States is anticipated to grow modestly. By 2025 the population ages 18–23 (a proxy for the college-age population) of the United States is forecast to increase by 5 percent (compared with 2005; National Science Board, 2006a). Western Europe, China, and Japan, on the other hand, will see decreases by 8 percent, 14 percent, and 16 percent, respectively. India’s college-aged population is expected to increase by 11 percent. By 2050, the college-age population of the United States is forecast to increase by 13 percent (compared with 2005), while Western Europe, China, Japan, and India will see decreases by 13 percent, 30 percent, 30 percent, and 3 percent, respectively. These decreases in the college-age population, the National Science Board report (2006a) notes, may be an incentive for countries to encourage immigration of students from other countries or to increase enrollment proportions of their own college-age population (immigration of highly skilled workers, such as those in the S&E labor force, is discussed in Section 3.3). If the
13 Prime-age workers adding 3 million compared with 35 million during 1980–2000; older workers (ages 55+) adding 16.5 million compared with 3.6 million during 1980–2000.

82 U.S. Competitiveness in Science and Technology
demand for high-skill, high-education workers continues to increase in the United States (as it apparently has, as witnessed by the increased wage of college graduates and the still greater wage increase of work-ers with an advanced degree even though the supply of these workers increased), the forecast of a slower increase in the supply of college-educated workers will fuel upward pressure on their wages. This will provide a greater incentive for young students to obtain higher educa-tion and for countries and corporations to increase the immigration of college-educated workers, including S&E workers.
Discussion and Conclusion
U.S. expenditures per student on elementary and secondary educa-tion appear to be commensurate with the high U.S. per capita GDP (compared with the trend line). Also, in postsecondary education, the United States spends nearly twice the industrialized OECD nations’ average.
U.S. students performed relatively well in reading literacy. In international comparisons, U.S. students do fairly well in mathemat-ics and science at the lower grades, but older students demonstrate less ability than most of their peers in other industrialized nations.14 Many experts, policymakers, and decisionmakers appear to be concerned with the low student achievement in mathematics and science of older students. More students are taking mathematics and science classes than in the past, but still few students take advanced classes.
U.S. high school completion and college enrollment rates have continued to increase. And, a country comparison of upper second-ary education attainment levels places the United States in the upper quartile of OECD industrialized nations (88 percent of the age 25–64 U.S. population compared with an average of 67 percent). Rapid growth
14 The President has put forward proposals to increase the numbers and skills of S&T teach-ers and the support for students entering S&E fields. If successful, these steps may increase the number of well-qualified students in the S&E pipeline, and they join other measures intended to improve U.S. education at large, such as the more far-reaching No Child Left Behind legislation.

Has the United States Been Underinvesting in S&T? 83
in the Hispanic population has raised concerns about future educa-tion levels of the U.S. population. Blacks and Hispanics, though con-tinuing to lag Whites, have made large improvements in high school completion rates. College enrollment rates increased for Whites and Blacks, but did not increase or only marginally increased for Hispanics. Whether such demographic changes will negatively affect the educa-tion level of the U.S. population or whether Hispanics will catch up with the rest of the population is unclear.
Trends in the United States and abroad suggest that global com-petition for college-educated workers will intensify in the future. Past research shows that the United States added 20 million college-degree workers to the labor force, and the college-educated workforce more than doubled between 1980 and 2000. But high growth of the college-educated workforce is unlikely to be sustained, and only 8 million additions to this workforce are anticipated between 2000 and 2020. Baby boomers are beginning to retire, and the demographics are such that few prime-age workers will join the labor force between 2000 and 2020. Other countries will also need to adjust to the demographics resulting from lower birth rates and an aging population. The college-age population is projected to continue to decrease in Europe, Japan, and China, while that of the United States is anticipated to grow mod-estly. These decreases in the college-age population may be an incentive for countries to encourage immigration of students from other coun-tries or to increase enrollment rates of their own college-age population. Immigration can be encouraged by a more open immigration policy and by the manifest presence of good job opportunities and high wages relative to the sending country. College enrollment can be encouraged by an increase in student financial aid and by market adjustment: The growth in demand for college educated workers relative to their supply will increase their salaries, which will act as an inducement for young students to obtain a college degree. However, it is not clear whether salaries will increase any faster for college-educated S&E workers than for other college-educated workers, and in fact a more open immigra-tion policy for S&E could slow S&E salary growth.

84 U.S. Competitiveness in Science and Technology
3.3. Can America Continue to Meet the Demand for Well-Trained, Well-Prepared S&E Workers?
America’s S&E workforce plays a key role in enabling the country to be successful in S&T. Among those warning of an imminent S&T crisis, there is broad consensus that this has never been truer than today:
Our economy’s ability to compete in the 21st century will not be influenced by past performance. Success or failure will be determined primarily by our capacity to invent and innovate. . . . Tomorrow’s jobs will go to those with education in science, engineering and mathematics and to high-skill technical workers. (National Association of Manufacturers, 2005)
The global environment and unprecedented technological prog-ress are claimed to be dramatically raising the bar on performance. “Civilization is on the brink of a new industrial order. The big win-ners in the increasingly fierce scramble for supremacy . . . will be those who develop talent, techniques and tools so advanced that there is no competition. That means securing unquestioned superiority in nano-technology, biotechnology, and information science and engineering” (Bordogna, 2004).
According to the National Academies of Sciences (2006) report, “[n]ew generations of US scientists and engineers” could take the lead in making this possible as long as they “remain among the best edu-cated, hardest-working, best trained, and most productive in the world. . . . [That] is the challenge.” By many accounts, the nation’s strength in this area is at serious risk: “Unfortunately, there are troubling signs that the American workforce is not ready to meet innovation’s chal-lenge, and our position as leader of the global economy is threatened” (National Association of Manufacturers, 2005).
According to those who hold this point of view, the problems are manifold. One concern is that Americans are finding S&E careers increasingly unattractive as shown by the “declining interest of stu-dents in STEM careers as they progress to the entry level in college and beyond” (President’s Council of Advisors on Science and Technology, 2004). The reasons for this waning interest are in part cultural. Some

Has the United States Been Underinvesting in S&T? 85
feel that the importance of S&T is too little recognized by the general public (Peters, 2006) or that science and mathematics suffer from a negative popular culture that dampens interest (National Academy of Sciences, 2006). Other reasons are very practical. Salaries for S&E jobs may be too low, professionals in these fields must devote years to earn-ing graduate degrees and completing postdoctoral training before they can take their first position, and some state that the job market in these fields is historically volatile (President’s Council of Advisors on Science and Technology, 2004). Scientists and engineers earn less than law and medical school graduates and have seen smaller salary increases (Freeman, 2006, 2007). In addition, comparing salaries understates the lower income associated with the S&E PhD trajectory as doctoral graduate students spend many years earning their PhD and often must do postdoctoral work during which they receive little income, resulting in huge differences in lifetime earnings when compared with doctors and lawyers (e.g., Freeman, 2006, 2007, Teitelbaum, 2007).
Second, it is argued that there is a shortage of qualified Ameri-can scientists and engineers to fill the growing numbers of jobs. One can see this, proponents contend, in higher education, where too few American students are moving through the S&E pipeline:
If STEM employment does grow as expected, can US univer-sities produce enough skilled graduates to meet the demand? Many fear the answer is no: From 1994 through 2003, reports the Government Accountability Office, the number of STEM degrees earned failed to keep pace—by 22 percent—with the national average increase in all degrees earned, a possible early indicator of future STEM labor shortages. . . . Other reports concur. (Andres, 2006)
The Pentagon risks running out of scientists to operate and upgrade the nation’s arsenal of intercontinental nuclear and conventional missiles, according to a report released this week by the Defense Science Board. . . . Not only are fewer American engineers and scientists choosing to work on missile technology, there are fewer of them altogether. Each year, about 70,000 Americans receive undergraduate and graduate science and engineering degrees that

86 U.S. Competitiveness in Science and Technology
are defense related, compared with a combined 200,000 in China and India, the report says. (Kelley, 2006)
However, Freeman (2006, 2007), Teitelbaum (2003, 2007), and Butz et al. (2004)15 argue that there has been scant evidence to support claims of shortages of scientists and engineers in the United States. Even though the job market worsened for U.S. citizens in S&E fields relative to other high-level occupations, and while this may have discouraged U.S. students from entering S&E fields, the employment conditions are still attractive to the large flow of S&E immigrants.
Teitelbaum (2003, 2007) believes that claims of shortages are being made for two reasons: (1) It is difficult to project even the near-future labor market for scientists and engineers, and past projections have typically asserted that demand will grow faster than supply, result-ing in a shortage, and (2) assertions of shortages usually come from groups with vested interests in creating an oversupply of scientists and engineers. This would hold down the labor costs of firms that rely heav-ily on S&E, but from a societal perspective would not provide the best allocation of talent across fields, S&E and non-S&E alike. Teitelbaum observes that claims of shortages are attractive strategems because they have proven to be effective in gaining support from politicians and corporate leaders.
The lack of American scientists and engineers leads to a third commonly cited concern—that to compensate for this lack, the United States looks to foreign scientists and students (Progressive Policy Insti-tute, 2006). Freeman (2006, 2007) argues that, although the market is unattractive to U.S. citizens, it is attractive to foreigners because (1) they have lower opportunity cost from other specialties than Amer-icans do and (2) the United States offers higher incomes and has higher dispersion in earnings compared to other high-income countries. The higher dispersion implies greater potential for reaching higher levels of income than attainable abroad. This makes the United States rely increasingly—and arguably excessively—on foreign S&E talent to fill the demand for workers in technical and scientific fields:
15 Butz et al. (2004) also find no evidence of shortages of federal S&E personnel.

Has the United States Been Underinvesting in S&T? 87
Today . . . as the U.S. economy becomes ever more reliant on workers with greater knowledge and technological expertise. . . . American industry has become increasingly dependent—some would say overly dependent—on foreign nationals to fill the demand for talent in a variety of fields that require strong back-grounds in science, technology, engineering, and mathematics. (Business Roundtable, 2005)
Immigration is not a solution to the problem of long-term short-ages of skilled workers in the American economy; there is no sub-stitute for an indigenous supply of scientists and engineers in a competitive economy. (Research and Policy Committee of the Committee on Economic Development, 2003)
We cannot and should not rely so heavily on foreign talent to fill critical positions in teaching, research and industry. (Business Roundtable, 2005)
A common fear is that such dependence creates vulnerabilities in the S&E workforce that threaten its long-term strength and stability. For example, whereas in the past, “[t]he United States used to be the first and last stop for the world’s finest talent, in areas ranging from electronics to medicine to chemistry to physics,” foreign workers in STEM fields are now increasingly returning home or choosing other countries over the United States as the destination of choice (Newman, 2006). Driving this trend is a combination of the growing ability of other countries to offer exciting incentives and opportunities and the post-9/11 policy environment of tighter visa restrictions and security procedures. But the American S&E labor market cannot bear this exodus: “U.S. corporations and universities must have access to needed talent today in the face of growing international competition. The pro-grams of study and work that currently exist at universities, corpora-tions, and research centers could not easily weather a sudden decline in the number of new [foreign] workers . . . on whom they depend” (Paral and Johnson, 2004). Another concern is that the prevalence of foreign-born S&E workers in the U.S. workforce may suppress wages, further

88 U.S. Competitiveness in Science and Technology
reducing the appeal of S&E careers to American citizens (e.g., Freeman 2006, 2007, and our discussion above).
We structure our inquiry into whether the S&E workforce is ill-prepared to meet the challenges of intensifying global competition in S&T by asking:
Have S&E careers become increasingly unattractive to U.S. citizens? Is there a shortage of qualified scientists and engineers? Is the United States becoming increasingly reliant on foreign S&E professionals?
If so, does that degree of reliance put the U.S. S&E workforce—and by extension the nation’s S&T enterprise—in a weak position? On this last question of possible vulnerabilities, we consider three issues:
Are foreign scientists and engineers working in the United States increasingly returning home? Do foreign professionals working in the United States appear to be as productive as native S&E professionals?Do foreign professionals working in the United States reduce wages for S&E jobs?
Have S&E Careers Become Increasingly Unattractive to U.S. Citizens?
To investigate the conditions of the S&E labor market, we conducted an analysis of Current Population Survey data on wages of the S&E workforce. Our sample consisted of full-year, full-time workers (S&E and non-S&E) who report annual earnings of $10,000 or more and have obtained at least a bachelor’s degree (see the appendix for more details).
The median salaries in S&E occupations are by and large higher than in non-S&E occupations at the bachelor’s and master’s level and the same at the doctoral level (Figure 3.13). Salary differentials between levels of education vary in S&E depending on the occupation, i.e., the rewards for continuing one’s education differ. This is particularly so in
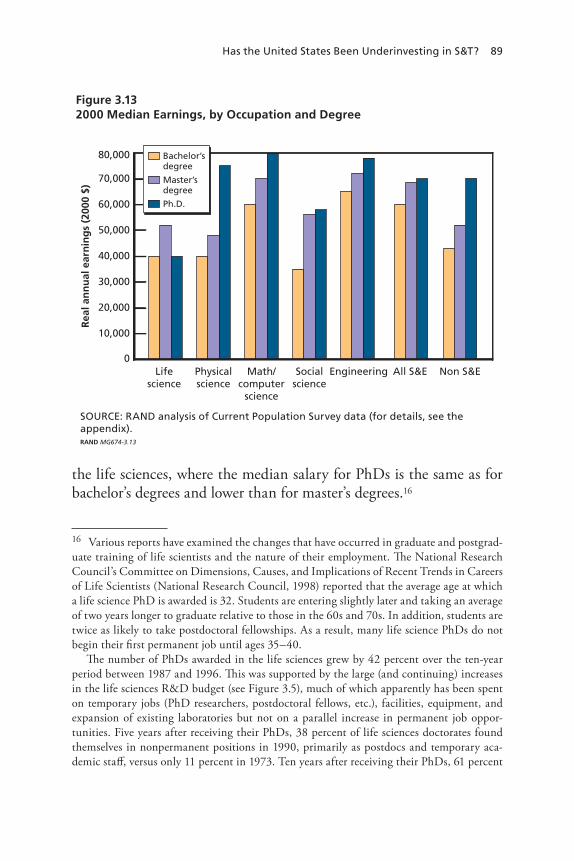
Has the United States Been Underinvesting in S&T? 89
the life sciences, where the median salary for PhDs is the same as for bachelor’s degrees and lower than for master’s degrees.16
16 Various reports have examined the changes that have occurred in graduate and postgrad-uate training of life scientists and the nature of their employment. The National Research Council’s Committee on Dimensions, Causes, and Implications of Recent Trends in Careers of Life Scientists (National Research Council, 1998) reported that the average age at which a life science PhD is awarded is 32. Students are entering slightly later and taking an average of two years longer to graduate relative to those in the 60s and 70s. In addition, students are twice as likely to take postdoctoral fellowships. As a result, many life science PhDs do not begin their first permanent job until ages 35–40. The number of PhDs awarded in the life sciences grew by 42 percent over the ten-year period between 1987 and 1996. This was supported by the large (and continuing) increases in the life sciences R&D budget (see Figure 3.5), much of which apparently has been spent on temporary jobs (PhD researchers, postdoctoral fellows, etc.), facilities, equipment, and expansion of existing laboratories but not on a parallel increase in permanent job oppor-tunities. Five years after receiving their PhDs, 38 percent of life sciences doctorates found themselves in nonpermanent positions in 1990, primarily as postdocs and temporary aca-demic staff, versus only 11 percent in 1973. Ten years after receiving their PhDs, 61 percent
Figure 3.132000 Median Earnings, by Occupation and Degree
SOURCE: RAND analysis of Current Population Survey data (for details, see the appendix).RAND MG674-3.13
Lifescience
Physicalscience
Math/computer
science
Socialscience
Engineering Non S&EAll S&E
Rea
l an
nu
al e
arn
ing
s (2
000
$)
60,000
50,000
40,000
30,000
20,000
80,000
0
70,000
10,000
Bachelor’sdegree
Master’sdegree
Ph.D.

90 U.S. Competitiveness in Science and Technology
It is reasonable to argue that the large increase of R&D expendi-tures in the life sciences had the unintended consequence of produc-ing an oversupply of life science PhDs (see Freeman, 2006, 2007, and Stephan, 2007, for additional discussion). The relatively high supply of PhDs in the life sciences may be the primary explanation for the absence of a salary differential over bachelor’s and master’s degrees, but the data we present are not conclusive. Our analysis shows that the median salary for life scientists grew at approximately the same rate as in other S&E fields. Life science salaries have grown more slowly than those of mathematicians, computer scientists, and social scientists and at the same rate as those of physicists and engineers (Figure 3.14). Furthermore, the median salary in life sciences has been relatively low among S&E salaries at least since 1988 (the first year of the CPS data we used), i.e., before the recent large increases in life science federal fund-ing. Further research is needed to understand why the median salary for life science PhDs is relatively low and whether the entry salary for recent cohorts of life science PhDs has grown relatively slowly, even though the salary growth rate for workers with a bachelor’s degree or more, and covering all experience levels (not just recent entrants), has grown relatively faster. These points, of course, pertain to the ques-tion of whether the life sciences have an excess supply of PhDs—not on whether there is a shortage (see below for further discussion on the issue of a possible shortage of scientists and engineers).
While the supply of PhDs in the life sciences has been discussed in the literature to illustrate that the S&E labor force shows symptoms of excess supply rather than of shortages, it is important to look at the larger picture—that of the S&E workforce in its entirety. Although
of the 1963 and 1964 life science PhDs had achieved tenure appointments, while for the 1985–1986 cohort, this percentage was 38 percent. The probability of working in industry for these cohorts increased from 12 percent to 24 percent, and the probability of working in a federal or government laboratory dropped from 14 percent to 11 percent. Overall, there was a shift primarily out of academia into industry for those in permanent positions. The commit-tee offered several recommendations: restrain the rate of growth of graduate students in the life sciences, disseminate accurate information on career prospects of life scientists, improve the educational experience of graduate students, enhance the opportunities for independence of postdocs, and encourage alternative paths to careers in the life sciences (law, finance, jour-nalism). The committee specifically discouraged restricting the number of foreign students.

Has the United States Been Underinvesting in S&T? 91
PhDs in the life sciences (and social sciences) are paid less than PhDs in non-S&E occupations, they are paid comparably at the bachelor’s and master’s level (Figure 3.13). Further, occupations in mathematics/computer sciences and engineering are better paid at all levels of educa-tion, compared with non-S&E occupations. And, while specific high-wage professions such as those of lawyers and medical doctors are often offered as examples to prove the unattractiveness of S&E careers, it should be kept in mind that these represent, respectively, only 3.2 per-cent and 3.8 percent of all non-S&E careers in our sample (see appen-dix for details). Again, taken as a whole, the S&E workforce enjoys higher earnings than those in non-S&E occupations, about 25 percent higher on average. An important aspect not addressed by these tabu-lations, however, is whether the most talented individuals who once might have been attracted to S&E have chosen instead to enter law, medicine, or business and excel there, perhaps reaching the highest
Figure 3.14Median Salary of Scientists and Engineers, by Field (Bachelor’s Degree or Higher, Three-Year Moving Average)
SOURCE: RAND analysis of Current Population Survey data (for details, see theappendix).RAND MG674-3.14
1989 1991 20032001
Year
1999199719951993
Rea
l med
ian
sal
ary
(20
00
$)
50,000
70,000
0
60,000
40,000
30,000
20,000
10,000
EngineeringLife sciencesMath/computer sciencesPhysical sciencesSocial sciences
CAGR(percent)
1989–2004
1994–2004
0.3 0.5
1.3 2.1
0.4 0.4
1.2 1.1
0.6 0.3

92 U.S. Competitiveness in Science and Technology
income percentiles in those fields. It is generally understood that highly creative individuals can change the direction of a field and open new vistas, and if top talent has been diverted from S&E, it may well be S&T’s loss—and law, medicine, or business’s gain.
As Tables 3.2 and 3.3 show, total tertiary degrees awarded in the United States have grown substantially from 1974 to 2004, and so have degrees in S&E. Bachelor’s, master’s, and doctorate degrees in science and engineering grew on average by about 1 percent to 2 percent per year between 1974 and 2004. Growth over this period was in line with overall degree growth: The share of total degrees represented by science and engineering dropped slightly for bachelor’s and master’s degrees
Table 3.2Total Degrees Awarded in Any Field
Degrees Awarded Bachelor’s Master’s Doctorate
1974 954,376 278,259 33,047
1994 1,183,141 389,008 41,035
2004 1,407,009 555,537 42,155
CAGR (1974–2004) 1.3% 2.3% 0.8%
CAGR (1994–2004) 1.7% 3.6% 0.3%
SOURCE: National Science Foundation (2007).
Table 3.3Degrees Awarded in Science and Engineering: Total and as a Percentage of All Degrees Awarded in Any Field
Degrees Awarded Bachelor’s Master’s Doctorate
1974 326,230 34.2% 62,239 22.4% 18,714 56.6%
1994 373,261 31.5% 91,411 23.5% 26,205 63.9%
2004 454,978 32.3% 118,379 21.3% 26,275 62.3%
CAGR (1974–2004) 1.1% 2.2% 1.1%
CAGR (1994–2004) 2.0% 2.6% 0.0%
SOURCE: National Science Foundation (2007).
NOTE: Average annual growth rates are calculated for totals.
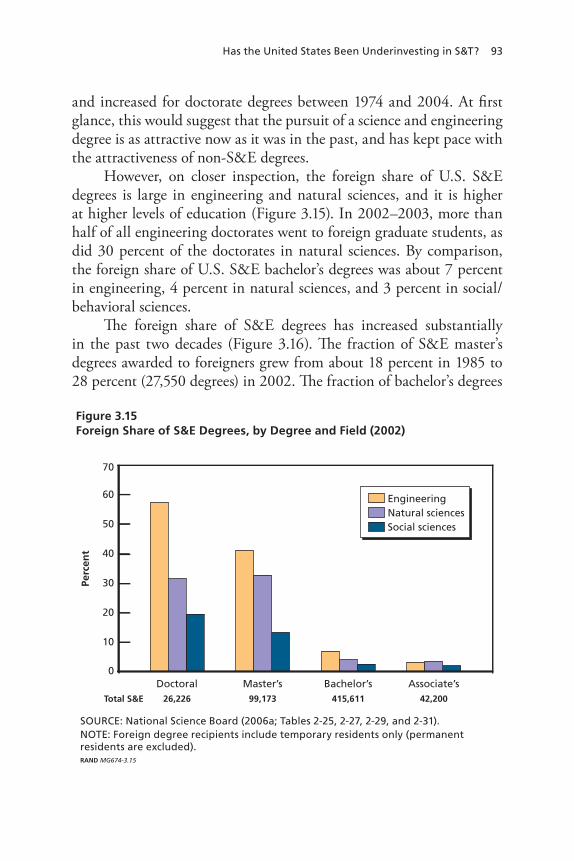
Has the United States Been Underinvesting in S&T? 93
and increased for doctorate degrees between 1974 and 2004. At first glance, this would suggest that the pursuit of a science and engineering degree is as attractive now as it was in the past, and has kept pace with the attractiveness of non-S&E degrees.
However, on closer inspection, the foreign share of U.S. S&E degrees is large in engineering and natural sciences, and it is higher at higher levels of education (Figure 3.15). In 2002–2003, more than half of all engineering doctorates went to foreign graduate students, as did 30 percent of the doctorates in natural sciences. By comparison, the foreign share of U.S. S&E bachelor’s degrees was about 7 percent in engineering, 4 percent in natural sciences, and 3 percent in social/behavioral sciences.
The foreign share of S&E degrees has increased substantially in the past two decades (Figure 3.16). The fraction of S&E master’s degrees awarded to foreigners grew from about 18 percent in 1985 to 28 percent (27,550 degrees) in 2002. The fraction of bachelor’s degrees
Figure 3.15Foreign Share of S&E Degrees, by Degree and Field (2002)
SOURCE: National Science Board (2006a; Tables 2-25, 2-27, 2-29, and 2-31).NOTE: Foreign degree recipients include temporary residents only (permanentresidents are excluded).RAND MG674-3.15
Doctoral Master’s Bachelor’s Associate’s26,226Total S&E 99,173 415,611 42,200
Perc
ent
50
40
30
20
10
70
0
60 EngineeringNatural sciencesSocial sciences
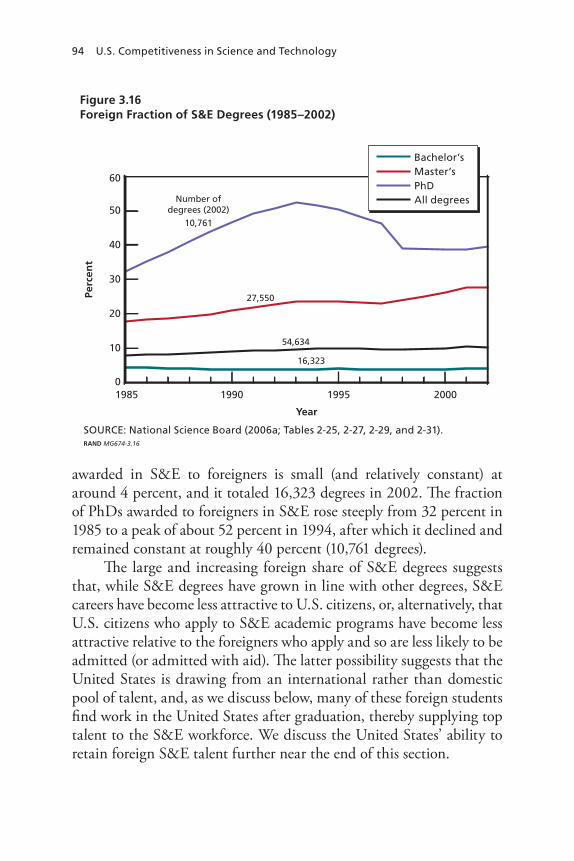
94 U.S. Competitiveness in Science and Technology
awarded in S&E to foreigners is small (and relatively constant) at around 4 percent, and it totaled 16,323 degrees in 2002. The fraction of PhDs awarded to foreigners in S&E rose steeply from 32 percent in 1985 to a peak of about 52 percent in 1994, after which it declined and remained constant at roughly 40 percent (10,761 degrees).
The large and increasing foreign share of S&E degrees suggests that, while S&E degrees have grown in line with other degrees, S&E careers have become less attractive to U.S. citizens, or, alternatively, that U.S. citizens who apply to S&E academic programs have become less attractive relative to the foreigners who apply and so are less likely to be admitted (or admitted with aid). The latter possibility suggests that the United States is drawing from an international rather than domestic pool of talent, and, as we discuss below, many of these foreign students find work in the United States after graduation, thereby supplying top talent to the S&E workforce. We discuss the United States’ ability to retain foreign S&E talent further near the end of this section.
Figure 3.16Foreign Fraction of S&E Degrees (1985–2002)
SOURCE: National Science Board (2006a; Tables 2-25, 2-27, 2-29, and 2-31).RAND MG674-3.16
1985 2000
Year
19951990
Perc
ent
30
20
10
60
0
50
40
Bachelor’sMaster’sPhDAll degrees
10,761
27,550
54,634
16,323
Number ofdegrees (2002)

Has the United States Been Underinvesting in S&T? 95
In short, the S&E workforce as a whole is paid about 25 percent more than the non-S&E workforce, with the exception of PhD holders in the life sciences and in the social sciences, and apart from non-S&E professionals such as lawyers and medical doctors. The diminishing share of degrees awarded to U.S. citizens, particularly for the higher degrees, such as doctorate and master’s, suggests that S&E studies are becoming less attractive to U.S. citizens and perhaps that U.S. citizens encounter more competition from foreigners in applying for spots at science and engineering colleges and universities.
Is There a Shortage of Qualified Scientists and Engineers?
An increasing share of master’s and doctorate degrees in S&E are awarded to foreigners, and while many become productive members of the U.S. S&E workforce, others return home. This raises the question of whether the United States graduates sufficient numbers of scientists and engineers to fill the growing number of S&E jobs.
The United States graduates about 415,000 scientists and engi-neers per year; by comparison, the EU-15 and China each graduate about 500,000 and 530,000 (see Chapter Two). However, the United States employs more as researchers: about 1.3 million FTE compared with 1.0 and 0.8 million, respectively. The United States added 300,000 FTE scientists and engineers to its workforce between 1995 and 2002, or about 42,500 per year, while the EU-15 and China added about 32,000 and 41,000 per year. It might be that with its 415,000 gradu-ates the United States could easily meet its annual demand of 42,500 scientists and engineers for research, but research typically requires more advanced degrees, and the United States graduated about 27,000 S&E PhDs. By comparison, there were 41,000 S&E PhDs produced in the EU-15 and 8,000 in China. Further, an average of 41 percent of U.S. PhD graduates in S&E in 2002 were awarded to foreigners (tem-porary and permanent residents; National Science Board, 2006a). But short- and long-term stay rates are at all-time highs and average about 70 percent (Finn, 2005). In other words, as long as stay rates remain high, the vast majority of PhD graduates in S&E will remain in the
96 U.S. Competitiveness in Science and Technology
United States.17, 18 Stay rates, we expect, depend on job opportunities, relative salaries (United States versus home country), and visa policy.
We consider two indicators of shortage—unusually low unem-ployment and high wage growth for scientists and engineers—and we make comparisons relative to past trends within science and engineer-ing and relative to other high-skill occupations. These are only broad indicators. There may be no broad evidence of a shortage, yet a shortage could be present at a micro-level—for instance, at a particular moment a firm can have difficulty finding enough qualified engineers to meet its hiring requirements. If micro-level shortages were widely present and persistent, they would result in lower unemployment and faster wage growth, as firms adjusted their hiring standards and wage offers.
The unemployment rate has been the same in S&E occupations as in non-S&E occupations, except during the 1991 recession and the years following the end of the dot.com boom at the end of the 1990s, when the S&E unemployment rate was higher (see Figure 3.17). The greater cyclical sensitivity of S&E unemployment in 1991 and the early 2000s deserves further investigation, but it might be related to the rapid expansion in employment that occurred in information technol-ogy (see below). Workers not educated in S&E may have entered occu-pations classified as “computer science” or “information technology” and been counted as S&E workers, yet were more expendable by firms hit hard by the downturn.
Figure 3.18 presents a three-year moving average of the median salary from 1989 to 2004 for workers with at least a bachelor’s degree, with separate trend lines for scientists and engineers, lawyers, doctors,
17 Assuming 41 percent of PhD degrees are awarded to foreigners and a 70 percent long-term stay rate, only 12 percent of total recent graduates will leave the United States for des-tinations abroad.18 The United States is an attractive place for undergraduate and graduate study. In 1999, 300,000 students from Asia and Oceania, 75,000 from Europe (about 50,000 from the EU-15), 39,000 from Africa, and 27,000 from Latin America were enrolled in tertiary edu-cation in the United States. At the same time, fewer than 5,000 students from the United States were enrolled in Asia and Oceania, and about 30,000 were enrolled in Europe (28,000 in EU-15) (Third European Report on Science and Technology Indicators, 2003, Figures 4.4.1 and 4.4.2; student enrollment statistics are based on OECD data).

Has the United States Been Underinvesting in S&T? 97
and other non-S&E occupations. Doctors, lawyers, and many scientists and engineers have a professional degree or a doctorate in addition to a bachelor’s degree, so it is not surprising that their median salaries are higher than for other non-S&E occupations. But the figure is useful in showing the change in median salary over time, where we find average annual increases of 1.8 percent for doctors and 0.8 percent for lawyers compared with 0.9 percent for scientists and engineers, over 1995 to 2005. Salaries in non-S&E occupations excluding lawyers and medi-cal doctors grew at only 0.3 percent per year. In sum, unemployment and wage growth patterns are thus not unusual and do not point to the presence of a chronic or cyclical shortage in S&E. Indeed, Trivedi (2006) argues that there is an oversupply of PhDs in the life sciences.
Is the United States Becoming Increasingly Reliant on Foreign S&E Professionals?
Figure 3.19 shows the annual average growth rate of degree pro-duction and of occupational employment by S&E field from 1980
Figure 3.17Unemployment Rate (Bachelor’s Degree or Higher)
SOURCE: RAND analysis of Current Population Survey data (for details, see theappendix).RAND MG674-3.17
1989 2005200320011999
Year
1997199519931991
Perc
ent
3.0
1.5
1.0
0.5
4.5
0
3.5
4.0
2.5
2.0
S&E unemployment rateNon-S&E unemployment rate

98 U.S. Competitiveness in Science and Technology
to 2000. Growth in S&E employment, at 4.2 percent, significantly exceeded growth in S&E degree production, 1.5 percent. The most notable instances of divergence between employment growth and growth in degrees are mathematics/computer sciences and physical sci-ences. Mathematics/computer sciences degrees grew by 4 percent per year—the highest rate of degree growth in S&E—while mathematics/computer sciences employment grew by more than twice that, 9 percent per year. Physical sciences degrees “grew” by –1 percent per year, yet physical sciences employment growth exceeded 4 percent per year. In S&E overall, the annual average growth rate of degree production has not differed much by degree. Bachelor’s degrees grew by about 1.4 per-cent per year, and master’s and doctoral degrees grew by about 2 per-cent per year (for more details, see National Science Board, 2006a).
Figure 3.18Median Salary of Scientists, Engineers, Doctors, and Lawyers (Bachelor’s Degree or Higher)
SOURCE: RAND analysis of Current Population Survey data (for details, see theappendix).RAND MG674-3.18
1988 1990 200420022000
Year
1998199619941992
Rea
l med
ian
sal
ary
(20
00
$)
100,000
120,000
0
80,000
60,000
40,000
20,000
S&ELawyersDoctorsOthers
CAGR(percent)
1988–2005
1995–2005
0.3 0.9
0.0 0.3
0.4 0.8
1.7 1.8

Has the United States Been Underinvesting in S&T? 99
Similarly, the weighted CPS sample of S&E workers with a bach-elor’s degree or higher grew from 2.25 to 4.21 million workers, or from 0.92 percent to 1.43 percent of the U.S. population over the period 1988 to 2005.19 This suggests that the S&E workforce has continued to grow rapidly, at 4.5 percent per year for the period 1995 to 2005 and 3.8 percent per year for the period 1988 to 2005. Non-S&E workers in our sample grew at a lower pace—2.7 percent per year for the period 1995 to 2005 and 2.3 percent per year for the period 1988 to 2005.
The 4.2 percent growth rate in S&E employment outstripped the 1.5 percent growth rate in S&E degree production for 1980–2000. Nevertheless, the data and studies we have reviewed do not indicate an
19 The CPS person weight is designed to make the CPS sample representative of the U.S. population, not the S&E workforce. Subgroups, such as S&E workers, may have response rates different from that of the larger U.S. population. It is reasonable to assume that such bias is relatively constant over time. In other words, while the total number of S&E workers and the percentage that they represent of the total U.S. population may suffer from bias due to differ-ences in response rate, the growth rate of the S&E workforce should be robust.
Figure 3.19Annual Average Growth Rate of Degree Production and Occupational Employment, by S&E Field (1980–2000; Bachelor’s Degree or Higher)
SOURCE: National Science Board (2006a).RAND MG674-3.19
Engineering Lifesciences
Math/computer
science
Physicalsciences
Socialsciences
All S&E
Perc
ent
8
6
4
2
0
10
–2
Degree productionOccupational employment

100 U.S. Competitiveness in Science and Technology
overall shortage of S&E workers. Growth in employment can outpace the growth in degrees because of several reasons: an increase in the frac-tion of science and engineering degree recipients who enter an S&E occupation, decreased attrition out of science and engineering jobs, immigration of foreign scientists and engineers, later retirement from science and engineering jobs, the return of individuals holding science and engineering degrees who had earlier left for non-S&E jobs, and the entry into S&E jobs by workers without an S&E degree.
The much higher rate of increase of occupational employment in S&E compared with degree production suggests two explanations. First, obtaining a degree in S&E is only one of several paths to joining the S&E workforce. This is consistent with the influx of S&E work-ers either from abroad or from non-S&E occupations. The increase in foreign S&E workers is well known, and they have most likely been a major source of employment growth. But alternative pathways, such as an increasing share of S&E graduates entering S&E jobs, the return of individuals holding S&E degrees who had earlier left for non-S&E jobs, and individuals without S&E degrees entering S&E jobs, may have also contributed. In particular, because U.S. degree production includes an increasing share of degrees received by foreign-born stu-dents, the growth differential between S&E employment and the rate of degree production is even greater for U.S. citizens.
Second, taken together, the high S&E employment growth, the slower S&E degree growth, and the high fraction of degrees awarded to foreign-born graduate students suggest that many U.S.-born gradu-ate students are choosing to study non-S&E fields, perhaps because the job opportunities, challenges, and earnings are perceived to be greater there than in S&E occupations or because U.S. citizens experience more competition from foreigners for spots at science and engineering colleges and universities.
Neither of these explanations gives credence to the notion that the United States has a tight S&E labor market in which a shortage
of scientists and engineers would reveal itself by, e.g., unusually low unemployment, high wages, and high wage growth for scientists and
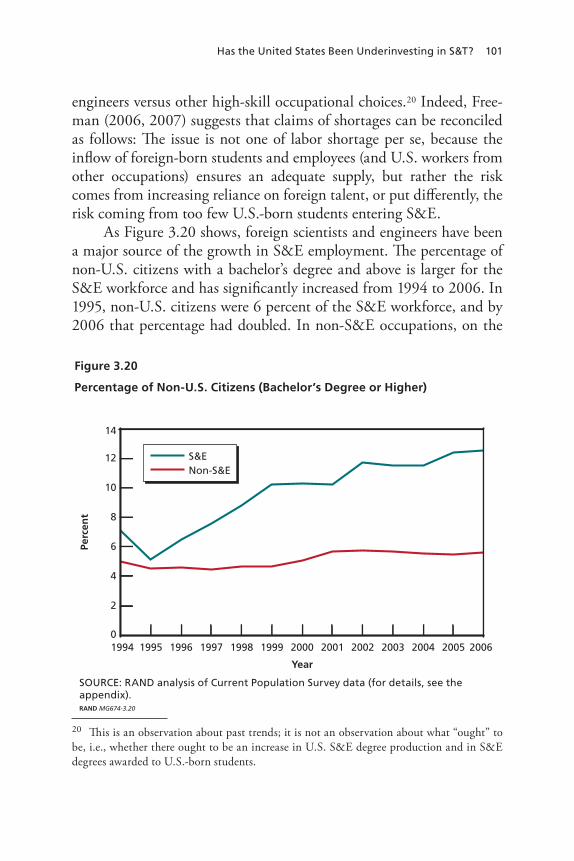
Has the United States Been Underinvesting in S&T? 101
engineers versus other high-skill occupational choices.20 Indeed, Free-man (2006, 2007) suggests that claims of shortages can be reconciled as follows: The issue is not one of labor shortage per se, because the inflow of foreign-born students and employees (and U.S. workers from other occupations) ensures an adequate supply, but rather the risk comes from increasing reliance on foreign talent, or put differently, the risk coming from too few U.S.-born students entering S&E.
As Figure 3.20 shows, foreign scientists and engineers have been a major source of the growth in S&E employment. The percentage of non-U.S. citizens with a bachelor’s degree and above is larger for the S&E workforce and has significantly increased from 1994 to 2006. In 1995, non-U.S. citizens were 6 percent of the S&E workforce, and by 2006 that percentage had doubled. In non-S&E occupations, on the
20 This is an observation about past trends; it is not an observation about what “ought” to be, i.e., whether there ought to be an increase in U.S. S&E degree production and in S&E degrees awarded to U.S.-born students.
Figure 3.20
Percentage of Non-U.S. Citizens (Bachelor’s Degree or Higher)
SOURCE: RAND analysis of Current Population Survey data (for details, see theappendix).RAND MG674-3.20
1994 1995 2006200520042003200220012000
Year
1999199819971996
Perc
ent
12
6
4
2
14
0
10
8
S&ENon-S&E

102 U.S. Competitiveness in Science and Technology
other hand, the percentage of non-U.S. citizens remained roughly con-stant, at 5 percent.
The increase in the percentage of non-U.S. citizens in S&E has been the greatest among younger S&E workers. Non-U.S. citizens now number one in five among S&E workers ages 21–35 (Figure 3.21). The data suggest that noncitizens who work in S&E at younger ages tend to stay in the United States and continue to work in S&E at later ages, as discussed below. Consistent with this perspective, Figure 3.21 shows that the increase in the percentage of noncitizens in S&E ages 36–50 is less than the increase in the percentage increase in noncitizens in S&E ages 21–35. The increase in ages 36–50 could also reflect some immi-gration of foreign S&E workers ages 36–50.
In sum, the U.S. S&E workforce is indeed becoming increasingly reliant on foreign talent, with foreigners accounting for about 20 per-cent of the younger (ages 21–35) cohorts of scientists and engineers.
Figure 3.21Percentage of Non-U.S. S&E Workers, by Age Group (Bachelor’s Degree or Higher)
SOURCE: RAND analysis of Current Population Survey data (for details, see theappendix).
1993 1994 2005200420032002200120001999
Year
1998199719961995
Perc
ent
20
15
10
5
25
0
S&E 21–35Non-S&E 21–35S&E 36–50Non-S&E 36–50S&E 51+Non-S&E 51+
Has the United States Been Underinvesting in S&T? 103
We now turn to the question of whether this dependence means the U.S. S&E enterprise is becoming more vulnerable.
Are Foreign Scientists and Engineers Working in the United States Increasingly Returning Home?
The high percentage of S&E degrees awarded to foreigners, especially at the master’s and PhD level, raise concerns about U.S. ability to retain foreign talent. Is the United States investing in the education of for-eigners who then return home to use their skills abroad? Or, as many of the sending nations fear, is the United States attracting and retaining the best and the brightest from a global pool of talent—a brain drain of which the United States seems to be the primary beneficiary?
A large fraction of foreign PhD S&E graduates, 73.6 percent, reported plans to locate in the United States after graduation in the period 2000–2003. This fraction has increased from 67.6 percent in the period 1992–1995 (National Science Board, 2006a). On a more spe-cific question, 51.1 percent of foreign PhD graduates reported definite plans to stay, reporting postdoctoral research appointments or definite employment plans in the United States, after graduation in 2000–2003. This percentage increased from 34.7 percent in 1992–1995 (Figure 3.22). Chinese and Indian PhD graduates in S&E are most likely to seek opportunities in the United States, followed by Europeans.
Planning to stay is one thing, but do foreign doctorates indeed stay and, if so, for how long? Finn (2005) provides estimates of stay rates21 using Social Security numbers and tax records for foreign stu-dents who received doctorates in S&E from U.S. universities. Finn finds that many foreigners do stay, that stay rates have increased sig-nificantly and are at an all-time high, and that the majority of foreign
21 The stay rate represents the proportion of foreign doctorate recipients from U.S. universi-ties that stayed in the United States after graduation for any reason. The stay rate is always specific to a particular year. The stay rate estimates are derived by assembling groups of Social Security numbers of foreign doctoral recipients and obtaining a special tabulation of data from tax authorities. If a foreign doctorate recipient earned $5,000 or more and paid taxes on it, he or she was defined as a stayer. Adjustments were made for missing Social Security numbers, mortality, and for the relatively small proportion of recent doctorate recipients who stay in the United States but do not earn at least $5,000.
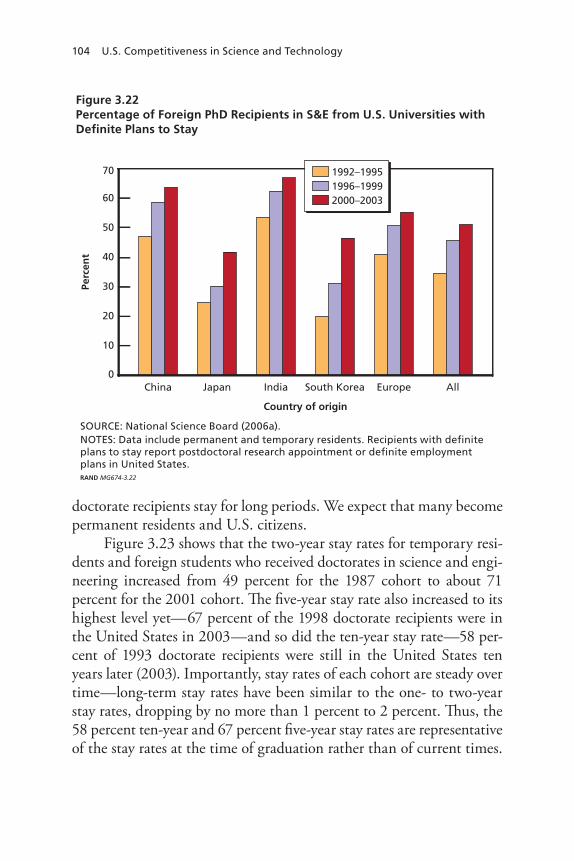
104 U.S. Competitiveness in Science and Technology
doctorate recipients stay for long periods. We expect that many become permanent residents and U.S. citizens.
Figure 3.23 shows that the two-year stay rates for temporary resi-dents and foreign students who received doctorates in science and engi-neering increased from 49 percent for the 1987 cohort to about 71 percent for the 2001 cohort. The five-year stay rate also increased to its highest level yet—67 percent of the 1998 doctorate recipients were in the United States in 2003—and so did the ten-year stay rate—58 per-cent of 1993 doctorate recipients were still in the United States ten years later (2003). Importantly, stay rates of each cohort are steady over time—long-term stay rates have been similar to the one- to two-year stay rates, dropping by no more than 1 percent to 2 percent. Thus, the 58 percent ten-year and 67 percent five-year stay rates are representative of the stay rates at the time of graduation rather than of current times.
Figure 3.22Percentage of Foreign PhD Recipients in S&E from U.S. Universities with Definite Plans to Stay
SOURCE: National Science Board (2006a). NOTES: Data include permanent and temporary residents. Recipients with definiteplans to stay report postdoctoral research appointment or definite employmentplans in United States.RAND MG674-3.22
China AllJapan EuropeIndia
Country of origin
South Korea
Perc
ent
50
40
30
20
10
70
0
60
1992–19951996–19992000–2003

Has the United States Been Underinvesting in S&T? 105
This suggests that if the past pattern continues to hold, the current long-term stay rates will be close to 70 percent, the current short-term rate. It is possible that long-term stay rates are determined by the con-ditions (e.g., employment, visa procedures, etc.) during and/or shortly following graduation. This possibility warrants further study.
Table 3.4 shows that China, Taiwan, India, Korea, and the EU-15 account for 61 percent of the S&E doctorate degrees awarded to for-eigners—China alone accounts for 22 percent. Finn (2005) reports five-year stay rates (percentage of temporary residents receiving PhDs in 1998 who were in the United States in 2003) for these nations/regions of 90 percent, 47 percent, 86 percent, 34 percent, 37 percent, and 83 percent for, respectively, China, Taiwan, India, South Korea, Western Europe, and Eastern Europe.22 China, India, and Eastern
22 Note once more that these data are more representative of the situation in 1996 than they are of current conditions and that stay rates for the period two years after graduation have continued to increase.
Figure 3.23Foreign Recipients of U.S. S&E Doctorates Who Were in the United States Two Years after Graduation, 1989–2003
SOURCE: Finn (2005).RAND MG674-3.23
1989 200319971995
Year
19931991
Perc
ent
60
30
20
10
80
0
70
50
40
20011999
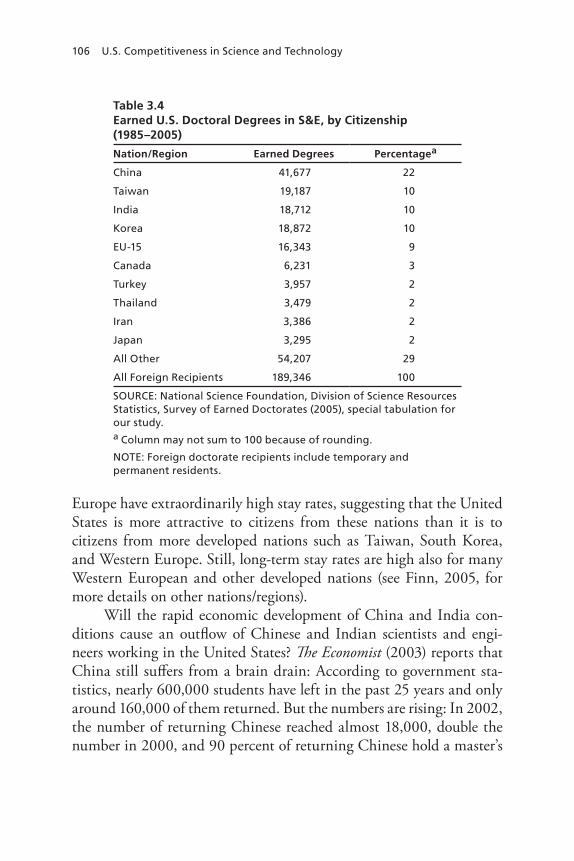
106 U.S. Competitiveness in Science and Technology
Europe have extraordinarily high stay rates, suggesting that the United States is more attractive to citizens from these nations than it is to citizens from more developed nations such as Taiwan, South Korea, and Western Europe. Still, long-term stay rates are high also for many Western European and other developed nations (see Finn, 2005, for more details on other nations/regions).
Will the rapid economic development of China and India con-ditions cause an outflow of Chinese and Indian scientists and engi-neers working in the United States? The Economist (2003) reports that China still suffers from a brain drain: According to government sta-tistics, nearly 600,000 students have left in the past 25 years and only around 160,000 of them returned. But the numbers are rising: In 2002, the number of returning Chinese reached almost 18,000, double the number in 2000, and 90 percent of returning Chinese hold a master’s
Table 3.4Earned U.S. Doctoral Degrees in S&E, by Citizenship (1985–2005)
Nation/Region Earned Degrees Percentagea
China 41,677 22
Taiwan 19,187 10
India 18,712 10
Korea 18,872 10
EU-15 16,343 9
Canada 6,231 3
Turkey 3,957 2
Thailand 3,479 2
Iran 3,386 2
Japan 3,295 2
All Other 54,207 29
All Foreign Recipients 189,346 100
SOURCE: National Science Foundation, Division of Science Resources Statistics, Survey of Earned Doctorates (2005), special tabulation for our study. a Column may not sum to 100 because of rounding.
NOTE: Foreign doctorate recipients include temporary and permanent residents.

Has the United States Been Underinvesting in S&T? 107
degree or doctorate from abroad. Some of the factors that influence the decision of the highly skilled to migrate are economic opportunities, education and research opportunities, research environment and con-ditions (research support, infrastructures, demand for R&D staff), and the climate for innovation, business start-ups, and self-employment in the country of destination (OECD, 2002; Millard, 2005).
Given the prominence of Asian, particularly Chinese and Indian, and EU-15 students among U.S. S&E PhD graduates and their high likelihood to stay in the United States, it is perhaps not surprising to see a similar pattern at bachelor’s and master’s levels. Table 3.5 provides counts of foreign-born residents in the United States with S&E degrees and with PhDs in S&E, and we see that EU nations, India, and China provide the largest numbers of S&E talent. Related to this, the Third European Report on Science and Technology Indicators (2003) estimates that roughly 87,500 EU-15 born workers were employed in S&T in the United States in 1999. At the same time, only 41,000 citizens from Latin America, the United States, and Canada worked in the EU-15. These data suggest that the United States is a net recipient of foreign talent.
Do Foreign Professionals Working in the United States Appear to Be as Productive as Native S&E Professionals?
Here we consider the employment and earnings of the S&E workforce. We contrast domestic and immigrant S&E workers and we make comparisons with non-S&E workers. Our working hypothesis is that immigrant S&E workers have complementary skills or are close substi-tutes for U.S.-born S&E workers, and we examine this hypothesis by asking whether they have similar earnings on average and across the range of the S&E earnings distribution. Similar earnings would imply that immigrant S&E workers are approximately as productive as native S&E workers.
Figure 3.24 shows the percentages of noncitizens in the S&E and non-S&E workforces from 1993 to 2005, as well as the median sal-aries of these workforces. The percentage of noncitizens in the non-S&E workforce has grown slightly, from 4.5–5 percent in the 1990s to 5–5.5 percent in the past few years, while the percentage of noncitizens in the S&E workforce has climbed from around 7 percent to 12 per-

108 U.S. Competitiveness in Science and Technology
cent. During this period, real median salaries (in year 2000 dollars) for U.S. citizens grew at practically the same rate in the S&E and non-S&E workforces, each gaining a few thousand dollars over the entire period. S&E salaries were $10,000 to $14,000 higher than non-S&E salaries throughout the period. The similar growth rates in median
Table 3.5Employed, Foreign-Born Scientists and Engineers in the United States, with a Bachelor’s Degree or Higher Degrees (Including PhDs) and with PhDs (2003)
Place of BirthWith at Least One S&E Degree,
Working in Any Type of JobWith at Least One S&E PhD, Working in Any Type of Job
India 366,000 35,000
EU-15 292,000 41,000
China, HK, Macau 240,000 54,000
Philippines 134,000 2,000
Canada 111,000 11,000
Taiwan 86,000 11,000
Korea 77,000 7,000
Vietnam 68,000 1,000
Mexico 65,000 2,000
Iran 58,000 5,000
Russia 45,000 9,000
Japan 45,000 5,000
All other countries 693,000 96,000
All foreign-born 2,280,000 246,000
SOURCE: National Science Foundation/Division of Science Resources Statistics, Scientists and Engineers Statistical Data System (2003), special tabulation for our study.
NOTES: Data do not include individuals with only foreign degrees who were not in the United States in April 2000. For a description of the National Science Foundation Scientists and Engineers Statistical Data System (SESTAT) S&E degree field classification and occupational classification, see National Science Foundation (undated-a, undated-b). Detail may not add to total because of rounding. A majority of S&E-degreed individuals work in non-S&E occupations (details available from NSF/SRS). Russia includes individuals who reported “USSR,” but not former Soviet states.
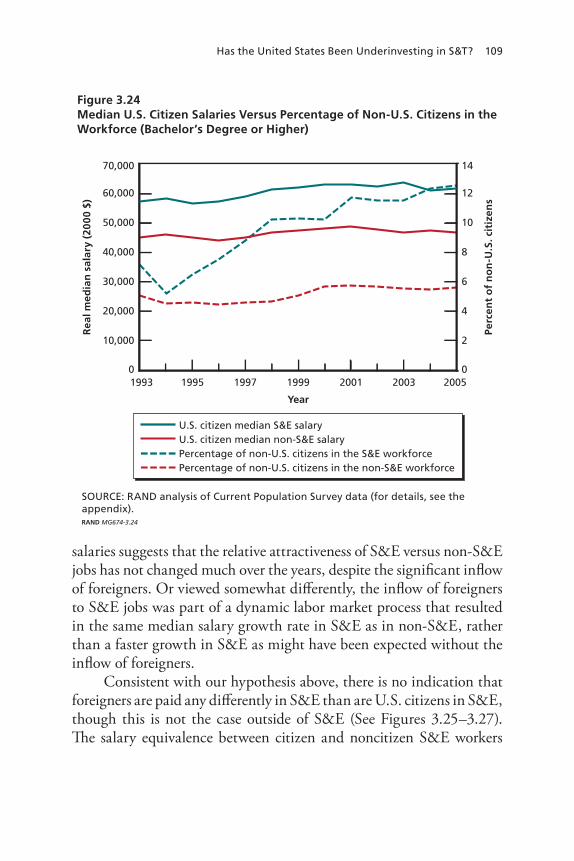
Has the United States Been Underinvesting in S&T? 109
salaries suggests that the relative attractiveness of S&E versus non-S&E jobs has not changed much over the years, despite the significant inflow of foreigners. Or viewed somewhat differently, the inflow of foreigners to S&E jobs was part of a dynamic labor market process that resulted in the same median salary growth rate in S&E as in non-S&E, rather than a faster growth in S&E as might have been expected without the inflow of foreigners.
Consistent with our hypothesis above, there is no indication that foreigners are paid any differently in S&E than are U.S. citizens in S&E, though this is not the case outside of S&E (See Figures 3.25–3.27). The salary equivalence between citizen and noncitizen S&E workers
Figure 3.24Median U.S. Citizen Salaries Versus Percentage of Non-U.S. Citizens in the Workforce (Bachelor’s Degree or Higher)
SOURCE: RAND analysis of Current Population Survey data (for details, see theappendix).RAND MG674-3.24
1993 2005200320011999
Year
19971995
Rea
l med
ian
sal
ary
(20
00
$)
Perc
ent
of
no
n-U
.S. c
itiz
ens
50,000
40,000
30,000
20,000
10,000
70,000
0
60,000
8
6
4
2
0
14
10
12
U.S. citizen median S&E salaryU.S. citizen median non-S&E salaryPercentage of non-U.S. citizens in the S&E workforcePercentage of non-U.S. citizens in the non-S&E workforce

110 U.S. Competitiveness in Science and Technology
is consistent with the proposition that the quality and skill of the two groups are similar and that they are equally productive.
Furthermore, the evidence indicates that noncitizens have uni-formly penetrated the salary distribution of the S&E workforce, with the exception of 1998–2000, years marked by a sudden increase in the percentage of foreign S&E in the upper mid quartile of the S&E salary distribution. These trends are shown in Figure 3.26, where we see that the percentage of S&E workers who are noncitizens is the same in sev-eral segments of the salary distribution, specifically, in the lower half, the upper mid quartile, and the upper quartile, with the exception just mentioned. Within each percentile category of S&E salaries there is little difference between the average salaries of U.S. citizens and non-citizens (Figure 3.27). The similarity in salaries across the salary spec-trum suggests that the quality/skill range of noncitizen S&E workers is similar to that of citizen S&E workers. However, from 1998 onward, average salaries in the highest percentiles (76th percentile and above)
Figure 3.25Median Salaries of U.S. Citizens Versus Those of Non-U.S. Citizens (Bachelor’s Degree or Higher)
SOURCE: RAND analysis of Current Population Survey data (for details, see theappendix).RAND MG674-3.25
1993 1994 2005200420032002200120001999
Year
1998199719961995
Rea
l med
ian
sal
ary
(200
0 $)
50,000
40,000
30,000
20,000
10,000
70,000
0
60,000
U.S. citizen S&E salaryNon-U.S. citizen S&E salaryU.S. citizen non-S&E salaryNon-U.S. citizen non-S&E salary
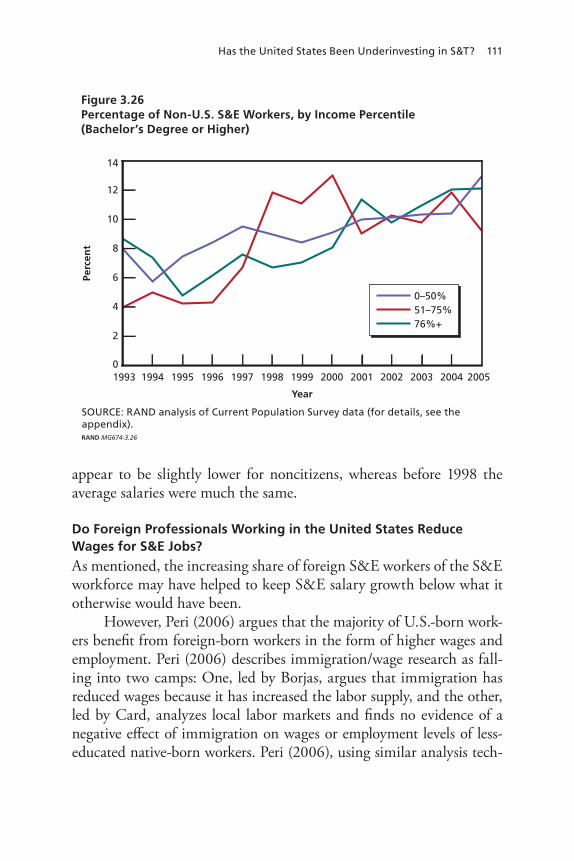
Has the United States Been Underinvesting in S&T? 111
appear to be slightly lower for noncitizens, whereas before 1998 the average salaries were much the same.
Do Foreign Professionals Working in the United States Reduce Wages for S&E Jobs?
As mentioned, the increasing share of foreign S&E workers of the S&E workforce may have helped to keep S&E salary growth below what it otherwise would have been.
However, Peri (2006) argues that the majority of U.S.-born work-ers benefit from foreign-born workers in the form of higher wages and employment. Peri (2006) describes immigration/wage research as fall-ing into two camps: One, led by Borjas, argues that immigration has reduced wages because it has increased the labor supply, and the other, led by Card, analyzes local labor markets and finds no evidence of a negative effect of immigration on wages or employment levels of less-educated native-born workers. Peri (2006), using similar analysis tech-
Figure 3.26Percentage of Non-U.S. S&E Workers, by Income Percentile (Bachelor’s Degree or Higher)
SOURCE: RAND analysis of Current Population Survey data (for details, see theappendix).RAND MG674-3.26
1993 1994 2005200420032002200120001999
Year
1998199719961995
Perc
ent
12
6
4
2
14
0
10
8
0–50%51–75%76%+

112 U.S. Competitiveness in Science and Technology
niques to Borjas but accounting for complementarities of the foreign workforce and allowing for immigration to increase investment oppor-tunities, finds that all worker groups experience positive effects on wages and employment from immigration. In particular, Peri argues, highly skilled immigrants have a large positive effect on the wages of native workers with a college degree or more as creative, innovative, and com-plex professions benefit particularly from the complementarity brought by foreign-born scientists, engineers, and other highly skilled workers. Further, highly educated immigrants generate opportunities for invest-ment and the creation of new businesses. Peri argues that a larger labor force increases the productivity of the existing capital stock and induces investment in response to higher returns. The example of Silicon Valley shows that foreign scientists and engineers do create opportunities, with Chinese and Indian-run companies accounting for 29 percent of total
Figure 3.27Average Salaries of U.S. and Non-U.S. S&E Workers, by Percentiles (Bachelor’s Degree or Higher)
SOURCE: RAND analysis of Current Population Survey data (for details, see theappendix).RAND MG674-3.27
1993 1994 2005200420032002200120001999
Year
1998199719961995
Rea
l an
nu
al s
alar
y (2
000
$)
120,000
100,000
80,000
60,000
40,000
160,000
0
140,000
20,000
U.S. +76%U.S. 51–75%U.S. 0–50%
Non-U.S. +76%Non-U.S. 51–75%Non-U.S. 0–50%

Has the United States Been Underinvesting in S&T? 113
Silicon Valley high-technology start-ups in the period 1995–1998, up from 12 percent in 1980–1984 (Saxenian, 2000).
Restating these points, the effect of the influx of foreign-born S&E workers on S&E wages may be related to three factors. First, in the short run, an increase in the supply of labor will decrease the market wage relative to what it would have been (which is not observed). Our wage comparisons show that foreign-born scientists and engineers are paid the same wage as natives, suggesting that foreign-born scientists and engineers are viewed as equally productive. In other words, they are the same type of labor as U.S.-born S&E labor and it is reasonable to con-sider native and foreign-born scientists and engineers together. Second, increasing the total number of S&E workers in the United States might increase productivity per U.S. S&E worker. This can occur because of network effects (having more people in an S&T network increases the likelihood that someone will know the answer to a question or have a new technique or result useful in other S&T work). The productivity of S&E workers belonging to the same network but working abroad might also increase as new techniques and findings are shared with them. Third, the availability of more S&E workers and the increasing productivity of S&E activities make it feasible and profitable to increase investment in S&T (recall the large increase in U.S. R&D driven by industry investment presented in Section 3.1). The increase in invest-ment has been accompanied by an increase in the demand for S&E workers, which acts to increase their wage. Thus, it is not obvious that an increase in foreign-born S&E workers has hurt the employment and earnings of U.S.-born S&E workers. By the same token, tightening the limits on S&E education and work permits seems disadvantageous.
Discussion and Conclusion
Scientists and engineers continue to earn on average more than non-S&E workers (about 25 percent more) and continue to have lower unemployment than the non-S&E workforce for similar levels of edu-cation. The salaries of U.S. citizens in S&E have grown in line with those of U.S. citizens in non-S&E positions, suggesting that, on aver-age, the relative attractiveness of S&E careers has not changed much.

114 U.S. Competitiveness in Science and Technology
Judging by recent versus past wage and unemployment trends, there is no evidence of a current shortage of qualified S&E workers.
The diminishing share of degrees awarded to U.S. citizens, par-ticularly for the higher degrees such as doctorate and master’s, sug-gests that S&E studies are becoming less attractive to U.S. citizens. Research is needed to determine the reasons why, though possible rea-sons include higher salaries and higher expected career earnings in cer-tain other fields such as law and medicine; longer time to complete a PhD in S&E; longer time to first “permanent” job in S&E (postdocs are common); improved financial aid or borrowing ability in non-S&E relative to S&E; less-qualified U.S. applicants to S&E graduate pro-grams compared with foreign applicants; and the fact that fewer quali-fied U.S. students apply. These factors are related; because students look ahead when applying to graduate school, application rates will likely depend on financial aid, degree requirements, and expected earnings.
S&E employment has grown by 4.2 percent per year since 1980, and S&E degree production has grown by about 1.5 percent per year. While the growth rate of occupational employment in S&E has exceeded that of U.S. degree production, the S&E workforce does not show the traditional signs of a shortage of qualified workers and engineers. We attribute this finding to the movement of workers from non-S&E occupations to S&E occupations, such as the flow into infor-mation technology occupations, and the significant immigration of foreign S&E talent.23
23 R&D often requires a master’s or Ph.D. degree in S&E. While immigrants who obtained such degrees abroad can begin employment on fairly short notice, there is a long lead time associated with increasing the degree production at U.S. universities, as scientists and engi-neers require substantial investments in human capital (at least several years and debat-ably up to a decade or so of specialized training). Obtaining such degrees requires taking a number of math and science courses in high school and as an undergraduate. In the short run, expanding the number of students enrolled in S&E graduate study is dependent on the number of students in the undergraduate pipeline, broadly defined to include students who are either in an S&E major or who, although in a different major, could be induced to enter an S&E major, and by the number of foreign students choosing to study in the United States. In the long run, expanding the number of students in S&E graduate study depends on attracting more K–12 students to math and science courses and providing the challenge, motivation, and incentive needed for them to enroll in S&E majors in college.

Has the United States Been Underinvesting in S&T? 115
The percentage of non-U.S. citizens with a bachelor’s degree and above in the S&E workforce has significantly increased from 1994 to 2006. In 1995, non-U.S. citizens were 6 percent of the S&E work-force, and by 2006 that percentage had doubled. In non-S&E occupa-tions, on the other hand, the percentage of non-U.S. citizens remained roughly constant, at 5 percent. Most of these immigrants arrive when they are young, ages 21–35; within this age group, foreigners make up 20 percent of the S&E workforce. India, the EU-15, and China are the greatest contributors of foreign S&E talent to the U.S. workforce. The two main routes for immigration of S&E workers appear to be (1) foreigners obtaining education at U.S. universities and subsequently staying and (2) direct immigration of foreigners who were educated abroad.
The United States has benefited from the inflow of foreign S&E students, many of whom subsequently stay, and from direct immigra-tion of workers with education in S&E obtained abroad. There is no indication that foreigners are paid any differently in S&E than are U.S. citizens in S&E, though this is not the case outside of S&E. The salary equivalence between citizen and noncitizen S&E workers suggests that the foreign workforce has equal quality and skill. Further, given that the share of foreign S&E workers of the S&E workforce has increased, it is reasonable to argue that this has helped to keep S&E salary growth below what it otherwise would have been. Counterfactually, one could also argue that without the increase in foreign S&E workers, S&E sala-ries would have grown faster, and that such an increase would have induced more U.S. students to enter S&E. But the increase in foreign S&E workers may have helped to increase the productivity of all S&E workers and facilitate new investment in S&E as well as the produc-tion of goods and services, thereby increasing economic wealth and the demand for S&E workers. The example of Silicon Valley shows that foreign scientists and engineers do create significant opportunities, with Chinese and Indian-run companies accounting for 29 percent of total Silicon Valley high-technology start-ups in the period 1995–1998 (up from 12 percent in 1980–1984; Saxenian, 2000)
In any event, the influx of foreigners has apparently not reduced the quality of S&E workers, at least judging by the equivalence of sala-
116 U.S. Competitiveness in Science and Technology
ries for citizens and noncitizens in S&E. The increased supply of S&E workers probably helped to reduce the cost growth of R&D below what it otherwise would have been. Also, because many foreign stu-dents come to the United States with a secondary education or a college education, the United States has not had to bear the cost of that educa-tion. Technological and scientific innovation is the engine of U.S. eco-nomic growth, and human talent is the main input that generates this growth. Immigration of highly skilled scientists and engineers allows the United States to draw the best and brightest from an international pool of talent.
Two factors have contributed to the increase of foreigners: (1) the foreign share of S&E degrees obtained at U.S. universities has increased significantly over the past two decades at the master’s and PhD level and (2) stay rates have increased. Depending on the S&E area, 30 to 50 percent of graduate degrees go to foreign students (40 percent on average). Studies of foreign S&E doctorates who received their edu-cation at U.S. universities reveal that stay rates are at all-time highs, with 70 percent of doctorates reported to have remained in the United States two years after receiving their doctorate. Research suggests that foreigners increasingly decide to stay in the United States and that they stay for substantial periods of time, many even permanently. Long-term (five- and ten-year) stay rates have historically been similar to short-term stay rates (dropping by less than 2 percentage points), sug-gesting that long-term stay rates for recent cohorts will also be near 70 percent and that conditions (employment and immigration) right around the time of completion of the doctorate degree are crucial in determining the likelihood of a prolonged or indefinite stay. In any event, given the importance of attracting and keeping foreign-born, U.S.-educated S&E workers and of attracting foreign-born, foreign-educated S&E workers, a more thorough understanding of the deci-sions to come to the United States and stay in the United States seems worth pursuing.
The case for increasing the number of U.S.-born S&T graduates rests on whether increased employment of foreign-born S&T workers makes the United States vulnerable. If foreigners return home, this represents a loss of talent and knowledge and an outflow of the latest
Has the United States Been Underinvesting in S&T? 117
techniques and understanding. If there are too few U.S. citizens in S&E to fill jobs related to national security, some national security activities will be done more slowly or will not be done. If opportu-nities abroad improve, the United States might attract fewer foreign S&E students and their stay rates could decline. Also, some U.S. S&E workers now spend part of their time working for their home country, which could speed the transmission of U.S. discoveries to other coun-tries. U.S.-born S&E workers form the pool of workers for national security jobs requiring a clearance, but these jobs are a small portion of the market (Butz et al., 2004). We do not know how often they cannot be filled from the supply of U.S.-born S&E workers or whether firms do, or do not, offer a wage premium if there is a supply shortage at the prevailing wage. As we saw, overall wage data do not show a premium for U.S.-born S&E workers, but perhaps some defense firms offer a premium in certain fields. It is further not clear that having more foreign graduate students and S&E workers has increased the outflow of technology from the United States; it is clearly a possibility, but we have no information to report on this point. Given the benefits associ-ated with the foreign S&E workforce, the United States is likely to be worse off if foreign access to U.S. graduate education and S&E jobs were limited. We do suggest, however, that any assessment of U.S. vul-nerability to an increasing reliance on foreign S&E workers take into consideration the likely benefits from having a larger number of highly talented people in the United States. Finally, it is helpful to keep in mind that limiting, or increasing, the number of foreign-born S&E workers is a different question than whether the number of U.S.-born S&E workers is adequate to meet national security requirements for such workers. The two questions are related in the sense that, as men-tioned, foreign-born S&E workers might return home permanently or temporarily and might speed the outflow of S&T discoveries to their colleagues abroad. But even so, there are national security–related posi-tions that are not open to foreign nationals, and the demand for and supply of S&E workers to such positions is inherently domestic. We do not have information one way or the other to indicate that a critical shortage is present or looming. If further assessment identifies a prob-lem, near-term policy actions would include increasing salary offers

118 U.S. Competitiveness in Science and Technology
and enriching job content, while longer-term actions would include increasing the supply. For instance, when the all-volunteer force was launched, military physicians were expected to be in critically short supply, and this led to the creation of the health professional scholar-ship program, under which the government paid for medical educa-tion and the physician was obligated to serve in the military for a given number of years.
The increasing numbers of foreign students in S&E and the increase in stay rates suggest that the United States remains a highly attractive setting in which to study and/or conduct research. While anecdotal evidence may suggest that foreign scientists and engineers are increasingly returning home, various studies indicate that the num-bers are still small and that the United States remains a net recipient of highly skilled talent. Nevertheless, it is worth watching trends in the number of foreign S&E workers returning home. The recent reduc-tion of the annual cap on H1-B visa for skilled labor could reduce stay rates and the immigration of skilled workers. In addition, significant economic development of China and India, whose nationals contribute significantly to the U.S. S&E workforce, could offer increasingly attrac-tive opportunities “back home,” which may increase return migration and reduce stay rates.

119
CHAPTER FOUR
Discussion and Recommendations
The United States continues to lead the world in science and technol-ogy. The United States accounts for 40 percent of total world R&D spending and 38 percent of industrialized nations’ (OECD countries) patented new technology inventions, employs 37 percent (1.3 million) of OECD researchers (FTE), produces 35 percent, 49 percent, and 63 percent, respectively, of total world publications, citations, and highly cited publications, employs 70 percent of the world’s Nobel Prize win-ners and 66 percent of its most-cited individuals, and is the home of 75 percent of both the world’s top 20 and top 40 universities and 58 percent of the top 100.
A comparison of S&T indicators for the United States with those of other nations/regions reveals the following:
Other nations/regions are not significantly outpacing the United States in R&D expenditures. China and South Korea, which are showing rapid growth in R&D expenditures, are starting from a small base, and the EU-15 and Japan are growing slower than the United States. Other nations/regions are not outpacing the United States in S&T employment, as growth in researchers in the EU-15 was compa-rable with, and that of Japan considerably lower than, that of the United States. China, however, added about the same number of
120 U.S. Competitiveness in Science and Technology
researchers as the United States did and overtook Japan during the period 1995 to 2002.1, 2 Other nations/regions are rapidly educating their populations in S&T, with the EU-15 and China graduating more scientists and engineers than the United States. China, India, and South Korea are starting to account for a sig-nificant portion of the world’s S&T inputs and activities (R&D funding in dollars at PPP, research jobs, S&T education, etc.) and are showing rapid growth in outputs and outcomes, yet they account for a very small share of patents, S&T publications, and citations. One sign of U.S. slippage is a 3-percentage point loss in world share in publications, citations, and top 1 percent highly cited publications between 1993–1997 and 1997–2001. On measures such as additions to the S&T workforce and pat-ented innovations, U.S. growth in S&T was on par with, or above, world average trends. By comparison, Japan grew more slowly in additions to the S&T workforce, and both the EU-15 and Japan had slower growth in patented innovations.
Taken in concert, these statistics suggest that the United States is still a premier performer in S&T and grew faster in many measures of S&T prowess than did Japan and Europe. Developing nations such as China, India, and South Korea, though starting from a small base, showed rapid growth in S&T, and, if that growth continues, the United States should expect its share of world S&T output to diminish.
High growth in R&D expenditures, triadic patents, and S&E employment, combined with low unemployment of S&E workers, sug-gest that the United States has not been losing S&E positions to other countries through outsourcing and offshoring. Studies of offshoring of high-skill content work suggest that it does not result in job losses
1 Data on India were missing, and data of sufficient quality and comparability were not available from other sources.2 If current growth rates for the United States and China are maintained, China could overtake the United States in the total number of researchers by 2021.

Discussion and Recommendations 121
in the originating country but rather that the overall number of jobs has increased. Offshoring is employed to save labor cost and to access scarce talent, and as this occurs offshore salaries can be expected to increase, reducing the cost advantage of offshoring. The more sophisti-cated or higher-skilled the function, the lower the impact of off shoring on employment in the originating country; substitutes for highly spe-cialized, experienced scientists and engineers are not readily available at home or abroad. Companies look elsewhere for high-skill talent if they cannot find it at home or can obtain it more cheaply, overall, abroad. Wage and unemployment trends do not show the traditional signs of a shortage of scientists and engineers. Unemployment has not been decreasing but has been steadily low, apart from increases in the recession of 1991 and the years following the bust of the late 1990s boom. Also, wages have not been increasingly rapidly relative to trend. Nevertheless, low unemployment, the relatively steady wage growth in S&E, and claims of shortages can plausibly be reconciled by offshoring and outsourcing. If firms cannot fill their S&E positions in the United States, they may decide to offshore or outsource R&D to take advan-tage of foreign S&E labor pools. In addition, firms may prefer to set up foreign production and research activities as part of a strategy of gain-ing entry to foreign markets. Moving operations to foreign countries and drawing on their S&E workers may be less costly and strategically more advantageous than bidding up S&E wages in the United States in an effort to hire S&E workers. Thus, offshoring and outsourcing are options that can slow wage increases and remove shortages. That is, shortages in the United States have not materialized, or have been mitigated, by these means. An implication of this is that a policy of facilitating the immigration of highly skilled labor has several benefits. It will slow the increase in the wages of such labor, and it will increase the supply of skilled labor to companies and thereby help companies to capture synergies from expanding the scale and scope of their R&D and of advanced manufacturing activities in the United States. This will help to ensure that the benefits of innovation, including spillovers, accrue in the United States. The reduction of the annual H1B visa cap, allowing skilled foreigners to be employed temporarily in specialty
122 U.S. Competitiveness in Science and Technology
occupations, from 195,000 to 65,000 annually, may be counterproduc-tive in this regard.
As with other countries, U.S. economic growth, increase in stan-dard of living, and S&T progress depend on the United States’ ability to absorb (make economic use of) recent innovations made at home or abroad. The rise of R&D and innovation activity in other nations suggests that the pool of technology created outside the United States may be growing and that the United States is likely to benefit from increased productivity from technology invented abroad. There is no reason to believe that the globalization of S&T and the rise of other nations impacts the United States’ capability to absorb new technol-ogy directly, as this capability is to a large extent determined by pri-vate sector know-how, business incentives, consumers’ willingness to try new technologies, and the legal and regulatory framework. Some technology applications do not require much S&T capacity, or much knowledge of S&T within the user community or the general public. For example, solar collectors or filters for water purification can sig-nificantly enhance the productivity of workers in a developing country without the need for them to understand how these devices work. But many technology applications do require S&T capacity (see Silberglitt et al., 2006a, 2006b). The S&T capacity of advanced countries, includ-ing an educated and technically astute workforce and public, is the reason why they are highly capable of implementing new technology, and why developing nations such as China and India have partial capa-bility, but are well ahead of Latin America, the Middle East, and Africa in this regard.
Nations trade with one another on the basis of comparative advan-tage, and international leadership in science and technology gives the United States its comparative advantage in the global economy. Loss of comparative advantage could hurt the United States, as it would have to reallocate resources, reduce wages, and forego market-leader rents from new products or innovations. As more centers of scientific excel-lence develop abroad, R&D will become more globalized, but it is not clear that the United States is fated to lose as this occurs. Eaton and Kortum’s (2006) model of innovation, technology diffusion, and trade suggests that as long as trade barriers are not too high, faster diffusion

Discussion and Recommendations 123
shifts research activity toward the country that does it better (which in many fields is the United States). This shift in research activity raises the relative wage there. It can even mean that, with more diffusion, the country better at research eventually obtains a larger share of tech-nologies in its exclusive domain. Increased trade and faster diffusion of technology will probably not affect all sectors alike, however, and a loss of leadership in some areas may be accompanied by a gain of leadership in others. Freeman (2006, 2007) argues that populous, low-income countries such as China and India have a cost advantage and may be able to compete with the United States in high tech by focusing in a specific area and by having many S&E workers, even though they are only a small fraction of their workforces.
As R&D develops abroad in China, India, Korea, and other countries yet to emerge, leadership in science will become more dis-persed throughout the world. As this occurs, the United States should develop new ways of monitoring scientific and technological advances in other countries and develop a capacity to learn from the science centers in the EU, Japan, China, India, and other countries. Adams (2007), for example, argues that people transfer is a good means of knowledge transfer and that U.S. researchers should go abroad more often. U.S. researchers have little experience elsewhere compared to other scientifically proficient nations; this may simply be a reflection of U.S. leadership in S&T. Yet the United States could further develop its capacity to learn from future advances in other countries by promot-ing joint ventures, encouraging collaborative research with researchers in other countries, supporting U.S. researchers and students to par-ticipate in foreign R&D centers (e.g., through fellowships, positions in foreign laboratories of multinationals, graduate studies abroad, sab-baticals, postdoctoral positions, etc.), and establishing informal net-works with S&E workers who studied in the United States. Foreign-born S&E workers may also help in establishing links to foreign centers of R&D excellence. The United States should not be an isolated player but rather an active partner, as it has been in business relationships. In a multipolar world of research, international diplomatic relations may become increasingly important as a policy tool.
124 U.S. Competitiveness in Science and Technology
Maintaining the capability to innovate, making scientific discov-eries, and absorbing recent innovations made at home or abroad is cru-cial to U.S. economic strength, global strategic leadership, and national security. For a nation to be successful in S&T, certain elements must be in place: (1) S&T infrastructure—including physical infrastructure such as laboratories, equipment, and user facilities such as national and industrial laboratories—as well as substantial investment in R&D and laws, policies, and regulations to support that investment (e.g., tax poli-cies, intellectual property rights, flexible labor markets, favorable immi-gration policies for foreign S&T talent, etc.); (2) a strong education system, particularly in the sciences, engineering, and mathematics, in both K–12 and higher education; and (3) a well-trained, well-prepared and sizeable S&T workforce. These elements can be seen as attributes of S&T capability. Ultimately, however, the demand for S&T infrastruc-ture, education, and workforce is a derived demand—it depends on the contribution of S&T to society and the economy and, in return, on the private and public funds generated by S&T discoveries that cycle back to support all aspects of this S&T capability. The high fraction of R&D that is funded by industry underscores the importance of the economic contribution of S&T. Public investment is equally impor-tant, especially with respect to basic research and research for national security purposes.
We now discuss these in turn.
Infrastructure
Looking only at federal expenditures on R&D a few years ago might have left the impression that the United States was underinvesting in R&D at the end of the Cold War: Total federal R&D spending grew at 2.5 percent per year from 1994–2004, much lower than its long-term average of 3.5 percent per year from 1953–2004. Yet federal R&D accounted for only $86 billion of $288 billion total U.S. R&D expenditures in 2004. Industrial R&D expenditures, the largest source of R&D, grew rapidly at an average rate of 5.4 percent and 5.3 per-cent per year, for the periods 1953–2004 and 1994–2004, respectively,

Discussion and Recommendations 125
and accounted for most of the growth in total R&D (4.7 percent and 4.4 percent for the periods 1953–2004 and 1994–2004, respectively). As a result, growth in total R&D was on par with the world’s average growth: Measured in dollars at PPP, U.S. R&D expenditures grew at an average rate of 5.8 percent per annum, close to the world’s average of 6.3 percent (1993–2003). Further, total basic research showed the greatest rate of increase at an average of 6.2 percent and 5.1 percent per year (4.7 percent and 4.4 percent for total R&D) for the periods 1953–2004 and 1994–2004, respectively. Also, federally funded basic research grew by 3.4 percent per year over the period 1970–2003 and 4.7 percent per year over the period 1993–2003. As industrial and fed-eral R&D grew, universities and colleges managed to increase their R&D by on average 6.6 percent and 5.1 percent per year for 1953–2004 and 1994–2004, respectively. This is reassuring given the importance of basic and academic research to innovation.
Most of the increase in federally funded basic research was in the life sciences, while basic research funding for the physical sciences was essentially flat. The differences in funding between the various science and engineering fields reflect the payoff to investments in these fields as perceived by policymakers and peer-review committees, though some might question why funding for physical sciences has grown so slowly. Still, taken as a whole, total basic research and federally funded basic research have increased rapidly in real terms (constant dollars), on aver-age by between 3 percent and 6 percent per year for the last three decades.
Some may believe that the U.S. government must commit to keeping the growth of its S&E enterprise on par with that of other advanced and rapidly developing countries. But the United States is not a monolithic decisionmaker, and much of the investment in R&D is nonfederal and is not under the control of the federal government. Nonfederal R&D is driven by the expected economic payoff. With economic payoff as the chief motive force, public policy should aim at keeping domestic markets competitive, by, for example, creating incen-tives for R&D, protecting intellectual property, supporting the devel-opment of the S&E workforce, and facilitating international trade as well as entry and operation in foreign markets. But the federal gov-

126 U.S. Competitiveness in Science and Technology
ernment does have a large role to play in funding basic and applied research—research that by its very nature may lead to discoveries that are not knowable beforehand and could lead to novel applications to address frontier technological challenges.
Education
U.S. expenditures per student on elementary and secondary education are comparable to other industrialized nations and commensurate with the United States’ high per capita GDP. In postsecondary education, the United States spends significantly more per student than other indus-trialized nations (nearly twice the OECD industrialized nations’ aver-age). U.S. students perform relatively well in reading literacy (compa-rable with other OECD industrialized nations) and compare relatively well in mathematics and science at the lower grades, but older students demonstrate lower achievement than most of their peers in other indus-trialized nations. The latter has been true for some time, and yet one reason for policy concern about this now is that the number of U.S.-born students obtaining college degrees in S&E has grown only slowly. In response to this concern, we argue that this will change when the earnings and attractiveness of S&E careers improve. Other approaches, such as making K–12 science and math courses more interesting and increasing the number and quality for science and math teachers, may have merit in their own right, but we think they pale in importance to the earnings and attractiveness of S&E careers as major determinants of the supply of U.S.-born students to S&E.
The education attainment of the U.S. population3 has continued to increase. And, the percentage of the U.S. population (ages 25–64) that has at least attained upper secondary education, at 88 percent, compares favorably with an average of 67 percent for the OECD industrialized nations. Rapid growth in the Hispanic population has raised concerns about future education levels of the U.S. population.
3 High school completion rates, college enrollment, and college graduation (bachelor’s, master’s, and doctorate degrees).

Discussion and Recommendations 127
Blacks and Hispanics continue to lag Whites, but they have made great improvements in high school completion rates (though college enroll-ment did not or only marginally increased for Hispanics). Whether Hispanics will catch up with the rest of the population is unclear.
Trends in the United States and abroad suggest that global com-petition for college-educated workers will intensify in the future. The United States added 20 million college-degree workers to the labor force, and the college-educated workforce more than doubled, between 1980 and 2000. But high growth of the college-educated workforce is unlikely to be sustained, and only 8 million additions to this workforce are anticipated between 2000 and 2020 (Ellwood, 2001). Baby boom-ers are beginning to retire, and the demographics are such that few prime-age workers will join the labor force between 2000 and 2020. Europe, Japan, and China also have aging populations and appear to be worse off in this respect than the United States. The college-age population is projected to continue to decrease in Europe, Japan, and China, while that of the United States is anticipated to grow modestly. These decreases in the college-age population may be an incentive for countries to encourage immigration of students from other countries or to increase enrollment rates of their own college-age population.
While much has been said in the public debate over how to improve U.S. education, recent research on early childhood interven-tion (see, e.g., Cawley, Heckman, and Vytkacil, 2001; Bowles, Gintis, and Osborne, 2001; Heckman and Rubinstein, 2001; Cunha et al., 2005) suggests that investment in early child development will have a high social payoff. Thus, the discussion of education reform might be expanded to include early childhood development as a means to improve education attainment in general and perhaps in S&T.
Both noncognitive skills4 and cognitive skills are important in promoting success in school, the labor force, and society at large. The absence of noncognitive skills such as emotional stability in young adults can make behavioral problems more likely to occur, more dif-
4 Noncognitive skills relate to personal or social beliefs, motivations, and attitudes of the individual such as general motivation, perseverance, tenacity, etc; cognitive skills relate to thinking, reasoning, and other intellectual abilities.
128 U.S. Competitiveness in Science and Technology
ficult and costly to correct, and can result in lower levels of adult cog-nitive ability. These skills are developed early in childhood, and while they are partially a matter of genetics, they are also greatly affected by a child’s early environments (abilities are both inherited and created).5 Further, there are critical and sensitive periods in development during which certain abilities can be developed, and, if they are not fully attained during such periods, they require substantial investment to be acquired at later times or may simply be unattainable. Gaps in achieve-ment between the advantaged and disadvantaged typically materialize by third grade and remain stable, indicating that differences in the early development of cognitive and noncognitive skills are far more critical in determining educational and earnings success than varia-tion in later investments. An important implication is that the return to investment in human capital declines with age. Unless we intervene with disadvantaged children to bring up their level of cognitive and noncognitive skills at a very early age, it will be more efficient for later investment to go to the more advantaged children, who already have a strong skill base to benefit from these investments.
S&E Workforce
Annual earnings for the S&E workforce are about 25 percent higher than for the non-S&E workforce for similar levels of education. Also, the S&E workforce has similar unemployment to the non-S&E work-force. Judging by recent versus past wage and unemployment trends, there is no evidence of a current shortage of qualified S&E workers. At any given time, a firm or set of firms within an industry may be
5 There are two principal characteristics of the acquisition of cognitive and noncognitive skills that make early intervention particularly important (Heckman, 2006): (1) self produc-tivity: the notion that skill attainment at one stage of the life cycle raises skill attainment at later stages, and (2) complementarity: the notion that skills attained at one stage raise the pro-ductivity of skill attainment at another (early investment facilitates later investment). These two principles indicate that interventions at earlier ages have a multiplier effect. The develop-ment of early skills makes it easier to learn more advanced skills at later ages in childhood and, through skill complementarity, the productivity of the later skills increases as the level of the early skills increases.

Discussion and Recommendations 129
unable to fill their S&E job openings, but that is true for non-S&E positions as well. However, with rapid growth in R&D worldwide and aging populations, increased global competition for skilled S&E work-ers may result in slower growth of the workforce, making it harder for firms to fill their S&E job openings unless they offer higher wages, which will increase the cost of conducting R&D. While not apparent in the data yet, such potential trends are worth monitoring.
The United States has benefited from the inflow of foreign S&E students, many of whom subsequently stay, and from direct immigra-tion of workers with education in S&E obtained abroad. The share of non-U.S. citizens in the science and engineering workforce increased from 6 percent in 1994 to 12 percent in 2006.6 The immigration of foreign scientists and engineers along with inflow from non-S&E occu-pations to S&E occupations help to explain how it has been possi-ble for the United States to have fast growth in S&E employment, of about 4.2 percent per year since 1980, but relatively slow growth in S&E degree production, about 1.5 percent per year. This suggests too that foreigners have helped to hold down S&E wage increases, thereby reducing the cost of U.S. research. Also, because many foreign students come to the United States with a secondary education or a college edu-cation, the United States has not had to bear the cost of that educa-tion. Technological and scientific innovation is the engine of U.S. eco-nomic growth, and human talent is the main input that generates this growth. Immigration of highly skilled scientists and engineers allows the United States to employ many of the best and brightest from a global pool of talent. The United States chooses its immigrants well: The foreign S&E workforce is young (the largest immigration has been in the 21-to-35 age group) and highly skilled (wage data suggest that the quality of the foreign S&E workforce is as good as that of U.S. citi-zens). Further, while some immigrants eventually return home, many do not and remain in the United States indefinitely. The increasing numbers of foreign students in S&E and the increase in stay rates sug-gest that the United States remains a very attractive setting in which to
6 In contrast, the share of non-U.S. citizens in the non-S&E workforce remained constant, at 5 percent for similar levels of education (bachelor’s degree and higher).
130 U.S. Competitiveness in Science and Technology
study and/or conduct research. While anecdotal evidence may suggest that foreign scientists and engineers are increasingly returning home, various studies indicate that the numbers are still small and that the United States remains a net recipient of foreign highly skilled talent. Nevertheless, it is worth watching trends in the number of foreign S&E workers returning home. It is not unreasonable to believe that the reduction of the annual cap on H1-B visa for skilled labor could reduce stay rates and skilled immigrant worker inflows. In addition, given that stay rates are higher for developing than for developed nations, sig-nificant economic development of China and India, whose nationals contribute significantly to the U.S. S&E workforce, could offer increas-ingly attractive opportunities “back home,” which may increase return migration and reduce stay rates. Also, some U.S. S&E workers now spend part of their time working for their home country, and graduates and S&E workers returning home or working part time for their home country could speed the transmission (outflow) of U.S. discoveries to other countries.
The diminishing share of degrees awarded to U.S. citizens, par-ticularly doctoral and master’s, suggests that S&E careers are becom-ing less attractive to U.S. citizens. Perhaps fewer U.S. students apply to S&E doctoral or master’s programs, or perhaps those who apply are not as well prepared as foreign applicants. The case for increasing the number of U.S.-born S&E graduates rests on whether the increased employment of foreign-born S&E workers makes the U.S. economy and national security vulnerable to foreign competitors and adver-saries, respectively. Wage data, for example, do not show a premium for U.S.-born graduates, i.e., there appears to be no market prefer-ence for native-born scientists and engineers over foreign born. (But maybe defense firms do pay a premium—this warrants further study.) National security-related jobs requiring U.S.-born S&E workers are apparently a small portion of the market (Butz et al., 2004). Yet each corporation and public agency must take stock of its own manpower needs, in particular their needs for U.S. citizens with a security clear-ance. A well-known exception to preferring native-born S&E workers was the use of German rocket scientists in developing U.S. missiles. A shortage of native-born S&E workers in a particular market should
Discussion and Recommendations 131
cause wages to increase, which would increase the short- and long-run supply of new U.S.-born S&E workers to this market, attract qualified native scientists and engineers from other markets, and increase the retention of those already in the market. If private firms and public organizations are prohibited by law from discriminating on the basis of national origin, they may be reluctant to introduce (or seek permission for) wage premiums for native S&E workers over foreign-born. Still, the actual demand for native scientists and engineers is not known or readily observed, and it may be that the current and foreseeable future supply is adequate to meet the demand—again recognizing that, at any moment, some positions will go unfilled.
In reflecting on current proposals to increase the number of U.S. students in S&E education, an increase in supply, other things being equal, will lead to lower salaries, which would feed back to deter later cohorts of students from entering S&E. For supply-expansion poli-cies to be successful, individuals must expect that their salary as an S&E professional will be higher, relative to that in non-S&E, than it is today. But current wage data do not indicate faster wage growth in S&E. As mentioned, the inflow of foreign S&E students and foreign-educated S&E workers has probably helped to hold down the rate of increase in S&E wages. As it is, median wage growth has been nearly the same in the S&E market for college-educated workers as in the non-S&E market. Higher salaries are not the only way to increase the supply of S&E workers. Other monetary incentives, such as scholar-ships, fellowships, and subsidized financial aid, can make a difference. Career decisions and job decisions also depend on intrinsic satisfaction, and that may depend on whether work will be challenging and person-ally meaningful, whether the conditions of work (equipment, fund-ing, facilities, hours, colleagues) are attractive, and whether there is opportunity for professional advancement. Intrinsic satisfaction might depend on childhood experiences, e.g., whether math and science classes were interesting and well taught, whether social peers approved of such courses, and on parental encouragement.
Given the benefits associated with the foreign S&E workforce, the United States is likely to be worse off if foreign access to U.S. gradu-ate education and S&E jobs is limited. Presumably, to establish the
132 U.S. Competitiveness in Science and Technology
opposite, i.e., that the United States is negatively affected overall by its growing reliance on foreign-born S&E graduates, a case would have to be made along any of the following lines (and perhaps others): that the expansion of foreign-born S&E workers in the U.S. workforce has led to faster and more widespread transmission of U.S. technological discoveries to foreign countries, who are now capitalizing on them by developing new or cheaper products to the detriment of U.S. firms; that sensitive technology and know-how are flowing to adversaries, who will use it against the United States; or that, by holding down wage growth in S&E, the expansion of the foreign-born S&E work-force has reduced the supply of new U.S.-born S&E workers, some of whom would have entered hard-to-fill national security positions. Pos-sibilities such as these may warrant further study.
The foreign S&E workforce is young, highly skilled, and a strong asset to the United States. It is ironic for the United States to worry about receiving increasing numbers of foreigners, while foreign coun-tries are concerned about losing their best and brightest (see e.g., Third European Report on Science and Technology Indicators, 2003). The United States has been an attractive place for the world’s scientists and engineers to live and work and should strive to remain so. Good job opportunities, globally competitive salaries, a diverse range of research activities, solid research funding, world-class facilities, intellectual leadership, and intellectual property protection are all ingredients in this. To encourage foreign S&E talent to stay, the United States could offer automatic one-year visa extensions upon completion of U.S. study in S&E, thereby allowing foreigners to find employment instead of requiring them to return home. It could also offer accelerated visa and green card procedures, with preference for foreign S&E talent (both U.S.- and non-U.S. educated) and increase the number of visa and green cards for this category. Research on stay rates of foreign recipients of U.S. doctorate degrees suggests that employment and immigration conditions around the time of completion of the doctorate degree are crucial in determining stay rates. Today, about 70 percent of foreign recipients of U.S. doctorate degrees in S&E stay in the United States for at least two years, and this percentage has increased from 50 per-cent in the 1990s. Research has further shown that 10-year stay rates
Discussion and Recommendations 133
do not differ much from short term stay rates, suggesting that about 70 percent of PhD graduates in S&E may stay in the United States indefinitely.
In this report we have focused primarily on U.S. competitive-ness in S&T without considering the implications for national secu-rity. The Defense Science Board report on Globalization and Security (1999; see also Hicks, 2001) and Segal (2007) argue that globalization of S&T makes the United States less capable of denying other nations access to advanced technology to maintain a wide military capability gap between itself and potential adversaries. Technological capability is more widely diffused to potential competitors and may provide adver-saries with capability to pursue nontraditional strategies and tactics on the battlefield or through insurgency and terrorism. But although today there may be more outflow of U.S. technology, the success (lead-ership) of the United States in S&T has been highly attractive to for-eign scientists and engineers, which has benefited the United States. Further, the United States has been willing to invest far more than other countries in implementing defense and national security technol-ogy and providing the training and leadership needed to make its use effective. That is, technology is only one factor in determining military capability. Also, as the U.S. military-industrial base has become less dedicated to defense, less domestic, and more international, commer-cial and nondefense-oriented, it has also become more agile in taking advantage of advances that were occurring more rapidly in the com-mercial sector than in the custom-made military sector.
As Hicks et al. (2001) conclude, attempts to regulate or limit the diffusion of some (but not all) sensitive defense technology can have harmful long-term consequences and might not even be benefi-cial in the short term. This point has been recognized in the unin-tended consequences of the attempt to identify and limit the export of sensitive technology. In cases where the technology was available through providers in other countries, the policy did not succeed in slowing the diffusion of such technology but only hampered exporting by U.S. firms (Hicks et al., 2001). Such efforts may in fact have the unintended consequence of weakening U.S. firms’ competency in areas crucial to national defense by limiting access to global markets, while

134 U.S. Competitiveness in Science and Technology
at the same time foreign firms without such restrictions find them-selves with increased opportunities and incentive to build competency in these key areas. The implications may be that the United States not only needs to continue efforts to identify sensitive technology, but also to appraise the availability of the technology via foreign sources. In some instances, such as nuclear or biological weapons, the scientific knowledge to produce a bomb or virus is far more dangerous when paired with the facilities and expertise to put it to use, so it is equally important to monitor production capacity as well. A Defense Science Board report agrees with this assessment (Hicks et al., 2001) and fur-ther argues that the DoD should determine a “short list” of essential capabilities, analyze and assess vulnerabilities, mitigate risks to system integrity, stop reviewing export license applications for arms transfers when technologies are readily available on the world market, maintain an interagency database for rapid and authoritative determination of the foreign availability of particular militarily relevant technologies and capabilities, and prioritize security for integrated systems that directly support military capabilities.
Recommendations for Policy- and Decisionmakers
Our findings indicate that the United States is still performing quite well on many measures of S&T prowess and that, to sustain this lead-ership, the United States must continue to invest heavily in S&T. We make the following recommendations for policy- and decisionmakers to consider:
Establish a permanent commitment to a funded, chartered entity responsible for periodically monitoring, critically reviewing, and analyzing U.S. S&T performance and the condition of the S&E workforce.
Fundamental steps toward ensuring that the United States continues to benefit from its strength in S&T are to sustain U.S. leadership in basic and applied research and to keep salaries and job conditions competitive so that the United States remains an
Discussion and Recommendations 135
attractive place for the world’s scientists and engineers to live and work. Regular monitoring and analysis of S&T performance and the condition of the S&E workforce will provide timely, relevant, objective information to policymakers to aid them in addressing adverse trends and improving U.S. S&T.
The National Science Foundation already collects and mon-itors relevant information, the Office of Science and Technol-ogy Policy advises the President and others within the Executive Office of the President on the effects of science and technology on domestic and international affairs, and numerous organizations have established committees of experts and stakeholders that pro-vide their assessment of particular issues relating to U.S. S&T. Yet critical review and assessment of information on S&T per-formance and the condition of the S&E workforce has proved difficult. For example, shortages of S&E workers have been pre-dicted, but the predictions have proved inaccurate. The plethora of advice, the sometimes fragmented nature of the advice (that is addressing one particular issue rather than S&T as a whole), and the closeness of some organizations to stakeholders or the execu-tive office points to the need for a coherent, centrally coordinated, objective, and independent research agenda with a long-term view on S&T and the S&E workforce.
The entity to carry out the agenda could be, for example, a nonpartisan commission appointed every four years by the President, an interagency commission, or a nonfederal, nonprofit foundation. The commitment to convene such an entity should be permanent, because U.S. leadership in science and technology and the U.S. science and engineering workforce are enduring con-cerns. The entity should be funded so that it can commission and fund studies relevant to whatever issues are current. Such stud-ies, conducted by experts in academia and research organizations, should be published and also would serve as input into a final, published report on U.S. S&T performance and the condition of the S&E workforce. Finally, the entity should be chartered not only as a matter of defining its purpose, objective, and scope but also to enable it to operate independently and produce objective,
136 U.S. Competitiveness in Science and Technology
rigorous, nonpartisan analyses. Research topics that could be cov-ered include the demand and supply of S&E workers, education, quality of education, training, employment, career progression, wages, in-migration, out-migration, offshoring, outsourcing, and the condition, performance, and economic impact of the S&T enterprise, e.g., in terms of patents, publications, citations, inno-vative products and services. Facilitate the temporary and indefinite stay of foreigners who graduated in S&E from U.S. universities, for example, by offer-ing them one-year automated visa extensions to seek work in the United States after completion of their study. Research on stay rates of foreign recipients of U.S. doctorate degrees suggests that conditions (employment and immigration) right around the time of completion of the doctorate degree are crucial in determining the likelihood of a long stay.Facilitate the immigration of highly skilled labor, in particu-lar in S&E, to ensure that the benefits of expanded innovation, including spillovers, accrue to the United States and to ensure the United States remains competitive in research and innova-tion. Immigration allows the United States to draw from the best and brightest of a global rather than national talent pool, likely reduces the offshoring of R&D (which is driven by both the need for cost reductions and to access highly skilled talent), and keeps the cost of research down. While immigration may reduce the attractiveness of S&E careers to U.S. citizens, at the same time, the total number of highly skilled individuals (foreigners plus U.S. citizens) has likely increased through immigration, and human talent is the main input that generates growth in today’s knowl-edge driven economy.Increase capacity to learn from science centers in Europe, Japan, China, India, and other countries to benefit from scientific and technological advances made elsewhere. The United States could do this by promoting joint ventures, encouraging collaborative research with researchers in other countries, supporting U.S. researchers and students to participate in foreign R&D centers (e.g., through fellowships, positions in foreign laboratories of

Discussion and Recommendations 137
multinationals, graduate studies abroad, sabbaticals, postdoctoral positions, etc.), and establishing informal networks with S&E workers who studied in the United States. Foreign-born S&E workers may also help in establishing links to foreign centers of R&D excellence. Continue to improve K–12 education in general and S&T edu-cation in particular, as human capital is a main driver of eco-nomic growth and well-being. In this regard, recent research on early childhood development emphasizes the importance of cer-tain investments during early childhood as a foundation for later investments during childhood. This new research on childhood development offers a novel viewpoint that substantially alters and enlarges the usual perspective regarding “interventions” to develop science and math skills and understanding in children and teens. It raises the possibility of placing more emphasis on early child-hood development as a means to improve education attainment in general and more specifically in S&T. This possibility may deserve rigorous investigation through pilot programs or through the analysis of data from naturally occurring treatments.
In this research we have encountered areas for which substantial knowledge appears to be lacking and that may benefit from further research. We recommend that consideration be given to research on the following:
factors affecting the recruiting and retention of foreign S&E talent (i.e., a study on the decision of foreign students to do graduate and undergraduate work in the United States and to seek work in the United States after graduation, and on the decision of foreign S&E employees or recent graduates to seek work in the United States and to stay in the United States)the idea that U.S. leadership in S&E resides in a relatively small number of highly talented individuals (i.e., studying the nature of this leadership, the ability of the United States to continue to attract these individuals, and the consequences of not being able to do so)

138 U.S. Competitiveness in Science and Technology
whether and how increased employment of foreign-born S&E workers makes the United States vulnerable even as such workers add to the strength of the U.S. economy.

139
APPENDIX
Current Population Survey Data Analysis
This appendix provides details on our analysis of Current Population Survey data on the wages of the science and engineering workforce.
Description of CPS Data
Current Population Survey (CPS) figures are constructed using the 1989–2006 Annual Social and Economic (ASEC) Supplements col-lected by the Bureau of the Census for the Bureau of Labor Statistics. Of the 2,927,717 individuals represented in the 18 surveys, 278,089 are full-year, full-time workers1 who report annual earnings of $10,000 or more in a given year2 and have obtained at least a bachelor’s degree,3 and thus make up the sample used in this analysis (see Tables A.2 and A.3 for more details). CPS tabulations use the person weight.
1 Full-time workers are those who usually worked 35 hours or more per week for 50 weeks or more during the preceding calendar year. 2 The variable used for this exclusion restriction is “pearnval,” total person earnings.3 Individuals who report 16 or more years of schooling in the 1989–1991 surveys, as well as those whose highest grade achieved is a bachelor’s degree, master’s degree, professional school degree, or doctorate degree in the 1992–2006 surveys, are considered to have at least a bachelor’s degree.
140 U.S. Competitiveness in Science and Technology
Occupational Categories
The population of non-scientists and -engineers, as well as medical doctors and lawyers, is constructed using “a_occ” in the 1989–1994 and 1996–2002 CPSs, “pei01ocd” in the 1995 CPS, and “peioocc” for 1993–2006. Specifically, life scientists, physical scientists, social scien-tists, mathematicians and computer scientists, engineers, medical doc-tors, and lawyers are defined according to the occupational codes in Table A.1.
Citizenship
Individuals in the CPS are identified as non-U.S. citizens according to “prcitshp” in the 1994–2006 Current Population Surveys.4 Participants whose response is “foreign born, not a citizen of the United States” are classified as non-U.S. citizens, and those who are citizens by way of birth, U.S. citizen parents, and naturalization are considered citizens.
4 Survey respondents were asked about their citizenship beginning in the 1994 Current Population Survey. Prior to that year, there is no information on an individual’s citizenship.
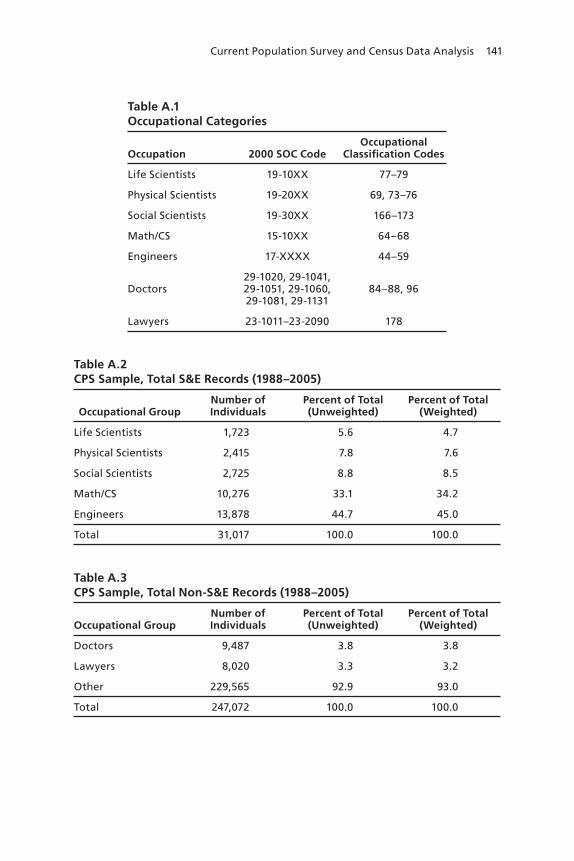
Current Population Survey and Census Data Analysis 141
Table A.1Occupational Categories
Occupation 2000 SOC CodeOccupational
Classification Codes
Life Scientists 19-10XX 77–79
Physical Scientists 19-20XX 69, 73–76
Social Scientists 19-30XX 166–173
Math/CS 15-10XX 64–68
Engineers 17-XXXX 44–59
Doctors29-1020, 29-1041, 29-1051, 29-1060, 29-1081, 29-1131
84–88, 96
Lawyers 23-1011–23-2090 178
Table A.2CPS Sample, Total S&E Records (1988–2005)
Occupational GroupNumber of Individuals
Percent of Total(Unweighted)
Percent of Total (Weighted)
Life Scientists 1,723 5.6 4.7
Physical Scientists 2,415 7.8 7.6
Social Scientists 2,725 8.8 8.5
Math/CS 10,276 33.1 34.2
Engineers 13,878 44.7 45.0
Total 31,017 100.0 100.0
Table A.3CPS Sample, Total Non-S&E Records (1988–2005)
Occupational GroupNumber of Individuals
Percent of Total(Unweighted)
Percent of Total (Weighted)
Doctors 9,487 3.8 3.8
Lawyers 8,020 3.3 3.2
Other 229,565 92.9 93.0
Total 247,072 100.0 100.0


143
References
109th Congress, S. 2109, “National Innovation Act of 2005,” introduced December 15, 2005. As of February 27, 2008: http://thomas.loc.gov/cgi-bin/bdquery/z?d109:s.02109:
———, H.R. 4434, “10,000 Teachers, 10 Million Minds Science and Math Scholarship Act,” introduced December 16, 2005. As of February 27, 2008: http://thomas.loc.gov/cgi-bin/bdquery/z?d109:h.r.04434:
———, H.R. 4596, “Sowing the Seeds through Science and Engineering Research Act,” introduced December 16, 2005. As of February 27, 2008: http://thomas.loc.gov/cgi-bin/bdquery/z?d109:h.r.04596:
———, S. 2197, “Protecting America’s Competitive Edge Through Energy (PACE-Energy) Act,” introduced January 26, 2006. As of February 27, 2008: http://thomas.loc.gov/cgi-bin/bdquery/z?d109:s2197:
———, S. 2357, “Right Time to Reinvest in America’s Competitiveness and Knowledge (Right TRACK) Act,” introduced March 2, 2006. As of February 27, 2008: http://thomas.loc.gov/cgi-bin/bdquery/z?d109:s2357:
Abbott, A., “EU Science Fund Targets Young Guns,” Nature, Vol. 441, No. 7094, June 8, 2006, p. 672.
Adams, James D., “Endogenous R&D Spillovers and Industrial Research Productivity,” Cambridge, Mass.: National Bureau of Economic Research, Working Paper 7484, January 2002. As of February 28, 2008: http://www.nber.org/papers/w7484
Adams, Jonathan, “Scientific Wealth and the Scientific Investments of Nations,” in Titus Galama and James Hosek, eds., Perspectives on U.S. Competitiveness in Science and Technology, Santa Monica, Calif.: RAND Corporation, CF-325-OSD, 2007. As of February 28, 2008: http://www.rand.org/pubs/conf_proceedings/CF235
144 U.S. Competitiveness in Science and Technology
American Association for the Advancement of Science, AAAS Report I through XXXII, 1976–2007.
———, AAAS Report XXXII: Research and Development FY 2008, Washington, D.C., 2007. As of February 28, 2008: http://www.aaas.org/spp/rd/rd08main.htm
Andres, Gillian, “The Cost of Doing Business: Should the United States Create Incentives for STEM Labor?” Washington Watch, March 2006. As of February 28, 2008: http://www.aibs.org/washington-watch/washington_watch_2006_03.html
Associated Press, “Bush: Outsourcing Does Hurt U.S.,” Fox News.com, March 3, 2006. As of February 28, 2008: http://www.foxnews.com/printer_friendly_story/0,3566,186791,00.html
Augustine, Norman R., testimony before the U.S. House of Representatives Committee on Science for the hearing on “Science, Technology and Global Economic Competitiveness,” October 20, 2005. As of February 28, 2008: http://commdocs.house.gov/committees/science/hsy24132.000/hsy24132_0.htm
Autor, David H., Lawrence F. Katz, and Melissa S. Kearney, “The Polarization of the U.S. Labor Market,” Cambridge, Mass.: National Bureau of Economic Research, Working Paper 11986, 2006. As of February 28, 2008: http://www.nber.org/papers/w11986.pdf
Baumol, William J., “Productivity Growth, Convergence, and Welfare: What the Long-Run Data Show,” American Economic Review, Vol. 76, No. 5, 1986, pp. 1072–1085.
Bernard, Andrew B., and Steven N. Durlauf, “Convergence in International Output,” Journal of Applied Econometrics, Vol. 10, No. 2, 1995, pp. 97–108.
Bhidé, Amar, “Venturesome Consumption, Innovation and Globalization,” paper for the Venice Summer Institute 2006, “Perspectives on the Performance of the Continent’s Economies,” July 21–22, 2006. As of February 28, 2008: http://www.cesifo-group.de/link/vsi06_ep_bhide-new.pdf
Boehlert, Sherwood, opening statement before the U.S. House of Representatives Committee on Science for the hearing on “Science, Technology and Global Economic Competitiveness,” October 20, 2005. As of February 28, 2008: http://commdocs.house.gov/committees/science/hsy24132.000/hsy24132_0.htm
Bordogna, Joseph, “Over the Horizon: The Powerful Context for Future R&D Initiatives,” speech by Deputy Director and Chief Operating Officer Bordogna of the National Science Foundation at the Engineering R&D Symposium, Washington, D.C., March 8, 2004. As of February 28, 2008: http://www.nsf.gov/news/speeches/bordogna/04/jb040308engsymp.jsp

References 145
Bowles, Samuel, Herbert Gintis, and Melissa Osborne “The Determinants of Earnings: A Behavioral Approach,” Journal of Economic Literature, Vol. 39, No. 4, 2001, pp. 1137–1176.
Broache, Anne, “Is a Global High-Tech Work Force Bad for U.S.?” CNET News.com, March 20, 2006. As of February 28, 2008: http://www.news.com/2102-1022_3-6051686.html
Business Roundtable, Tapping America’s Potential: The Education for Innovation Initiative, Ewing Marion Kauffman Foundation, July 2005. As of February 28, 2008: http://www.kauffman.org/items.cfm?itemID=632
Butz, William P., Terrence K. Kelly, David M. Adamson, Gabrielle A. Bloom, Donna Fossum, and Mihal E. Gross, Will the Scientific and Technology Workforce Meet the Requirements of the Federal Government?, Santa Monica, Calif.: RAND Corporation, MG-118-OSTP, 2004. As of February 28, 2008: http://www.rand.org/pubs/monographs/MG118/
Cao, Cong, Richard P. Suttmeier, and Denis F. Simon, “China’s 15-Year Science and Technology Plan,” Physics Today, Vol. 59, No. 12, December 2006, pp. 38–43. As of February 28, 2008: http://scitation.aip.org/journals/doc/PHTOAD-ft/vol_59/iss_12/38_1.shtml
Cawley, John, James Heckman, and Edward Vytkacil, “Three Observations on Wages and Measured Cognitive Ability,” Labour Economics, Vol. 8, No. 4, 2001, pp. 419–442.
Chapa, Jorge, and Belinda de la Rosa, “Latino Population Growth, Socioeconomic and Demographic Characteristics, and Implications for Educational Attainment,” Education and Urban Society, Vol. 36, No. 2, February 2004, pp. 130–149.
Chapa, Jorge, and Richard Valencia, “Latino Population Growth, Demographic Characteristics, and Educational Stagnation: An Examination of Recent Trends,” Hispanic Journal of Behavioral Sciences, Vol. 15, No. 2, May 1993, pp. 165–187.
Cohen, Wesley M., Richard R. Nelson, and John P. Walsh, “Protecting Their Intellectual Assets: Appropriability Conditions and Why U.S. Manufacturing Firms Patent (or Not),” Cambridge, Mass.: National Bureau of Econonic Research, Working Paper 7552, 2000. As of February 28, 2008: http://www.nber.org/papers/w7552
Couto, Vinay, Mahadeva Mani, Arie Y. Lewin, and Carine Peeters, “The Globalization of White-collar Work: The Facts and Fallout of Next-Generation Offshoring,” Booz Allen Hamilton, 2006. As of February 28, 2008: http://www.boozallen.com/media/file/Globalization_White_Collar_Work_v3.pdf
Cunha, Flavio, James J. Heckman, Lance Lochner, and Dimitriy V. Masterov, “Interpreting the Evidence on Life Cycle Skill Formation,” in Eric Hanushek and Finis Welch, eds., Handbook of the Economics of Education, New York: Elsevier, 2005.

146 U.S. Competitiveness in Science and Technology
Defense Science Board, Final Report of the Defense Science Board Task Force on Globalization and Security, 1999. As of February 28, 2008: http://www.acq.osd.mil/dsb/reports/globalization.pdf
DeLong, J. Bradford, “Productivity Growth, Convergence, and Welfare: Comment,” American Economic Review, Vol. 78, No. 5, 1988, pp. 1138–1154.
DeLong, J. Bradford, Claudia Goldin, and Lawrence F. Katz, “Sustaining U.S. Economic Growth,” in Henry J. Aaron, James M. Lindsay, and Pietro S. Nivola, eds., Agenda for the Nation, Washington, D.C.: Brookings Institution Press, 2003, pp. 17–60.
Dernis, H., and M. Khan, “Triadic Patent Families Methodology,” OECD Science, Technology and Industry Working Papers, OECD Publishing, 2004.
Domar, Evsey D., “Capital Expansion, Rate of Growth, and Employment,” Econometrica, Vol. 14, No. 2, 1946, pp. 137–147.
Domestic Policy Council, Office of Science and Technology Policy, American Competitiveness Initiative: Leading the World in Innovation, February 2006. As of February 28, 2008: http://www.whitehouse.gov/stateoftheunion/2006/aci/aci06-booklet.pdf
Duga, Jules, Martin Grueber, and Tim Studt, “2007 R&D Funding Forecast,” R&D Magazine, January 2007. As of February 28, 2008: http://www.rdmag.com/pdf/RD0701FundingForecast.pdf
Eaton, Jonathan, and Samuel Kortum, “Innovation, Diffusion, and Trade,” Cambridge, Mass.: National Bureau of Economic Research, Working Paper 12385, July 2006. As of February 28, 2008: http://www.nber.org/papers/w12385
Eaton, Jonathan, and Samuel Kortum, “National Security in a Knowledge Based Global Economy,” in Titus J. Galama and James Hosek, eds., Perspectives on U.S. Competitiveness in Science and Technology, Santa Monica, Calif.: RAND Corporation, CF-325-OSD, 2007. As of February 28, 2008: http://www.rand.org/pubs/conf_proceedings/CF235
The Economist, “On Their Way Back,” November 6, 2003.
———, “Venturesome Consumption,” July 27, 2006.
Ehlers, Vernon J., prepared statement for U.S. House of Representatives, Committee on Science, Subcommittee on Environment, Technology, and Standards, hearing on “Science, Technology and Global Competitiveness,” October 20, 2005, As of February 28, 2008: http://commdocs.house.gov/committees/science/hsy24132.000/hsy24132_0.HTM
Ellwood, David T., “The Sputtering Labor Force of the Twenty-First Century: Can the U.S. Experience Be Sustained and Replicated?” in Alan Krueger and Robert Solow, eds., The Roaring Nineties: Can Full Employment Be Sustained? New York: Russell Sage Foundation, 2001, pp. 421–489.

References 147
Euractiv, “Lisbon Agenda,” August 17, 2004a. As of February 28, 2008: http://www.euractiv.com/en/future-eu/lisbon-agenda/article-117510
———, “Growth and Jobs: Relaunch of the Lisbon Strategy,” November 4, 2004b. As of February 28, 2008: http://www.euractiv.com/en/innovation/growth-jobs-relaunch-lisbon-strategy/article-131891
Farrell, John Aloysius, “Signs America’s Scientific Edge Is Slipping,” Denver Post, March 26, 2006, p. E-01.
Finn, Michael G., “Stay Rates of Foreign Doctorate Recipients from U.S. Universities,” Oak Ridge Institute for Science and Education, 2005. As of February 28, 2008: http://orise.orau.gov/sep/files/stayrate05.pdf
Freeman, Richard, “Does Globalization of the Scientific Engineering Workforce Threaten U.S. Economic Leadership?” Cambridge, Mass.: National Bureau of Economic Research, Working Paper 11457, 2006. As of February 28, 2008: http://www.nber.org/papers/w11457
———, “Globalization of the Scientific/Engineering Workforce and National Security,” in Titus J. Galama and James Hosek, eds., Perspectives on U.S. Competitiveness in Science and Technology, Santa Monica, Calif.: RAND Corporation, CF-325-OSD, 2007. As of February 28, 2008: http://www.rand.org/pubs/conf_proceedings/CF235
Galama, Titus, J., and James Hosek, eds., Perspectives on U.S. Competitiveness in Science and Technology, Santa Monica, Calif.: RAND Corporation, CF-325-OSD, 2007. As of February 27, 2008: http://www.rand.org/pubs/conf_proceedings/CF235
Geary, David C., and Carmen O. Hamson, “Improving the Mathematics and Science Achievement of American Children: Psychology’s Role,” 2007. As of February 28, 2008: http://www.apa.org/ed/geary.html
Gereffi, Gary, Vivek Wadwha, Roopa Unnikrishnan, and Rich Schroth, “Framing the Engineering Outsourcing Debate: Placing the United States on a Level Playing Field with China and India,” Duke University, Master of Engineering Management Program, Pratt School of Engineering, 2006.
Heckman, James J., “Skill Formation and the Economics of Investing in Disadvantaged Children,” Science, Vol. 312, No. 5782, June 2006, pp. 1900–1902.
Heckman, James J., and Yona Rubinstein, “The Importance of Noncognitive Skills: Lessons from the GED Testing Program,” American Economic Review, Vol. 91, No. 2, May 2001, pp. 145–149.

148 U.S. Competitiveness in Science and Technology
Hicks, Donald, “Prepared Testimony of Dr. Donald Hicks Representing the Defense Science Board Task Force on Globalization and Security,” Hearing on Establishing an Effective Modern Framework for Export Controls, Second Hearing in a Series, February 14, 2001.
House Science and Technology Committee, “In Testimony Before Appropriators, Rep. Boehlert Urges Funding for American Competitiveness Institute,” press release, SpaceRef.com, April 6, 2006. As of February 28, 2008: http://www.spaceref.com/news/viewpr.html?pid=19464
Kelley, Matt, “Report: U.S. Missile Science Slumping,” USA Today, March 23, 2006. As of February 28, 2008: http://www.usatoday.com/news/washington/2006-03-23-missile-science_x.htm
Kendrick, John W., “Productivity Trends: Capital and Labor,” Review of Economics and Statistics, Vol. 38, No. 3, August 1956, pp. 248–257.
King, David, “The Scientific Impact of Nations,” Nature, Vol. 430, 2004, pp. 311–316.
Krugman, Paul, “Competitiveness: A Dangerous Obsession,” Foreign Affairs, March/April 1994.
Laird, Jennifer, Matthew DeBell, and Chris Chapman, Dropout Rates in the United States: 2004, Washington, D.C.: National Center for Education Statistics, NCES 2007-024, 2006. As of February 28, 2008: http://nces.ed.gov/PUBSEARCH/pubsinfo.asp?pubid=2007024
May, R. M., “The Scientific Wealth of Nations,” Science, Vol. 275, No. 5301, February 1997, pp. 793–796.
———, “The Scientific Investments of Nations,” Science, Vol. 281, No. 5373, July 1998, pp. 49–51.
McCluskey, Neal, “A Real Competitiveness Initiative,” Cato Institute, March 18, 2006. As of February 28, 2008: http://www.cato.org/pub_display.php?pub_id=6010
Millard, D., “The Impact of Clustering on Scientific Mobility: A Case Study of the UK,” Innovation: The European Journal of Social Science Research, Special Issue: Scientific Mobility in the European Research Area: Promoting Balanced Growth, Vol. 18, No. 3, 2005, pp. 343–359.
Mishel, Lawrence, and Joydeep Roy, Rethinking High School Graduation Rates and Trends, Washington, D.C.: Economic Policy Institute, 2006. As of February 28, 2008: http://www.epinet.org/content.cfm/book_grad_rates

References 149
Morgridge, John P., testimony before the U.S. House of Representatives Committee on Science for the hearing on “U.S. Competitiveness: The Innovation Challenge,” July 21, 2005. As of February 28, 2008: http://commdocs.house.gov/committees/science/hsy22550.000/hsy22550_0.htm
National Academy of Sciences, National Academy of Engineering, Institute of Medicine, Committee on Science, Engineering and Public Policy, Rising Above the Gathering Storm: Energizing and Employing America for a Brighter Economic Future, Washington D.C.: National Academies Press, 2006. As of February 28, 2008: http://www.nap.edu/catalog.php?record_id=11463
National Association of Manufacturers, The Looming Workforce Crisis: Preparing American Workers for 21st Century Competition, 2005. As of February 28, 2008: http://www.nam.org/s_nam/bin.asp?CID=202592&DID=235064&DOC= FILE.pdf
National Center for Education Statistics, homepage, undated. As of March 2, 2008: http://nces.ed.gov/
———, Digest of Education Statistics, annual. As of March 2, 2008: http://nces.ed.gov/programs/digest/
———, “High School and Beyond,” First Followup survey; “1990 High School Transcript Study,” and “High School Transcript Study,” various years (Table 141 prepared November 2002). As of February 28, 2008: http://nces.ed.gov/programs/digest/d02/dt141.asp
———, “National Assessment of Educational Progress (NAEP),” selected years, 1971–2004, “Long-Term Trend Summary Data Tables,” 2004. As of February 28, 2008: http://nces.ed.gov/nationsreportcard/ltt/results2004/2004_sdts.asp
———, The Condition of Education, 2006, 2006. As of February 28, 2008: http://nces.ed.gov/pubs2006/2006071.pdf
National Research Council, Committee on Dimensions, Causes, and Implications of Recent Trends in Careers of Life Scientists, Trends in the Early Careers of Life Scientists, Washington, D.C.: National Academies Press, 1998. As of February 28, 2008: http://www.nap.edu/catalog.php?record_id=6244#toc
———, Condensed-Matter and Materials Physics: The Science of the World Around Us, Committee on Condensed-Matter and Materials Physics 2010, Board on Physics and Astronomy, Division on Engineering and Physical Sciences, prepublication draft, 2007. As of February 28, 2008: http://www7.nationalacademies.org/bpa/CMMP2010.html
National Science Board, Science and Engineering Indicators 2006, 2006a. As of February 28, 2008: http://www.nsf.gov/statistics/seind06/

150 U.S. Competitiveness in Science and Technology
———, America’s Pressing Challenge—Building a Stronger Foundation (a companion to Science and Engineering Indicators 2006 ), 2006b. As of February 28, 2008: http://www.nsf.gov/statistics/nsb0602/
National Science Foundation, Scientists and Engineers Statistical Data System, “2003 Education Codes and Groups,” undated-a. As of March 2, 2008: http://sestat.nsf.gov/docs/ed03maj.html
———, Scientists and Engineers Statistical Data System, “2003 Occupation Codes and Groups,” undated-b. As of March 2, 2008: http://sestat.nsf.gov/docs/ed03maj.html
———, Division of Science Resources Statistics, Federal Funds for Research and Development: Fiscal Years 1970–2003; Federal Obligations for Research by Agency and Detailed Field of Science and Engineering, NSF 04-335, Project Officer, Ronald L. Meeks, Arlington, Va., 2004. As of February 28, 2008: http://www.nsf.gov/statistics/nsf04335/front.htm
———, “Science Leaders Cite a ‘Changed World’ in Call for Bold Efforts to Improve K–12 Science and Mathematics Education,” press release 06-034, February 23, 2006. As of February 28, 2008: http://www.nsf.gov/news/news_summ.jsp?cntn_id=105847
———, Division of Science Resources Statistics, “Science and Engineering Degrees: 1966–2004,” Detailed Statistical Tables, January 2007. As of March 2, 2008: http://www.nsf.gov/statistics/nsf07307/content.cfm?pub_id=3634&id=2
———, Division of Science Resources Statistics, National Patterns of Research and Development Resources: 2003, NSF 05-308, Arlington, Va., 2005. As of March 14, 2008: http://www.nsf.gov/statistics/nsf05308/pdf/nsf05308.pdf
National Summit on Competitiveness, Investing in U.S. Innovation, December 2005. As of February 28, 2008: http://www.nam.org/s_nam/sec.asp?CID=202444&DID=235831
New Commission on the Skills of the American Workforce, Tough Choices or Tough Times, National Center on Education and the Economy, 2007. As of February 28, 2008: http://www.skillscommission.org/executive.htm
Newman, Richard J., “Can America Keep Up? Why So Many Smart Folks Fear That the United States Is Falling Behind in the Race for Global Economic Leadership,” U.S. News & World Report, March 19, 2006. As of February 28, 2008: http://www.usnews.com/usnews/biztech/articles/060327/27global.htm
OECD—see Organisation for Economic Co-operation and Development.
References 151
Office of Congresswoman Nancy Pelosi, “Pelosi Unveils Innovation Agenda, Part of Vision for a Stronger America,” press release, November 15, 2005. As of February 28, 2008: http://www.house.gov/pelosi/press/releases/Nov05/innovation.html
Office of Science and Technology, “PSA Target Metrics for the UK Research Base,” report prepared for Department of Trade and Industry, United Kingdom, 2005.
Office of Senator Joseph I. Lieberman, Offshore Outsourcing and America’s Competitive Edge: Losing Out in the High Technology R&D and Services Sector, May 2004. As of February 28, 2008: http://lieberman.senate.gov/documents/whitepapers/Offshoring.pdf
Office of Speaker Nancy Pelosi. “The Innovation Agenda: 110th Congress,” Washington, D.C., undated. As of February 28, 2008: http://speaker.gov/issues?id=0016
Organisation for Economic Co-operation and Development, International Mobility of the Highly Skilled, Policy Brief, July 2002. As of February 28, 2008: http://www.oecd.org/dataoecd/9/20/1950028.pdf
———, Education at a Glance: OECD Indicators 2006, 2006a. As of February 28, 2008: http://www.oecd.org/edu/eag2006
———, Main Science and Technology Indicators, Volume 2006, Issue 1, 2006b. As of February 28, 2008: http://masetto.sourceoecd.org/vl=16047049/cl=16/nw=1/rpsv/~4160/v2006n1/s1/p1l
———, Main Science and Technology Indicators, Volume 2006, Issue 2, 2006c. As of February 28, 2008: http://masetto.sourceoecd.org/vl=16047049/cl=16/nw=1/rpsv/~4160/v2006n2/s1/p1l
———, OECD Science, Technology and Industry Outlook, 2006d. As of February 28, 2008: http://www.oecd.org/document/62/0,3343,en_2649_34451_37675902_ 1_1_1_1,00.html
———, Compendium of Patent Statistics, 2007, 2007. As of February 28, 2008: http://www.oecd.org/dataoecd/5/19/37569377.pdf
Oyer, Paul, “Recent Trends in U.S. Science and Engineering: Prospects, Challenges and Implications,” in Titus J. Galama and James Hosek, eds., Perspectives on U.S. Competitiveness in Science and Technology, Santa Monica, Calif.: RAND Corporation, CF-235-OSD, 2007. As of February 28, 2008: http://www.rand.org/pubs/conf_proceedings/CF235

152 U.S. Competitiveness in Science and Technology
Paral, Rob, and Benjamin Johnson, “Maintaining a Competitive Edge: The Role of the Foreign-Born and U.S. Immigration Policies in Science and Education,” Immigration Policy in Focus, Vol. 3, No. 3, August 2004.
Peri, Giovanni, “Rethinking the Effects of Immigration on Wages: New Data and Analysis from 1990–2004,” Immigration Policy in Focus, Vol. 5, No. 8, October 2006.
Peters, Len, “Science Literacy: The Chinese Get It,” Seattle Times, March 26, 2006. As of February 28, 2008: http://seattletimes.nwsource.com/html/opinion/2002887594_sundaypnnl26.html
Pielke, Jr., Roger, “Prometheus: The Science Policy Blog,” “Category: Gathering Storm,” Center for Science and Technology Policy Research, University of Colorado at Boulder, 2006. As of February 28, 2008: http://sciencepolicy.colorado.edu/prometheus/archives/gathering_storm
President’s Council of Advisors on Science and Technology, Sustaining the Nation’s Innovation Ecosystem: Maintaining the Strength of Our Science and Engineering Capabilities, June 2004. As of February 28, 2008: http://www.ostp.gov/pdf/finalpcastsecapabilitiespackage.pdf
Progressive Policy Institute, “Over One-Third of All Science and Engineering Ph.D.s in the United States Are Foreign-Born,” Progressive Policy Institute, Trade Fact of the Week, March 15, 2006. As of February 28, 2008: http://www.ppionline.org/ppi_ci.cfm?contentid=253786&knlgAreaID= 108&subsecid=900003
Research and Policy Committee of the Committee for Economic Development, Learning for the Future: Changing the Culture of Math and Science Education to Ensure a Competitive Workforce, 2003. As of February 28, 2008: http://www.ced.org/docs/report/report_scientists.pdf
Ricardo, David, On the Principles of Political Economy and Taxation, London: George Bell and Sons, [1817] 1903.
Romer, Paul M., “Endogenous Technical Change,” Journal of Political Economy, Vol. 98, No. 5, 1990, pp. 71–102.
Saxenian, AnnaLee, “Silicon Valley’s New Immigrant Entrepreneurs,” University of California–Santa Cruz, Working Paper 15, May 2000. As of February 28, 2008: http://www.ccis-ucsd.org/PUBLICATIONS/wrkg15.pdf
Segal, Adam, “Is America Losing Its Edge? Innovation in a Globalized World,” Foreign Affairs, November–December 2004, pp. 2–8. As of February 28, 2008: http://www.foreignaffairs.org/20041101facomment83601/adam-segal/ is-america-losing-its-edge.html
References 153
———, “The Global Diffusion of S&T and the Rise of China,” in Titus J. Galama and James Hosek, eds., Perspectives on U.S. Competitiveness in Science and Technology, Santa Monica, Calif.: RAND Corporation, CF-235-OSD, 2007. As of February 28, 2008: http://www.rand.org/pubs/conf_proceedings/CF235
Silberglitt, Richard, Philip S. Anton, David R. Howell, Anny Wong, S. R. Bohandy, Natalie Gassman, Brian A. Jackson, Eric Landree, Shari Lawrence Pfleeger, Elaine M. Newton, and Felicia Wu., The Global Technology Revolution 2020: Executive Summary, Santa Monica, Calif.: RAND Corporation, MG-475-NIC, 2006a. As of February 28, 2008: http://www.rand.org/pubs/monographs/MG475/
Silberglitt, Richard, Philip S. Anton, David R. Howell, Anny Wong, Natalie Gassman, Brian A. Jackson, Eric Landree, Shari Lawrence Pfleeger, Elaine M. Newton, and Felicia Wu, The Global Technology Revolution 2020, In-Depth Analyses: Bio/Nano/Materials/Information Trends, Drivers, Barriers, and Social Implications, Santa Monica, Calif.: RAND Corporation, TR-303-NIC, 2006b. As of February 28, 2008: http://www.rand.org/pubs/technical_reports/TR303/
Solow, Robert M., “A Contribution to the Theory of Economic Growth,” Quarterly Journal of Economics, Vol. 70, No. 1, 1956, pp. 65–94.
———, “Technological Change and the Aggregate Production Function,” Review of Economics and Statistics, Vol. 39, No. 3, 1957, pp. 312–320.
Stephan, Paula, “Comments on the ‘Gathering Storm’ and Its Implications for National Security,” in Titus J. Galama and James Hosek, eds., Perspectives on U.S. Competitiveness in Science and Technology, Santa Monica, Calif.: RAND Corporation, CF-235-OSD, 2007. As of February 28, 2008: http://www.rand.org/pubs/conf_proceedings/CF235
Suro, Roberto, and Jeffrey Passel “The Rise of the Second Generation: Changing Patterns in Hispanic Population Growth,” October 2003. As of February 28, 2008: http://pewhispanic.org/reports/report.php?ReportID=22
Tam, Pui-Wing, and Jackie Range, “Second Thoughts: Some in Silicon Valley Begin to Sour on India,” Wall Street Journal, July 3, 2007, p. A1.
Task Force on the Future of American Innovation, The Knowledge Economy: Is the United States Losing Its Competitive Edge? Benchmarks of Our Innovation Future, February 2005. As of February 28, 2008: http://futureofinnovation.org/PDF/Benchmarks.pdf

154 U.S. Competitiveness in Science and Technology
Teitelbaum, Michael S., “Do We Need More Scientists?” The Public Interest, 2003, pp. 40–53. As of February 28, 2008: http://www.sloan.org/programs/documents/PublicInterestTeitelbaum2003.pdf
———, “The Gathering Storm and Its Implications for National Security,” in Titus J. Galama and James Hosek, eds., Perspectives on U.S. Competitiveness in Science and Technology, Santa Monica, Calif.: RAND Corporation, CF-235-OSD, 2007. As of February 28, 2008: http://www.rand.org/pubs/conf_proceedings/CF235
Third European Report on Science and Technology Indicators, 2003: Towards a Knowledge-Based Economy, European Commission, March 2003. As of February 28, 2008: http://cordis.europa.eu/indicators/third_report.htm
Tienda, Marta, and Faith Mitchell, eds., Hispanics and the Future of America, Washington, D.C.: National Academies Press, 2006. As of February 28, 2008: http://www.nap.edu/catalog.php?record_id=11539
Trivedi, Bijal P., “Are We Training Too Many Scientists?” Scientist, Vol. 20, No. 9, September 2006, pp. 42–48.
U.S. Census Bureau, Current Population Survey, 2007. As of March 2, 2008: http://www.census.gov/cps/
U.S. Commission on National Security/21st Century, Road Map for National Security: Imperative for Change, 2001. As of February 28, 2008: http://govinfo.library.unt.edu/nssg/PhaseIIIFR.pdf
U.S. House of Representatives, “Views of the NIST Nobel Laureates on Science Policy: Hearing Before the Subcommittee on Environment, Technology, and Standards, Committee on Science,” Washington, D.C., May 24, 2006. As of February 28, 2008: http://frwebgate.access.gpo.gov/cgi-bin/getdoc.cgi?dbname=109_house_hearings&docid=f:27588.wais
Warsh, David, Knowledge and the Wealth of Nations: A Story of Economic Discovery, New York: W. W. Norton, 2006.
———, “The World Is What?” in Titus J. Galama and James Hosek, eds., Perspectives on U.S. Competitiveness in Science and Technology, Santa Monica, Calif.: RAND Corporation, CF-235-OSD, 2007. As of March 31, 2008: http://www.rand.org/pubs/conf_proceedings/CF235
Wedekind, Kara, “Panel: Competitiveness Falls Without Qualified Teachers,” Fox News.com, March 2, 2006. As of February 28, 2008: http://www.foxnews.com/story/0,2933,186675,00.html
World Bank Group, WDI Online: World Development Indicators, Web site, undated. As of March 14, 2008: http://devdata.worldbank.org/dataonline/

References 155
Wyndrum, Ralph W., Jr., letter sent to Senator Daniel Akaka and other senators, January 10, 2006. As of February 28, 2008: http://www.ieeeusa.org/policy/policy/2006/011006.asp