support for map-21 section 1405: cost-benefit analysis. estimated annual nationwide work zone...
TRANSCRIPT
Draft Report
Support for MAP-21 Section 1405: Cost-Benefit Analysis
March 12, 2013
Support for MAP-21 Section 1405: Cost-Benefit Analysis
2 | P a g e
INTRODUCTION
Section 1405 of the Moving Ahead for Progress in the 21st Century (MAP-21) transportation bill calls for the Secretary of Transportation to revise 23 CFR 630.1008 to require the use of positive protection in work zones under certain conditions. As a component of the rulemaking process, US DOT conducted an analysis of the likely safety and operational impacts of implementing the revised rule nationwide.
MAP-21 Section 1405 states:
(1) at a minimum, positive protective measures are used to separate workers on highway construction projects from motorized traffic in all work zones conducted under traffic in areas that offer workers no means of escape (such as tunnels and bridges), unless an engineering study determines otherwise.
(2) temporary longitudinal traffic barriers are used to protect workers on highway construction projects in long-duration stationary work zones when the project design speed is anticipated to be high and the nature of the work requires workers to be within 1 lane-width from the edge of a live travel lane, unless—
(A) an analysis by the project sponsor determines otherwise; or (B) the project is outside of an urbanized area and the annual average daily traffic
load of the applicable road is less than 100 vehicles per hour…
This document presents an analysis of the estimated costs and benefits likely to occur from implementation of Section 1405 of MAP-21. The scope of the analysis is a nationwide implementation of the revised rule considering the estimated costs and benefits that would be incurred through one year of implementation (a snapshot), assuming that all work zones within the scope of the rule would be in compliance. As an alternative analysis, the converse was also considered – i.e., that engineering analyses would be conducted to determine that positive protective measures are not needed.
This Regulatory Benefit-Cost Analysis document is organized in the following manner:
A. Assumptions of the Analysis B. Estimated Annual Nationwide Work Zone Activity C. Cost Estimation Methodology D. Benefit Estimation Methodology E. Results F. Conclusions G. Appendix – Sensitivity Analysis
All monetary values shown in this analysis have been adjusted to Year 2012 real dollars based upon the Consumer Price Index published by the Bureau of Labor Statistics and the Construction Cost Index (where applicable).

Support for MAP-21 Section 1405: Cost-Benefit Analysis
3 | P a g e
A. ASSUMPTIONS OF THE ANALYSIS
The proposed rule will not impact all roadways and all work zones. The authority of the regulation is limited to federal aid roads and is only applicable to work zones that meet the following conditions:
(1) A work zone offers workers no means of escape (such as tunnels and bridges), OR
(2) A work zone is a long-duration stationary work zone with a high design speed (55 miles per hour or greater) AND the workers are within 1 lane-width from the edge of a live travel lane AND the work zone is within an urbanized area OR for work zones outside of an urbanized area that have average daily traffic volume of 100 vehicles per hour or more.
Assumptions regarding which roads are affected: We considered all roads in the National Highway System (NHS) for this analysis. The NHS typically covers all roads in an urbanized area that have a high design speed. Using the NHS, it is assumed that the vast majority of work zones outside of an urbanized area that have an average daily traffic volume of 100 vehicles per hour or more are included, and those that do not fit these attributes and have been eliminated have minimal impact on the analysis. Ultimately this will likely underestimate the costs associated with implementation of this rule since, based on past experience with other work zone regulations, some or all States will choose to extend their implementation of the rule requirements to all roads as it too cumbersome to have separate policies for federal aid and non-federal aid projects
Assumptions regarding which work zones are affected: For the purpose of this analysis, a long-duration stationary work zone is defined as one that results in continuous lane closure or activity within 1 lane-width from the edge of a travel lane for two or more weeks - uninterrupted. High design speed was defined as 55 mph or greater. The implementation of this rule only impacts those work zones that are not already utilizing these measures and therefore, the cost-benefit analysis will consider the incremental costs and benefits of additional positive protective devices in work zones that would not have used them absent the rule. The analysis assumes that all work zones within the scope of the rule would comply.
Assumptions regarding device type: The positive protection measure that is considered for this analysis is the use of temporary concrete barriers. There are other temporary barriers available for use such as steel barrier, water barrier, and moveable barrier, however, most states and local entities predominantly use temporary concrete barrier.
Assumptions regarding benefits: Worker safety is the primary benefit category under consideration; the impacts to vehicle occupant safety will secondarily be assessed. Although flaggers often accompany work zones, this analysis did not include any impacts to flaggers because they are often located in the travel lane to be clearly visible to approaching motorists and not protected by barriers. In evaluating safety benefits, the categories considered are fatalities avoided, injuries avoided, and property damage avoided. Each of these benefits is monetized using authoritative sources of information; the monetization will be described in the benefit estimation section. In addition to safety, using positive protection barriers in work zones is also likely to have some impact on mobility. The analysis did not

Support for MAP-21 Section 1405: Cost-Benefit Analysis
4 | P a g e
include mobility assessments for the use of positive protection measures because lane closures will reduce capacity regardless of whether positive protection barriers or other devices such as cones or drums are used to close the lane(s). Capacity loss is the primary factor in mobility impacts, rather than the type of device used once the work zone has been set-up. There has been limited research to date on the differences in driver behavior (e.g., travel speeds, lane changing) in work zones when driving next to barrier as compared to cones or drums, and this research has not been conclusive.
Assumptions regarding the scope of safety benefits: For the sake of this analysis, it was assumed all intrusion related fatalities and injuries would be affected even though the fatality and injury counts are across all roads (i.e., not just from federal aid funded projects).
Assumptions regarding cost calculation: It was assumed that no nationwide price escalation would occur for barrier components due to increased demand following the implementation of Section 1405 of MAP-21. Though prices may fluctuate regionally, the overall effect is assumed to be negligible because concrete barriers are a small component of the overall concrete market. The maintenance of traffic costs to install and remove the barrier were also calculated.
Cost and benefit estimates are not project-specific: The analysis is a nationwide evaluation of likely costs and benefits. The current analysis considers the average costs that would be incurred by a project and does not represent individual project costs. Similarly, the benefits are a cumulative for the nation even though each work zone will have very different results from another based on the engineering and design of the specific project. The safety benefits and the costs associated with specific projects will likely vary greatly in different regions based on such factors as:
1) differing transportation costs, 2) driving behavior, 3) traffic volume and road conditions, and 4) availability of materials.
Factors not considered: Each work zone varies in scope and at times will incur additional costs that are not included in this analysis. For example, there will be times when costs will be incurred to purchase additional right of way or rebuild pavement shoulders to full depth pavement for maintenance of traffic when positive protective measures are deployed. While these costs can be significant, they are not included because it is not known how extensive these cases will be. The impacts of worker fatalities on construction production and operations has not been incorporated due to lack of data in this area.

Support for MAP-21 Section 1405: Cost-Benefit Analysis
5 | P a g e
B. ESTIMATED ANNUAL NATIONWIDE WORK ZONE ACTIVITY
The following section details the process by which nationwide work zone activity is quantified in order to determine the extent to which revising 23 CFR 630.1108 to address Section 1405 of MAP-21 would impact the nation’s work zones. To quantify applicable work zone activity, an estimate of the total number of work zones across the nation has to be determined as well as the number of these work zones that satisfy the criteria associated with this rule.
To estimate the total number of work zones, a 2001 study sponsored by the Federal Highway Administration was consulted. The study estimated that over a two-week period, during the peak summer roadwork season, there were 3,110 work zones on the National Highway System (NHS)1. These work zones cover 20,876 miles or approximately 13% of the roadway miles that are designated as a part of the NHS. Building upon this study, the subsequent summer and winter construction seasons (2002 and 2003) were also evaluated to provide a more comprehensive estimate of the level of work zone activity throughout the NHS. This follow-up study estimated that there were between 6,500 and 7,200 work zones, covering 20-27% of the NHS, during the summer in the two week study period, and between 2,000 and 3,000 work zones, covering 7-8% of the NHS, during the winter months in the two week study period 2, 3. These estimates therefore bring the range for the total number of work zones on the NHS to 8,500-10,200 in 2003.
To arrive at a more accurate and recent estimate of work zone activity, the total capital and maintenance expenditure on the nation’s highways from 2001-2010 was examined4. It is assumed that the increase in expenditures correlates to the increase in the number of work zones. From 2001-2010, capital and maintenance expenditures increased at an average annual rate of 5%. Assuming that this rate of increase stays constant through to 2013, there will be a 66% increase in capital expenditure. Since some of this additional expenditure could be due to price increases in construction materials and labor, and therefore not result in additional work zones, the 66% increase was adjusted by the construction cost index5. Once adjusted, the result is a 44% increase in capital expenditure. This translates to an increase from $70B in 2003 to $110B in 2013 for capital expenditure. For this cost-benefit analysis, the increase in the number of work zones is estimated to be proportional to the increase in the rate of capital expenditure. Therefore, an approximate 44% increase in the number of work zones between 2003 and 2013 would increase the total number of work zones from a low estimate of 8,500 to 12,208 and a high estimate of 10,200 to 14,650. These numbers represent the total estimated number of work zones throughout the NHS. However, this cost-benefit analysis will only be performed on a subset of these work zones.
1 Wunderlich K.., and Hardesty, D., A Snapshot of Summer 2001 Work Zone Activity – Final Report, Sponsored by the Federal Highway Administration, 2003 2 FHWA – Work Zone Safety and Mobility Program: Facts and Statistics – Work Zone Activity, http://www.ops.fhwa.dot.gov/wz/resources/facts_stats/activity.htm 3 Wunderlich, K., Characterizing Nationwide Work-Zone Activity: Key Findings from Website Content Analyses, 2001-2003 (05-0438, TRB), http://144.171.11.40/cmsfeed/ip/paper_detail.asp?paperid=4723 . 4 FHWA – Office of Highway Policy - Information Highway Information – Highway Statistics 2010, Total Disbursements for Highways by Function 1945-2010 (http://www.fhwa.dot.gov/policyinformation/statistics/2010/2010disbchrt.cfm) 5 National Highway Construction Cost Index http://www.fhwa.dot.gov/policyinformation/nhcci/faq.cfm

Support for MAP-21 Section 1405: Cost-Benefit Analysis
6 | P a g e
The subset of work zones being considered for this cost-benefit analysis is dictated by those that will be affected by the implementation of the proposed rule under consideration. As stated above, the main characteristics of the work zones to be considered in this analysis are those that are:
• conducted under traffic in areas that offer workers no means of escape (such as tunnels and bridges)
• conducted on roadways with high design speed, and • long-duration, stationary work zones in both urbanized and non-urbanized areas, with annual
average daily traffic load greater than 100 vehicles per hour
In down-selecting from the total number of work zones, the first step is to consider all work zones in areas that do not offer workers any means of escape. The aforementioned 2001 FHWA study estimated that 28% of all work zones or approximately 3,418 to 4,102, are on bridges6. Although these works zones do not include tunnels, it is assumed that the increase gained by including work zones in tunnels would have a rather insignificant effect on the cost-benefit analysis, given the relatively small number of tunnels throughout the NHS.
As mentioned previously, a long duration, stationary work zone is being defined as one that is established for two or more weeks. This is consistent with the previous rulemaking on the subject. Also from the 2001 FHWA study, it was estimated that approximately 82.4% of all work zones on the NHS satisfy the long duration, stationary criteria. Therefore, of the remaining work zones – total work zones minus those on bridges, there are approximately 7,245 to 8,694 work zones that satisfy the rule’s long duration criteria.
In satisfying the high speed criteria, the above estimate of the total number of work zones only considers roadways that are a part of the NHS. Therefore, by default, the work zone estimate above is assumed to only include work zones that are conducted on roadways with high design speeds.
It is estimated that approximately 20% of these work zones do not use positive protection and therefore will now be subjected to implementing positive protection measures. Approximately 10% of all work zones crashes are due to intrusions7; it is assumed that work zones that are involved in intrusion crashes did not have positive protection measures implemented. Since it is not realistic to assume that every work zone that did not have positive protection experienced an intrusion crash, we made the assumption that half of all work zones not using positive protection experienced an intrusion crash. This results in the 20% estimate for impacted work zones on long-duration, high-speed facilities. We believe that assuming that half of all work zones without positive protection had an intrusion crash is conservative, and that the resulting 20% estimate of impacted work zones likely understates the actual number, however this was the best way to estimate the approximate number of work zones impacted. Applying this 20% rate to the number of work zones that satisfy the rule’s criteria, the number of 6 Wunderlich K.., and Hardesty, D., A Snapshot of Summer 2001 Work Zone Activity – Final Report, Sponsored by the Federal Highway Administration, 2003 7 Ullman, G., Categorization of Work Zone Intrusion Crashes, http://tti.tamu.edu/conferences/traffic_safety11/program/6-breakout/ullman.pdf

Support for MAP-21 Section 1405: Cost-Benefit Analysis
7 | P a g e
impacted work zones ranges from 2,133 to 2,559. The above analysis of the nation’s work zone activity will be utilized to estimate the total nationwide cost and expected safety benefits that may result from implementation of the rule. See Table 1 for a summary of the above results. Appendix A has a sensitivity analysis assuming that 15% and 25% of the work zones are impacted.
Table 1: Nationwide Work Zone Activity Estimation – estimating 20% of projects are impacted
Number of: Low Estimate High Estimate Total Work Zones 12,208 14,650 No Escape Work Zones 3,418
4,102
-28% Long Duration Work Zones
7,245
8,694 82.4% x (all WZ minus No
Escape WZ) Work Zones that satisfy Rule Criteria 10,663 12,796
Work Zones impacted by Rule (assumes 20% of all applicable work zones currently do not implement positive protection measures)
No Escape Work Zones 684
820 20% of the value above
Long Duration Work Zones 1,449
1,739 20% of the value above
Work Zones impacted by the Rule 2,133 2,559

Support for MAP-21 Section 1405: Cost-Benefit Analysis
8 | P a g e
C. COST ESTIMATION METHODOLOGY
The cost of revising 23 CFR 630 1108 to address MAP-21 Section 1405, which will require additional work zones to utilize positive protection barriers, is estimated for the entire nation. To determine the nationwide cost, the approach is to estimate the average unit cost of deploying positive protection barriers in an individual work zone and apply that to the number of work zones to derive the total nationwide cost.
This section will describe the methodology to estimate the unit cost of positive protection barriers by examining three main categories of cost:
• Material costs, including temporary concrete barrier wall and end treatment costs; • Maintenance of traffic costs to install the barrier wall and end treatments and removal of the
barrier wall; • Project delay costs, including additional administrative costs associated with a longer contract
period and decreased productivity at the project site as a result of barriers impacting work operations.
In order to access an accurate cost benefit analysis and to determine the incremental cost of this proposed change, the cost of barrels (currently typically used in work zones) and associated maintenance of traffic costs must be subtracted from the applicable categories.
Material Cost Estimation:
Barrier Cost: In estimating material cost, data were gathered from the Federal Highway Administration, Texas Transportation Institute, and two State Departments of Transportation. For concrete barriers, the estimated unit cost is estimated to be $20 per linear foot8. A barrier unit average length of 12 linear feet was used for concrete barriers. Twelve foot concrete barrier walls and 20 foot concrete barrier walls can be used, however, since the majority of states use 12 foot barrier, the 12 foot length was used for this analysis.
The median length of a work zone was estimated to be 4 miles based on a study of nationwide work zones.9 We assumed that each work zone would have approximately 3 miles of barrier wall10. This assumes that temporary barrier wall 3 mile length may split as it may be needed in both directions of the roadway, inside shoulders of the project. Each work zone has different construction phasing, so a best estimate based on expert experience was utilized for this analysis. Some work zones will have more temporary barrier wall while others will have less barrier wall than 3 miles. The average number of barrier units per work zone was calculated by multiplying 5,280 feet in a mile by the length of barrier in
8 Unit cost of Concrete Barrier: Washington State DOT (http://www.wsdot.wa.gov/biz/contaa/uba/bid.cfm) 9 Wunderlich K., and Hardesty, D., A Snapshot of Summer 2001 Work Zone Activity – Final Report, Sponsored by the Federal Highway Administration, 2003 10 Assumption based on the professional judgment of Jawad Paracha, Department of Transportation Federal Highways Administration.
Support for MAP-21 Section 1405: Cost-Benefit Analysis
9 | P a g e
the work zones (3 miles) and then dividing by the barrier unit average length of 12 linear feet to yield a result of 1,320 barrier segments per work zone.11
To estimate the material cost associated with barriers for each work zone, the 1,320 barriers were multiplied by the average unit cost $20 per foot to calculate the cost of barriers for the work zone. The total average cost for the barrier wall was estimated to be $317K per work zone or $743.2M for all work zones.
End Treatment Cost: An estimated price of end treatments was calculated by averaging the overall cost of six different types of end treatment. Individual end treatment prices were gathered from manufacturer websites as well as from several State Departments of Transportation. It was estimated that three end treatments will be used per work zone. Average length of barrier wall per work zone was estimated at 3 miles, the estimated number of end treatments was derived from the assumption that one end treatment is required at the beginning of the work zone and two additional end treatments at the two openings which are assumed to be provided at the beginning of 2nd, and 3rd mile. It is also assumed that there will be 100% replacement of the 3 end treatments during the life of the project (for a total of 6 end treatments per project) due to incidents/crashes on the roadway. Some end treatments get damaged and need replacement multiple times, while others remain intact throughout the duration of the project. The average cost is estimated at $8,381 per end treatment at a cost of $50.3K per project or $118.0M for all work zones for barrier wall end treatments.
Cost of barrels: In order to get the estimate of the incremental cost to install positive protection, the cost of traffic control devices that are typically used prior to this proposed change must be subtracted from the cost. The cost of barrels was estimated for a 3 mile long work zone set up with barrels spaced 80 feet apart (per MUTCD guidelines for a freeway facility with a 55mph design speed) for a total of 198 barrels per project. Barrels are estimated to cost $.09 per barrel, per day.12 For an average project duration of 290 days13, it was estimated that the barrels would be placed on site for 215 days, since 30 days at the beginning of the project is typically allocated for project material procurement, survey, and preparation work and 45 days at the end of the project is a typical time for final punch list and cleanup of the site after construction is completed and traffic control removed. The barrel cost is approximately $3.8K per project or $9.0M for all projects. When totaling the average material cost, the barrel cost is subtracted from the total material cost to determine the incremental cost for the proposed change.
The end treatment cost was added to the barrier cost and the cost of barrel installation was subtracted to obtain a total average material cost of $363.3K per work zone or $852.1M for all work zones. As previously mentioned, each work zone configuration is unique and it is difficult to estimate for every construction zone scenario, any relocation costs and subsequent relocation MOT costs have not been accounted for in this analysis.
See Table 2 for a breakdown of material costs. 11 Data from the Department of Transportation Federal Highway Administration were used in calculating this information. 12http://www.dot.state.fl.us/specificationsoffice/Estimates/HistoricalCostInformation/HistoricalCost.shtm 13 David Saddler, Florida Department of Transportation State Construction Engineer

Support for MAP-21 Section 1405: Cost-Benefit Analysis
10 | P a g e
Table 2: Summary of Material Costs
Material Costs Barrier Wall Low High Average number of work zones
2,133 2,559 2,346 Average price/Linear Foot (LF) barrier $20 Average length of barrier wall (mi) 3 length of barrier wall in feet 15840 Cost of Barrier wall
$675,606,054 $810,727,265 $743,166,660 End Treatments Average cost per end treatment $8,381 Number of end treatments 6 Cost of end treatment $107,237,533 $128,685,040 $117,961,286 Cost of barrels Barrel cost/ day $0.09 barrel spacing (feet) 80 number of barrels 158 Days on site 215 Cost of barrels -$8,170,611 -$9,804,733 -$8,987,672
TOTAL MATERIAL COST $774,672,976 $929,607,572 $852,140,274
Maintenance of Traffic Cost Estimation:
Maintenance of traffic (MOT) costs are expenses incurred for controlling traffic during temporary barrier wall/end treatment installation, end treatment replacement, and barrier wall/end treatment removal. This cost is the sum of MOT costs associated with placing the concrete barrier/end treatments, replacing the end treatments throughout the duration of the project, and subsequent removal.
MOT for placing the barrier wall: The number of shifts needed to set up the barriers was estimated using the assumption that on average 100014 feet of barrier wall could be placed in a six hour work window. It was assumed that the lane closure window was 8 hours; one hour was needed for setting up the lane closure and one hour for removing the lane closure. The number of shifts required to set up the barriers was approximately 37,158 for all projects. At $5,000 per shift to maintain traffic, during work zone set up, the cost of barrier set up is approximately $79.2K per project or $185.8M for all projects.
14 Gonzales, A. Northwest Regional Vice President, Atkinson Construction – htpp:// www.atkn.com.

Support for MAP-21 Section 1405: Cost-Benefit Analysis
11 | P a g e
MOT for end treatment replacement: The cost for MOT during end treatment replacement is approximately $5,000 per end treatment per work shift15. Therefore, the total MOT cost for replacing all three end treatments during the lifetime of each project is $15.0K or $35.2M for all projects. The cost to replace an end treatment is equivalent to the cost of maintaining traffic for a single work shift as the process of replacing each barrier includes tasks such as setting up temporary traffic control devices, uninstalling the damaged end treatment and installing the new one, and then removing the temporary traffic control devices. Although these steps may take under 6 hours, this analysis estimates that this process does take the equivalent of a shift’s worth of effort since many states have union rules requiring employee compensation for a full 8 hour work shift even if the task is completed in less than the 8 hour work shift.
Removal of barrier wall: The number of shifts needed to remove up the barriers was estimated using the assumption that on average 150016 feet of barrier wall could be removed in a 6 hour work window. Similar to the placement of the barrier wall, it was assumed that the lane closure window was 8 hours; one hour was needed for setting up the lane closure and one hour for removing the lane closure. The number of shifts required to remove the barrier was approximately 24,772 for all projects. At $5,000 per shift to maintain traffic, the cost of barrier removal is approximately $52.8K per project or $123.7M for all projects.
MOT for barrel placement: It was estimated that each project would have 1 shift of MOT for barrel installation and 1 shift of MOT for barrel removal. This estimate uses $5,000 per shift and includes all associated expenses. The MOT cost of barrel installation and removal is approximately $10.0K per project or $23.5M for all projects. This cost is subtracted from the total MOT cost to determine the incremental cost.
Total cost of MOT : Total average cost of MOT throughout the barrier wall placement, end treatment replacement, barrier removal and subtracting out any MOT costs incurred for barrel placement and barrel removal for the incremental cost for the proposed change is approximately $137.0K per project or $321.4M for all projects impacted. See Table 3 for a breakdown of MOT costs.
15 Assumption based on the professional judgment of Seema Javeri, Department of Transportation Federal Highways Administration. 16 Gonzales, Al. Regional Vice President, Atkinson Construction - http://www.atkn.com

Support for MAP-21 Section 1405: Cost-Benefit Analysis
12 | P a g e
Table 3: Maintenance of Traffic Costs
Maintenance of Traffic Costs (MOT) MOT cost to place barrier wall Low High Average number of work zones 2,133 2,559 2,346 Feet of barrier wall placed per shift 1,000 MOT price per shift $5,000 Barrier wall placement cost $168,901,514 $202,681,816 $185,791,665
Cost of MOT - End treatment replacement End treatments per project 6 MOT cost for end treatment replacement $31,988,923 $38,386,708 $35,187,815
MOT cost to remove barrier wall Feet of barrier wall picked up per shift 1,500 Barrier wall removal cost $112,601,009 $135,121,211 $123,861,110
MOT cost to place and remove barrels -$21,325,949 -$25,591,138 -$23,458,544
TOTAL MOT COST $292,165,497 $350,598,596 $321,382,047
Other Costs Estimation:
Project Delay Cost: Because of the time it takes to install barrier, and the way it affects access to work zones, increased use of barrier is likely to lead to longer project durations. This project delay cost is broken down into two parts – value of lost productivity and administrative cost. Although the costs vary from one project to the next, the value of lost productivity due to loss of access into and out of the work zones from the barrier wall placement is assumed to be equivalent to 10% of the total cost of the project. Second, it was estimated that additional administrative costs for activities such as longer project office leases, recordkeeping, and invoicing, would be incurred due to the extended project duration. These additional administrative costs were estimated to add 5% to the total project administration cost (estimated at 5% of the total project cost), based on input from subject matter experts17. The additional administrative cost was calculated as 5% (incremental additional administrative costs) x 5% (accounting for original administrative cost) X project cost.
The total value of federal funding for interstates, major arterials, and freeways was $17.7B in 201018. This dollar value was brought to 2012 dollars19. From this value, it was estimated that 30% of the funding is used for design, environmental issues, and ROW costs and therefore are not part of construction contract cost and were eliminated from the total. Based on the earlier assumption that 20% of construction projects are impacted by this rule, the total dollar amount for impacted work zones on the NHS system is $2.6B. Using this value, the total delay and administrative cost $23.9M for all
17 Carpenter, J., Director, Construction Division, Washington State Department of Transportation - http://www.wsdot.wa.gov/ 18 Obligation Of National Highway System And Surface Transportation Program Funds http://www.fhwa.dot.gov/policyinformation/statistics/2010/fa6.cfm 19 Inflated using BLS Inflation Calculator Tool; Available at: http://www.bls.gov/data/inflation_calculator.htm/

Support for MAP-21 Section 1405: Cost-Benefit Analysis
13 | P a g e
projects that would be impacted by the rule, which equates to a per project cost of $47.8K. See Table 4 for a summary of delay costs.
Table 4: Delay Costs
Delay Costs
Low High Average
2010 Federal aid dollars spent on impacted projects
$17,667,105,000
Removing 30% for ROW, Design, Environmental, etc.
$12,366,973,500
Inflating value to 2012 dollars $13,021,350,000
Dollar value for 20% of impacted work zones
$2,604,270,000
10 % additional construction cost due to decreased productivity (Total delay based low and high work zone values to % of original number of work zones)
$42,449,601 $50,783,265 $46,616,433
5% additional administration cost due to longer duration of work zones (based low and high work zone values to % of original number of work zones)
$1,061,240 $1,269,582 $1,165,411
Total Delay Cost $43,510,841 $52,052,847 $47,781,844
Alternative Cost Analysis:
Engineering Study Cost Estimation: Positive protection shall be used unless an engineering study is completed and determines otherwise. Based on discussions with FHWA staff, several states, and consultants regularly performing this type of work, an engineering study would cost approximately $20,000 per work zone due to the liability of the consultant involving this type of work. Estimating the cost for the engineering study at $20,000 per work zone, it would cost $46.9M to perform engineering studies on all work zones. The subject matter experts believe that the engineering study alternative is unlikely and would be limited to a small portion of projects (e.g., projects that cannot be constructed with positive protection in place), and would likely be in the range of 3-5% of projects. Reasons they mentioned for limited use of the engineering study alternative included the level of effort required for the study, the difficulty of proving that something is not needed, and potential liability if positive protection is not used because of the study. Given these factors, we assumed approximately 5% of the affected work zones would take the engineering analysis alternative and this would cost $2.3M in total. This would reduce the estimated benefits as well since barrier would not be used in these cases,

Support for MAP-21 Section 1405: Cost-Benefit Analysis
14 | P a g e
however, the likely reduction in benefits would be small if an engineering study shows that barrier is not needed in that location. This number is not included in the cost benefit calculations since the changes are small (cost changes by 0.2%, and benefits would only reduce slightly) and are insignificant in the overall benefit to cost ratio.
Total Cost Estimation:
See Table 5 for a breakdown of the costs of implementation.
Table 5: Summary of Total Costs for Implementation
Summary of Costs for Implementation
Total Material Cost
Total Maintenance of Traffic Cost
Total Productivity Loss
& Additional Admin Cost
Total Cost
Low Cost Estimate $774,672,976 $292,165,497 $43,510,841 $1,110,349,314
High Cost Estimate $929,607,572 $350,598,596 $52,052,847 $1,332,259,015
Average Cost Estimate $852,140,274 $321,382,047 $47,781,844 $1,221,304,164
Support for MAP-21 Section 1405: Cost-Benefit Analysis
15 | P a g e
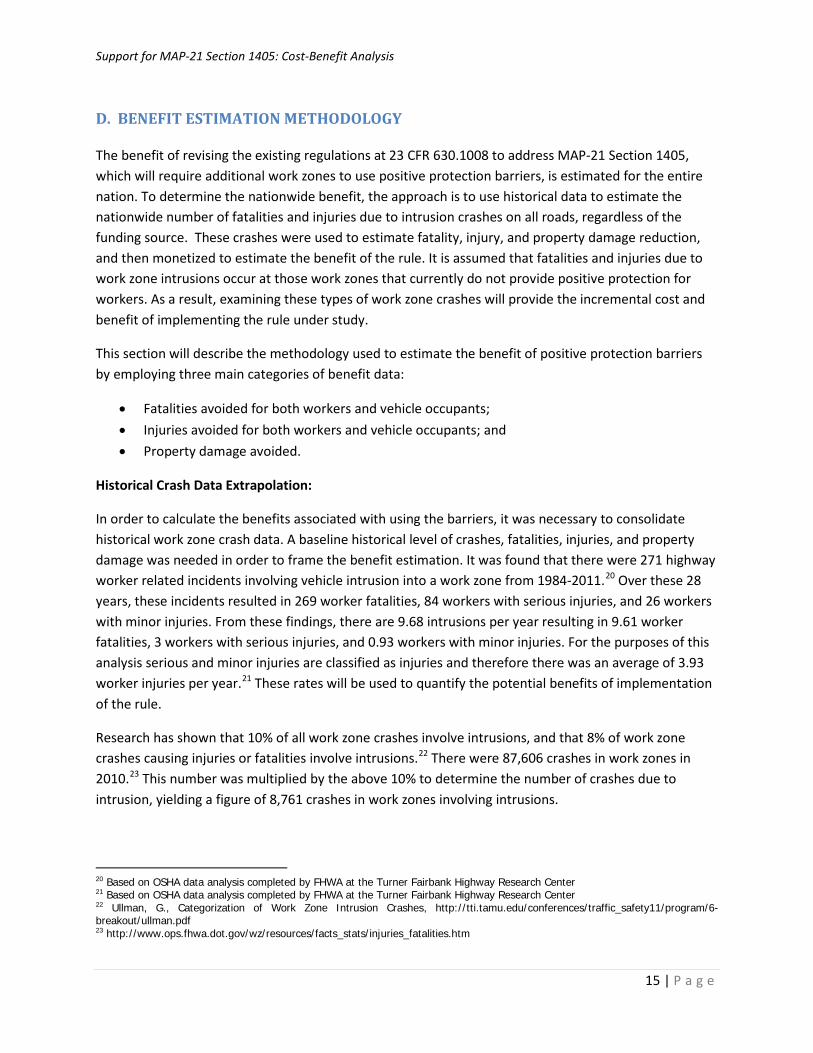
D. BENEFIT ESTIMATION METHODOLOGY
The benefit of revising the existing regulations at 23 CFR 630.1008 to address MAP-21 Section 1405, which will require additional work zones to use positive protection barriers, is estimated for the entire nation. To determine the nationwide benefit, the approach is to use historical data to estimate the nationwide number of fatalities and injuries due to intrusion crashes on all roads, regardless of the funding source. These crashes were used to estimate fatality, injury, and property damage reduction, and then monetized to estimate the benefit of the rule. It is assumed that fatalities and injuries due to work zone intrusions occur at those work zones that currently do not provide positive protection for workers. As a result, examining these types of work zone crashes will provide the incremental cost and benefit of implementing the rule under study.
This section will describe the methodology used to estimate the benefit of positive protection barriers by employing three main categories of benefit data:
• Fatalities avoided for both workers and vehicle occupants; • Injuries avoided for both workers and vehicle occupants; and • Property damage avoided.
Historical Crash Data Extrapolation:
In order to calculate the benefits associated with using the barriers, it was necessary to consolidate historical work zone crash data. A baseline historical level of crashes, fatalities, injuries, and property damage was needed in order to frame the benefit estimation. It was found that there were 271 highway worker related incidents involving vehicle intrusion into a work zone from 1984-2011.20 Over these 28 years, these incidents resulted in 269 worker fatalities, 84 workers with serious injuries, and 26 workers with minor injuries. From these findings, there are 9.68 intrusions per year resulting in 9.61 worker fatalities, 3 workers with serious injuries, and 0.93 workers with minor injuries. For the purposes of this analysis serious and minor injuries are classified as injuries and therefore there was an average of 3.93 worker injuries per year.21 These rates will be used to quantify the potential benefits of implementation of the rule.
Research has shown that 10% of all work zone crashes involve intrusions, and that 8% of work zone crashes causing injuries or fatalities involve intrusions.22 There were 87,606 crashes in work zones in 2010.23 This number was multiplied by the above 10% to determine the number of crashes due to intrusion, yielding a figure of 8,761 crashes in work zones involving intrusions.
20 Based on OSHA data analysis completed by FHWA at the Turner Fairbank Highway Research Center 21 Based on OSHA data analysis completed by FHWA at the Turner Fairbank Highway Research Center 22 Ullman, G., Categorization of Work Zone Intrusion Crashes, http://tti.tamu.edu/conferences/traffic_safety11/program/6-breakout/ullman.pdf 23 http://www.ops.fhwa.dot.gov/wz/resources/facts_stats/injuries_fatalities.htm

Support for MAP-21 Section 1405: Cost-Benefit Analysis
16 | P a g e
There were 576 fatalities involving motor vehicle crashes in work zones in 2010, including all vehicle occupants, some workers and others (e.g., pedestrians).24 Multiplying this figure by the 8% of crashes causing injuries and fatalities involving intrusions, there were 46 injury/fatal crashes in work zones due to intrusion in 2010. Assuming that 93% of fatalities involving motor vehicle crashes are vehicle occupants,25 this led to 43 vehicle occupants being fatally injured in work zones crashes due to intrusion.26 It is assumed that under the Section 1405 directed changes, all 43 fatalities caused by intrusion could be prevented and what would have been a fatal crash will now be less severe as a result of hitting barrier rather than entering the work area and result in an injury crash. Therefore, it is assumed that there will be 43 vehicle occupant injuries, annually, in work zones caused by the implementation of positive protection measures.
Fatalities Avoided and Injuries Caused due to Rule Implementation:
In order to determine the number of avoided worker fatalities due to intrusion in no escape work zones, the calculated number of worker fatalities in work zones caused by intrusions (9.61) was multiplied by the 28% - the percentage of work zones that do not have an escape and that will be impacted by the rule.27 This results in a value of three (3) worker fatalities avoided. Similarly, barrier use on long duration work zones (which account for 82.42% of national work zones28) would save six (6) worker fatalities. These values were summed, resulting in a value of nine (9) worker fatalities saved by barrier implementation as a result of the rule. Vehicle occupant fatalities avoided were calculated in the same fashion, resulting in a total value of 37 lives saved. This value was calculated by multiplying 28% (percentage of no escape work zones) times 43 and adding (43 – (43 x 28%)) x 82.42% (percentage of projects in long duration work zones). The reason for subtracting out the 43 x 28% is so that the vehicle occupants that are both in a no escape work zone and in a long duration work zone are not double counted similar to how the low and high values for work zones were calculated. The resulting value is the number of lives saved. The monetized value of a saved life is $9.1M29, resulting in total worker avoided fatality benefits of $81.9M and total vehicle occupant avoided fatality benefits of $340.6M.
Injuries caused by rule implementation were calculated in the same manner as fatalities. The value of an avoided injury is calculated by multiplying a severity factor times the value of a saved life. The severity factors range from 0.003 to 0.593 and has an average of 0.2028. 30 The average value of an avoided injury is $1.85M. It was calculated by multiplying the calculated fatality and injury rates by the percent of intrusions that result in either injuries or fatalities, resulting in four (4) worker injuries being avoided (a benefit of $7.3M), while 37 injuries will be caused by the barriers (a cost of $69.1M).
24 http://www.workzonesafety.org/crash_data/workzone_fatalities/2010 25 ATTSA study in 2008 available at www.atssa.com/galleries/default-file/Tenn-WZ-Crash_Facts.pdf 26 This value had to be derived since a direct count is not available from FARS data. 27 “A Snapshot of Summer 2001 Work Zone Activity", by Dr. Karl Wunderlich and Dawn Hardesty 28 “A Snapshot of Summer 2001 Work Zone Activity", by Dr. Karl Wunderlich and Dawn Hardesty 29 http://www.dot.gov/sites/dot.dev/files/docs/VSL%20Guidance%202013.pdf 30 http://www.dot.gov/sites/dot.dev/files/docs/VSL%20Guidance%202013.pdf.

Support for MAP-21 Section 1405: Cost-Benefit Analysis
17 | P a g e
Property Damage Caused:
Total property damage avoided was calculated by first determining the total amount of property damage due to crashes in the United States. A 2006 study estimated this value to be $70.7 billion.31 This figure was converted into 2012 dollars by using the Bureau of Labor Statistics inflation calculator, resulting in a value of $80.5 billion.32 There were 5,419,345 total crashes in the United States in 2010.33 Of these, 1.6% of all crashes occur in a work zone.34 Total property damage in work zones was calculated by multiplying the total crash property value of $80.5 billion by 1.6%, resulting in a value of $1,300,957,777. The value of property damage caused by intrusion was calculated by multiplying this value by 10% - the percentage of work zone crashes due to intrusion, resulting in a value of $130,095,778.35
It is assumed that there will an 80% decrease in property damage with respect to vehicles entering work zones. These vehicle will be prevented from entering work zones as a result of barrier implementation and therefore incur less property damages hitting barriers versus work zone elements such as construction equipment and materials inside the work zone.36 The property damage value for work zones without an escape was assessed by multiplying the property damage value of work zone crashes due to intrusion by the 80% decrease in property damage and by the 28% of all work zones that do not have an escape. It was determined that barriers saved $29,141,454 of property damage in no escape work zones. Similarly, barrier use on long duration work zones (which accounts for 82.42% of national work zones) saved $66,565,242 of property damage. In total, the value of property damage saved, due to rule implementation, is $95,706,697. Note, the property damage savings are only experienced by those vehicles that would have otherwise gone into a work zone, if it were not for a barrier. Overall, for the entire vehicle/driver population, these barriers would cause an increase in property damage as the vehicles will now bump in barriers versus cones – which cause less damage. While this increase in property damage could be significant, this cost was not included because there is no data available to make a reasonable estimate for increase in property damage due to presence of barrier wall in proximity to the travel lanes.
Table 6 presents a summary of potential benefits of the implementation of the rule being considered.
31 On a Crash Course: The Dangers and Health Costs of Deficient Roadways, A study by the Pacific Institute for Research & Evaluation; Dr. Ted R. Miller & Dr. Eduard Zaloshnja Commissioned by The Transportation Construction Coalition May 2009 32 Inflated using BLS Inflation Calculator Tool; Available at: http://www.bls.gov/data/inflation_calculator.htm/ 33 http://www.ops.fhwa.dot.gov/wz/resources/facts_stats/injuries_fatalities.htm 34 http://www.ops.fhwa.dot.gov/wz/resources/facts_stats/injuries_fatalities.htm 35 Ullman, G., Categorization of Work Zone Intrusion Crashes, http://tti.tamu.edu/conferences/traffic_safety11/program/6-breakout/ullman.pdf 36 Assumption based on the professional expertise of Department of Transportation FHWA staff

Support for MAP-21 Section 1405: Cost-Benefit Analysis
18 | P a g e
Table 6: Summary of Potential Benefits due to Rule Implementation
BENEFITS
INTRUSION RELATED BENEFITS MONETIZED UNIT VALUE
TOTAL MONETIZED VALUE No Escape WZ Long duration
WZ Total
Crashes 2,453 5,199 7,652 N/A - Fatalities (Worker) 3 6 9 $9,100,000 $81,900,000 Fatalities (Vehicle occupant) 12 25 37 $9,100,000 $340,613,559
Injuries (Worker) 2 2 4 $1,845,480 $7,381,920.00 Injuries (Vehicle occupant) (12) (25) (37) $1,845,480 ($69,076,430)
Property Damage $ 29,141,454 $ 66,565,242 $ 95,706,697 N/A $ 95,706,697 Grand Total $456,525,746

Support for MAP-21 Section 1405: Cost-Benefit Analysis
19 | P a g e
E. RESULTS
For costs, figures were generated for high and low work zone activity estimates, as well as a nationwide average. Costs were calculated by category and then summed. Nationwide, it was calculated that implementing the revisions to the rule would cost an average of $852.1M in material costs, $ 321.4M in maintenance of traffic costs, and $47.8M in delay costs. This brings the average total cost to an estimated $1.2B. See Table 7 for a summary of the aforementioned cost elements.
Table 7: Summary of Total Costs for Implementation
Summary of Costs for Implementation
Total Material Cost
Total Maintenance of Traffic Cost
Total Productivity Loss
& Additional Admin Cost
Total Cost
Low Cost Estimate $774,672,976 $292,165,497 $43,510,841 $1,110,349,314 High Cost Estimate $929,607,572 $350,598,596 $52,052,847 $1,332,259,015
Average Cost Estimate $852,140,274 $321,382,047 $47,781,844 $1,221,304,164
Nationwide benefits were calculated in both qualitative and quantitative form. It was found that an average of nine worker fatalities and 37 vehicle occupant fatalities will be avoided annually upon barrier implementation. Similarly, four worker injuries will be avoided upon use of positive protection barriers. Since it is assumed that the vehicle occupant fatalities avoided will result in injuries, 37 vehicle occupant injuries are assumed to be caused by the barriers. Monetizing these results in $81.9M in avoided worker fatalities and $340.6M in avoided vehicle occupant fatalities. Similarly, it was found that implementation will result in $7.4M in avoided worker injuries and a cost of $69.1M in additional vehicle occupant injuries. It was also estimated that barrier implementation is projected to save $95.7M in property damage. The total average benefit was found to be $456.5M.
Overall, the costs of revising 23 CFR 630.1108 to address Section 1405 of MAP-21 seems to outweigh the benefits. Using the low cost estimate, the net benefits were calculated as - $653.8M with a benefit to cost ratio of 0.41:1. With the high cost estimate, the calculated net benefits were - $875.7M with a benefit to cost ratio of 0.34:1. The average net benefit was calculated as - $764.8M with a benefit to cost ratio of 0.37:1. These results are summarized in Table 8.

Support for MAP-21 Section 1405: Cost-Benefit Analysis
20 | P a g e
Table 8: Summary of Benefit to Cost Ratio
Net Benefits
Low Cost Estimate High Cost Estimate Average National Cost Estimate
Net Benefits ($653,823,568) ($875,733,268) ($764,778,418) Benefit to Cost Ratio 0.41:1 0.34:1 0.37:1

Support for MAP-21 Section 1405: Cost-Benefit Analysis
21 | P a g e
F. CONCLUSIONS
Based on the analysis, the benefit to cost ratio of revising 23 CFR 630.1108 to address MAP-21 Section 1405 is estimated to be 0.37:1 and the net average benefits were found to be - $764.8M. This implies that the safety benefits of implementing positive protection devices in work zones in accordance with this rule are expected to be outweighed by the total costs of implementing the barriers. It should be noted that this analysis only spans one year, and costs may decrease over time as work zone managers and contractors find ways to cut down on delay cost, and if there are improvements in barrier installation and transportation technology. While costs may decrease over time, benefits will likely remain steady or increase only slightly as traffic volumes and the amount of road rehabilitation increase. As noted in the assumptions section, each work zone varies in scope and at times will incur additional costs that are not included in this analysis for items such as right of way needed, shoulder pavement modifications needed for barrier wall placement in work zones, any barrier wall that may need to be relocated and associated MOT costs, and increased property damage due to presence of barrier wall in proximity to the travel lanes. This analysis assumes that 20% of the work zones are impacted. We estimate that this is a very conservative number and that more work zones will be impacted. See appendix A for a sensitivity analysis that assumes 15% and 25% of projects are impacted.
Support for MAP-21 Section 1405: Cost-Benefit Analysis
22 | P a g e
Appendix A
The preceding analysis in the report assumed that 20% of the long-duration work zones on high speed facilities would be impacted. As previously mentioned, this 20% estimate is derived from the fact that approximately 10% of all work zones crashes are due to intrusions37; it is assumed that work zones that are involved in intrusion crashes are those that did not have positive protection measures implemented and that half of these work zones not using positive protection experienced an intrusion crash.
This appendix has a sensitivity analysis assuming that 15% and 25% of the long-duration work zones on high-speed facilities are impacted. These estimates are derived from the 10% of all work zones crashes due to intrusions. The 15% impacted work zone rate assumes that two-thirds of the work zones not using positive protection experienced an intrusion crash (i.e., 15% of work zones did not use positive protection, and two-thirds of those work zones, or 10% of the total, had an intrusion) . The 25% impacted work zone rate assumes that two-fifths of the work zones not using positive protection experienced an intrusion crash (i.e., 25% of work zones did not use positive protection and two-fifths of those work zones – 10 % of the total - had an intrusion).
37 Ullman, G., Categorization of Work Zone Intrusion Crashes, http://tti.tamu.edu/conferences/traffic_safety11/program/6-breakout/ullman.pdf

Support for MAP-21 Section 1405: Cost-Benefit Analysis
23 | P a g e
Data assuming 15% of Work Zones are impacted- Sensitivity Analysis
Nationwide Work Zone Activity Estimation
15% of projects impacted
Number of: Low Estimate
High Estimate
Total Work Zones 12,208 14,650
No Escape Work Zones-28% 3,418 4,102 Long Duration Work Zones 82.4% X ( all WZ minus No Escape WZ) 7,245 8,694
Work Zones that satisfy Rule Criteria 10,663 12,796
Work Zones impacted by Rule (assumes 15% of all applicable work zones currently do not implement positive protection measures)
No Escape Work Zones 513 615
15% of the value above Long Duration Work Zones
1,087 1,304 15% of the value above
Work Zones impacted by the Rule 1,599 1,919
Summary of Costs for Implementation Summary of Costs for Implementation - 15% of projects impacted
Total Material Cost
Total Maintenance of Traffic Cost
Total Productivity Loss
& Additional Admin Cost
Total Cost
Low Cost Estimate $581,004,732 $219,124,123 $32,633,131 $832,761,986 High Cost Estimate $697,205,679 $262,948,947 $39,039,635 $999,194,261
Average Cost Estimate $639,105,206 $241,036,535 $35,836,383 $915,978,123
Net Benefits – 15% of projects impacted
Low Cost Estimate High Cost Estimate Average National Cost Estimate
Net Benefits ($376,236,239) ($542,668,515) ($459,452,377) Benefit to Cost Ratio 0.55:1 0.46:1 0.5:1
Support for MAP-21 Section 1405: Cost-Benefit Analysis
24 | P a g e
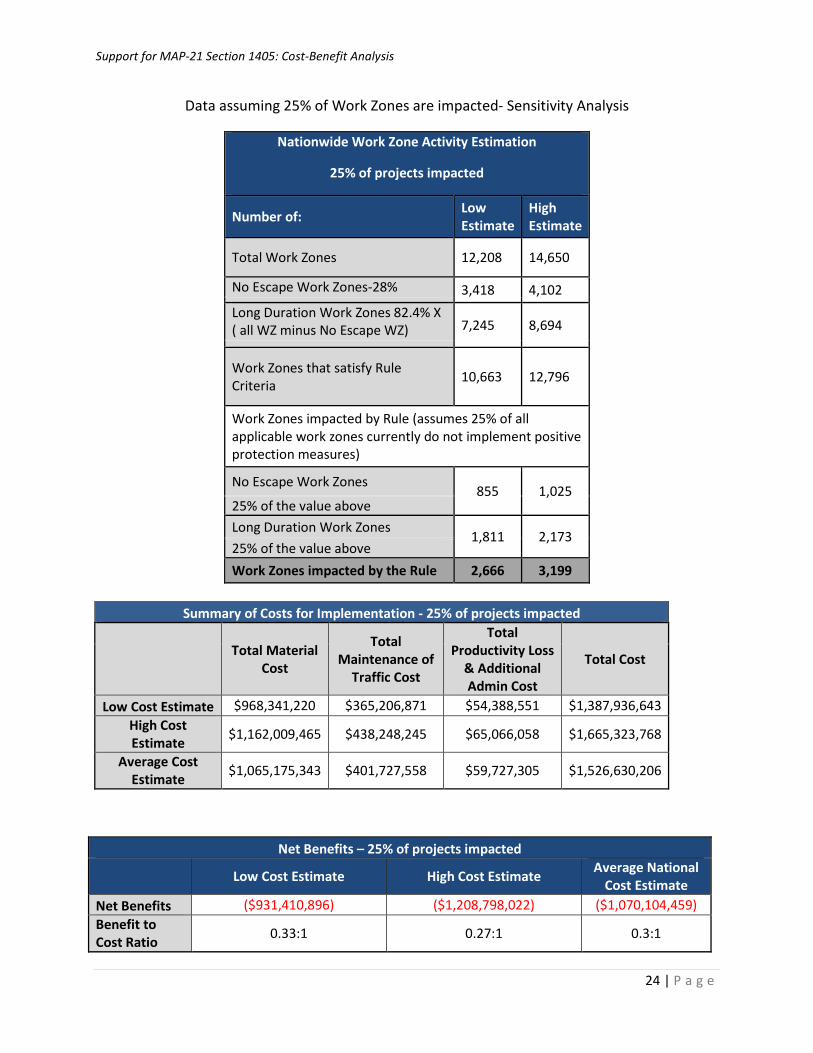
Data assuming 25% of Work Zones are impacted- Sensitivity Analysis
Nationwide Work Zone Activity Estimation
25% of projects impacted
Number of: Low Estimate
High Estimate
Total Work Zones 12,208 14,650
No Escape Work Zones-28% 3,418 4,102 Long Duration Work Zones 82.4% X ( all WZ minus No Escape WZ) 7,245 8,694
Work Zones that satisfy Rule Criteria 10,663 12,796
Work Zones impacted by Rule (assumes 25% of all applicable work zones currently do not implement positive protection measures)
No Escape Work Zones 855 1,025
25% of the value above Long Duration Work Zones
1,811 2,173 25% of the value above Work Zones impacted by the Rule 2,666 3,199
Summary of Costs for Implementation Summary of Costs for Implementation - 25% of projects impacted
Total Material Cost
Total Maintenance of
Traffic Cost
Total Productivity Loss
& Additional Admin Cost
Total Cost
Low Cost Estimate $968,341,220 $365,206,871 $54,388,551 $1,387,936,643 High Cost Estimate $1,162,009,465 $438,248,245 $65,066,058 $1,665,323,768
Average Cost Estimate $1,065,175,343 $401,727,558 $59,727,305 $1,526,630,206
Net Benefits – 25% of projects impacted
Low Cost Estimate High Cost Estimate Average National Cost Estimate
Net Benefits ($931,410,896) ($1,208,798,022) ($1,070,104,459) Benefit to Cost Ratio 0.33:1 0.27:1 0.3:1

Support for MAP-21 Section 1405: Cost-Benefit Analysis
25 | P a g e