supplying choice: an analysis of school … · milwaukee parental choice (pilot) program, which...
TRANSCRIPT

Yujie Sude, Corey A. DeAngelis, & Patrick J. Wolf
June 26, 2017
Education Research Alliance NOLA.orgUAedreform.org/school-choice-demonstration-project
Technical Report
SUPPLYING CHOICE: AN ANALYSIS OF
SCHOOL PARTICIPATION IN VOUCHER
PROGRAMS IN DC, INDIANA, AND LOUISIANA

1
SUPPLYING CHOICE: AN ANALYSIS OF SCHOOL PARTICIPATION DECISIONS IN VOUCHER PROGRAMS IN DC, INDIANA, AND LOUISIANA
Yujie Sude Department of Education Reform,
University of Arkansas [email protected]
Corey A. DeAngelis
Department of Education Reform, University of Arkansas
Patrick J. Wolf, Ph.D. Department of Education Reform,
University of Arkansas [email protected]
Louisiana Scholarship Program Evaluation Report #9 June 2017
School Choice Demonstration Project, University of Arkansas, Fayetteville, AR
Education Research Alliance for New Orleans, Tulane University, New Orleans, LA
Acknowledgments We thank the Smith Richardson Foundation for financial support for this research. We gratefully acknowledge Grant Clayton, Douglas Harris, Robert Maranto, and Lindsay Weixler for their extensive comments on previous drafts and the Louisiana Department of Education for their cooperation and assistance with providing the necessary data to conduct the analyses. The content of the report is solely the responsibility of the authors and does not necessarily represent the views of the Smith Richardson Foundation, University of Arkansas, Tulane University, or the Louisiana Department of Education.
2
Supplying Choice: An Analysis of School Participation Decisions in
Voucher Programs in DC, Indiana, and Louisiana
Abstract
Since school voucher funds are public, policymakers fiercely debate how those funds should be
spent. A goal of many decision-makers is to ensure that every private school option is “high-
quality” through program accountability regulations. Private schools, however, have a say in the
matter. They can decide whether or not to participate in a private school choice program and
likely factor the type and level of program regulations into that decision.
We examine the impacts of private school regulations on the supply-side of voucher
programs in D.C., Indiana, and Louisiana. Private schools value their autonomy. Therefore, we
expect that regulatory burden will be negatively associated with the quality of schools that
choose to participate in a choice program. Independent private schools that accept substantial
regulation from the state are likely to be financially distressed and more willing to change their
educational model in exchange for access to voucher-funded students.
We employ a linear probability model to examine how school quality, as measured by
tuition-level and Great School Review scores, is associated with program participation for
schools. Our results largely confirm our hypothesis that higher tuition levels and larger cohort
enrollments, conditions normally associated with high quality schools, identify schools that are
less likely to participate in voucher programs. We also find a consistent negative relationship
between Great Schools Review score and the school participation decision, indicating lower
quality schools have a higher tendency of participating in voucher programs in all three states,
however the coefficients are not significantly different from zero. State fixed effects reveal that

3
private schools in D.C. and Louisiana, the two states that have higher regulatory burdens, are less
likely to participate in voucher programs.
Keywords: private school, school vouchers, participating school, decision-making model, school
choice, program evaluation, tuition, school regulation
4
Supplying Choice: An Analysis of School Participation Decisions in
Voucher Programs in DC, Indiana, and Louisiana
1. Introduction
Private school choice programs have proliferated across the United States since the 1990’s
(EdChoice, 2017). They include three different designs for supporting access to private
schooling: school vouchers, tax-credit scholarships, and Education Savings Accounts. From the
Milwaukee Parental Choice (pilot) Program, which served 341 students in 19901, to the Florida
Tax-Credit Scholarship Program, which enrolled almost 100,000 students in the spring of 20172,
private school choice programs have been considered a policy solution that addresses educational
quality and equity concerns by introducing competitive pressures, funding individual students
rather than schools, and empowering families to control their child’s educational experience
(Friedman, 1955).
The core hypothesis behind private school choice is that market-oriented programs will
have positive effects on student achievement by a) providing more opportunities for students to
attend high quality private schools, and b) allowing parents to choose the schools that best fit
their children’s particular needs. The underlying assumption that the average quality of the
private schools that accept voucher students would exceed the average of all the local public
schools, and those private schools would be more effective in improving student learning,
however, is uncertain. Systematic reviews of the participant effects of private school choice on
student test scores suggest that effects tend to be positive but also small and inconsistent,
especially in the U.S. (e.g. Shakeel, Anderson & Wolf, 2016; Epple, Romano & Urquiola, 2015). 1 ED.C.hoice: Wisconsin – Milwaukee Parental Choice Program, available at https://www.eD.C.hoice.org/school-choice/programs/wisconsin-milwaukee-parental-choice-program/. 2 ED.C.hoice: Florida Tax Credit Scholarship Program, available at: https://www.eD.C.hoice.org/school-choice/programs/florida-tax-credit-scholarship-program/.

5
The answer to the question of what effect school choice has on student test scores tends to be: “It
depends.” One factor it likely depends upon is the supply of choice schools.
Most empirical studies of private school choice programs have focused on demand side
considerations of student achievement and parent preferences. Only a few choice studies have
considered the supply side: the schools receiving voucher students (e.g. McShane, 2015). The
studies of participating choice schools that do exist are merely descriptive and not analytical. As
a result, little attention has been paid to the supply side of voucher programs; specifically, the
supply of schools under differing regulatory environments. The public, scholars, and
policymakers have little systematic knowledge regarding what kinds of schools participate in
voucher programs, why they do so, and what the implications might be for student achievement.
This report remedies this shortcoming in the literature by analyzing what school
characteristics predict participation in private school voucher programs in multiple states.
Specifically, we estimate the key factors that drive schools’ choices to participate based on cross-
sectional data from the 2014-15 school year from the private school voucher programs in the
District of Columbia (D.C.), Louisiana, and Indiana. Our report shows that schools with lower
tuition, smaller enrollment, and higher minority-density student populations tend to be more
likely to participate in voucher programs. Schools with those features normally are considered
“low quality” schools. All else equal, private schools with religious affiliations are more likely to
participate in voucher programs.
This report makes substantial contributions to both the scholarly and practitioner fields. A
better understanding of the supply side of voucher programs will help new and existing school
choice programs refine their quality constraints regarding market entry. Our analysis also

6
provides scholars and policymakers with a new approach to understanding how voucher program
effects are mediated by the quality of schools induced to participate.
2.Prior Studies of School Voucher Programs in the U.S.
Hundreds of evaluations have assessed the effect of school choice on various outcomes.
School voucher, tax-credit scholarship, and Education Savings Account (ESA) programs, all of
which provide public subsidies to families that allow them to choose a private school for their
child, have proliferated across the country over the past few decades. Currently, 52 such
programs have been enacted in 28 states plus the District of Columbia (EdChoice, 2017).
Dozens of empirical studies focus on the impact of private school choice on student
outcomes as defined by student test scores, attainment and college enrollment (e.g. Cowen et al.,
2013; Greene, Peterson, & Du, 1999; Howell et al., 2002; Rouse, 1998; Witte et al., 2014; Wolf
et al., 2013). A recent meta-analysis finds that choice programs tend to have positive and
statistically significant test score effects, especially in math, when they are publicly funded, and
when they take place outside of the U.S. (Shakeel, Anderson, & Wolf, 2016). Other, less
comprehensive, reviews of the test score effects of school choice (e.g. Epple, Romano &
Urquiola, 2015; Rouse & Barrow, 2008; Wolf, 2008) conclude that results tilt positive but only
most clearly for African American students. These reviews all agree that the size and statistical
significance of school voucher impacts on test scores vary substantially from place to place,
suggesting that the kinds of private schools that compose a given voucher program influence its
effects on students.
Frederick Hess (2010) argues that school choice programs have filled seats in existing
private schools but have failed to entice new high quality private schools to open. Similarly, John
Chubb and Terry Moe (1990) point out that a narrow focus on the demand-side of the

7
educational market will fail to provide parents with abundant high quality choices. In Michael
McShane’s edited book New and Better Schools: the Supply Side of School Choice (2015),
private school choice researchers and practitioners summarize the challenges that choice
programs face in creating marketplaces to drive improvement in the education sector. The twelve
chapters provide a broad discussion of how to improve the scale and quality of the supply of
private schools participating in choice programs; however, they are mostly suggestive and
theoretical, failing to provide robust solutions to enhance the supply side of private school choice
programs. In particular, the literature does not describe the characteristics of participating
institutions, how the participating schools are different from their non-participating counterparts,
and why specific schools choose to participate in voucher programs.
Some empirical studies fill this gap by providing descriptive information about the types
of private schools that decide to participate in school voucher programs. Religiosity plays an
important role in enrolling choice students. By 2011, 107 private schools served voucher
students in Milwaukee, with 86 percent of them ascribing to one of 10 different religious
affiliations (McShane et al., 2012). Moreover, Catholic schools enroll a majority of voucher
students in most voucher programs (Wolf et al., 2010; Austin, 2015). Howell et al. (2006) find
that urban voucher-receiving private schools tend to have small class sizes, minimal facilities,
and few special programs for disadvantaged students. Austin (2015) reports that participating
schools in the Indiana Choice Scholarship Program (ICSP) have larger enrollments than non-
participating schools. Abdulkadiroglu, Pathak and Walters (2015) find that lower quality private
schools, as measured by declining enrollment and lower tuition rates, are more likely to
participate in the Louisiana Scholarship Program (LSP).

8
Private schools with longer experience participating in a voucher program are more likely
to offer special programs for struggling students (Stewart, Jacob, & Jensen, 2012). Ford (2011)
analyzes the exit patterns of private schools from the MPCP, finding that the schools with lower
enrollment growth rates are more likely to leave. His follow-up study of Milwaukee voucher
schools reports that schools experiencing enrollment growth had significantly higher proportions
of students achieve proficiency than the schools that experienced enrollment declines, suggesting
that private institutions with higher quality tend to attract larger enrollments compared to lower-
performing schools. This advantage fades out, however, after controlling for the descriptive
characteristics of schools such as years in the program, proportion of the student body made up
of voucher students, and religious affiliation (Ford, 2016).
A small number of studies have examined potential barriers to school participation in
school choice programs. A recent survey of leaders at participating and non-participating private
schools in Louisiana, Indiana, and Florida suggests that program regulation is a major concern
(Kisida, Wolf, & Rhinesmith, 2015). Twenty-six percent of the leaders of non-participating
private schools in Florida, 62 percent of them in Indiana, and 64 percent of them in Louisiana
listed “Future regulation that might come with participation” as their major reason for not
participating in the program (Kisida, Wolf, & Rhinesmith, 2015, 17-19). These responses
suggest that private schools are highly sensitive to regulatory creep in making participation
decisions regarding school choice programs. Stuit and Doan (2013) generate regulatory burden
scores for the private school choice programs in the U.S. They find that private school
participation rates are lower in more regulated school choice programs. Egalite (2015) suggests
that revenue constraints, shortages of facility space, and state regulations are the major concerns
for school leaders in determining whether to participate in a voucher program.

9
The school voucher research base is a tale of two literatures. The empirical research on
the effects of voucher programs on student outcomes is broad, deep, rigorous and causal. The
empirical research on what kinds of schools participate in school voucher programs is relatively
thin and descriptive. Since the private schools in a voucher program are, to a significant extent,
the program itself, the lack of analyses of school participation in private school choice programs
is a hole that cries to be filled. We take a step in that direction by examining school participation
in three private school voucher programs that operate under different policy contexts.
3.Theory and Hypothesis
Studies examining the effectiveness of private school choice programs are static in that
they examine initiatives as they exist. While that approach is sound from a program evaluation
standpoint, since a school choice program is what it is, these studies may underestimate the
potential effects choice has on students since individual schools choose whether to participate in
voucher programs. We customize a decision-making model for the specific case of private
schools participating in a voucher program by considering the benefit of additional funding and
the costs tied to state-driven regulation.
Benefits of Participating in Voucher Programs
Intuitively, the most obvious economic benefit for schools participating in choice
programs is to acquire additional resources by receiving voucher students. Of course, financial
benefits will vary across schools based on their specific cost structures and capacities. The
further a given school’s enrollment is from full capacity, the lower the marginal cost is for
accepting an additional student. To the degree that marginal cost exceeds zero, the incentive for
an institution to participate is the voucher amount minus the average cost per student. Almost all
schools have a financial incentive to participate in a voucher program so long as they are not at

10
full capacity and have tuition levels at or below the voucher amount. Other than receiving
voucher-based revenue, we expect that schools will achieve greater economies of scale by
participating in a voucher program, even when the maximum voucher amount does not fully
cover the average cost of educating a student at that school.
Furthermore, private schools may still elect to participate in voucher programs even if
they lose money on each student, since the schools gain the nonfinancial benefit of social
responsibility or what organizational theorists call “purposive benefits” (Wilson, 1989). We
suspect that religious schools value social responsibility more than secular ones.
Costs of Participating in Voucher Programs
There are two types of costs for schools participating in voucher programs. Participating
schools must provide tuition subsidies when per-pupil costs exceed the state-determined voucher
amount, as few voucher programs allow schools to charge families top-up fees above the
voucher maximum. Thus, schools with higher per-pupil costs have a financial incentive not to
participate in voucher programs. The other type of cost is the additional regulatory burden. Many
voucher programs require private schools to administer state standardized tests, undergo
financial audits, surrender admissions policies to the state, and conform to teacher certification
standards. Complying with these requirements costs money.
Regulatory burdens will have an absolute cost and a relative cost for private schools
within the same location. Each voucher program has a consistent set of regulations that apply to
all private schools within the program’s geographic reach. In that sense, the costs of compliance
are absolute and only vary across programs. In another sense, the costs of compliance are relative
and vary for individual schools within a given location. Schools that are vastly different from the
traditional public school model will face much higher regulatory costs associated with necessary

11
adjustments. For example, if an institution’s educational model did not rely on standardized tests
before, switching into a voucher program that requires standardized testing would be relatively
more costly than it would be for a private school used to testing its students.
School Participation Decision Making Model
As shown in Figure 1, schools make their participation decision by comparing the
additional costs of tuition subsidization and regulatory compliance associated with participating
with the additional benefits of voucher revenue, economies of scale and enhanced social
responsibility. Theoretically, schools perceiving benefits exceeding the costs will decide to
participate in voucher programs. These schools likely have a lower tuition level and a smaller
enrollment size, or are eager for financial support and are willing to sacrifice some school
autonomy for additional funding. The private schools that meet those criteria are likely to be
lower-quality academically (Stewart, Jacob & Jensen, 2012). They also are more likely to be
religious with an explicit mission to serve disadvantaged students, no matter the cost.
Our theoretical model results in three hypotheses regarding the school voucher
participation decision. All else equal:
1. Schools with higher quality will be less likely to participate;
2. Catholic schools will be more likely to participate;
3. Schools will be less likely to participate in more highly-regulated programs;
4.Descriptions of Programs
We focus on three school voucher programs: the D.C. Opportunity Scholarship Program,
the Indiana Choice Scholarship Program, and the Louisiana Scholarship Program (LSP).

12
DC Opportunity Scholarship Program
The D.C. Opportunity Scholarship Program (DC OSP) was established in January 2004
as the first federally-funded school choice program in the United States. Students must live in
D.C. in families that receive Supplemental Nutrition Assistant Program (SNAP) benefits or be at
or below 185 percent of the poverty line ($44,955 for a family of four in 2016-17). Students are
given priority in receiving a scholarship if they have a sibling in the program or come from low-
quality public school.
The average voucher amount is $8,452 for K-8 students and $12,679 for high school
students. Even the higher voucher amount for high school is only about 47 percent of the per
pupil funding amount in D.C. public schools. In 2016-17, 1,166 students and 42 private schools
participated in the program. The average voucher value in 2016-17 is projected to be $9,472. In
order to participate in the DC OSP, private schools must require that teachers in core subjects
hold a bachelor’s degree. They also must administer a nationally norm-referenced exam to their
voucher students.
The initial gold-standard experimental evaluation of the OSP mandated by Congress
concluded that participation in the program led to significantly higher graduation rates (Wolf et
al., 2013). An evaluation of the cost effectiveness of the DC OSP found a benefit to cost ratio of
2.62, indicating that each dollar spent on the program produced 2.62 dollars in benefits (Wolf &
McShane, 2013). On the other hand, a follow-up experimental evaluation of the program
reported that student test scores in math were lower one year after receiving an Opportunity
Scholarship (Dynarski et al. 2017).

13
Indiana Choice Scholarship Program
The Indiana Choice Scholarship Program (ICSP) started in 2011 and is now the largest
school voucher program in the country. In order to qualify for the program, students must come
from a family that earns no more than 150 percent of the federal lunch program limit ($67,433
for a family of four in the 2016-17 school year). Students must be assigned to or be leaving a
public school with an "F" grade. If a student comes from a family that earns up to 200 percent of
the federal lunch program amount ($89,910 for a family of four in 2016-17), they qualify for the
program if they have a disability or if they received a voucher in the previous school year.
In 2016-17, 313 schools and 34,299 students participated in the program. The average
voucher value was $4,024 in 2015-16 (less than half of the per pupil spending in public schools).
The ICSP is the most accessible program in our study, as 54 percent of students across the state
are income-eligible.
In order to participate in the program, schools must report their graduation rates and
ratings based on the Indiana Statewide Testing for Educational Progress (ISTEP). If they are
rated a "D" or "F" for two years in a row, they are no longer eligible for the program. Schools
must administer the state tests, submit financial reporting and allow the state to have full access
to their property in order to observe classrooms. Administering the state test is customary for
most private schools in Indiana because the Hoosier State requires state testing for any school,
public or private, that wishes to participate in interscholastic extracurricular activities including
sports.
Louisiana Scholarship Program
The Louisiana Scholarship Program (LSP) started as a pilot program in New Orleans in
2008 and expanded statewide in 2012. Students must be at or below 250 percent of the poverty

14
line ($60,750 for a family of four in 2016-17) in order to qualify for the program. Students must
have attended a public school that was graded as a C, D, F, or T in the previous school year. If
the student is entering kindergarten, they must be assigned to a C, D, F, or T3 school for the
current school year. During the admission lottery for oversubscribed schools, students at a D or F
school receive priority over other students.
The voucher amount is equal to the state share of per pupil funding in the student’s home
public school district or the private school’s tuition amount, whichever is less. In 2015-16, 7,110
students and 121 schools participated in the program and the average voucher value was $5,856.
Twenty percent of the K-12 students in Louisiana were eligible for the program.
In order to participate in the LSP, private schools must use an open admissions process in
enrolling scholarship recipients and administer the same state examinations required by the
public school district. The schools must also maintain a “quality” curriculum that is equal to or
better than that of public schools, as judged by the state department of education. Private schools
are prohibited from charging students a top-up above the voucher amount. Failure to comply
with these requirements can lead to the school’s removal from the program.
Since the statewide expansion of the program in 2012, there have been several studies of
it by the School Choice Demonstration Project (SCDP). Mills and Wolf (2017) find that the LSP
had a negative effect on student math achievement after two years. However, Egalite, Mills, and
Wolf (2016) report a positive impact of the program on racial integration, especially in public
schools previously under court orders to integrate. In addition, Egalite (2016) finds some positive
competitive effects of the program on the achievement of public school students in Louisiana.
3TschoolsrefertoTurnaroundschools.Theseschoolsareledbyoperatorswhotookoverexistingfailingschoolsandmaintainallpreviousgradelevelsandstudents.A“T”lettergradeindicatetheschoolisintransition.

15
Further, the program saves money for the state and local school districts (Trivitt & DeAngelis,
2016).
Table 1 outlines attributes relevant to the participation decisions for private schools
within each of the three voucher programs included in this report. In particular, we present the
financial benefit for participating private schools within each program and the average funding
relative to the traditional public school funding amount. We also show the various regulatory
burdens associated with participation: testing, open-admissions, financial reporting, prohibition
of parental copay, and teacher certification requirements.
[Table 1 about here]
The findings in Table 1 mirror those in the 2014 voucher program scorecard released by
the Center for Education Reform.4 The scorecard examines the regulatory freedom experienced
by private schools in voucher programs in 15 locations and found that Indiana had the least
regulatory burden, scoring an A. Washington D.C. scored a B, while Louisiana scored a C. The
findings also align at least somewhat with the Stuit and Doan (2013) ranking of regulatory
burden scores for thirteen of the private school choice programs in the U.S., which rank Indiana
as least burdensome (ranked 2nd) and D.C. as the most burdensome (ranked 7th) of the three
programs included in this report.
Private schools in Louisiana and D.C. face the largest costs for participation, while
serving voucher students costs private schools in Indiana the least. Thus, we expect a
significantly lower probability of participating for schools in Louisiana and D.C. after controlling
for school characteristics.
4 School Choice Today, Voucher Laws across the States (2014). Link: https://www.edreform.com/2014/08/school-choice-today-voucher-laws-across-the-states-1/

16
Specifically, private schools participating in the D.C. Opportunity Scholarship have
additional requirements of state testing, financial reporting, and, as indicated by the low
eligibility rate, less-advantaged voucher students. The D.C. voucher program also has additional
teacher certificate requirements; thus we expect D.C. Catholic schools (which do not require
certification) are less apt to participate relative to Catholic schools in Indiana and Louisiana.
Private schools participating in the LSP have additional requirements of state testing,
open-admissions, financial reporting, prohibition of parental copay, and, as indicated by the low
eligibility rate, the least-advantaged voucher students. On the other hand, private schools
participating in the LSP tend to receive slightly more public funding, on average, relative to
those in D.C. and Indiana. Because high-quality private schools appear to have the most to risk
in Louisiana, we expect that they will be the least likely to participate in their voucher program.
Private schools in Indiana appear to have much lower costs tied to their participation
decision. In particular, they do not have to use an open-admissions process or additional teaching
requirements, and are allowed to accept parental funds above and beyond the voucher amount.
Additionally, private schools in Indiana can benefit from a large increase in demand from
students who are relatively less costly to educate, as indicated by the comparatively high
eligibility rate of 54 percent. However, private schools in Indiana seem to experience a slightly
lower financial benefit per student, as indicated by an average voucher value that is only 42
percent of the public school funding level. Nonetheless, private schools participating in Indiana’s
voucher program are not compelled to accept the voucher amount as full-payment. Because high-
quality private schools appear to have the least to risk in Indiana, we do not expect quality levels
to be related to program participation decisions in that state.

17
The decision makers who shaped these three private school choice programs did not
operate in a vacuum. State context is important to how choice programs are designed and that
context varied across D.C., Indiana, and Louisiana. In D.C., President Bush and congressional
leaders designed the Opportunity Scholarship Program as a pilot project to learn how private
school choice might affect low-income families in the nation’s capital (Stewart & Wolf, 2014).
For Indiana, the Choice Scholarship Program was the state’s second private school choice
program, building on a limited tax-credit scholarship program launched in 2010. Thus, the
Indiana program represented a policy breakthrough long in the works for Hoosiers (Austin
2015).
Louisiana has been home to a large individual tax deduction program since 2008. Up to
$5,000 in education expenses, including private school tuition, can be deducted from the family’s
state taxable income. Private schools in Louisiana benefit from the tax deduction policy
whenever the parents of students attending their school claim the tax deduction, as over 100,000
families did in 2012, because it makes private school tuition more affordable to middle class
families (EdChoice 2017). The tax deduction policy does not benefit low-income families in the
state, however, because they rarely itemize their tax deductions. In enacting the Louisiana
Scholarship Program, policymakers sought an additional private school choice initiative
designed specifically and intentionally to serve low-income students whose families did not
benefit from the tax deduction policy.
5. Data
The data used in this report includes participating school lists in three locations for the
2014-15 school year and school-level characteristics linking to the decision of whether to
participate in a voucher program. The participation status of each school is obtained from the

18
annual report of the voucher program for each state (Indiana Department of Education, 2016;
Louisiana Department of Education, 2014). According to the reports, 492 K-12 private schools
received voucher students across the three locations in the 2014-15 school year: 47 in the District
of Columbia, 314 in Indiana, and 131 in Louisiana.
Measures of school characteristics were obtained from the publicly available Private
School Universe Survey (PSS) database for the most recent school year of 2013-2014. The PSS
is a nation-wide survey of all the private schools in the U.S. conducted every two years since
1988-89. Information missing from the PSS was collected from lists provided by nationwide
private school associations, state departments of education, and other sources. In the 2013-14
survey, 42 D.C. private schools, 329 Indiana private schools5 and 284 private schools in
Louisiana were included, for a total of 655 private schools. We used information from the
Private School Review website for 12 DC OSP participating schools that were not included in
the PSS (2013-14), resulting in 667 schools with information on school characteristics.
In addition to the PSS, we collected 2015-16 school tuition levels by searching school
websites and calling the schools, when necessary. We combine the tuition information along
with the PSS survey data to describe the school characteristics for both voucher participating
schools and non-participating schools. Descriptive statistics of school characteristics are in Table
2.
Program participation rates differed across locations. The rate was 78 percent for D.C.,
70 percent for Indiana, and 33 percent for Louisiana, indicating that private schools in Louisiana
were particularly unlikely to participate in the LSP.
5 Excludes 168 Amish schools and 9 closed schools.

19
Lastly, we use data from the Great Schools6 website for our analysis of the relationship
between parent reviews and program participation. The original scale takes on integer values
from one to five, with five the most positive. We aggregate a school’s Great Schools Review
score into a continuous variable that ranges from one to five by weighting it on the frequency of
parent’s rating on each score. The aggregated Great School Review score has a mean of 4.18
with the standard deviation of 0.698, indicating a small variation between schools.
Table 3 describes the quality of the data we use to conduct this study. Overall, the private
schools that are included in our report represent almost 70 percent of the private school
population in the three states, indicating a highly representative sample.
[Table 2 about here]
[Table 3 about here]
6. Methods
To test our hypotheses, we apply linear probability models to estimate the school’s
participation choice. At the school level, the participation equation is:
𝑦! = 𝛽!𝑇𝑢𝑖𝑡𝑖𝑜𝑛_𝑠𝑢𝑏𝑠𝑖𝑑𝑦!+𝛽!𝐸𝑛𝑟𝑜𝑙𝑙𝑚𝑒𝑛𝑡! + 𝛽!𝑆𝑐ℎ𝑜𝑜𝑙𝐴𝑡𝑡𝑟𝑖𝑏𝑢𝑡𝑒𝑠! + 𝛽!𝐶𝑎𝑡ℎ𝑜𝑙𝑖𝑐! +𝜌! + 𝜀! (1)
The dependent variable of interest, the likelihood that school i participates in a voucher
program in the year 2014-15 is a function of the amount of the school tuition, average cohort
enrollment size, religious affiliation, and other school characteristics. We conduct the analyses
across states and within each state.
Four independent variables of interest are used separately and in combination in the
analysis. One set of models combine school tuition with average cohort enrollment to produce a
6 Parent review score, weighted on number of reviewers. link: http://www.greatschools.org/

20
“revenue” variable that represents both the price and quantity of each school’s educational
service. A second set of models disaggregates total revenue into its separate components of
tuition level and enrollment level.7 A third set of models replaces tuition and enrollment with
each school’s Great Schools review score, using reputation as a proxy for school quality. Since
we anticipate that schools with higher tuition, larger enrollment, and higher Great Schools
review scores, those normally considered higher-quality schools, will be less likely to participate
in a given program, we expect that the coefficient estimates for these explanatory variables will
be negative, especially in Louisiana and D.C.
We first present a model that does not use school-level controls, since including them
would deteriorate our treatment of interest. If tuition levels reflect several school-level
characteristics, we may not want to include any controls. Theoretically, if everything that the
family receives is reflected in the price of the school, a model that controls for all school
characteristics purchased by tuition would perfectly remove the coefficient on tuition level.
Nevertheless, we also include a model with school-level controls as a robustness check.
The variable Enrollment describes school i’s average cohort enrollment (in hundreds),
which may indicate an economies of scale benefit introduced by accepting additional voucher
students. If enrollment is a measure of consumer demand, it is also a quality variable of interest.
As we hypothesize schools with smaller enrollment that have lower marginal costs of admitting
additional voucher students are more likely to participate in the program, we anticipate that 𝛽!
will also be negative.
Additionally, the school participation decision is influenced by other control variables
included as School Attributes. These control variables are other educational and environment
7Weuseaveragegradecohortenrollmentasthevariableinourmodelsbecausekeycontrolvariablesforschoollevel(elementary,middle,andhigh)arestronglycorrelatedwithtotalschoolenrollment.

21
characteristics that may influence school i’s overall quality and expenses. We control for school
institutional characteristics, including an indicator of whether school i is an elementary-only
(below 7th grade), secondary (offering grades between 7 and 12), or combined (all k12 levels).
We also control for percentage of minority students within a school, whether the school has a
library or media center, and the average length of a school day.
Catholic is a binary variable that indicates if school i is a Catholic school. The
coefficient, 𝛽!, is expected to be positive since religious schools generally show a higher
willingness to take on social responsibilities. However, we would expect it to be negative for
OSP, since D.C. has strict requirements on teacher certification which set additional barriers for
Catholic schools to participate in the program.
Along with all the variables described above, 𝜌 in the Equation (1) denotes the specific
program, j, that the school i, was in, and 𝜀 refers to the random errors. At the cross state level, we
conduct a program fixed effect regression with the Indiana Choice Scholarship Program as the
default, and would expect a negative sign for the coefficients on the D.C. and Louisiana indicator
variables, which refers to a lower participating tendency of private schools in those two sites.
7. Results
Tuition- and Enrollment
The revenue variable behaves as expected in our analysis. Higher revenue is negatively
associated with the decision to participate in a private school choice program in models that
exclude control variables for school amenities but changes to a positive association with
participation controlling for the school features that revenue buys. None of the coefficients on
the revenue variable effect are statistically significant.

22
Our primary results that solely include tuition and average cohort enrollment as separate
variables at the cross state level using state and city fixed effects largely confirm our first
hypothesis, as shown in Column 2, Table 4. We find that schools with higher tuition are less
likely to choose to participate in voucher programs: a $1,000 increase in school tuition is
associated with a 0.9 percentage point reduction in the likelihood of participating in a voucher
program, marginally significant at p<.1. Schools with larger cohort enrollment are also less
likely to participate in voucher programs, though this association is not statistically significant.
The effect of tuition fades out after controlling for school characteristics that are related to the
tuition level, as shown in Column 2 through 4, and the effects of cohort enrollment remain
negative and insignificant across all the models. Additionally, Column 8 indicates the Catholic
schools have a higher tendency of participating in voucher programs than non-Catholic schools,
across all three states, statistically significant at p<.01.
In the meantime, the coefficients on the state fixed effects of D.C. and Louisiana are
consistently negative across all the models, and the magnitude of Louisiana is significantly larger
than D.C., indicating that controlling for school characteristics, private schools in Louisiana and
D.C., the two states that share larger regulatory burdens, are less likely to participate in voucher
programs than those in Indiana, with the least participation in Louisiana. These results align with
our expectation. Comparisons of school participation decision making across states reveal similar
stories, as shown in Appendix 1.
[Table 4 about here]
Table 5 presents the full linear regression model estimation for each of the states. As a
result, tuition is negatively associated with school voucher program participation in all three
states, and attains statistical significance in D.C. and Indiana. Specifically, a $1,000 increase in

23
school tuition is predicted to reduce a school’s likelihood of participating in the DC OSP by 1.9
percentage points (p<.05), and in the ICSP by 3 percentage points (p<.05), all else equal. The
average cohort enrollment only predicts school participation in the voucher program in
Louisiana. Controlling for other school characteristics, an increase of 10 students in average
cohort enrollment reduces a school’s likelihood of participating in the LSP by 2.8 percentage
points (p<.05).
Catholic schools in Indiana and Louisiana are 41.1 and 24.2 percentage points,
respectively, more likely to participate in voucher programs than their non-Catholic counterparts.
Catholic private schools in D.C. have less likelihood of participating in the DC OSP, though this
association is not statistically significant at p<.05.
Lastly, private schools with a higher proportion of minority students are more likely to
participate in the LSP, statistically significant at p<.01. On the other hand, such schools are less
likely to participate in the OSP and ICSP, though this association fails to reach statistical
significance.
We also adopt probit models with city fixed effects for a robustness check, restricting our
analytical samples to schools that have counterparts within the same city. Those schools are
largely the urban and high-tuition schools. The results from probit models are similar to those we
obtained from the linear probability model in Table 4 and 5 and are reported in Appendix 2.
[Table 5 about here]
Great Schools Review Score
Great Schools reviews provide a more direct measure of private school quality. We were
able to obtain scores from 40 schools in D.C., 217 schools in Indiana, and 221 schools in
Louisiana. Table 6 indicates a potential negative relationship between Great Schools review

24
scores and school decisions to participate in a voucher program. The coefficient on the effect of a
school’s review school and the likelihood of participation is negative in D.C. and Louisiana and
indicates that a one-unit increase in Great Schools review score is associated with a 12
percentage point lower likelihood of participating in the LSP and a 5.1 percentage point lower
likelihood of participating in the DC OSP. In Indiana, the relationship reverses and a one-unit
increase in Great Schools Review score is associated with a 0.3 percentage point higher tendency
of participating in the ICSP. However, these effects are not statistically significant. This might be
due to the small variance of the Great Schools Review score. More than three quarters of schools
in our sample have a Great School Review score larger than 4, meaning there is little variance in
the rating and therefore little likelihood of a consistent relationship with the participation
decision. Results remain similar after controlling for school characteristics.
State fixed effects indicate that private schools in DC and Louisiana are less likely to
participate in voucher programs compared to schools in Indiana. Schools in Louisiana, the state
with highest burden of regulation, have the lowest tendency of participating, with the association
significant at p<.01.
[Table 6 about here]

25
8. Discussion and Policy Implications
The results in our model without school-level controls largely confirm our hypotheses.
The relationship between the level of tuition required of private schools and their decision to
participate in a voucher program is negative. The results in our model with school-level controls
also show a negative relationship, however statistical significance only remains for the negative
effect of tuition levels on participation in the D.C. and Indiana programs. This is likely because
controlling for school-level characteristics diminishes our treatment of interest if these
characteristics are reflected in the cost of attending the school. The effect of cohort enrollment, a
potential indicator of quality, on school participation decisions appears to vary across the three
locations. In D.C. the effect of enrollment on participation is positive but not statistically
significant. In Indiana it is negative but not significant. The relationship between cohort
enrollment and school participation is negative and statistically significant in Louisiana. Higher-
enrollment private schools are much less interested in participating in the school choice program
in Louisiana than in Indiana or DC, where cohort enrollment levels do not clearly factor into the
decision.
Our analysis of Great Schools review scores shows a negative, though statistically
insignificant, relationship with program participation, likely due to the small variation on Great
Schools Review scores among the schools. Catholic schools consistently display a significantly
higher likelihood of participating in school choice programs, after controlling for school
characteristics.Private schools in D.C. and Louisiana have a significantly smaller likelihood of
participating in voucher programs than in Indiana, with the least participation in Louisiana,
which has the highest regulatory burden.

26
This report contributes to the existing literature on understanding the supply side of
voucher programs: what kind of schools are receiving the voucher students, and what school
characteristics predict the likelihood of participating in a private school choice program. We
demonstrate a simple model of rational decision-making to allow us to illustrate what kinds of
private schools will and will not choose to participate in a private school choice program. Our
report contributes to an improved understanding of the supply side of voucher programs that can
assist engineers of new and existing school choice programs. In particular, policymakers should
be cautious about the consequences of attempting to control the quality of schools within a
voucher program. In attempting to control quality through regulation, decision-makers may
inadvertently limit the number of high-quality choices available to disadvantaged students across
the United States. A second key lesson is that the effects of proxy measures of school quality on
private school participation decisions depend at least somewhat on context.

27
References
Abdulkadiroglu, A., Pathak, P. A., & Walters, C. R. (2015). Free to choose: Can school choice
reduce student achievement?. National Bureau of Economic Research.
Austin, M. J. (2015). Schools’ responses to voucher policy: Participation decisions and early
implementation experiences in the Indiana Choice Scholarship Program. Journal of
School Choice, 9(3), 354-379.
Chubb, J. E., & Moe, T. M. (1990). Politics, markets, and America's schools. Brookings
Institution Press.
Cowen, J., Fleming, D., Witte, J., Wolf, P., & Kisida, B. (2013). School vouchers and student
attainment: Evidence from a state-mandated study of Milwaukee’s parental choice
program. Policy Studies Journal, 41(1), 147-168.
Dynariski, Rui, Webber, Gutmann, & Bachman (2017). Evaluation of the D.C. Opportunity
Scholarship Program. Impacts after one year. NCEE 2017-4022. U.S. Department of
Education.
Epple, D., Romano, R. E., & Urquiola, M. (2015). School vouchers: A survey of the economics
literature (NBER Working Paper No. 21523). Cambridge, MA: National Bureau of
Economic Research.
EdChoice (2017). The ABCs of School Choice. Available at https://www.edchoice.org/wp-
content/uploads/2017/02/The-ABCs-of-School-Choice-1.pdf.
Egalite, A. J. (2015). Choice program design and school supply. In McShane, M. Q. (ed.) (2015).
New and Better Schools: The Supply Side of School Choice (PP.163-184). Lanham, MD:
Rowman & Littlefield.
28
Egalite, A. J. (2016). The competitive effects of the Louisiana Scholarship Program on public
school performance. Available at SSRN: https://ssrn.com/abstract=2739783
Egalite, A. J., Mills, J. N., & Wolf, P. J. (2016). The impact of the Louisiana Scholarship
Program on racial segregation in Louisiana schools. Available at SSRN:
https://ssrn.com/abstract=2738785
Friedman, M. (1955). The role of government in public education. In R. Solo (Ed.), Economics
and the Public Interest, (pp. 123–153). New Brunswick, NJ: University of Rutgers Press.
Ford, M. (2011). School exits in the Milwaukee parental choice program: Evidence of a
marketplace. Journal of School Choice, 5(2), 182-204.
Ford, M. (2016). Changes in school enrollment patterns after the first-time release of school-
level test scores in Milwaukee’s school voucher program: a first look. Education and
Urban Society, 48(5), 460-478.
Forster, G. (2016). A win-win solution: The empirical evidence on school choice. EdChoice.
Greene, J. P., Peterson, P., & Du, J. (1999). Effectiveness of school choice: The Milwaukee
experiment. Education and Urban Society, 31(2), 190-213.
Hess, F. M. (2010). Does school choice “work”. National Affairs, 5(1), 35-53.
Howell, W. G., Peterson, P. E., Wolf, P. J., & Campbell, D. E. (2006). The education gap:
Vouchers and urban schools, second edition. Washington, D.C.: Brookings Institution.
Howell, W., Wolf, P., Campbell, D., & Peterson, P. (2002). School vouchers and academic
performance: Results from three randomized field trials. Journal of Policy Analysis and
Management, 21(2), 191-217.
Indiana Department of Education (2016). Choice Scholarship Program Annual Report:
Participation and Payment Data. Available at

29
http://www.doe.in.gov/sites/default/files/choice/2015-2016-choice-scholarship-program-
report-final-july-update.pdf.
Kisida, B., Wolf, P. J., & Rhinesmith, E. (2015). Views from Private Schools. Washington, D.C.:
American Enterprise Institute.
Louisiana Department of Education (2014). 2014-15 Scholarship School List. Available at
https://www.louisianabelieves.com/docs/default-source/school-choice/2014-2015-
scholarship-school-list-(interactive).pdf
McShane, M. Q. (ed.) (2015). New and Better Schools: The Supply Side of School Choice.
Lanham, MD: Rowman & Littlefield.
McShane, M. Q., Kisida, B., Jensen, L. I., Wolf, P. J. (2012). Milwaukee Parental Choice
Program: Descriptive report on participating schools 2010-11. School Choice
Demonstration Project Milwaukee report #33, University of Arkansas.
Mills, J. N., & Wolf, P. J. (2017). Vouchers in the bayou: The effects of the Louisiana
Scholarship Program on student achievement after 2 years. Educational Evaluation and
Policy Analysis, 0162373717693108.
Rouse, C. (1998). Private school vouchers and student achievement: An evaluation of the
Milwaukee Parental Choice Program. Quarterly Journal of Economics, 553-602.
Rouse, C. E., & Barrow, L. (2008). School vouchers and student achievement: Recent evidence
and remaining questions. National Center for the Study of the Privatization of Education.
Shakeel, M., Anderson, K. P., & Wolf, P. J. (2016). The participant effects of private school
vouchers across the globe: A meta-analytic and systematic review.EDRE Working Paper
No. 2016-07. Available at SSRN: https://ssrn.com/abstract=2777633

30
Stewart, T., Jacob, A. M., & Jensen, L. I. (2012). School site visits: What can we learn from
choice schools in Milwaukee? School Choice Demonstration Project Milwaukee report
#34. Fayetteville, University of Arkansas.http://files.eric.ed.gov/fulltext/ED530069.pdf
Stewart, T., & Wolf, P. J. (2014). The school choice journey: School vouchers and the
empowerment of urban families, New York: Palgrave Macmillan.
Stuit, D., & Doan, S. (2013). School choice regulations: Red tape or red herring. Thomas B.
Fordham Institute, 15-19.
Trivitt, J. R., & DeAngelis, C. A. (2016). The Fiscal Effect of Eliminating the Louisiana
Scholarship Program on State Education Expenditures.EDRE Working Paper No. 2016-
06. Available at SSRN: https://ssrn.com/abstract=2768956
Wilson, James Q. (1989). Bureaucracy, New York: Basic Books.
Witte, J. F., Wolf, P. J., Cowen, J. M., Carlson, D. E., & Fleming, D. J. (2014). High-stakes
choice: Achievement and accountability in the nation’s oldest urban voucher
program. Educational Evaluation and Policy Analysis, 36(4), 437-456.
Wolf, P. J. (2008). School voucher programs: What the research says about parental school
choice. Brigham Young University Law Review, 2008, 415-446.
Wolf, P., Gutmann, B., Puma, M., Kisida, B., Rizzo, L., Eissa, N., & Carr, M. (2010). Evaluation
of the D.C. Opportunity Scholarship Program: Final report. U.S. Department of
Education, Institute of Education Sciences, National Center for Education Evaluation and
Regional Assistance, Washington, D.C.: U.S. Government Printing Office, NCEE 2010-
4018.

31
Wolf, P. J., Kisida, B., Gutmann, B., Puma, M., Eissa, N., & Rizzo, L. (2013). School vouchers
and student outcomes: Experimental evidence from Washington, D.C.. Journal of Policy
Analysis and Management, 32(2), 246-270.
Wolf, P. J., & McShane, M. (2013). Is the juice worth the squeeze? A benefit/cost analysis of the
District of Columbia opportunity scholarship program. Education Finance and
Policy, 8(1), 74-99.

32
Additional Costs
1. Tuition
2. Regulations for Participants
Additional Benefits
1. Additional Financing Support (Voucher Amount)
2. Decreased per-pupil expenditures
3.Enhanced Social Responsibility
Non-participants
Costs > Benefits
- Not eager for money
- Higher regulatory burden
Participants
Costs < Benefits
- Need the money
- Less regulatory burden
Participation Decision
Figure 1: Cost Benefit Decision Making Model

33
Table 1: Participation Costs and Benefits for Each Voucher Program
Feature D.C. Indiana Louisiana Date Enacted 2004 2011 2008 Average Funding Relative to Public School 47% 42% 54% Eligibility Rate 35% 54% 20% Testing Requirement Y Y Y Open-Admissions Process Y Financial Reporting Y Y Y Parental Copay Prohibited Y Teacher Requirements Y Ranking of State Laws for School Choice Voucher Programs (Center for Education Reform,2014)
B A C
Regulatory Burden Score Ranking (Stuit & Doan, 2013).
7 2 5
Notes: Ranking of State Laws for School Choice Voucher Programs ranges from A to F with A indicating the lowest regulatory burden and F indicating the highest regulatory burden. Ranking of Regulatory Burden Score is taken from Table4 in Stuit & Doan (2013). School choice regulations: Red tape or red herring. Washington, D.C.: Thomas B. Fordham Institute. It ranges from 1 to 13 with 1 indicating the highest regulatory burden and 13 indicating the lowest regulatory burden.
Table 2: School Characteristics Descriptive Statistics
Obs Mean Std. Dev. Min Max Overall Tuition ($1,000) 515 7.264 6.102 1.900 49.666 D.C. 51 18.600 12.246 3.255 49.666 Indiana 224 6.101 2.929 1.90 20.645 Louisiana 240 5.941 3.202 2.000 19.660 Great School Review Score 483 4.186 0.698 1 5 D.C. 40 4.276 0.561 2.923 5 Indiana 221 4.293 0.749 1 5 Louisiana 222 4.063 0.648 1 5 Average Grade Cohort Enrollment (100) 665 0.351 0.420 0.010 2.828 Catholic School 667 0.496 0.500 0 1 Elementary-Only School 667 0.657 0.475 0 1 Library or Media Center 667 1.895 0.307 1 2 Percent of Minority Students 661 0.284 0.317 0 100 Length of School Day In Total Hours 665 6.997 0.508 5.33 11

34
Table 3: Sample Descriptive Analysis
Overall D.C. Indiana Louisiana
(1) Count of Participating Schools 492 47 314 131
(2) Count of PSS Schools (2013-14) 667 54 329 284
(3) Matched Participating Schools 366 42 231 93
Participating Schools Match Rate= (3)/(1) 74% 89% 74% 71%
(4) Program Participation Rate=(3)/(2) 54.87% 77.78% 70.21% 32.75%
(5) Count of Schools with Tuition Rate 515 51 224 240
Tuition Match Rate = (5)/(2) 77.21% 94.44% 68.09% 84.51%
(6) Count of Schools with Great Schools Review Score 483 40 221 222
Great Schools Review Score Match Rate= (6)/(2) 72.41% 74.07% 67.17% 78.17%

35
Table 4: School Quality on Participation Decision, across states (1) (2) (3) (4) (5) (6) (7) (8) Revenue (Ln) -0.021 -0.02 0.043 0.006
(0.039) (0.037) (0.032) (0.038)
Tuition ($1,000) -0.009* -0.012** -0.006 0
(0.005) (0.005) (0.007) (0.006)
Average Grade Cohort Enrollment (100) -0.057 -0.093 -0.021 -0.114
(0.087) (0.106) (0.078) (0.076)
Elementary School 0.052 0.025 0.054 0.018 -0.124 -0.12
(0.065) (0.066) (0.063) (0.068) (0.084) (0.077)
Secondary School 0.047 0.109 0.019 0.052 -0.171* -0.072
(0.097) (0.118) (0.092) (0.130) (0.102) (0.117)
Length of School Day In Total Hours 0.1 0.06 0.053 0.034 0.044 0.011
(0.070) (0.078) (0.068) (0.075) (0.054) (0.049)
Has Library or Library Media Center -0.009 0.09 -0.075 0.005
(0.087) (0.084) (0.115) (0.123)
Percentage of Minority Student 0.458** 0.314 0.410*** 0.335***
(0.222) (0.219) (0.113) (0.102)
Catholic School 0.269*** 0.267***
(0.069) (0.064)
DC -0.142** -0.091* -0.127* -0.068 -0.441*** -0.270* -0.249* -0.175
(0.064) (0.055) (0.070) (0.044) (0.144) (0.141) (0.134) (0.111)
LA -0.511*** -0.537*** -0.479*** -0.542*** -0.730*** -0.697*** -0.644 -0.596
(0.021) (0.021) (0.070) (0.072) (0.158) (0.155) (0.400) (0.401)
Constant 1.278** 1.027*** 0.61 0.613 0.012 0.569 0.636 0.762*
(0.520) (0.017) (0.678) (0.537) (0.547) (0.493) (0.615) (0.417)
N 514 514 511 511 509 509 509 509 Adjusted R Squared 0.249 0.513 0.26 0.528 0.306 0.548 0.346 0.581
*** p< 0.01, ** p< 0.05,* p< 0.10. Notes: Linear Probability coefficients. All models use city fixed effects. Robust standard error in parentheses, clustered at city level.

36
Table 5: School Quality on Participation Decision, by states
DC Participant
Indiana
Louisiana
Participant Participant
(1) (2) (3) (4) (5) (6) Revenue (Ln) -0.046
0.025
-0.045
(0.052)
(0.060)
(0.060)
Tuition ($1,000)
-0.019**
-0.030** -0.005
(0.008)
-0.012 (0.009)
Average Grade Cohort Enrollment (100)
0.091
-0.021 -0.282**
(0.082)
-0.085 (0.122)
Elementary School -0.183 -0.224 -0.216 -0.223 -0.076 -0.078
(0.140) (0.150) (0.147) -0.162 (0.124) (0.105)
Secondary School -0.134 -0.129 -0.25 -0.072 -0.14 0.049
(0.166) (0.181) (0.163) -0.168 (0.156) (0.164)
Length of School Day In Total Hours -0.05 0.015 0.17 0.198 0.019 0.022
(0.079) (0.056) (0.119) -0.128 (0.065) (0.065)
Has Library or Library Media Center 0.185 0.314 -0.182 -0.105 0.043 0.026
(0.274) (0.239) (0.168) -0.126 (0.198) (0.193)
Percentage of Minority Student 0.032 -0.202 -0.042 -0.117 0.617*** 0.553***
(0.193) (0.191) (0.177) -0.13 (0.155) (0.137)
Catholic School 0.085 -0.112 0.401*** 0.411*** 0.210** 0.242**
(0.114) (0.122) (0.108) -0.109 (0.105) (0.098)
Constant 1.649** 0.641 -0.322 -0.29 0.336 -0.273
(0.627) (0.626) (1.182) -1.011 (0.896) (0.513)
N 47 47 223 223 240 240 Adjusted R Squared 0.081 0.194 0.283 0.314 0.235 0.53 *** p< 0.01, ** p< 0.05,* p< 0.10. Notes: Linear probability in coefficients. All models use city fixed effects. Robust standard error in parentheses, clustered at city level.

37
Table 6: Linear Probability of Great Schools Review Score on Participation Decision
Overall D.C. Indiana Louisiana Overall D.C. Indiana Louisiana
Participant Participant Participant Participant Participant Participant Participant Participant
Great Schools Review Score (Weighted) -0.051 -0.051 0.003 -0.118 -0.018 -0.188 0.024 -0.039
(0.051) (0.138) (0.042) (0.109) (0.612) (0.129) (0.583) (0.634)
Catholic
0.276*** 0.206* 0.315*** 0.284***
(0.000) (0.079) (0.005) 0.000
Elementary School
-0.118 0.07 -0.157 -0.146
(0.128) (0.708) (0.203) (0.129)
Secondary School
-0.173* -0.036 -0.068 -0.315*
(0.078) (0.857) (0.631) (0.050)
Length of School Day In Total Hours
-0.04 -0.13 -0.066 -0.026
(0.717) (0.566) (0.448) (0.906)
Has Library or Library Media Center
0.347*** 0.091 0.016 0.582***
(0.001) (0.605) (0.882) (0.000)
Percentage of Minority Student
0.032 -0.036 0.155 0.043
(0.581) (0.696) (0.224) (0.621)
D.C. -0.156***
-0.485***
(0.006)
(0.000)
LA -1.037***
-1.066***
(0.037)
(0.000)
Constant 1.222*** 1.067* 0.983*** 0.422 1.244*** 1.067* 0.008 0.44
(0.224) (0.590) (0.212) (0.392) (0.231) (0.590) (0.211) (0.395)
N 478 40 217 221 475 38 216 221 R Squared 0.575 0.006 0.518 0.394 0.643 0.21 0.623 0.52 *** p< 0.01,* p< 0.10, ** p< 0.05. Notes: All models use city fixed effects. Robust standard error in parentheses, clustered at city level.

38
Appendix 1: The Effect of School Quality on Participation Decision Using Linear Probability Model, by states DC (1) (2) (3) (4) (5) (6) (7) (8) Revenue (Ln) -0.018
-0.049
-0.04
-0.046
(0.036)
(0.033)
(0.053)
(0.052) Tuition ($1,000)
-0.005
-0.010*
-0.015**
-0.019**
(0.005)
(0.005)
(0.006)
(0.008)
Average Grade Cohort Enrollment (100)
0.09
0.092
0.071
0.091
(0.058)
(0.070)
(0.080)
(0.082)
Elementary School
-0.056 -0.096 -0.142 -0.239 -0.183 -0.224
(0.127) (0.138) (0.127) (0.151) (0.140) (0.150)
Secondary School
0.016 -0.022 -0.076 -0.173 -0.134 -0.129
(0.160) (0.158) (0.146) (0.173) (0.166) (0.181)
Length of School Day In Total Hours
-0.048 -0.027 -0.051 0.003 -0.05 0.015
(0.068) (0.047) (0.083) (0.051) (0.079) (0.056)
Has Library or Library Media Center
0.2 0.273 0.185 0.314
(0.250) (0.246) (0.274) (0.239)
Percentage of Minority Student
0.079 -0.158 0.032 -0.202
(0.235) (0.149) (0.193) (0.191)
Catholic School
0.085 -0.112
(0.114) (0.122)
Constant 1.091** 0.839*** 1.966*** 1.178*** 1.514** 0.721 1.649** 0.641
(0.524) (0.070) (0.725) (0.413) (0.573) (0.622) (0.627) (0.626)
N 51 51 49 49 47 47 47 47 Adjusted R Squared 0.004 0.034 0.037 0.104 0.069 0.18 0.081 0.194 *** p< 0.01,* p< 0.10, ** p< 0.05. Notes: All models use city fixed effects. Robust standard error in parentheses, clustered at city level.
39
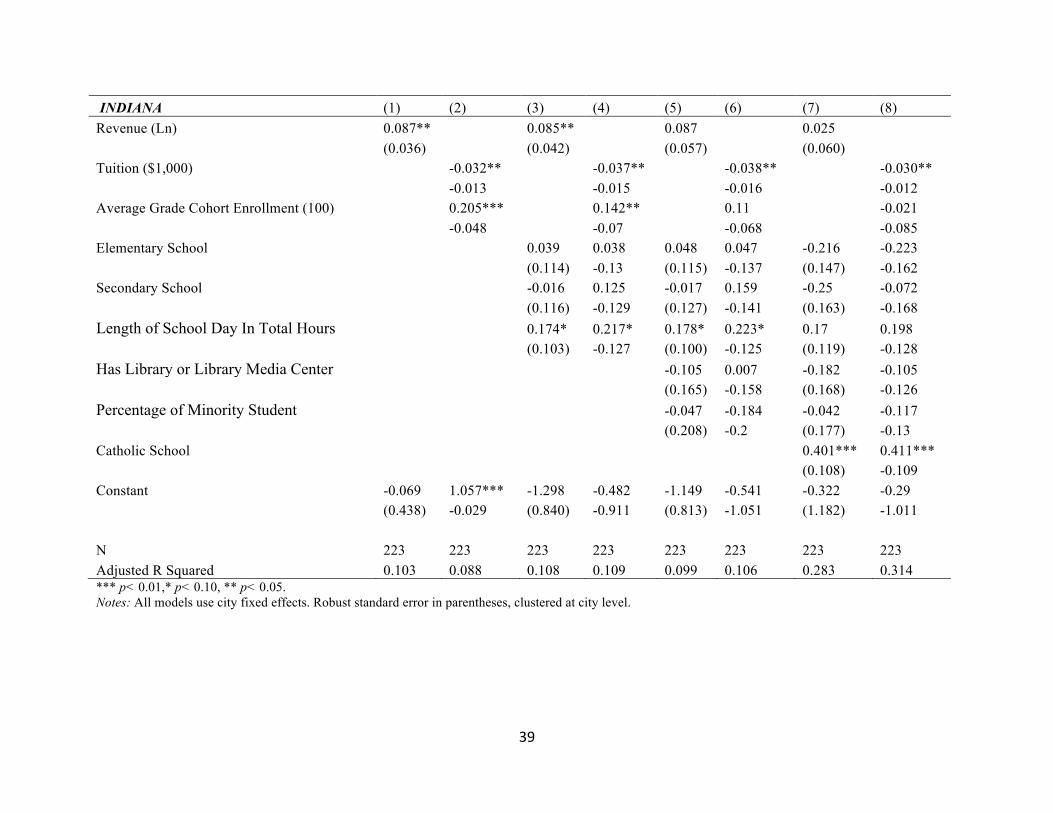
INDIANA (1) (2) (3) (4) (5) (6) (7) (8) Revenue (Ln) 0.087**
0.085**
0.087
0.025
(0.036)
(0.042)
(0.057)
(0.060) Tuition ($1,000)
-0.032**
-0.037**
-0.038**
-0.030**
-0.013
-0.015
-0.016
-0.012
Average Grade Cohort Enrollment (100) 0.205***
0.142**
0.11
-0.021
-0.048
-0.07
-0.068
-0.085
Elementary School
0.039 0.038 0.048 0.047 -0.216 -0.223
(0.114) -0.13 (0.115) -0.137 (0.147) -0.162
Secondary School
-0.016 0.125 -0.017 0.159 -0.25 -0.072
(0.116) -0.129 (0.127) -0.141 (0.163) -0.168
Length of School Day In Total Hours 0.174* 0.217* 0.178* 0.223* 0.17 0.198
(0.103) -0.127 (0.100) -0.125 (0.119) -0.128
Has Library or Library Media Center
-0.105 0.007 -0.182 -0.105
(0.165) -0.158 (0.168) -0.126
Percentage of Minority Student
-0.047 -0.184 -0.042 -0.117
(0.208) -0.2 (0.177) -0.13
Catholic School
0.401*** 0.411***
(0.108) -0.109
Constant -0.069 1.057*** -1.298 -0.482 -1.149 -0.541 -0.322 -0.29
(0.438) -0.029 (0.840) -0.911 (0.813) -1.051 (1.182) -1.011
N 223 223 223 223 223 223 223 223 Adjusted R Squared 0.103 0.088 0.108 0.109 0.099 0.106 0.283 0.314 *** p< 0.01,* p< 0.10, ** p< 0.05. Notes: All models use city fixed effects. Robust standard error in parentheses, clustered at city level.

40
LOUISIANA (1) (2) (3) (4) (5) (6) (7) (8) Revenue (Ln) -0.120** -0.116** 0.001 -0.045
(0.060) (0.056)
(0.048)
(0.060)
Tuition ($1,000)
-0.024*
-0.027*
-0.01
-0.005
(0.013)
(0.015)
(0.008)
(0.009)
Average Grade Cohort Enrollment (100) -0.256**
-0.365***
-0.178
-0.282**
(0.103)
(0.136)
(0.150)
(0.122)
Elementary School
0.011 0.028 0.066 0.048 -0.076 -0.078
(0.087) (0.092) (0.084) (0.088) (0.124) (0.105)
Secondary School
-0.026 0.237 0.013 0.151 -0.14 0.049
(0.149) (0.202) (0.136) (0.216) (0.156) (0.164)
Length of School Day In Total Hours
0.076 0.092 0.02 0.037 0.019 0.022
(0.101) (0.109) (0.071) (0.074) (0.065) (0.065)
Has Library or Library Media Center
0.089 0.114 0.043 0.026
(0.157) (0.156) (0.198) (0.193)
Percentage of Minority Student
0.678*** 0.554*** 0.617*** 0.553***
(0.161) (0.142) (0.155) (0.137)
Catholic School
0.210** 0.242**
(0.105) (0.098)
Constant 1.703** 0.106*** 1.145* -0.554 -0.354 -0.465 0.336 -0.273
(0.848) (0.039) (0.609) (0.696) (0.597) (0.415) (0.896) (0.513)
N 240 240 240 240 240 240 240 240 Adjusted R Squared 0.112 0.434 0.102 0.45 0.213 0.506 0.235 0.53 *** p< 0.01,* p< 0.10, ** p< 0.05. Notes: All models use city fixed effects. Robust standard error in parentheses, clustered at city level.

41
Appendix 2: The Effect of School Quality on Participation Decision Using Probit Model, full model
Cross Sites DC
Participant Indiana
Louisiana
Participant Participant Participant (1) (2) (3) (4) (5) (6) (7) (8) Revenue (Ln) 0.009 -0.071
-0.02
-0.032
(0.030) (0.050) (0.024)
(0.046) Tuition ($1,000) 0
-0.020***
-0.023***
-0.002
(0.005)
(0.007)
(0.005)
(0.010)
Average Grade Cohort Enrollment (100) -0.128
0.357*
-0.16
-0.315**
(0.085)
(0.216)
(0.130)
(0.137)
Elementary School -0.121* -0.144* -0.213 -0.144 -0.201*** -0.272** -0.091 -0.099
(0.069) (0.074) (0.147) (0.107) -0.062 (0.111) (0.107) (0.091)
Secondary School -0.169* -0.086 -0.142 0.092 (0.010) 0.12 -0.151 0.029
(0.086) (0.120) (0.155) (0.141) -0.123 (0.134) (0.131) (0.132)
Length of School Day In Total Hours 0.025 0.022 -0.05 0.023 0.268*** 0.372*** -0.023 -0.016
(0.049) (0.071) (0.046) (0.037) -0.081 (0.094) (0.063) (0.064)
Has Library or Library Media Center -0.002 0.015 0.166 0.286** (0.094) -0.013 0.057 0.042
(0.118) (0.104) (0.169) (0.129) -0.078 (0.091) (0.159) (0.151)
Percentage of Minority Student 0.465*** 0.393** -0.024 -0.084 0.097 0.037 0.715*** 0.618***
(0.102) (0.160) (0.137) (0.168) -0.127 (0.120) (0.127) (0.124)
Catholic School 0.298*** 0.336*** 0.064 -0.186* 0.569*** 0.604*** 0.248*** 0.290***
(0.060) (0.078) (0.089) (0.099) (0.075) (0.057) (0.089) (0.079)
DC 0.132 0.167
(0.200) (0.108) LA -0.238 -0.234** (0.286) (0.109) N 317 317 47 47 111 111 159 159 *** p< 0.01,* p< 0.10, ** p< 0.05. Notes: All models use city fixed effects. Robust standard error in parentheses, clustered at city level.

42