supply chain visibility traverse systems
TRANSCRIPT

© HENRY STEWART PUBLICATIONS 2516-1814 JOURNAL OF SUPPLY CHAIN
MANAGEMENT, LOGISTICS AND PROCUREMENT VOL. 1, NO. 3, 218–233 WINTER 2018–191
Supply Chain Visibility: From analogue to aggregation — a brief history and guide to implementation
DAVID BARNARDhas over 20 years of cross-functional Fortune 500 industry and consulting experience and a proven track record of creating innovative and sustainable supply chain solutions through expanding capabilities, optimising processes, leveraging partner collaboration and reducing operating expenses. As Principal of Strategic Supply Chain Solutions, David works with clients to leverage their supply chain as a competitive advantage through supply chain optimization, strategic business improvements and operational assessments. Working in a diverse array of industries, he has successfully implemented supply chain visibility at multiple companies and has presented on this topic at national and international conferences, including CSCMP, RVCF and SCOPE. David holds an MBA and BBA from the University of Georgia. He also has the distinction of being a licensed US Customs Broker.
KEYWORDSsupply chain visibility, data aggregation, data kernel, control tower
David Barnard
IntroductionA consumer places an order for a product from her hand-held device on Tuesday morning. Within minutes, she receives a text or email with the order confirmation number and expected delivery time for Wednesday afternoon. Later in the day on Tuesday, she receives another push message with the shipment tracking number and confirmation of delivery time. On Wednesday morning, she receives a message from the shipping company
with a shipment update and by Wednesday afternoon, the consumer receives another message confirmation of the package left at her front door. This ability to provide tracking through every stage of an order’s life cycle is known as supply chain visibility (SCV). The consumer, as well as all companies engaged in the transaction, can track the order step-by-step to see real-time status across the supply chain from origin to final destination. The
ABSTRACTSupply chain visibility (SCV) is the ability to track an order step-by-step to see real-time status updates across the supply chain from origin to final destination. Visibility enables a company to know exactly where their product is in the shipment process and can be a significant driver for a company’s improved profitability and relationships with its trading partners. While SCV is a standard expectation for e-commerce orders, adoption of visibility capabilities for non-e-commerce companies is surprisingly low. Improved visibility provides companies numerous benefits by lowering costs and reducing inventory while increasing efficiency and accountability. Business investment in new technology, increased collaboration and higher maturity levels lead to full visibility for all trading partners, while utilisation of data aggregation technology provides a single version of the truth. This paper analyses the substantial value derived through supply chain visibility, and discusses how more companies could benefit from implementing SCV capabilities.

© HENRY STEWART PUBLICATIONS 2516-1814 JOURNAL OF SUPPLY CHAIN
MANAGEMENT, LOGISTICS AND PROCUREMENT VOL. 1, NO. 3, 218–233 WINTER 2018–19
SUPPLY CHAIN VISIBILITY
2
consumer now knows, with a high degree of confidence, ‘where’s my stuff’.
With the explosive growth of online shopping, order visibility is a required capability all e-commerce customers expect, but surprisingly SCV has remained out of reach for many companies not engaged in e-commerce transactions. According to Geodis’ 2017 Supply Chain Worldwide Survey, 1 supply chain visibility ranks as the third-highest priority among supply chain leaders, but only 6 percent of the firms have complete visibility into their end-to-end networks and 77 percent have either no visibility or a restricted view Even more astounding, 70 percent of the same supply chain leaders consider their supply chain to be very or extremely complex and 74 percent use four or five different transportation modes within their supply chain.
With acute interest expressed for greater end-to-end order tracking and control, how can more companies achieve a higher level of supply chain visibility?
A Brief History of Supply Chain VisibilityIn the pre-digital world of analogue processes, c.1980s and earlier, if a company buyer wanted to know the status of their order, they had to call, e-mail or fax the supplier or transportation provider. That person then called, e-mailed or faxed other people until they reached the right person who had access to the answer. By the time the original questioner got an answer, the status may have changed, setting off another round of personal and time-consuming inquiries. With these analogue communication processes, keeping track of multiple shipments from multiple suppliers took an army of employees. As a result, many companies only reacted to delayed or partial shipments rather than being proactive and addressing disruptions earlier in the process.
Several technological developments changed the way in which companies managed their supply chains. In the mid-1980s, the concept of vendor managed inventory (VMI) began to gain traction, whereby the seller directly managed the buyer’s inventory levels through shared inventory data to mitigate the risk of the buyer running out of the seller’s products. To facilitate VMI, buyers provided frequent updates of sales performance and on-hand inventory levels to their suppliers via electronic spread-sheets. When the inventory reached a predetermined level, the supplier would ship more merchandise to the buyer. Companies recognised the value of VMI programmes and adoption across many industries continued into the 1990s and beyond.
During the nascent days of business digitalisation in the 1990s, companies began to invest in management control systems, such as enterprise resource planning (ERP), warehouse management system (WMS) and transportation management system (TMS). These inter-nally focused tools created tremendous value, as companies suddenly had greater visibility and control of their own operations.
By the early 2000s, many companies fine-tuned these management control systems and were able to have accurate and timely visibility to products within their direct control. An analyst could ‘see’ inside one or all of these systems to identify the status of an order and know where was it in production, where was it in storage, when was it picked for shipment, who moved the shipment and when was it delivered. These systems, however, were stand-alone silos of information within the organisation. In a few instances these internal systems were integrated with each other within the same company, but rarely did they communicate or integrate with trading partners’ systems, except when managing specific processes, such as inventory through
© HENRY STEWART PUBLICATIONS 2516-1814 JOURNAL OF SUPPLY CHAIN
MANAGEMENT, LOGISTICS AND PROCUREMENT VOL. 1, NO. 3, 218–233 WINTER 2018–19
SUPPLY CHAIN VISIBILITY
3
VMI. If someone wanted to know the status of a transaction managed by another company, they still had to call, e-mail or send a fax. The main difference from the analogue world was that the information was easier to find and more precise.
In the early 2010s, companies began challenging the existing practice of e-mailing spreadsheets by connecting with customers and suppliers through data transmissions in a point-to-point fashion. With point-to-point, the buyer’s and seller’s systems were directly integrated with each other, meaning input from one system provided updates to the other system. Transaction data was sent electronically between buyer and seller, with information flowing from one system to the corresponding receiving system. The automatic transmission of data, which provided a seamless and timely sharing of knowledge rather than relying on manual updates to the system, allowed the buyer to share and receive data directly with each trading partner individually. There was, however, no transaction visibility between the buyer’s partners.
Companies realised if there was tremendous value in having visibility into one’s own operations, the value of visibility into upstream and downstream partner activities would be even greater. The challenge was how to integrate various company operating systems within a reasonable time frame and without being overwhelmed by the costs of integration. Each unique functional application most likely had different data elements, field names and record lengths for the same product or activity. Within a company, integrating different systems often took sizable teams of internal associates and consultants many months or years to develop, program, implement and test. Adding to the complexity, each company likely had different priorities and objectives, which was further confounded if
there were hundreds or thousands of trading partners. Scheduled and unscheduled system updates had an impact on field structure and integration points, causing new rounds of testing and validation activities after every update.
Tying computer systems together to integrate all trading partners was not a viable solution, so a creative solution of data aggregation was developed. In a point-to-aggregation system, each trading partner sent predefined data elements to a data aggregation tool, which acted as a repository. As events occurred, partners transmitted their updates to the aggregation tool. Partners could access the repository and run their own queries to answer questions and monitor progress. The supplier data was shared but not directly integrated with the buyer’s system, so any system updates only affected the partner experiencing the change, thereby limiting the impact to the overall network of trading partners (see Figure 1).
For data aggregation to work efficiently, companies needed to automatically transmit transactional data, and this solution was provided by a framework through electronic data interchange (EDI). Created in the 1960s, EDI was originally used to transmit standardised transportation information between shippers and their carriers. Over the years, EDI standards were created for most business-to-business transactions, such as purchase orders, advance shipment notices, detailed receipt records and invoices.
By leveraging standardised EDI records and creating a mechanism to store them within a data aggregator, supply chain visibility became easier to implement. In 2010, there were only a few software firms which marketed data aggregation software. Companies wanting SCV usually built their own aggregation tools from scratch or from repurposed applications. By 2015, however, software providers recognised

© HENRY STEWART PUBLICATIONS 2516-1814 JOURNAL OF SUPPLY CHAIN
MANAGEMENT, LOGISTICS AND PROCUREMENT VOL. 1, NO. 3, 218–233 WINTER 2018–19
SUPPLY CHAIN VISIBILITY
4
FIGURE 1 Comparison between point-to-point and point-to-aggregation solutionsSource: David Barnard
Buyer
Supplier 1
Supplier 2
Buyer fully integrates with three Suppliers,
one at a timeSupplier 3
Data Receiver
Data transmission
Data transmission
Data tr
ansmission
Data Provider
POINT-TO-POINT SOLUTION
Data transmission
Integrations
Data
transmission
POINT-TO-AGGREGATOR SOLUTION
Dat
a tr
ansm
issi
on
Buyer fully integrates with Data Aggregator once, while
suppliers send and receive data as transactions occur
Buyer
Data Aggregator
Supplier 1
Supplier 2
Supplier 3
Data ReceiverData Provider
VS.
an opportunity to develop visibility solutions and were actively marketing their versions of SCV and control towers. As the name implies, control towers allowed a company to ‘control’ or ‘see’ all activity and make informed decisions with the latest information. By 2018, the number of SCV software providers increased substantially, providing companies with multiple solution options to fit the specific needs of the business.
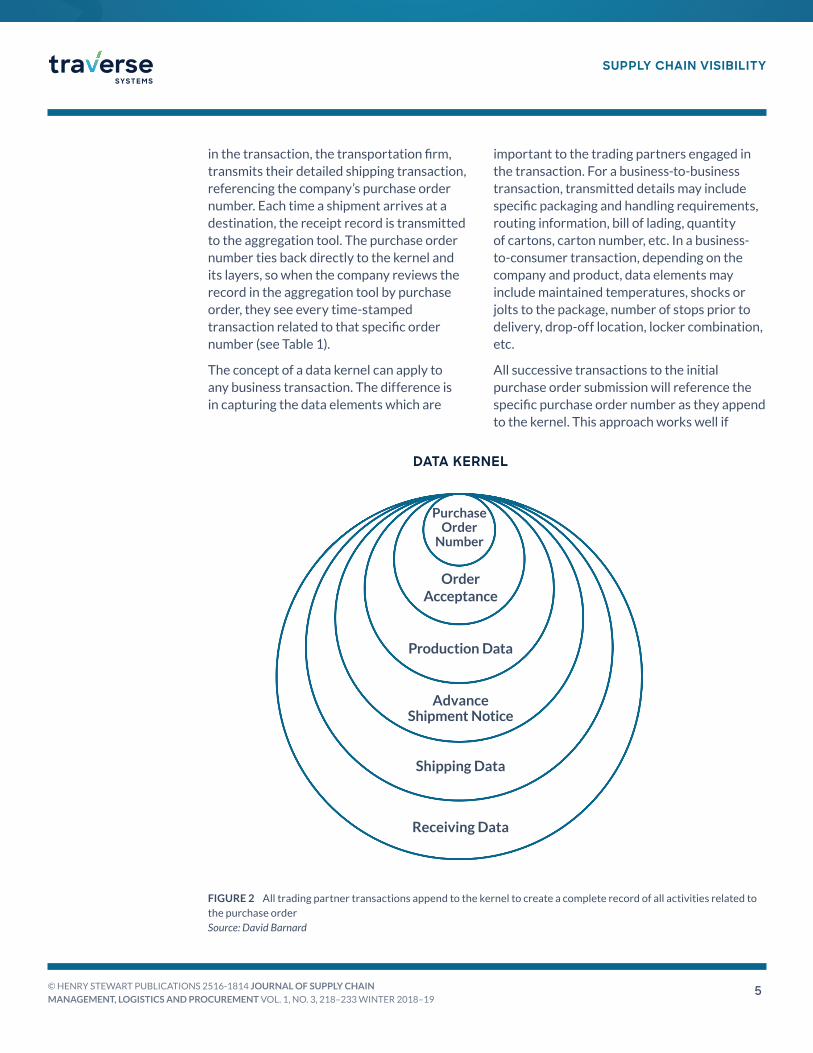
How Supply Chain Visibility WorksA key component of SCV is a kernel, as in a kernel of information. For visibility, the kernel is the starting point, or a reference number to which all future transactions will append. To work, the kernel must be a unique number which all trading partners will reference in their transactions. Typically, the purchase order is the basis of the kernel, but companies have
alternatively used unique item number, lot number, batch number, etc., as their kernel. In the most transparent networks, transactional data related to the kernel is visible to all trading partners.
At the start of a visible transaction, the company transmits a time-stamped purchase order number, which is the kernel, describing the desired product, quantity and either ship or receipt date. When the supplier receives the purchase order, they provide an order acceptance/acknowledgment or change action, which adds a layer to the kernel (see Figure 2).
As the supplier provides production updates or changes to the order, they transmit new time-stamped production information to the company, referencing the purchase order number, which adds another layer to the kernel. When the supplier ships the order, they transmit a time-stamped advanced shipment notice to the aggregation tool. The next party
© HENRY STEWART PUBLICATIONS 2516-1814 JOURNAL OF SUPPLY CHAIN
MANAGEMENT, LOGISTICS AND PROCUREMENT VOL. 1, NO. 3, 218–233 WINTER 2018–19
SUPPLY CHAIN VISIBILITY
5
Receiving Data
Shipping Data
Advance Shipment Notice
Production Data
Order Acceptance
Purchase Order
Number
DATA KERNEL
FIGURE 2 All trading partner transactions append to the kernel to create a complete record of all activities related to the purchase orderSource: David Barnard
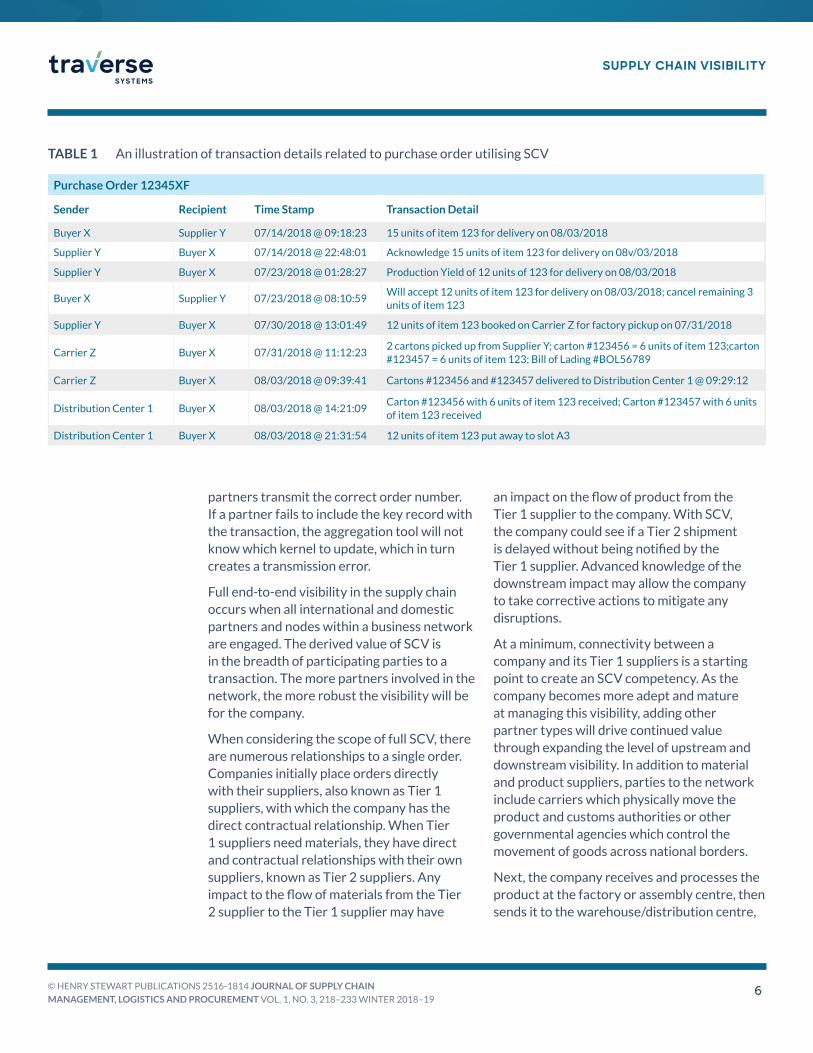
in the transaction, the transportation firm, transmits their detailed shipping transaction, referencing the company’s purchase order number. Each time a shipment arrives at a destination, the receipt record is transmitted to the aggregation tool. The purchase order number ties back directly to the kernel and its layers, so when the company reviews the record in the aggregation tool by purchase order, they see every time-stamped transaction related to that specific order number (see Table 1).
The concept of a data kernel can apply to any business transaction. The difference is in capturing the data elements which are
important to the trading partners engaged in the transaction. For a business-to-business transaction, transmitted details may include specific packaging and handling requirements, routing information, bill of lading, quantity of cartons, carton number, etc. In a business-to-consumer transaction, depending on the company and product, data elements may include maintained temperatures, shocks or jolts to the package, number of stops prior to delivery, drop-off location, locker combination, etc.
All successive transactions to the initial purchase order submission will reference the specific purchase order number as they append to the kernel. This approach works well if
© HENRY STEWART PUBLICATIONS 2516-1814 JOURNAL OF SUPPLY CHAIN
MANAGEMENT, LOGISTICS AND PROCUREMENT VOL. 1, NO. 3, 218–233 WINTER 2018–19
SUPPLY CHAIN VISIBILITY
6
TABLE 1 An illustration of transaction details related to purchase order utilising SCV
Purchase Order 12345XF
Sender Recipient Time Stamp Transaction Detail
Buyer X Supplier Y 07/14/2018 @ 09:18:23 15 units of item 123 for delivery on 08/03/2018
Supplier Y Buyer X 07/14/2018 @ 22:48:01 Acknowledge 15 units of item 123 for delivery on 08v/03/2018
Supplier Y Buyer X 07/23/2018 @ 01:28:27 Production Yield of 12 units of 123 for delivery on 08/03/2018
Buyer X Supplier Y 07/23/2018 @ 08:10:59Will accept 12 units of item 123 for delivery on 08/03/2018; cancel remaining 3 units of item 123
Supplier Y Buyer X 07/30/2018 @ 13:01:49 12 units of item 123 booked on Carrier Z for factory pickup on 07/31/2018
Carrier Z Buyer X 07/31/2018 @ 11:12:232 cartons picked up from Supplier Y; carton #123456 = 6 units of item 123;carton #123457 = 6 units of item 123; Bill of Lading #BOL56789
Carrier Z Buyer X 08/03/2018 @ 09:39:41 Cartons #123456 and #123457 delivered to Distribution Center 1 @ 09:29:12
Distribution Center 1 Buyer X 08/03/2018 @ 14:21:09Carton #123456 with 6 units of item 123 received; Carton #123457 with 6 units of item 123 received
Distribution Center 1 Buyer X 08/03/2018 @ 21:31:54 12 units of item 123 put away to slot A3
partners transmit the correct order number. If a partner fails to include the key record with the transaction, the aggregation tool will not know which kernel to update, which in turn creates a transmission error.
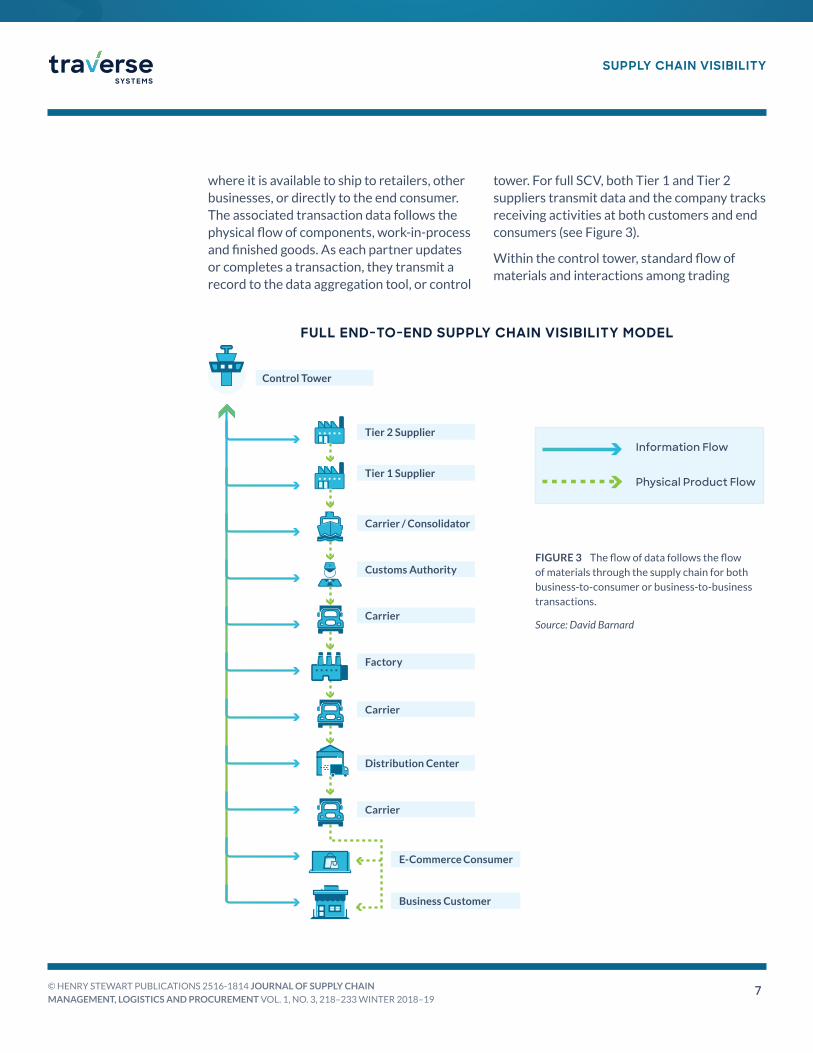
Full end-to-end visibility in the supply chain occurs when all international and domestic partners and nodes within a business network are engaged. The derived value of SCV is in the breadth of participating parties to a transaction. The more partners involved in the network, the more robust the visibility will be for the company.
When considering the scope of full SCV, there are numerous relationships to a single order. Companies initially place orders directly with their suppliers, also known as Tier 1 suppliers, with which the company has the direct contractual relationship. When Tier 1 suppliers need materials, they have direct and contractual relationships with their own suppliers, known as Tier 2 suppliers. Any impact to the flow of materials from the Tier 2 supplier to the Tier 1 supplier may have
an impact on the flow of product from the Tier 1 supplier to the company. With SCV, the company could see if a Tier 2 shipment is delayed without being notified by the Tier 1 supplier. Advanced knowledge of the downstream impact may allow the company to take corrective actions to mitigate any disruptions.
At a minimum, connectivity between a company and its Tier 1 suppliers is a starting point to create an SCV competency. As the company becomes more adept and mature at managing this visibility, adding other partner types will drive continued value through expanding the level of upstream and downstream visibility. In addition to material and product suppliers, parties to the network include carriers which physically move the product and customs authorities or other governmental agencies which control the movement of goods across national borders.
Next, the company receives and processes the product at the factory or assembly centre, then sends it to the warehouse/distribution centre,
© HENRY STEWART PUBLICATIONS 2516-1814 JOURNAL OF SUPPLY CHAIN
MANAGEMENT, LOGISTICS AND PROCUREMENT VOL. 1, NO. 3, 218–233 WINTER 2018–19
SUPPLY CHAIN VISIBILITY
7
Tier 2 Supplier
Control Tower
Tier 1 Supplier
Carrier
Carrier
Carrier
Factory
Carrier / Consolidator
Distribution Center
E-Commerce Consumer
Business Customer
Customs Authority
FULL END-TO-END SUPPLY CHAIN VISIBILITY MODEL
FIGURE 3 The flow of data follows the flow of materials through the supply chain for both business-to-consumer or business-to-business transactions.
Source: David Barnard
where it is available to ship to retailers, other businesses, or directly to the end consumer. The associated transaction data follows the physical flow of components, work-in-process and finished goods. As each partner updates or completes a transaction, they transmit a record to the data aggregation tool, or control
tower. For full SCV, both Tier 1 and Tier 2 suppliers transmit data and the company tracks receiving activities at both customers and end consumers (see Figure 3).
Within the control tower, standard flow of materials and interactions among trading
Information Flow
Physical Product Flow

© HENRY STEWART PUBLICATIONS 2516-1814 JOURNAL OF SUPPLY CHAIN
MANAGEMENT, LOGISTICS AND PROCUREMENT VOL. 1, NO. 3, 218–233 WINTER 2018–19
SUPPLY CHAIN VISIBILITY
8
partners have been mapped and time parameters have been established between transactions. If an incoming transaction falls outside the parameter, either early or late, an alert is generated to notify the appropriate parties of the transaction exception. For example, if a shipment booking transaction is expected to occur within two days prior to shipment from the supplier, any deviation to that time block generates an alert. By actively managing alerts, users can proactively address an issue before it disrupts the entire supply chain.
Built upon reliance that partners are providing accurate and truthful data, the control tower now becomes the repository of a single version of the truth for all transactions related to the kernel. As the single version of the truth, the company can access the control tower if disputes of timing and event sequences arise among the trading partners.
Business BenefitsA parcel delivery driver loses his glasses, but needs to stay on schedule. He gets into his delivery truck to make customer deliveries without being able to clearly see in front of him. If the drive is on a straight street and all the customers are on that street, customers may get their deliveries on time. Business is, however, rarely a straight road. Vendors run into production problems, order due dates are pulled in or pushed out, and bad weather causes delays at the receiving end. Without having visibility to potential hazards, it is almost impossible to proactively avoid running off the road and ultimately having an impact on customer satisfaction.
The more complex and greater number of trading partners involved with a transaction, the greater the opportunity to reduce overall costs and increase order speed and velocity. The most significant benefits of SCV are the
knowledge of where product is at all times and the ability to proactively address issues before disruptions become catastrophic. SCV is a substantial competitive advantage for any company possessing this capability.
For companies interested in deploying SCV, building a quantitative business case in support of investing in the requisite technologies and organisational capabilities must go beyond the obvious statements of avoiding supply chain disruptions. When companies, regardless of industry, have invested in SCV through network-based control towers, the results are significantly positive. According to Nucleus Research’s ‘The Real Value of Networks’,2 SCV quantitatively delivers:
• Increased inventory turns between 10–75 percent, with an average of 56 percent;
• Reduced safety stock holdings between 10–55 percent, with an average of 38 percent;
• Reduced stock outs and material shortages by 15–90 percent, with an average of 76 percent fewer stock outs and material shortages;
• Reduced expedite costs by an average of 54 percent.
In addition to becoming the single version of the truth and a seamless flow of data and information, SCV business benefits are numerous. The benefits can be quantitative improvements to cost, revenue and efficiency, or qualitative advancements of partner collaboration, compliance, accountability and user experience.
Cost Reduction
• Increased inventory turns between 10–75 percent, with an average of 56 percent
• Reduced operating costs by proactively identifying and resolving material shortages, leading to fewer production line disruptions. The company can minimise

© HENRY STEWART PUBLICATIONS 2516-1814 JOURNAL OF SUPPLY CHAIN
MANAGEMENT, LOGISTICS AND PROCUREMENT VOL. 1, NO. 3, 218–233 WINTER 2018–19
SUPPLY CHAIN VISIBILITY
9
shipment expedites by awareness of potential delays with advance warning;
• Lowered working capital, i.e., inventory, as increased visibility throughout the supply chain lowers the overall risk, lessening reliance on safety stock levels;
• Improved decision-making capability through access to timely information. Delayed shipments can be diverted to alternate locations to fulfill an order on time rather than follow the standard flow;
• Improved decision making for processing an inbound shipment, e.g., taking directly to production line, placing into storage, cross-docking to an awaiting outbound shipment.
Revenue
• Improved revenue by preemptively identifying and resolving material shortages, leading to fewer stockouts and lost sales;
• Increased accuracy for commitments to back-ordered customers. If orders are split-shipped, knowledge of specific quantities and dates enables informed decision making. Providing customers with correct updated information increases the company’s credibility;
• Strengthened customer retention through providing accurate status updates. Customers are less likely to go to a competitor if they have visibility, understanding and confidence of when they will receive their order.
Efficiency
• Identification of network bottlenecks and capacity issues quantitively support exploration of alternate channels and trading partners to more efficiently move and process the product;
• Enhanced metrics management through large data sets supports extensive performance analysis. Companies can
optimise operations by comparing supplier performance to transportation lane efficiency and distribution centre throughput to final mile delivery costs;
• Simplified receiving processes through matching shipment details to the relevant purchase order, facilitated through advanced shipment notices. Automatically pre-filling the receipt record with the ASN allows for a quicker and more accurate receiving process versus manually filling the receipt record.
Collaboration
• Increased effectiveness of partner collaboration, as all parties have access to the same set of data, leading to a greater level of understanding of cause and effect of transaction deviations;
• Improved end-to-end network perfor-mance over time as all parties work together to conduct a ‘post mortem’ of a transaction which did not flow as expected. From this knowledge, corrective actions can be created and implemented in order not to repeat the same error;
• Boosted collaboration through knowing when to offer a supplier assistance. Timely knowledge of when suppliers are experiencing delivery issues can be an indication of trouble at the supplier;
• Improved reaction times through advanced notice of downstream disruptions allow for multiple partners to be involved in resolving the issue.
Accountability
• Enhanced awareness of transaction monitoring, leading partners to be more timely, accurate and proactive to ensure they are not at fault for causing downstream failures;
• Improved partner order compliance, making partners accountable for expectations and

© HENRY STEWART PUBLICATIONS 2516-1814 JOURNAL OF SUPPLY CHAIN
MANAGEMENT, LOGISTICS AND PROCUREMENT VOL. 1, NO. 3, 218–233 WINTER 2018–19
SUPPLY CHAIN VISIBILITY
10
less able to deflect fault if they caused a disruption. For example, a Tier 1 supplier ships an order late and blames the Tier 2 supplier. Data indicates, however, that Tier 1 supplier did not order components from Tier 2 until after the Tier 1 ship date. Tier 1 supplier cannot place blame on another partner and is held accountable for the late shipment.
Compliance
• Heightened capability to track and manage chain of custody of the product. If a shipment is not progressing through the expected steps and handoffs, an alert is generated, and the company can quickly evaluate if delays are mechanical, product diversion or some other issue. Knowing this situation as early as possible allows the company to take the appropriate actions;
• Improved awareness of quality control conditions. If a shipment of highly perishable product is delayed beyond the expected delivery time frame, the receiving team is alerted so they can better evaluate the condition of the product before accepting the shipment;
• Enhanced product recall capabilities by linking outbound customer shipments to inbound supplier shipments. Based on suspect lots or batches, the company can more accurately identify origins of customer shipments.
User Experience
• Upgraded track-and-trace capabilities, allowing the user to log into a singular aggregation tool and access the data to answer questions. While this may not allow a company to reduce headcount, the affected resources can be deployed to higher value activities;
• Expanded user base of who can use the visibility tool as a self-service tool to
access the answers. Answering questions of ‘where’s my stuff’ can be addressed directly in the SCV tool by customers and people in different organisational areas, eg procurement, finance, quality, etc., instead of asking the supply chain team to look up the information.
Considerations for a Successful ImplementationThe business benefits of SCV are tremendous, but full visibility is a lagging competency among many companies. The challenge is how to make SCV accessible to more companies. Progressing from zero visibility to full visibility is a process which begins with recognising the organisation’s functional capabilities, identifying and committing key resources, and creating internal and external partnerships.
Maturity Mode Maturity typically refers to the level of sophistication and robustness of capabilities of a business process, such as SCV. With a lower maturity level, the specific capability may or may not be performed at the bare minimum and is typically not thought of as strategically important. A company performing at a low maturity level has many opportunities to improve their capabilities and upgrade their resources to add more value to the company. With a middle maturity level, the capability provides value, but does not differentiate the company from its competitors. With the higher maturity level, the capability is performed at the highest and most robust levels and is viewed as a strategic competitive advantage which differentiates the company in the market. Numerous studies have consistently proven where companies operate at the higher maturity levels, they significantly out-perform their competitors across cost and performance

© HENRY STEWART PUBLICATIONS 2516-1814 JOURNAL OF SUPPLY CHAIN
MANAGEMENT, LOGISTICS AND PROCUREMENT VOL. 1, NO. 3, 218–233 WINTER 2018–19
SUPPLY CHAIN VISIBILITY
11
TABLE 2 A maturity model is a tool for assessment of a company’s supply chain visibility capabilities
SUPPLY CHAIN VISIBILITY MATURITY MODEL
Visibility to Tier 1 supplier / partner activities
Visibility to Tier 2 supplier / partner activities
Automation of data exchange
Dedicated staff resources
Downstream partner collaboration mandated
Downstream partner collaboration encouraged
Business benefits articulated
Level 1 No to little No Low No N/A No No
Level 2 Limited No Low No N/A No No
Level 3 Yes Limited Partial Yes Yes No Partial
Level 4 Yes Yes High Yes Partial Partial Yes
Level 5 Yes Yes High Yes No Yes Yes
metrics.
When evaluating the maturity elements of SCV, functional capabilities are evaluated on a sliding scale, from zero ability to full leverage of skills and prevailing technologies (see Table 2).
The first evaluation point is visibility to partner activities. The scale ranges from no visibility into a Tier 1 supplier’s activities to full knowledge of Tier 1 and Tier 2 suppliers’ performance. For example, an apparel retailer has Tier 1 supplier knowledge if the garment manufacturer is sharing information. If the yarn manufacturer which supplies the garment manufacturer also shares information, there is now visibility into both Tier 1 and Tier 2 suppliers. The advantage with this extended visibility is if the yarn shipment is delayed, the potential for delay in the garment delivery increases. If the company placing the order has visibility to the first delay, they may take corrective actions, such as reprioritising which garments need to be produced first to minimise the impact of the initial delay.
The level of data automation refers to the completeness of transactions that are transmitted. This also refers to the percentage of trading partners transmitting data. For example, if only a few trading partners transmit
all transactions, or all trading partners only transmit one type of transaction, the grading for automated data exchange would be considered low. Likewise, if a high percentage of trading partners are automatically transmitting transaction details across a broad range of transaction types, automated data exchange is considered high.
An important element to managing a SCV implementation within an ongoing business is investment in a dedicated team to manage visibility. This internal team is responsible for the induction and compliance of trading partners in the SCV programme. On the low end of maturity, companies have not invested in these internal resources, while on the high end of maturity companies have created designated teams.
Collaboration with trading partners can significantly affect partner relationships. In a lower-level maturity model, partner participation can be mandated, with penalties for non-compliance. In a higher-level maturity model, participation is encouraged through articulating and providing tangible benefits to all trading partners, who then willingly participate. Benefits can range from access to end-to-end performance data to real-
© HENRY STEWART PUBLICATIONS 2516-1814 JOURNAL OF SUPPLY CHAIN
MANAGEMENT, LOGISTICS AND PROCUREMENT VOL. 1, NO. 3, 218–233 WINTER 2018–19
SUPPLY CHAIN VISIBILITY
12
time performance feedback. In some cases, participation in SCV may also include access for trading partners to top company leadership, providing them an introduction and platform to gain insight and perspective to what the company’s leadership team is currently thinking.
Technologies Prior to the deployment of digital communications technology, gaining visibility into a company’s supply chain network was labour-intensive and time-consuming. By leveraging existing technical techniques such as EDI in the early 2010s, pioneers in SCV were able to transmit transaction details for the data aggregation tools. In more recent years, new technologies such as data aggregation and data transmission have simplified the implementation process and lowered cost to deploy. With new service providers of data aggregation tools continually coming to market, companies can quickly assess their options by researching market guides and tool comparisons.
Data aggregation tool selectionWhen selecting the best aggregation tool to meet the specific business needs, evaluation points include:
• Trading partner induction: How long does it take to induct the initial population of trading partners? How long does it take to introduce a new partner to the system? Does the software provider handle the partner transmission validation? Does the software provider have a project management mechanism to ensure timely setup of all trading partners?
• Allowable trading partners: Are there minimums and maximums of trading partners allowed on the system?
• Cost: What are the monthly and annual costs and how are they determined, e.g.,
by number of trading partners, quantity of transactions, etc.? If the software provider validates partner transmissions, what are the costs and who is responsible for payment, e.g., the company or the trading partner?
• Reporting tools: How robust is the reporting capability? What types of reports are ‘canned’ or come with the software? How easy is it to create ad hoc reports?
• Artificial intelligence (AI): Does the tool come with demonstrable AI capabilities? How do most of their customers use AI to its fullest potential?
Transmission technologies EDI is the predominant technology for transferring transactions between trading partners. The documents are referenced as a number, e.g., 850 for a purchase order, 856 for advanced shipment notice, 810 for an invoice and 211 for motor carrier bill of lading. The major advantage to using EDI is the standard structure of the documents. For example, all 850s and 856s contain the same data fields regardless of company, industry or country, simplifying implementation across multiple partner IT platforms. Depending on the size of the organisations, companies can process transactions directly themselves, or they can use value-added networks (VANs), which act as clearing houses to transmit the data.
Application programming interface (API) is the next iteration of transmission technologies. The technology is similar to EDI, but transmissions are typically internet/cloud based, provide real-time updates and can manage data exchange more efficiently. A main attraction for APIs is they do not require a VAN as an intermediary. As companies continue to upgrade their existing business control tools such as ERP, WMS and TMS to newer and more flexible cloud-based solutions, the usage of APIs will start to replace EDI.

© HENRY STEWART PUBLICATIONS 2516-1814 JOURNAL OF SUPPLY CHAIN
MANAGEMENT, LOGISTICS AND PROCUREMENT VOL. 1, NO. 3, 218–233 WINTER 2018–19
SUPPLY CHAIN VISIBILITY
13
Blockchain is the emerging technology of sharing validated transaction details with all parties or ‘nodes’. A tightly controlled mechanism used to track chain of custody for products, blockchain has successfully gained a foothold in highly regulated or high-risk industries, such as pharmaceuticals, produce, currency and diamonds. Major inhibitors to blockchain are the massive volumes of data required to validate each transaction, as well as convincing all parties within the blockchain, including competitors such as transportation providers, to participate in the technology. Transmitting a transaction via blockchain typically requires costly changes to a company’s IT infrastructure. As more companies are required to participate in blockchain by their trading partners, however, usage of blockchain as a transmission mechanism will continue to increase.
Collection technologiesThe Internet of Things (IoT) is a technology for data collection and involves machines communicating with other machines in real time. While most IoT applications are related to machine performance and preventative maintenance, companies are exploring IoT for supply chain visibility. As a machine completes a production task, it can log the event as complete and upload this information to the data aggregation tool via EDI, API or blockchain. Any production delays or quality issues will generate event updates, which can also be uploaded.
Embedded GPS tracking devices are instruments which are placed within the shipment and can provide real-time status updates on location and condition of the shipment. They have been used for telematics to monitor vehicle performance, speed, number of stops, hours driven, container temperature, etc. There are new applications on the market, however, which track the physical shipment in real time and send
alerts if certain activities do not occur in the expected time frame. With the expansion of GPS technology, customers and consumers can track their shipments in real time.
Data sets In today’s environment, many companies which are buying or selling products are already transmitting data sets to partners electronically, usually purchase orders, invoices and advance shipment notices. Buying and selling transactions are, however, only a fraction of the entire supply chain. To gain greater visibility, companies need to expand the collection of documents provided by their shipping, forwarding, customs brokerage, warehousing and fulfilment partners. Any transfer of physical ownership should initiate a visibility transaction. For example, when carrier A picks up the freight at the factory and signs the bill of lading, carrier A now has ownership of the product. When carrier A delivers the freight to the warehouse and the warehouse accepts the delivery, the warehouse now has ownership of the product. At each transfer of physical ownership, the parties involved should transmit the proper document to the data aggregation tool.
To determine which data sets a company needs, the business team should define what transactions and data sets are important to their business. Once the documents are selected, the technology team has to review the document templates in order to conduct the data mapping and testing of how the data flows within internal systems.
Transmission testingAfter the transaction documents have been selected for visibility, trading partners are required to demonstrate they can success-fully receive and transmit the documents. The objective of testing is to ensure partners can properly map the data fields on the documents

© HENRY STEWART PUBLICATIONS 2516-1814 JOURNAL OF SUPPLY CHAIN
MANAGEMENT, LOGISTICS AND PROCUREMENT VOL. 1, NO. 3, 218–233 WINTER 2018–19
SUPPLY CHAIN VISIBILITY
14
and receive and send multiple times. Transmission validation can be conducted internally by the company, but there are service providers which can efficiently manage the process.
Internal resourcesEstablishing and maintaining supply chain visibility within a company takes dedicated personnel to ensure trading partners are engaged and actively participating in the programme. These resources are responsible for taking the vision provided by leadership and sharing it with all parties engaged in the company’s supply chain. The resources are the front line for handling questions and objections from both internal and external partners and should be empowered to engage leadership teams at the trading partners. Some of the necessary activities related to keeping partners engaged include onboarding trading partners, monitoring alerts and providing performance feedback.
Onboarding activities range from tactically setting up partners to receive and transmit transactions to persuading partners to participate in the programme. From a tactical perspective, the internal team is responsible for validation testing, with assistance from the aggregation software provider, to ensure all partners can accurately participate in the SCV programme. Onboarding also means communicating with and educating partners of the overall value proposition of participation, including the explanation of benefits for programme participation and the financial or collaboration penalties for non-compliance.
The internal team, especially as the SCV programme is starting up, should take responsibility for monitoring alerts, anomalies and exceptions to the expected product flow. One of the benefits of SCV for a company’s trading partners is the timely and high-value data generated through the programme. With
all transaction details being captured in the data aggregation tool, users can generate comprehensive performance reports. The level of information provided on volumes, shipment performance, product quality, timeliness to changes, etc. is invaluable to trading partners interested in improving their performance and demonstrating their overall value contribution to the company’s supply chain. The internal SCV team can drive collaborative conversations with trading partners based on this information. When partners are performing well, the internal team can provide positive input and possibly assist the partner in gathering a greater share of business. Where partners are underperforming, the internal SCV team can have meaningful conversations on ways the partner can improve their performance.
Tracking the company’s own functional performance helps improve internal operations. Where the SCV team identifies internal improvement opportunities, recommendations can be made to the appropriate internal personnel. For example, if a buyer constantly changes an order after it has been accepted by the supplier, causing the supplier undue hardship, the internal SCV team can work with the buyer to identify root causes behind the numerous changes and implement improvements to remediate order changes.
Partner engagementOf the impediments to establishing SCV, engaging partners in a truly collaborative manner is potentially the most challenging. A portion of the partner base currently participates in multiple SCV programmes and already transmits transaction data. Another number of companies do not currently transmit data to their partners but are willing to participate and only need to be instructed. The last group of partners are those who push back on requests to transmit data and
© HENRY STEWART PUBLICATIONS 2516-1814 JOURNAL OF SUPPLY CHAIN
MANAGEMENT, LOGISTICS AND PROCUREMENT VOL. 1, NO. 3, 218–233 WINTER 2018–19
SUPPLY CHAIN VISIBILITY
15
need motivation to comply. When addressing these issues, the company needs to consider potential questions and scenarios their trading partners might present to ensure the answers are consistently applied. To make SCV a reality, a company must be committed to the process. While partial visibility is better than no visibility, a company cannot reach its fullest potential unless the partner engagement is as robust as possible.
Some companies may be reticent in sharing performance data with their customers and trading partners over concerns this information might be used against them if the process breaks down. In some industries, there are customers who aggressively penalise non-compliance from their suppliers, such as late shipments and misplaced carton labels, as a revenue generating mechanism. This approach is counter-productive as trading partners recognise the relationship is not built on trust or partnership and will adjust the product price to counter the charge backs. SCV should be a collaborative win-win relationship with all involved trading partners. When issues occur, the objective should not be to penalise the partner, but to correct the error or disruption and minimise future occurrences. It is imperative for the company implementing SCV to help their partners understand this approach to alleviate the partner’s hesitancy to transmit data.
When addressing competing priorities within their network of trading partners, the company must assess the value of having complete visibility versus the disruption of incomplete visibility, then decide how hard to push partners who do not want to participate in the SCV programme. For many companies which have successfully deployed SCV, they have made participation with accepting and transmitting data a requirement for continued business with the company.
There is a risk, however, that the partner does not comply and the company has no other source of supply for that specific project. Luckily, this is not a common occurrence, especially if the company has articulated the benefits to their suppliers of SCV.
ConclusionSCV, the ability to determine where a product is at any point of the supply chain, is a holistic and collaborative mechanism for tracking shipments. While currently underutilised by many companies, SCV can be a significant driver for a company’s profitability, allowing it to reduce operating costs, increase revenue and become nimbler through advanced awareness of supply chain disruptions. Visibility technology has become more abundant and imple-mentation costs have lowered, thus impediments to a company having full SCV may rest on the organisa tion’s maturity level and willingness to engage their trading partners with a collaborative approach. As profitability pressures mount, exploring ways to lower supply chainrelated operating costs becomes more critical to a company’s bottom line and future success. The benefits of supply chain visibility enable companies making the investment to actualise a competitive advantage through improved accuracy and stronger partner relationships, resulting in greater customer confidence and satisfaction.
REFERENCES(1) Geodis (June 2017), ‘2017 Supply Chain Worldwide Survey’, available at https://geodis.com/in/newsroom/press-releases/geodis-unveils-its-2017-supply-chain-worldwide-survey (accessed 27th November, 2018).
(2) Nucleus Research (April 2017), ‘The Real Value of Value Chain Networks, Report 63’, available at https://www.supplychain247. com/paper/nucleus_research_supply_ chain_control_towers_value_matrix_2017/one_network_enterprises (accessed 27th November, 2018).