supply chain survey report · pdf filesupply chain survey report 2016 abridged ... function in...
TRANSCRIPT

JUNE 2016
Supply Chain Survey Report 2016AbridgedAustralian Food and Grocery Council
Prepared by GRA PTY LTD
WE WORK WITH YOU UNTIL SUSTAINABLE RESULTS ARE DELIVERED
www.gra.net.au

2
ContentsAbout the AFGC 3
Foreword 4
Welcome 7
Introduction 8
Key Themes 10
Survey Results 12
1. SC Strategy & Performance 13
2. Industry Capability & Trends 16
3. Retailer Engagement 24
About the Author 27

3
A note from the CEO...‘In the context of significant industry cost-cutting and corporate restructuring, the AFGC provides a vital function in surveying, interpreting and advocating industry’s concerns to key political and policy decision makers and the broader community.’
180+ Members $119 Billion turnover
The membership of the AFGC comprises more than 180 companies, subsidiaries and associates which constitutes in the order of 80 percent of the gross dollar value of the processed food, beverage and grocery products sectors.
With an annual turnover in the 2013-2014 financial year of $119 billion, Australia’s food and grocery manufacturing industry makes a substantial contribution to the Australian economy and is vital to the nation’s future prosperity.
Manufacturing of food, beverages and groceries in the fast moving consumer goods (FMCG) sector is Australia’s largest manufacturing industry. Representing 30 per cent of total manufacturing turnover, the sector accounts for over one quarter of the total manufacturing industry in Australia.
The diverse and sustainable industry is made up of over 26,500 businesses and accounts for over $61.7 billion of the nation’s international trade in 2014-2015. These businesses range from some of the largest globally significant multinational companies to small and medium enterprises. The industry spent $541.8 million in 2011-2012 on research and development.
The food and grocery manufacturing sector employs more than 320,000 Australians, representing about 3 per cent of all employed people in Australia, paying around $16.1 billion a year in salaries and wages.
Many food manufacturing plants are located outside the metropolitan regions. The industry makes a large contribution to rural and regional Australia economies, with almost half of the total persons employed being in rural and regional Australia. It is essential for the economic and social development of Australia, and particularly rural and regional Australia, that the magnitude, significance and contribution of this industry is recognised and factored in to the Government’s economic, industrial and trade policies. Australians and our political leaders overwhelmingly want a local, value-adding food and grocery manufacturing sector. Gary Dawson AFGC CEO
The Australian Food and Grocery Council (AFGC) is the leading national organisation representing Australia’s food, drink and grocery manufacturing industry.
About the AFGC
AFGC | Supply Chain Survey Report 2016
The AFGC is structured to respond to the issues and challenges shaping the world in which their members operate.
www.afgc.org.au

4
In an industry under pressure on multiple fronts, the AFGC exists to work on behalf of food and grocery companies, providing ongoing support to members and a strong voice for the $119 billion food and grocery manufacturing sector.
Foreword - AFGC
AFGC | Supply Chain Survey Report 2016
The AFGC Supply Chain Survey (initiated in 2008), is undertaken every two years, be it with regulators, retailer trading partners, or in the broader industry environment.
The survey is company anonymous, and covers many areas of critical importance to AFGC member supply chain operations, across strategy and performance, industry capabilities and trends, and retailer engagement.
The last two years have seen the rate of change in the fast moving consumer goods (FMCG) industry continue at a rapid pace and much of the focus has centered on supply chains, particularly retail supply chains. The continued blurring of commercial and supply chain negotiations has resulted in an environment where the retailer and supplier trading relationships continue to evolve.
Of note has been the huge focus on shopper loyalty, with consumers increasingly shopping at multiple outlets and retailers having to work hard to attract retail customers. Specifically, Aldi have significantly increased their market share on the
eastern seaboard and are investing heavily into South and Western Australia.
Retailers are seeking ways to boost volumes to counteract sluggish growth, we have seen the introduction of EDLP; innovative in-store offerings; introduction of different store formats; private label development; investment in shopper data and insights; and further focus on supply chain efficiency.
As growth becomes increasingly challenging in mature retail markets the supply chain will continue to play a significant role in retailer and supplier trading relationships. Some suppliers are already responding to the trading environment by striking a balance between price and promotional activity, developing shopper insights and driving supply chain efficiencies. Others have yet to make this shift and there is a clear mismatch between their trading priorities and those of their retail customers.
‘As growth becomes increasingly challenging in mature retail markets the supply chain will continue to play a significant role in retailer and supplier trading relationships.’

Understanding the implications of potential change within traditional supply chain through an examination of the consumer, business channels, routes to market, and the operational supply chain will be essential in meeting future challenges.
The FMCG industry employs approximately 300,000 people. The ability to attract high calibre new talent and ensure that existing employees are equipped with the skills they need to meet the changing demands of an increasingly competitive environment is key to the continued success of companies and the industry. The Supply Chain Committee (SCC) identified the challenges of attracting and retaining talented people within supply chain roles as part of the previous iteration of the survey in 2014 and has progressed work programs to assist industry.
The results outlined in this report offer a rare snapshot of where Australian FMCG supply chains stand at this juncture. Examining your supply chain against industry results provides a unique benchmarking opportunity. What is clear through this report is that the supply chain is taking on an increasingly important role in driving growth and delivering value for businesses in these unprecedented conditions.
It is anticipated that this survey will continue to be completed on a biennial basis and provide value and insight by highlighting supply chain performance, issues and trends across the fast moving consumer goods industry in Australia.
The AFGC’s Supply Chain Committee sincerely thank all members who participated in the survey in 2016 and hope to continue to build participation rates in the years to follow. For the first time, in 2016 participants will receive a supplementary benchmarking report specific to their business along with a copy of the full survey report. This will prove valuable to members in providing comparative insight for use in setting and validating their internal supply chain strategies.
The Committee also wish to thank program partners GRA, who have co-developed the 2016 Supply Chain Survey, undertaken all analysis and developed both Full and Abridged versions of the report as well as respondent specific benchmarking supplements.
GRA are considered a leading consultancy in the FMCG supply chain space in Australia and bring significant insight and analytical expertise to the partnership. The Committee commends GRA on this work and looks forward to the opportunity to work together again in the future.
5
A dedicated website to provide information to potential high quality and talented graduates to encourage them to consider the supply chain
as a profession. Members are encouraged to provide logos and links to the AFGC Secretariat for inclusion on to the website. Please feel free to
use this website in your recruitment and communication campaigns.
www.fmcgsupplychain.com.au
AFGC | Supply Chain Survey Report 2016

Mr Peter West (Chair)
Mr Adam Sime
Mr Stuart Martin
Mr. Maurice Furlong
Mr Russell Brown
Mr Venkata (Subra) Subramayan
Ms Vivienne Worden
Mr Misha Shliapnikoff
Ms Charlotte Rose
Mr Dane Smith
Mr Tim Plummer
Mr Greg O’Rourke
Mr Mark Olson
Mr Stuart Poll
Mr Robert Scoines
Mr Adam Balarin
SecretariatMr John Cawley
Ms Samantha Blake
GRAMr Luke Tomkin
Mr Dan Knox
Mr Adam Kidd
Lion
Church & Dwight (Australia) Pty Ltd
Fonterra Australia Pty Ltd
Frucor Beverages (Australia) Pty Ltd
Johnson & Johnson Pacific Pty Ltd
Kellogg (Australia) Pty Ltd
Kimberly-Clark Australia Pty Ltd
Lion
Mars Petcare Australia
Mondelez International
Nestle Australia Ltd
Pepsico Australia & New Zealand
Primo Smallgoods
Procter & Gamble Australia Pty Ltd
Sanitarium Health & Wellbeing Company
Unilever Australia & New Zealand
AFGC
AFGC
Mr Kevin Frank
Mr Michael Dentry
Ms Melanie Di Iorio
Supply Chain Committee
6
AFGC | Supply Chain Survey Report 2016

7
This squeeze is not new – for some time FMCG businesses in Australia have faced a market where the requirements and expectations of its customers have risen.
Driven by the end consumer, we find it highly likely that these requirements and expectations will continue to rise, if not accelerate. Globally, we are seeing mass adoption of the last-mile delivery option, Click & Collect and more recently, the challenges that limited direct home delivery of groceries are being overcome. Food has been difficult to deliver direct to the consumer – there is the perishability factor, margins can be slim and the logistics complex. But the combination of digital technologies providing responsiveness and traceability,
and greater partnering in last-mile delivery are eliminating these barriers. This year, Walmart earmarked $1 billion (US)in a bid to position itself for continued online growth. As they re-organise their internal operations from filling store shelves to picking unique baskets of goods for consumers, what will they ask of their suppliers?
Closer to home, there is no abatement in the call for collaboration from retailers. The Coles-Woolworths competition continues to drive innovations to capture or maintain market share, and EDLP and promotional pricing remain core battle grounds. The big two’s requirements on their suppliers are at once the same and different; shelf ready packaging and minimum life on receipt are two often quoted examples. Aldi’s alternate customer value proposition provides an interesting counter point, putting a new slant on what is asked of vendors, and whilst Metcash has fewer logistics initiatives their buying behaviour carries its own complexity. Even without change, this complex environment is difficult to navigate and an FMCG business could be forgiven for struggling to meet the competing demands.
But, as with overseas, we are seeing the rise of the omni-channel shopper, empowered with information and choice. This in turn will drive retailers to meet these consumer expectations, which of course will subsequently place new
requirements on their supply chain – with investment in technology, infrastructure and processes having the logical implication to profits and margins. As these pressures build, eyes will turn to suppliers and how they can participate in cost-effectively delivering to consumer wants.
What impact will these trends have across the FMCG industry in the near, medium, and long term? In an industry so dependent on scale for profitability, how can food and grocery suppliers work together to meet the diversity of requirements of their customers? What approaches can be implemented to ensure an equitable division of the costs and benefits meeting rising consumer expectations?
It is for these reasons that the AFGC Supply Chain Survey is so timely and important. It provides us with an insight into industry trends and customer expectations, it provides a safe harbour to collaborate with sometimes competing businesses, and it provides a platform to work together for the mutual benefit of all players; the consumer, the retailer and the supplier.
Luke Tomkin, GRA Partner
Rapidly expanding customer expectations and narrowing retailer margins are placingpressure on FMCG suppliers both within Australia, and across the globe.
Welcome
AFGC | Supply Chain Survey Report 2016
Are we prepared to meet theprojected future challenges?
Adapting to globalchange

The 2016 survey was designed to improve engagement with the AFGC userbase and provide actionable insight to industry members
8
Survey Introduction
AFGC | Supply Chain Survey Report 2016
• Measure supply chain performance across the industry and identify improvement opportunities
• Provide the AFGC with a fact base to support the members via advocacy
• Provide an industry specific benchmarking resource for members
• Review top-of-mind issues impacting the industry
• Track performance against industry-led initiatives
Purpose of the Survey
This section examines the role of the supply chain, current focus areas and overall supply chain performance. It reviews how organisations perceive the value of their supply chain as well as the key objectives that their supply chains are focusing on.
It also surveys financial performance of the supply chain and how it delivers against key supply chain metrics.
This section assesses the supply chain organisation, S&OP, KPIs and the planning foundation. Key supply chain capabilities were surveyed and benchmarked against best practice. Questions covered the planning capability areas of People, Process, Systems and Data. This includes the organisation’s ability to forecast demand and plan the appropriate levels of inventory to meet service and cost targets.
This section explores how key decision making frameworks, including S&OP, are structured, and investigates the recruitment and training of supply chain professionals.
This section surveys how the member base is engaging with their customers and explores how customer requirements are changing. It explores planning and collaboration processes between the industry and retailer, reviews delivery and DC performance and asks respondents about the impact of retailer driven initiatives.
By measuring how the industry interacts with customers and executes on their requirements, it is possible to gauge how the industry is performing in meeting these expectations and also to identify key trends and initiatives.
Supply Chain Strategy and Performance
Industry Capability and Trends
Retailer Engagement
The Survey structure contained 3 main areas:

64%26%
Increased
10%
Decreased Not Changed
8.3% 7.5%12%
26.1%
46%
While 11% of respondents have an online channel, this only constitutes 1% of all revenue
37 Respondents
9
When asked about the biggest issues currently faced by the industry, 43% of respondents identified the dynamics of the market place (highly competitive, retailer dominated).
Over the next 12-24 months, 8% of respondents expect changes in the competitive landscape, such as new channels and changes in consumer behaviour, to drive significant change.
Median number of SKUs is 200. Respondents varied from 10 to 2000
Proportion of internationally sourced product growing year on year
Majority of respondents operate in Dry Ambient categories with greater than 12 months shelf life
The percentage of respondents that sell via the Supermarkets
Company Profile & Characteristics
Respondents by Revenue
Business Channel % Revenue
Supermarkets 60%
Away from home/Foodservice 12%
Other 8%
Ingredients to other manufacturers 8%
Export 4%
On-line sales direct to consumers 1%
5%
8%
11%
11%
14%
19%
30%
35%
49%
Chilled beverages
Ambient / air conditioned fresh produce
Frozen foods
Raw or processed ingredients
Air conditioned foods (eg Confectionery)
Ambient beverages
Chilled foods
Dry/ambient grocery (nonedible) consumer goods
Dry/ambient foods
Product Classification
11%
29%
37%
63%
69%
74%
97%
On-line Sales direct to consumers
Other
Ingredients to other manufacturers
Convenience/Impulse
Export
Away from home / Foodservice
Supermarkets
% of respondents that had the following business channel revenue source
Combined Sales revenue to the major Supermarkets (Woolworths & Coles) as a % of Total Revenue over last 2 years
Number of SKUs SKU Percentage split by Shelf Life
58%
5%200 or fewer
26%
201 - 500
11%
501 - 1,000 1,001+ 0-1 month 1-3 months 4-6 months 7-12 months +12 months
AFGC | Supply Chain Survey Report 2016
97%The percentage of respondents that had direct online channels11% 32%
32%18%
18%
$0-$100M
$101-$500M
$501-$1000M
$1000M+
6 6
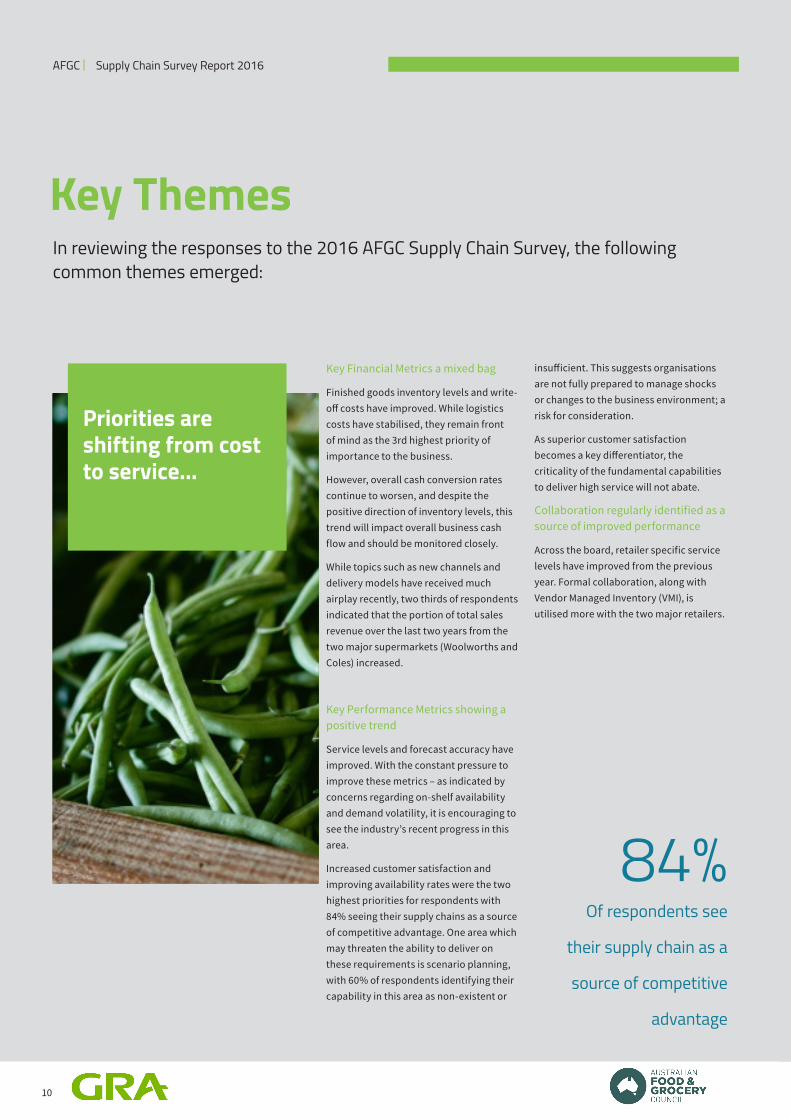
Key Financial Metrics a mixed bag
Finished goods inventory levels and write-off costs have improved. While logistics costs have stabilised, they remain front of mind as the 3rd highest priority of importance to the business.
However, overall cash conversion rates continue to worsen, and despite the positive direction of inventory levels, this trend will impact overall business cash flow and should be monitored closely.
While topics such as new channels and delivery models have received much airplay recently, two thirds of respondents indicated that the portion of total sales revenue over the last two years from the two major supermarkets (Woolworths and Coles) increased.
Key Performance Metrics showing a positive trend
Service levels and forecast accuracy have improved. With the constant pressure to improve these metrics – as indicated by concerns regarding on-shelf availability and demand volatility, it is encouraging to see the industry’s recent progress in this area.
Increased customer satisfaction and improving availability rates were the two highest priorities for respondents with 84% seeing their supply chains as a source of competitive advantage. One area which may threaten the ability to deliver on these requirements is scenario planning, with 60% of respondents identifying their capability in this area as non-existent or
insufficient. This suggests organisations are not fully prepared to manage shocks or changes to the business environment; a risk for consideration.
As superior customer satisfaction becomes a key differentiator, the criticality of the fundamental capabilities to deliver high service will not abate.
Collaboration regularly identified as a source of improved performance
Across the board, retailer specific service levels have improved from the previous year. Formal collaboration, along with Vendor Managed Inventory (VMI), is utilised more with the two major retailers.
84% Of respondents see
their supply chain as a
source of competitive
advantage
10
In reviewing the responses to the 2016 AFGC Supply Chain Survey, the following common themes emerged:
Key Themes
Priorities are shifting from cost to service...
AFGC | Supply Chain Survey Report 2016

6 6
Key Themes
11
Changing retailer requirements driving cost and complexity onto suppliers
Expectations such as shelf-friendly packaging and minimum life on receipt (MLOR) are increasing, but the retailers frequently have variants on the same requirements. The vast majority of responses indicated that these initiatives had a neutral or negative impact on their business, suggesting they are not getting enough benefit to outweigh the costs.
Supply Chain execution remains a critical area not to be neglected
Delivery and DC performance is a key enabler to ensuring excellent customer service and its importance is not to be underestimated. Rather than being perceived purely as a cost, logistics execution and performance continues to offer an opportunity to improve overall supply chain performance.
Scarcity of People and Talent
The war for talent continues with recruitment becoming more difficult, and filling roles typically taking between 3-5 months. Specialist and boutique recruitment firms were identified as the most successful recruiting method.
As well as sourcing externally, almost all organisations are planning to grow capability internally by investing in supply chain training or education in the next year. However, less than 50%
have a formal professional development programme suggesting a lack of structure in building and retaining talent.

12
Findings are presented across the following 3 areas:
This section of the report outlines the results of the 2016 AFGC Supply Chain Survey
Survey Results
1 Supply Chain Objectives and Focus2 Financial and Supply Chain Metrics
1. Supply Chain Strategy & Performance
2. Industry Capability & Trends
3. Retailer Engagement
Survey results are based on participation of 37 members of the AFGC.
1 Supply Chain Organisation & Decision making 1 Recruitment and People 2 S&OP and Decision Making2 Planning Capability
AFGC | Supply Chain Survey Report 2016

This section examines the role of the supply chain, current focus areas and overall supply chain performance. It reviews how organisations perceive the value of their supply chain as well as the key objectives that their supply chains are focusing on.
It also surveys financial performance of the supply chain and how it delivers against key supply chain metrics.
13
Supply Chain Strategy and Performance
Section 1

84%of respondents believe their
supply chain is a source of competitive advantage
14
AFGC | Supply Chain Survey Report 2016
The percentage of respondents that sell via the supermarkets
97%• With regards to business
objectives, responses indicated a mix of customer service and business efficiency/cost objectives. Interestingly, the focus appears to be moving back to customer and consumer objectives, such as service delivery and quality. Issues such as sustainable distribution do not have same priority as in previous years.
1 Supply Chain Strategy and Performance
1.1 Objectives and FocusObrmance
10% 4%Strongly
Agree
19%
In my business, the Supply Chain is seen as a competitive advantage, not a cost centre.
65%
Agree Disagree Strongly Disagree
Average ranking of objectives in terms of their importance to your business (1 lowest to 8 highest):
2.1
3.5
3.8
4.6
4.7
5.4
6.0
6.5
3.3
4.3
4.1
4.2
5.2
5.9
5.9
6.5
Sustainable distribution
Reduced order to delivery cycle time
Service Innovation
Improved quality
Working capital efficiency
Reduced logistics cost
Improving availability rates
Increased customer satisfaction
20162014
This section examines the role of the supply chain, current focus areas & initiatives and supply chain performance to understand how the industry is tracking and identify any significant trends.
Percentage change in average ranking between 2014 and 2016
-38%
-20%
-8%
9%
-10%
-9%
3%
0%
Sustainable distribution
Reduced order to delivery cycle time
Service Innovation
Improved quality
Working capital efficiency
Reduced logistics cost
Improving availability rates
Increased customer satisfaction

15
0
10
20
30
40
50
60
2008 2009 2010 2011 2012 2013 2014 2015 2016(Target)
Average Days Cash to Cash Cycle time
AFGC | Supply Chain Survey Report 2016
1 Supply Chain Strategy and Performance
1.2 Financial and Supply Chain Metrics
0
20
40
60
80
2008 2009 2010 2011 2012 2013 2014 2015 2016(Target)
Days Finished Goods Inventory
This section surveyed the financial performance of the supply chain and how it delivers against key supply chain metrics. Working capital components consisting of cash conversion cycles & inventory levels were benchmarked across the respondents. Key supply chain cost measures, including logistics costs and finished good write-offs were explored. Service levels to the retailers, a key performance measure of the supply chain, were benchmarked and reviewed against previous trends for insight.
2014
1.27%
Write-offs as a % of COGS
2015 2016 Target
1.07%0.94%
Observations
• Inventory and write-off costs have been declining with service levels increasing, however cash conversion cycles are getting worse over time
• Cash conversion cycle times increasing over the last 3 years (and below the 2016 target)
• Finished goods inventory levels have slightly declined
• Write-off costs as a percentage of COGS are reducing
• DIFOD improved across the board for all retailers
• Logistics costs appear to have stabilised, showing a slight increase in transportation costs

This section assesses the supply chain organisation, S&OP, KPIs and the planning foundation. Key supply chain capabilities were surveyed and benchmarked against best practice.
Questions covered the planning capability areas of People, Process, Systems and Data. This includes the organisation’s ability to forecast demand and plan the appropriate levels of inventory to meet service and cost targets.
This section explores how key decision making frameworks, including S&OP, are structured, and investigates the recruitment and training of supply chain professionals.
16
Industry Capability and Trends
Section 2

46% of respondents include VRPs as part of their Supply Chain73% of respondents have a dedicated Supply Chain
representative on the Executive Team
17
Functions included within respondent’s Supply Chain
AFGC | Supply Chain Survey Report 2016
2 Industry Capability and Trends
2.1 Supply Chain Organisation and Decision making
5%
35%
49%
54%
73%
78%
95%
95%
100%
100%
Other
VRPs
Manufacturing
Procurement
Customer Service
Demand Planning
Inventory Mgmt.
Supply Planning
Transportation
Warehousing
-
100
200
300
400
Number of SKUs per Planner
Just over half of the respondents surveyed indicated they have their Demand Planning function sitting within Supply Chain. 19% have it sitting in Sales.
FMCG planners are responsible for a median number of SKUs of 45, with this ranging from 5 to 400 per planner across the respondents.
Respondents were surveyed on the structure of their supply chain organisation and how supply chain decisions get made. This section covers the S&OP process (for the purpose of this survey the terms S&OP & IBP are interchangeable), recruitment & training of supply chain professionals, the customer offer and to what extent KPIs drive decision making. These areas were included in the survey as they form the basis for how demand and supply trade-off decisions get made.
Median number of SKUs
45
Under which department does Demand Planning report?
56%
Supply Chain
19%
Sales Finance Operations/Manufacturing.
17%8%
Key Findings:• The importance of supply chain to the grocery industry is reflected in 73% of organisations having a dedicated supply
chain representative on the executive team
• For all respondents, supply chain in their organisation represents traditional logistics functions (warehousing, transpor-tation), and supply planning and inventory management for more than 90%. Demand Planning and Customer Service also sit under supply chain in the majority of cases (greater than 70%)
• 35% of companies have the VRPs sitting in Supply chain

49% of respondents say it’s getting increasingly more difficult to recruit
3-5 monthsAverage time it takes to hire a Supply Chain professional according to 76% of respondents.
*8% take more than 6 months
18
5%
11%
14%
14%
24%
32%
LinkedIn campaigns
Online Services (eg Seek)
Internal HR
Large recruitment firm
Staff contacts/friends/network
Boutique recruitment firm
AFGC | Supply Chain Survey Report 2016
2 Industry Capability and Trends
2.1 Supply Chain Organisation and Decision making
Which channel has proved most successful in recruiting key Supply Chain Professionals?One of biggest issues facing the industry is ‘attracting, developing and retaining high calibre talent across the end to end supply chain’, with 11% of respondents identifying this as one of their biggest issues but also as one of the biggest opportunities the AFGC could pursue to help advance the industry.
32% found that Specialist and Boutique recruitment firms were the most successful avenue in recruiting, followed by internal staff contacts, friends and internal networks.
Online services (such as Seek) and LinkedIn campaigns were the least successful avenues undertaken for recruitment.
2.1.2 Recruitment and PeopleAs an essential component of supply chain performance, recruitment and people remains a focus area for the industry. As the complexity of supply chains increase, it is anticipated that competition for the right team members will continue to grow. Key Trends:
Comparison of difficulty in hiring Supply Chain professionals in the past year vs. recent years
5%Easier
46%
About the same
Slightly more difficult
A lot more difficult
Average time to hire a suitable Supply Chain professional
3%16%
0-2 Months
76%
3-5 Months 6-9 Months More than 9 Months
5% 3%
• Recruitment typically takes at least 3 months, and is becoming more difficult
• Specialist and boutique recruitment firms were the most successful recruiting method
• Almost all organisations are planning to invest in supply chain training or education in the next year, however
less than 50% have a formal professional development programme
• Training and education is being recognised as essential but it is not matched by career planning and professional development
46%

51% The number of respondents who have a dedicated S&OP Manager*no correlation with either the number of SKUs or revenue size of an organisation.
19
AFGC | Supply Chain Survey Report 2016
2 Industry Capability and Trends
2.1 Supply Chain Organisation and Decision making
2.1.3 S&OP and Decision making
Only companies with revenue < $100Mpa had no S&OP Process in place
The percentage of companies had a formal S&OP Process (or IBP
Process) in place.
89%
As a commonly implemented cross functional discipline in FMCG and manufacturing businesses, the maturity of the S&OP process is a good comparison point beween companies. This section explores how formalised the S&OP process is within the organisation and how it is supported to deliver decision making value.
9% 3%To a great extent
29%
59%
To a moderate extent
To a small extent Not at all
Sales & Operations Planning
Based on this year’s survey, S&OP continues to be widely utilised in the industry, with 90% of respondents having a S&OP or Integrated Business Planing (IBP) process. Of those organisations that did not have a S&OP process, all had an annual revenue base of less than $100M.
Customer offers are also common, survey results indicating over 80% of respondents have a customer offer, however only 42% of these are considered formalised.
Whilst S&OP is widespread, only just over half (51%) of the organisations surveyed had a dedicated S&OP Manager. The majority of respondents utilising S&OP believe it provides the framework for decision making to a great extent, and only 12% believe this statement is not applicable or only to a small extent.
This is reflected by the data showing the ‘S&OP process being the way forecasts are signed off’ for 62% of organisations. For those organisations not currently utilising their S&OP process to guide decision making, there is an opportunity to improve the process to ensure that relevant decisions flow through S&OP, rather than outside of it.
The extent to which the S&OP Process informs decision making
Have a S&OP process that informs
decision making
88%
Key Findings• Amongst respondents, 90% have a S&OP or IBP process
• 88% of organisations surveyed stated that their S&OP process informs decision making
• Over 80% of respondents have a customer offer, however only 42% of these are considered formalised
A clearly agreed customer offer and well defined KPIs are also universal components of the decision making framework that can be informative as to the maturity of a business’s planning. The well defined customer offer supports the alignment of business activity across multiple divisions. The customer offer and service promise is frequently documented in best-in-class organisations.
20
AFGC | Supply Chain Survey Report 2016
2 Industry Capability and Trends
2.2 Planning Capability
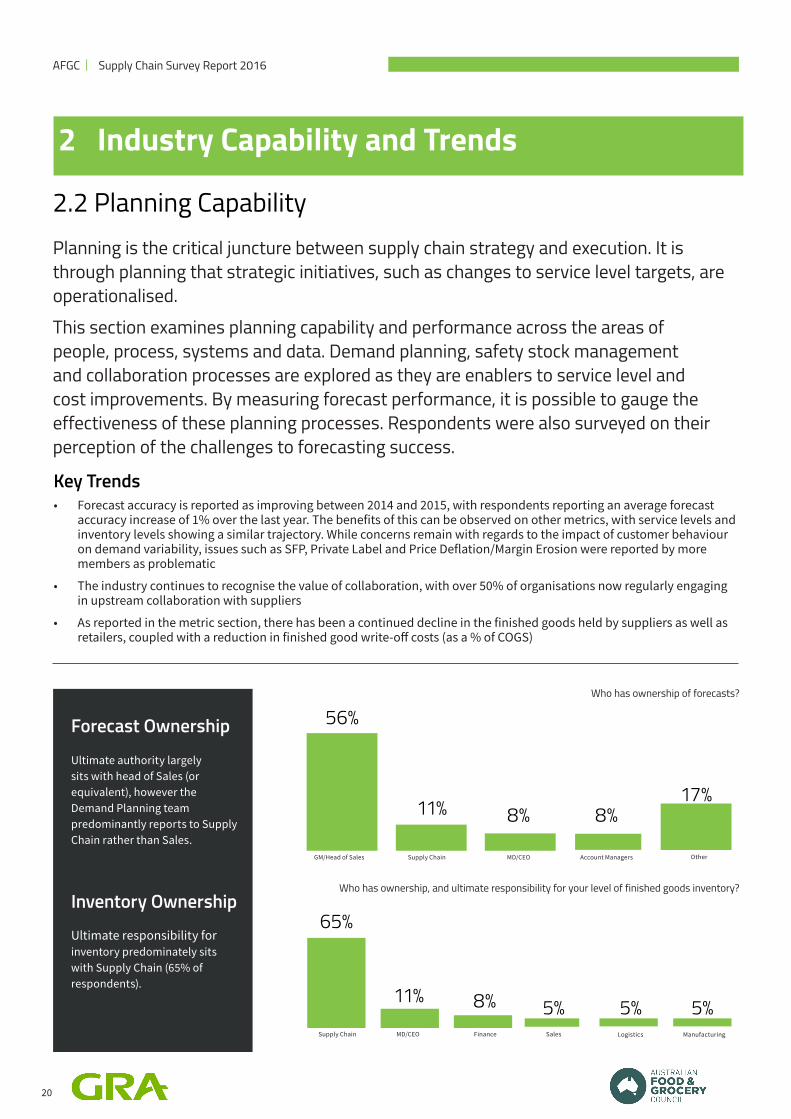
Who has ownership of forecasts?
Who has ownership, and ultimate responsibility for your level of finished goods inventory?
Forecast Ownership
Ultimate authority largely sits with head of Sales (or equivalent), however the Demand Planning team predominantly reports to Supply Chain rather than Sales.
Inventory Ownership
Ultimate responsibility for inventory predominately sits with Supply Chain (65% of respondents).
Planning is the critical juncture between supply chain strategy and execution. It is through planning that strategic initiatives, such as changes to service level targets, are operationalised. This section examines planning capability and performance across the areas of people, process, systems and data. Demand planning, safety stock management and collaboration processes are explored as they are enablers to service level and cost improvements. By measuring forecast performance, it is possible to gauge the effectiveness of these planning processes. Respondents were also surveyed on their perception of the challenges to forecasting success.
8% 8%
GM/Head of Sales
11%
56%
Supply Chain MD/CEO Account Managers
17%
Other
8% 5%Supply Chain
11%
65%
MD/CEO Finance Sales Logistics Manufacturing
5% 5%
Key Trends• Forecast accuracy is reported as improving between 2014 and 2015, with respondents reporting an average forecast
accuracy increase of 1% over the last year. The benefits of this can be observed on other metrics, with service levels and inventory levels showing a similar trajectory. While concerns remain with regards to the impact of customer behaviour on demand variability, issues such as SFP, Private Label and Price Deflation/Margin Erosion were reported by more members as problematic
• The industry continues to recognise the value of collaboration, with over 50% of organisations now regularly engaging in upstream collaboration with suppliers
• As reported in the metric section, there has been a continued decline in the finished goods held by suppliers as well as retailers, coupled with a reduction in finished good write-off costs (as a % of COGS)

21
AFGC | Supply Chain Survey Report 2016
2 Industry Capability and Trends
2.2 Planning Capability
Accuracy measured between 2014 and 2015
Percentage of respondents who recorded an increase in
Forecast Accuracy
Forecast Improvements
77%Between 2014 and 2015 forecast accuracy was reported to have increased by 1% to an average forecast accuracy of 71.3%.
• 77% of respondents that provided data in 2014 and 2015 reported an increase in forecast accuracy
• 44% of respondents believe their organisation’s ability to forecast demand has become moderately or significantly easier over the last 12 months, while 27% believe it has become more difficult. This is reflected in the majority (73%) of respondents indicating that they believe their planning capability has kept up with the challenges of the market place
ForecastingForecast accuracy is reported as improving between 2014 and 2015, with respondents reporting an average forecast accuracy increase of 1% over the last year.
The benefits of this can be observed on other metrics, with service levels and inventory levels showing a similar trajectory. While concerns remain with regards to the impact of customer behaviour on demand variability, issues such as SFP, Private Label and Price Deflation/Margin Erosion were reported by more members as problematic.
74.4%
2014
71.3%70.3%
2015 2016 Target
Demand Forecast Accuracy
The improvement trend observed in the forecast accuracy metrics are reflected by 44% of respondents believing their organisations ability to forecast demand has become moderately or significantly easier over the last 12 months, while only 27% believe it has become more difficult.
The majority (73%) of respondents also indicated that they believe their planning capability has kept up with the challenges of the market place.
Forecast Accuracy Metrics
How would you say your organisations’ ability to accurately forecast demand has changed over the last 12 months
41%
3%Significantly more
difficult
22%
Somewhat more difficult
About the same Significantly easierModerately easier
5%
30%

of respondents utilise Advanced Planning
Systems
33%
of respondents use spreadsheets to generate and maintain forecasts
28%
22
AFGC | Supply Chain Survey Report 2016
2 Industry Capability and Trends
How integrated is customer-provided forecast data to your planning systems?
How integrated is the budgeting process with the forecasting process?
While processes are often designed to consider both downstream and upstream information, manual integration is the predominant method:
• Whilst 89% of respondents utilise customer store data, only 24% of these integrate it with their systems – the remainder review manually or on an ad-hoc basis
• With regards to budgeting and financial planning, only 15% of respondents indicated the forecasting process is fully integrated with the budgeting process, with most indicating the process is either partially or largely integrated
For the 28% of respondents who use spreadsheets to generate and maintain forecasts, this integration will be harder to achieve.
More respondents use a specialised tool or Advanced Planning System (APS) to generate and maintain their forecasts than any other approach (33%), followed by spreadsheets (28%) and Enterprise Resource Planning (ERP) Systems (19%).
2.2 Planning Capability
31%
Not at all
28%
Ad hoc as required Partially integrated Fully integrated
33%
8%
11%
Fullly independant
33%
Partially integrated Largely integrated Fully integrated
42%
14%
6%
14%
19%
28%
33%
In-house/Custom tool
Hybrid
ERP System
Spreadsheets
Specialised tool/APS
Planning System

23
AFGC | Supply Chain Survey Report 2016
2 Industry Capability and Trends
0% 10% 20% 30% 40% 50% 60% 70% 80% 90% 100%
Inventory Parameter Calcs
Inventory Planning
Scenario Planning
Capacity Planning
How would you rate your organisation’s system capability?
Of the organisations surveyed, 30% do not have processes that allow them to review items by exception (these organisations on average have lower revenue and a lower number of SKUs).
Based on the results of the survey an opportunity for organisations to improve their capabilities in relation to scenario planning was identified, with 62% of respondents having insufficient capability in their systems to conduct scenario planning.
With the increases in demand volatility and market competition, the need for the ability to conduct scenario planning increases.
Dedicated Supply Chain capability resourceMaster Data quality
2.2 Planning Capability
Exception based processes
20%
Excellent
49%
Acceptable Inadequate Poor
29%
3%No- review every item NoYes
69%
31%
59%
41%
30% The number of organisations that are unable to do exception-based review
Respondents assessed their system capability as adequate/sufficient in most regards. Scenario planning was identified as the area with the least capability, which presents an area of opportunity for the industry.
Size of business % with a Supply Chain capability resource
$0 - 100m+ 64%
$101- $500m+ 36%
$501 - $1000m+ 60%
$1001m+ 81%
of organisations have a dedicated Supply Chain capability resource
59%
SufficientHighly Capable Inappropriate or insufficient Non-existent
62% The number of organisations that do not have sufficient system capability to conduct scenario planning
Yes - exception based
This section surveys how the member base is engaging with their customers and explores how customer requirements are changing. It explores planning and collaboration processes between the industry and retailer, reviews delivery and DC performance and asks respondents about the impact of retailer driven initiatives.
By measuring how the industry interacts with customers and executes on their requirements, it is possible to gauge how the industry is performing in meeting these expectations and also to identify key trends and initiatives.
24
Retailer Engagement
Section 3

of respondents said improved Collaboration
offers the greatest opportunity for supply
chain improvement
46%
25
AFGC | Supply Chain Survey Report 2016
Key FindingsAcross the board, business planning /collaboration and order/delivery efficiency are the predominant initiatives being pursued by respondents to improve relationships with their suppliers.
The most commonly identified challenges faced by members were those driven by the prevailing retailers and managing the cost of meeting their requirements. Specifically, the following were identified:
• The move to increased SFP
• Margin push by retailers (e.g. changing trading terms, inventory reductions)
• Increasing proportion of private label
• Challenges associated with meeting customer demand, in particular for items on promotion
3 Retailer Engagement
By measuring how the industry interacts with their customers and executes on their requirements, it is possible to gauge how the industry is performing in meeting these expectations and to identify key trends and initiatives.
38%19%
Coles
57%
Do you currently measure your performance with major trading partners?
59%
Woolworths Metcash Aldi
Initiatives
0%
5%
10%
15%
20%
25%
30%
BusinessPlanning andForecasting
Collaboration
Retail ReadyPackaging
Display PalletImplementation
Trading TermsRevision
Business toBusiness (B2B)
E-commerce
On ShelfAvailability
Order andDelivery
Efficiency
KeyPerformanceMetrics andScorecards
AldiMetcash
25% of companies with over $500m in revenue do not formally measure their performance with the major trading partners
WoolworthsColes

On shelf availability stood out as a large concern versus the industry’s readiness
26
AFGC | Supply Chain Survey Report 2016
3 Retailer Engagement
0% 20% 40% 60% 80% 100%
Retail Ready Packaging / Display Pallets - Importance
Retail Ready Packaging / Display Pallets - Readiness
Retail Ready Packaging / Display Pallets - Concern
On-shelf availability - Importance
On-shelf availability - Readiness
On-shelf availability - Concern
Planning consumer demand - Importance
Planning consumer demand - Readiness
Planning consumer demand - Concern
High Medium Low
Customer related key developments and issues
When asked to about key developments and issues based on the importance to the industry, how ready you feel industry is to deal with the issue, and your level of concern about the issue from your business’ perspective the main differences from a concern and readiness point of view were:
• On shelf availability, given its rated importance, stood out as a large concern versus the industry’s readiness
• Planning consumer demand also was a concern, however in previous questions, the survey has stated that the forecasting capability is keeping pace
• Retail Ready packaging has been flagged as the least ready and is a concern given its flagged importance
• Data integrity and alignment between trading partners also rates a concern versus the industry’s readiness
LowMedium High

27
GRA is Australia’s premier expert consulting firm specialising in supply chain and logistics strategy, planning and execution.
About the Authors
AFGC | Supply Chain Survey Report 2016
About us
GRA was founded in 1997 and is Australia’s
premier specialist supply chain consulting
firm. Our team has extensive commercial
supply chain and logistics experience across
a broad range of industries and at all levels
of the process, both strategic and operation-
al. For the last two decades, we have worked
with over 200 organisations to turn their
supply chains into a competitive advantage.
We guarantee results and aim for a minimum
3:1 ROI for work undertaken, with typical
returns ranging from 10:1 to 30:1.
Our Team
Our team has extensive commercial supply
chain and logistics management experience
across a broad range of industries and at
all levels of the process, both strategic and
operational. Having worked within industry
as practitioners to implement supply chain
initiatives, we have first-hand insight into
our clients’ requirements and challenges.
This makes us uniquely qualified to help our
clients achieve their goals.
Contact Us GRA Supply Chain Pty Ltd | 110 Jolimont Road, East Melbourne VIC | + 61 3 9421 4611
www.gra.net.au
WE WORK WITH YOU UNTIL SUSTAINABLE RESULTS ARE DELIVERED
Luke Tomkin GRA Partner
Luke is a Partner with GRA and throughout his career has helped organisations in South East Asia and Australasia deliver rapid and sustained inventory reductions, service level improvements and supply chain cost reductions through the practical application of leading supply chain processes, techniques and systems.
Dan Knox Senior Manager
Dan has over 20 years’ experience in the FMCG industry with the majority of that time focussing on demand management, supply planning and sales & operations planning and transformation. During that time, Dan has implemented best practise sales and operations planning processes as well as numerous supply chain planning improvement processes and systems.
Adam Kidd Manager
Adam brings over 10 years’ industry experience to his engagements, having worked with leading companies in Australia and abroad in both operational and consulting roles. His expertise includes demand & supply planning, sales & operations planning, inventory management and process improvement, particularly in the FMCG, grocery and pharma industries.