supply chain planning benchmarking results abc …€¦ · supply chain planning benchmarking...
TRANSCRIPT

Supply Chain Planning Benchmarking
Results
SAP Value Engineering
ABC Company
9 septembre 2011
“All benchmarks contained in this report are for illustrative purposes only. The contents of the actual report may vary depending on availability and maturity of benchmarks for the peer group in consideration”.

SAP CONFIDENTIAL - Page 2 - For subject Company Internal Use Only - This page is from the Benchmarking Analysis prepared for subject Company and subject to the terms, conditions and assumptions contained in the Benchmarking Analysis. Information contained herein is not a guarantee of future results, performance or cost savings.
Statement of Confidentiality and Exceptions
The information and analysis contained herein are the confidential and proprietary materials of
SAP AG. No part of this publication may be reproduced or transmitted in any form or for any
purpose without the express written permission of SAP AG. The information contained herein may be changed without prior notice.
The furnishing of this document shall not be construed as an offer or as constituting a binding
agreement on the part of SAP AG and/ or its affiliated companies (“SAP”) to enter into any
relationship. SAP provides this document as guidance only to illustrate estimated comparisons between the subject Company and other companies with respect to certain key performance
indicators and drivers.
These materials may be based upon information provided by the subject Company, information
provided by other companies and assumptions that are subject to change. These materials present illustrations of potential performance and cost savings, and do not guaranty future
results, performance or cost savings. The materials are provided solely for internal review and
use by the subject Company. SAP makes no representation or warranties of any kind with
respect to these materials, and SAP shall not be liable for errors or omissions with respect to
these materials.

SAP CONFIDENTIAL - Page 3 - For subject Company Internal Use Only - This page is from the Benchmarking Analysis prepared for subject Company and subject to the terms, conditions and assumptions contained in the Benchmarking Analysis. Information contained herein is not a guarantee of future results, performance or cost savings.
Agenda
1. Executive Summary
2. Detailed Benchmarking Results
3. Case Studies
4. Appendix

SAP CONFIDENTIAL - Page 4 - For subject Company Internal Use Only - This page is from the Benchmarking Analysis prepared for subject Company and subject to the terms, conditions and assumptions contained in the Benchmarking Analysis. Information contained herein is not a guarantee of future results, performance or cost savings.
SAP Performance Benchmarking –
Designed to Get Actionable Results
Launched end of 2004 as a forum to exchange metrics and best
practices
Program covers 26 processes, with 5000+ participants who leverage
the program to:
Build a business case for change
Compare performance to leading companies, industry peers, and
between regions/ divisions
Assess value realization, year-over year
Prove success
Supply Chain Planning program launched end of 2006
Over 300 participants to date
SAP CONFIDENTIAL - Page 5 - For subject Company Internal Use Only - This page is from the Benchmarking Analysis prepared for subject Company and subject to the terms, conditions and assumptions contained in the Benchmarking Analysis. Information contained herein is not a guarantee of future results, performance or cost savings.
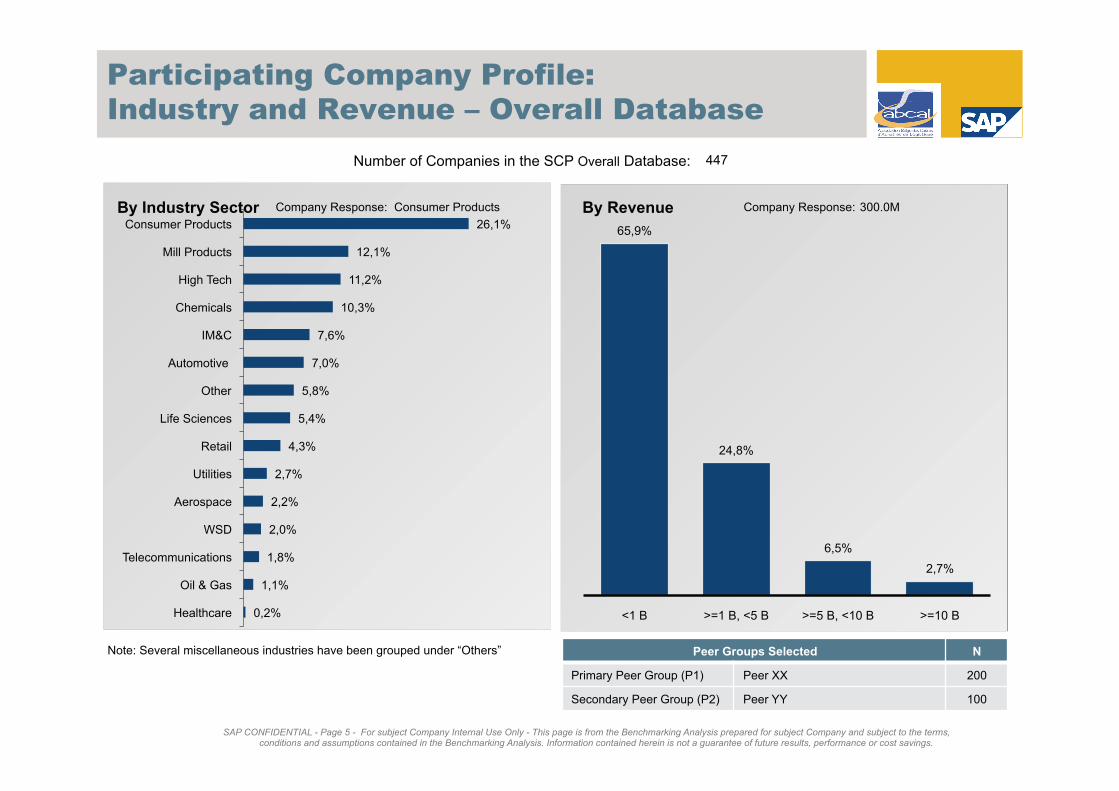
Participating Company Profile:
Industry and Revenue – Overall Database
65,9%
24,8%
6,5%
2,7%
<1 B >=1 B, <5 B >=5 B, <10 B >=10 B
By Revenue By Industry Sector 300.0M
0,2%
1,1%
1,8%
2,0%
2,2%
2,7%
4,3%
5,4%
5,8%
7,0%
7,6%
10,3%
11,2%
12,1%
26,1%
Healthcare
Oil & Gas
Telecommunications
WSD
Aerospace
Utilities
Retail
Life Sciences
Other
Automotive
IM&C
Chemicals
High Tech
Mill Products
Consumer Products
Number of Companies in the SCP Overall Database: 447
Company Response: Company Response: Consumer Products
Peer Groups Selected N
Primary Peer Group (P1) Peer XX 200
Secondary Peer Group (P2) Peer YY 100
Note: Several miscellaneous industries have been grouped under “Others”
SAP CONFIDENTIAL - Page 6 - For subject Company Internal Use Only - This page is from the Benchmarking Analysis prepared for subject Company and subject to the terms, conditions and assumptions contained in the Benchmarking Analysis. Information contained herein is not a guarantee of future results, performance or cost savings.
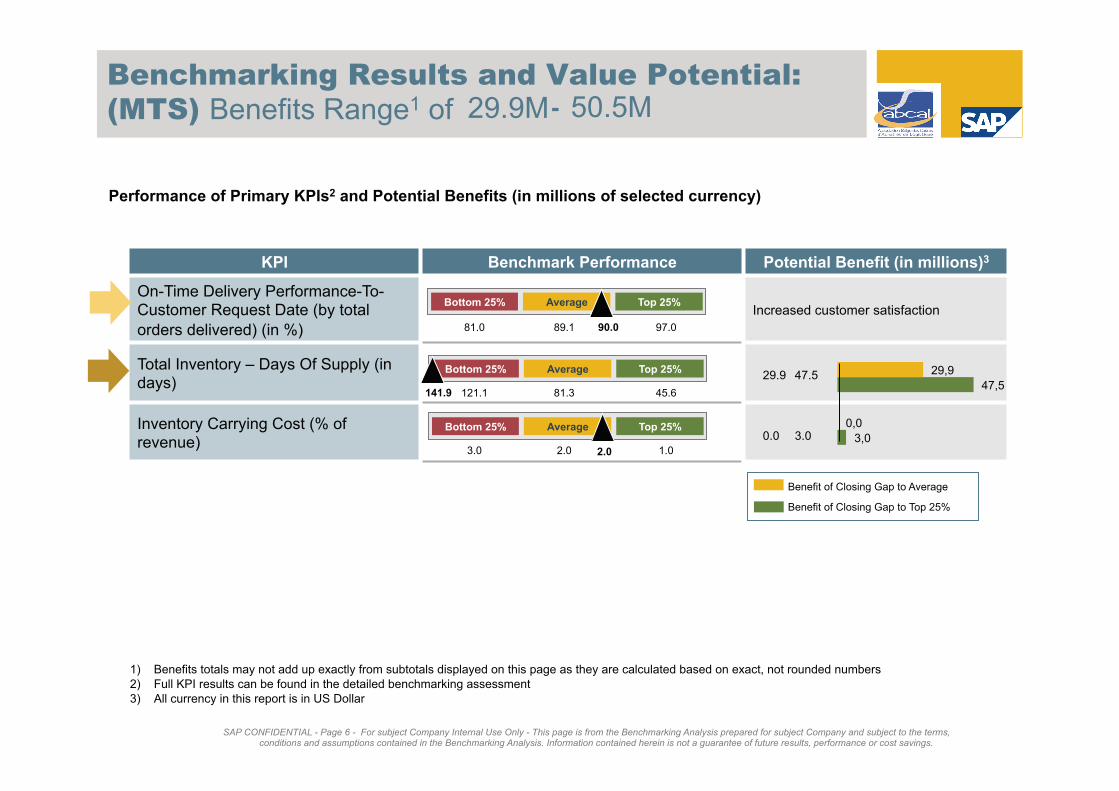
Benchmarking Results and Value Potential:
(MTS) Benefits Range1 of
KPI Benchmark Performance Potential Benefit (in millions)3
On-Time Delivery Performance-To-Customer Request Date (by total
orders delivered) (in %)
Increased customer satisfaction
Total Inventory – Days Of Supply (in days)
Inventory Carrying Cost (% of revenue)
Bottom 25% Average Top 25%
Bottom 25% Average Top 25%
Benefit of Closing Gap to Top 25%
Benefit of Closing Gap to Average
Bottom 25% Average Top 25%
81.0 97.0 89.1 90.0
2.0
141.9
3.0 1.0 2.0
121.1 45.6 81.3
0.0 3.0
29.9 47.5
29.9M 50.5M
3,0
47,5
0,0
29,9
-
1) Benefits totals may not add up exactly from subtotals displayed on this page as they are calculated based on exact, not rounded numbers
2) Full KPI results can be found in the detailed benchmarking assessment
3) All currency in this report is in US Dollar
Performance of Primary KPIs2 and Potential Benefits (in millions of selected currency)
SAP CONFIDENTIAL - Page 7 - For subject Company Internal Use Only - This page is from the Benchmarking Analysis prepared for subject Company and subject to the terms, conditions and assumptions contained in the Benchmarking Analysis. Information contained herein is not a guarantee of future results, performance or cost savings.
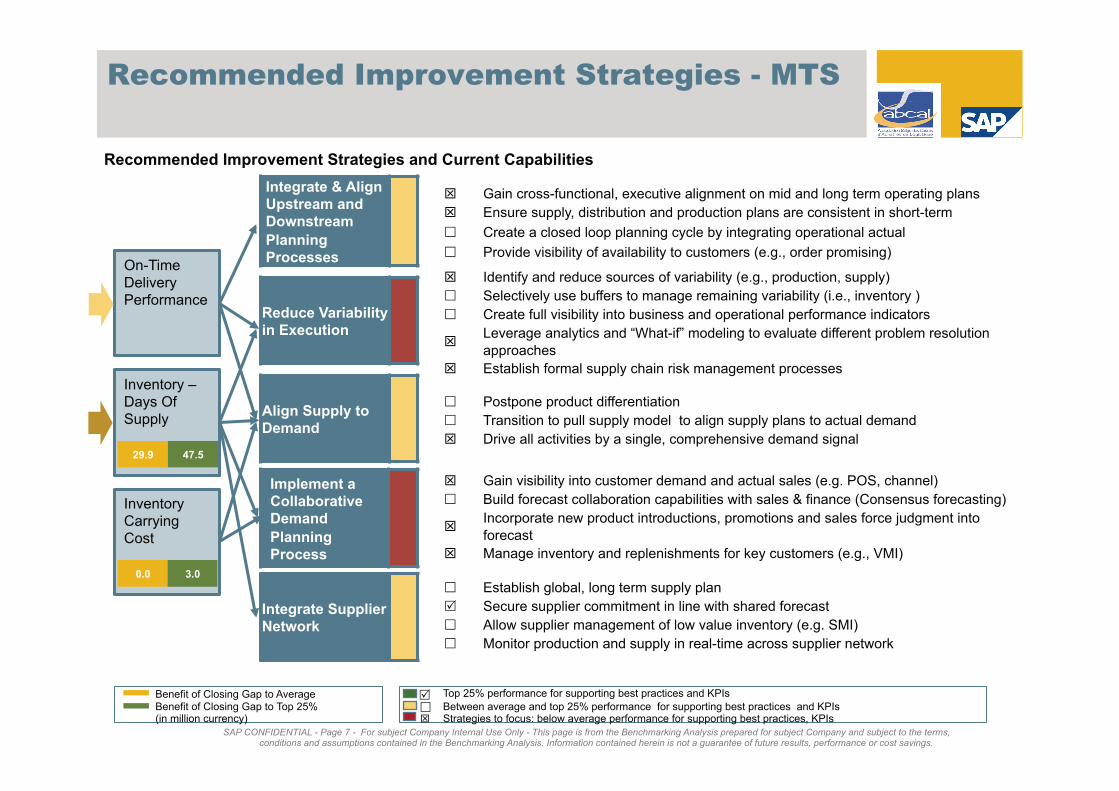
Integrate & Align Upstream and Downstream
Planning Processes
Reduce Variability in Execution
Align Supply to Demand
Integrate Supplier Network
Recommended Improvement Strategies - MTS
Recommended Improvement Strategies and Current Capabilities
On-Time
Delivery
Performance
Inventory
Carrying
Cost
Inventory –
Days Of
Supply
Gain cross-functional, executive alignment on mid and long term operating plans
Ensure supply, distribution and production plans are consistent in short-term
Create a closed loop planning cycle by integrating operational actual
Provide visibility of availability to customers (e.g., order promising)
Identify and reduce sources of variability (e.g., production, supply)
Selectively use buffers to manage remaining variability (i.e., inventory )
Create full visibility into business and operational performance indicators
Leverage analytics and “What-if” modeling to evaluate different problem resolution
approaches
Establish formal supply chain risk management processes
Postpone product differentiation
Transition to pull supply model to align supply plans to actual demand
Drive all activities by a single, comprehensive demand signal
Gain visibility into customer demand and actual sales (e.g. POS, channel)
Build forecast collaboration capabilities with sales & finance (Consensus forecasting)
Incorporate new product introductions, promotions and sales force judgment into
forecast
Manage inventory and replenishments for key customers (e.g., VMI)
Establish global, long term supply plan
Secure supplier commitment in line with shared forecast
Allow supplier management of low value inventory (e.g. SMI)
Monitor production and supply in real-time across supplier network
29.9 47.5
0.0 3.0
Benefit of Closing Gap to Top 25% (in million currency)
Benefit of Closing Gap to Average Top 25% performance for supporting best practices and KPIs
Between average and top 25% performance for supporting best practices and KPIs Strategies to focus: below average performance for supporting best practices, KPIs
Implement a Collaborative Demand
Planning Process
SAP CONFIDENTIAL - Page 8 - For subject Company Internal Use Only - This page is from the Benchmarking Analysis prepared for subject Company and subject to the terms, conditions and assumptions contained in the Benchmarking Analysis. Information contained herein is not a guarantee of future results, performance or cost savings.
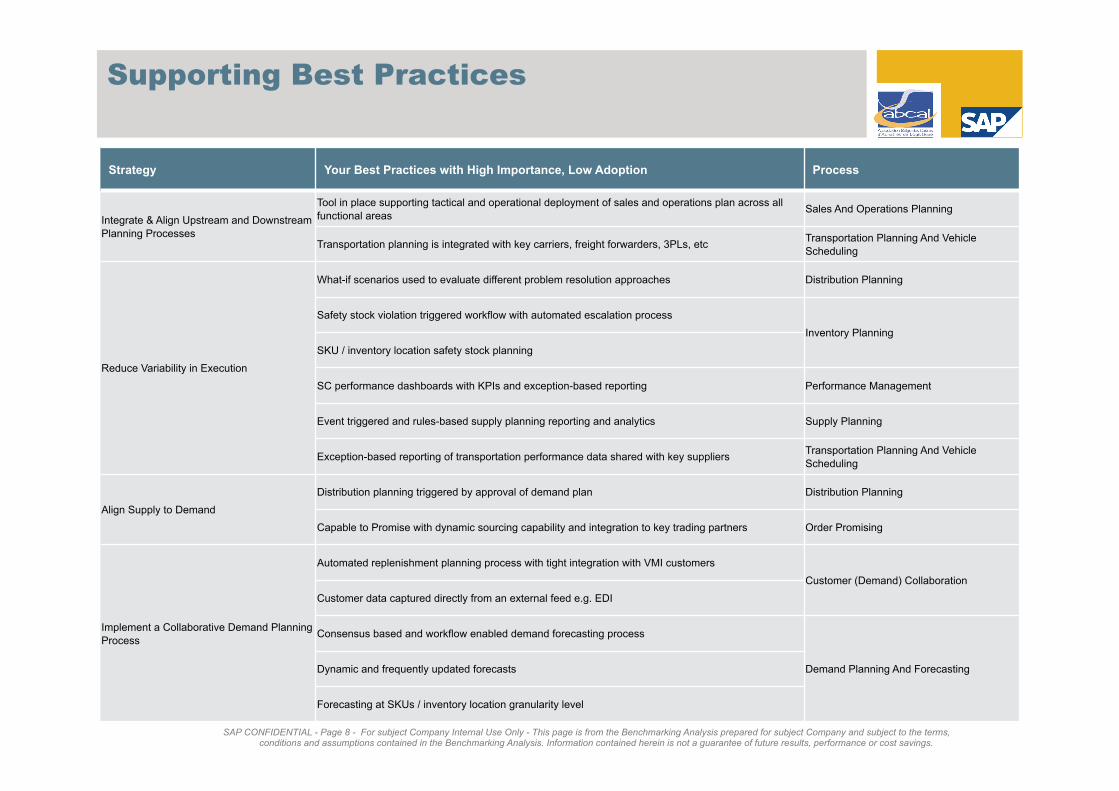
Supporting Best Practices
Best Practices To Help Close the Gap Strategy Your Best Practices with High Importance, Low Adoption Process
Integrate & Align Upstream and Downstream
Planning Processes
Tool in place supporting tactical and operational deployment of sales and operations plan across all
functional areas Sales And Operations Planning
Transportation planning is integrated with key carriers, freight forwarders, 3PLs, etc Transportation Planning And Vehicle
Scheduling
Reduce Variability in Execution
What-if scenarios used to evaluate different problem resolution approaches Distribution Planning
Safety stock violation triggered workflow with automated escalation process
Inventory Planning
SKU / inventory location safety stock planning
SC performance dashboards with KPIs and exception-based reporting Performance Management
Event triggered and rules-based supply planning reporting and analytics Supply Planning
Exception-based reporting of transportation performance data shared with key suppliers Transportation Planning And Vehicle
Scheduling
Align Supply to Demand
Distribution planning triggered by approval of demand plan Distribution Planning
Capable to Promise with dynamic sourcing capability and integration to key trading partners Order Promising
Implement a Collaborative Demand Planning
Process
Automated replenishment planning process with tight integration with VMI customers
Customer (Demand) Collaboration
Customer data captured directly from an external feed e.g. EDI
Consensus based and workflow enabled demand forecasting process
Demand Planning And Forecasting Dynamic and frequently updated forecasts
Forecasting at SKUs / inventory location granularity level
SAP CONFIDENTIAL - Page 9 - For subject Company Internal Use Only - This page is from the Benchmarking Analysis prepared for subject Company and subject to the terms, conditions and assumptions contained in the Benchmarking Analysis. Information contained herein is not a guarantee of future results, performance or cost savings.
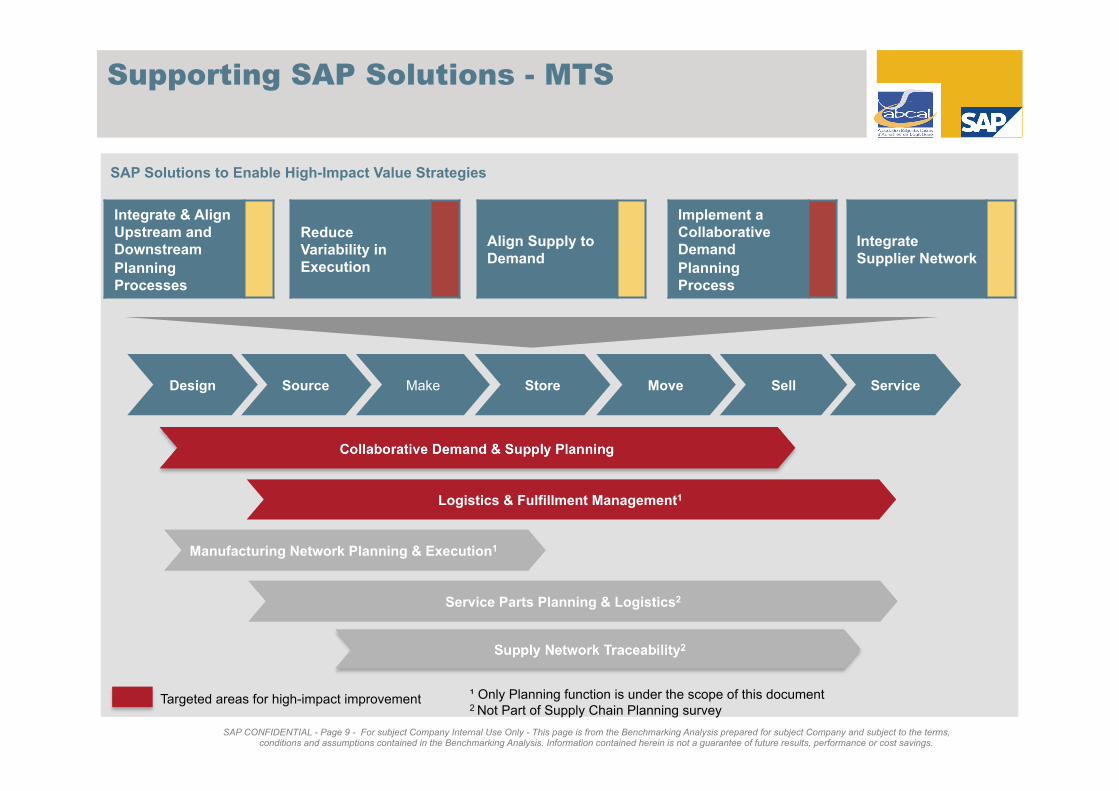
SAP Solutions to Enable High-Impact Value Strategies
Design Source Make Store Move Sell
Collaborative Demand & Supply Planning
Logistics & Fulfillment Management1
Manufacturing Network Planning & Execution1
Supply Network Traceability2
Service
Service Parts Planning & Logistics2
Integrate & Align Upstream and Downstream
Planning Processes
Reduce Variability in Execution
Align Supply to Demand
Implement a Collaborative Demand
Planning Process
Integrate Supplier Network
Targeted areas for high-impact improvement Only Planning function is under the scope of this document 2 Not Part of Supply Chain Planning survey
Supporting SAP Solutions - MTS
SAP CONFIDENTIAL - Page 10 - For subject Company Internal Use Only - This page is from the Benchmarking Analysis prepared for subject Company and subject to the terms, conditions and assumptions contained in the Benchmarking Analysis. Information contained herein is not a guarantee of future results, performance or cost savings.
Agenda
1. Executive Summary
2. Detailed Benchmarking Results
3. Case Studies
4. Appendix
SAP CONFIDENTIAL - Page 11 - For subject Company Internal Use Only - This page is from the Benchmarking Analysis prepared for subject Company and subject to the terms, conditions and assumptions contained in the Benchmarking Analysis. Information contained herein is not a guarantee of future results, performance or cost savings.
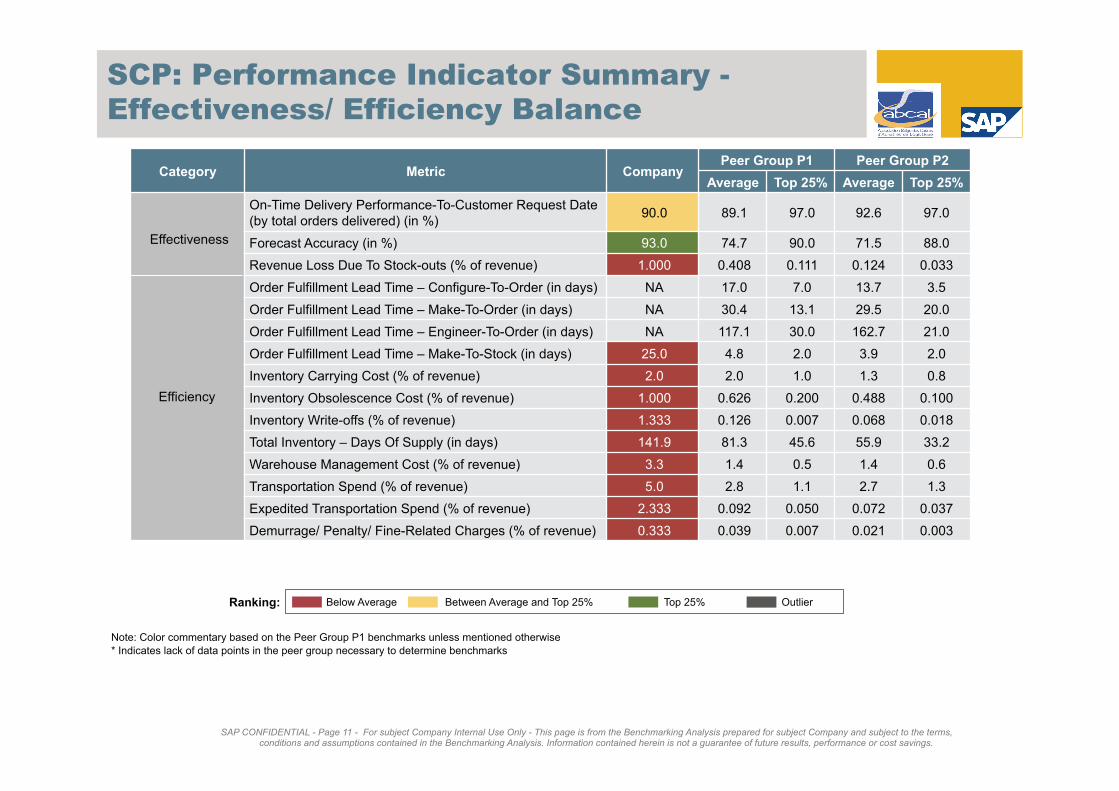
Category Metric Company Peer Group P1 Peer Group P2
Average Top 25% Average Top 25%
On-Time Delivery Performance-To-Customer Request Date
(by total orders delivered) (in %) 90.0 89.1 97.0 92.6 97.0
Forecast Accuracy (in %) 93.0 74.7 90.0 71.5 88.0
Revenue Loss Due To Stock-outs (% of revenue) 1.000 0.408 0.111 0.124 0.033
Order Fulfillment Lead Time – Configure-To-Order (in days) NA 17.0 7.0 13.7 3.5
Order Fulfillment Lead Time – Make-To-Order (in days) NA 30.4 13.1 29.5 20.0
Order Fulfillment Lead Time – Engineer-To-Order (in days) NA 117.1 30.0 162.7 21.0
Order Fulfillment Lead Time – Make-To-Stock (in days) 25.0 4.8 2.0 3.9 2.0
Inventory Carrying Cost (% of revenue) 2.0 2.0 1.0 1.3 0.8
Inventory Obsolescence Cost (% of revenue) 1.000 0.626 0.200 0.488 0.100
Inventory Write-offs (% of revenue) 1.333 0.126 0.007 0.068 0.018
Total Inventory – Days Of Supply (in days) 141.9 81.3 45.6 55.9 33.2
Warehouse Management Cost (% of revenue) 3.3 1.4 0.5 1.4 0.6
Transportation Spend (% of revenue) 5.0 2.8 1.1 2.7 1.3
Expedited Transportation Spend (% of revenue) 2.333 0.092 0.050 0.072 0.037
Demurrage/ Penalty/ Fine-Related Charges (% of revenue) 0.333 0.039 0.007 0.021 0.003
SCP: Performance Indicator Summary -
Effectiveness/ Efficiency Balance
Efficiency
Effectiveness
Top 25% Between Average and Top 25% Below Average Outlier Ranking:
Note: Color commentary based on the Peer Group P1 benchmarks unless mentioned otherwise
* Indicates lack of data points in the peer group necessary to determine benchmarks
SAP CONFIDENTIAL - Page 12 - For subject Company Internal Use Only - This page is from the Benchmarking Analysis prepared for subject Company and subject to the terms, conditions and assumptions contained in the Benchmarking Analysis. Information contained herein is not a guarantee of future results, performance or cost savings.
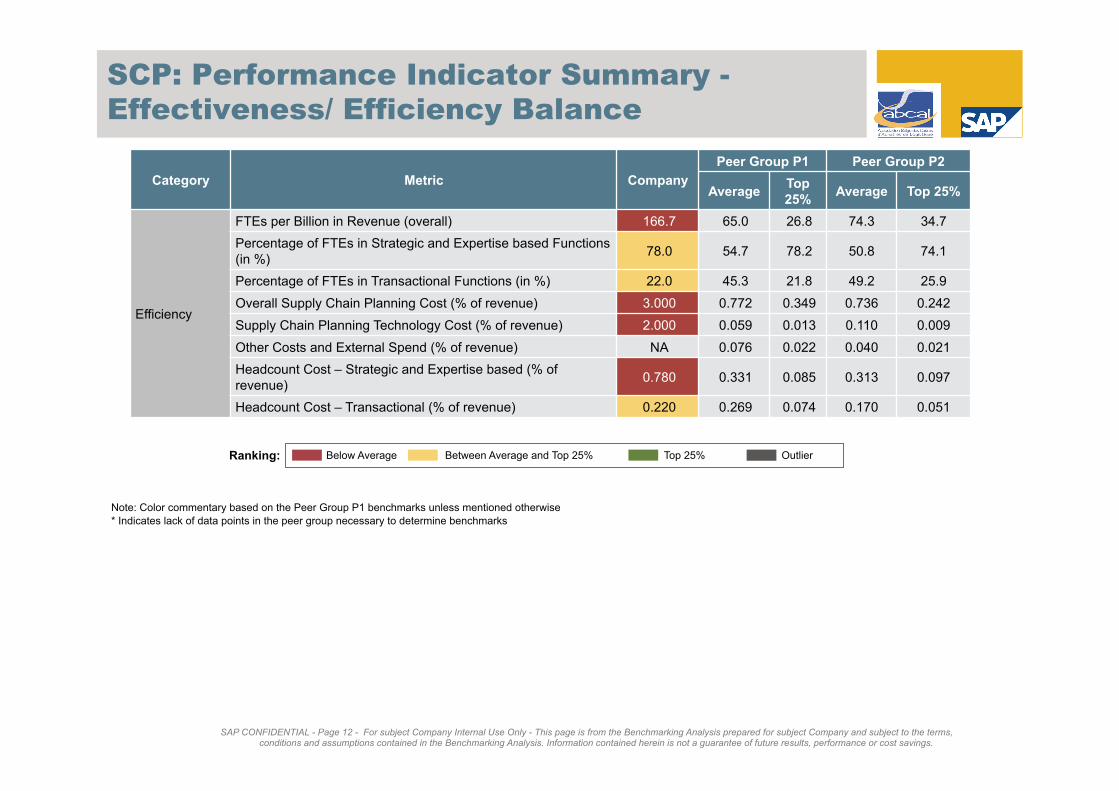
Category Metric Company
Peer Group P1 Peer Group P2
Average Top 25%
Average Top 25%
Efficiency
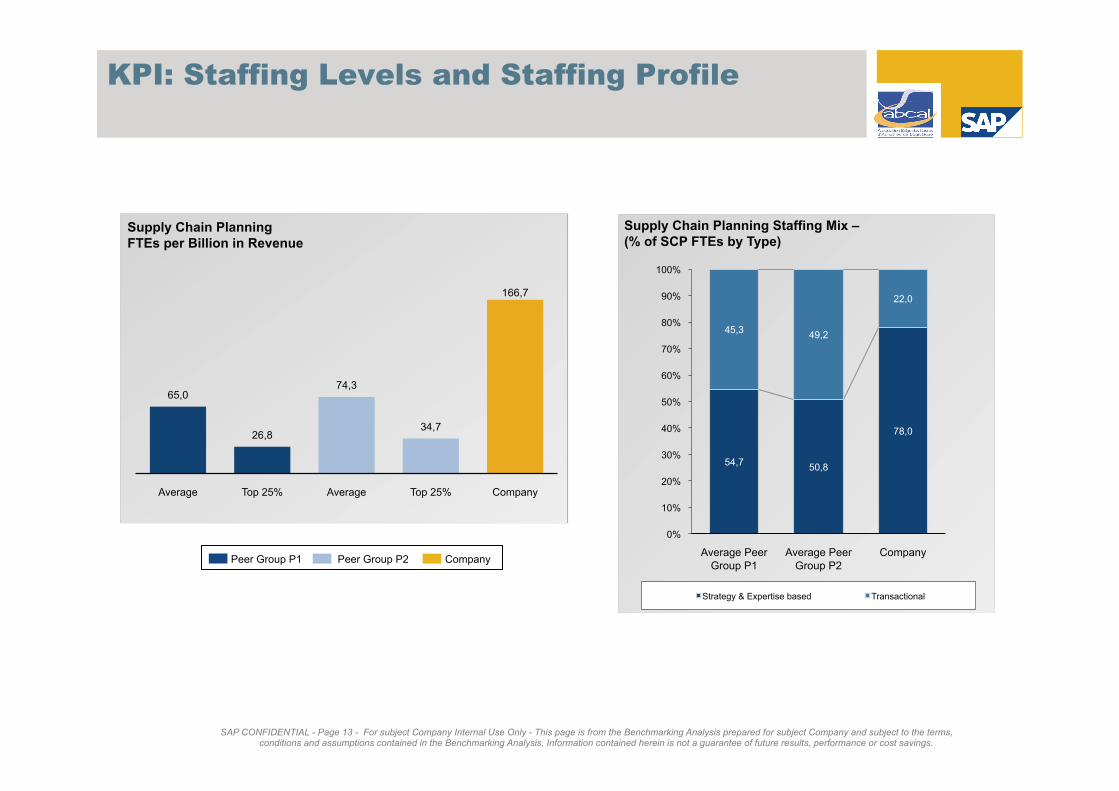
FTEs per Billion in Revenue (overall) 166.7 65.0 26.8 74.3 34.7
Percentage of FTEs in Strategic and Expertise based Functions
(in %) 78.0 54.7 78.2 50.8 74.1
Percentage of FTEs in Transactional Functions (in %) 22.0 45.3 21.8 49.2 25.9
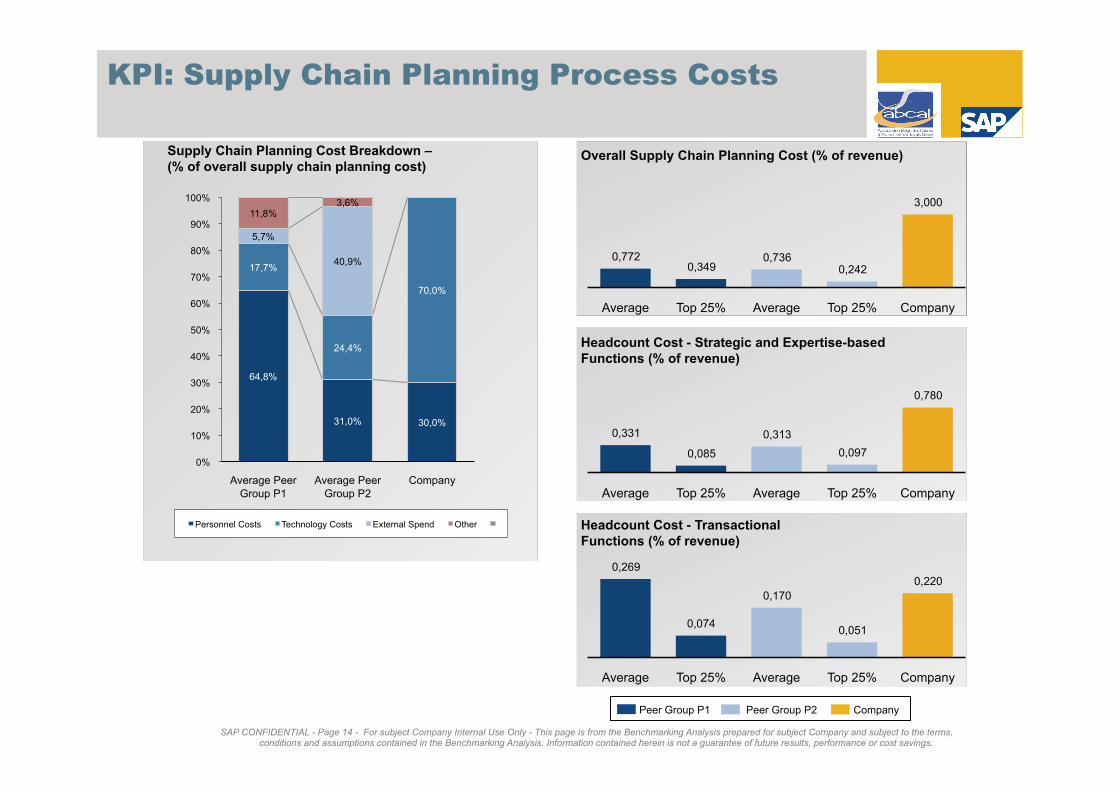
Overall Supply Chain Planning Cost (% of revenue) 3.000 0.772 0.349 0.736 0.242
Supply Chain Planning Technology Cost (% of revenue) 2.000 0.059 0.013 0.110 0.009
Other Costs and External Spend (% of revenue) NA 0.076 0.022 0.040 0.021
Headcount Cost – Strategic and Expertise based (% of
revenue) 0.780 0.331 0.085 0.313 0.097
Headcount Cost – Transactional (% of revenue) 0.220 0.269 0.074 0.170 0.051
SCP: Performance Indicator Summary -
Effectiveness/ Efficiency Balance
Top 25% Between Average and Top 25% Below Average Outlier Ranking:
Note: Color commentary based on the Peer Group P1 benchmarks unless mentioned otherwise
* Indicates lack of data points in the peer group necessary to determine benchmarks
SAP CONFIDENTIAL - Page 13 - For subject Company Internal Use Only - This page is from the Benchmarking Analysis prepared for subject Company and subject to the terms, conditions and assumptions contained in the Benchmarking Analysis. Information contained herein is not a guarantee of future results, performance or cost savings.
KPI: Staffing Levels and Staffing Profile
Supply Chain Planning FTEs per Billion in Revenue
65,0
26,8
74,3
34,7
166,7
Average Top 25% Average Top 25% Company
Peer Group P1 Peer Group P2 Company
54,7 50,8
78,0
45,3 49,2
22,0
0%
10%
20%
30%
40%
50%
60%
70%
80%
90%
100%
Average Peer
Group P1
Average Peer
Group P2
Company
Strategy & Expertise based Transactional
Supply Chain Planning Staffing Mix – (% of SCP FTEs by Type)
SAP CONFIDENTIAL - Page 14 - For subject Company Internal Use Only - This page is from the Benchmarking Analysis prepared for subject Company and subject to the terms, conditions and assumptions contained in the Benchmarking Analysis. Information contained herein is not a guarantee of future results, performance or cost savings.
0,269
0,074
0,170
0,051
0,220
Average Top 25% Average Top 25% Company
0,331
0,085
0,313
0,097
0,780
Average Top 25% Average Top 25% Company
KPI: Supply Chain Planning Process Costs
0,772 0,349
0,736 0,242
3,000
Average Top 25% Average Top 25% Company
Overall Supply Chain Planning Cost (% of revenue)
Headcount Cost - Transactional Functions (% of revenue)
Headcount Cost - Strategic and Expertise-based Functions (% of revenue)
Peer Group P1 Peer Group P2 Company
64,8%
31,0% 30,0%
17,7%
24,4%
70,0%
5,7%
40,9%
11,8% 3,6%
0%
10%
20%
30%
40%
50%
60%
70%
80%
90%
100%
Average Peer
Group P1
Average Peer
Group P2
Company
Personnel Costs Technology Costs External Spend Other
Supply Chain Planning Cost Breakdown – (% of overall supply chain planning cost)
SAP CONFIDENTIAL - Page 15 - For subject Company Internal Use Only - This page is from the Benchmarking Analysis prepared for subject Company and subject to the terms, conditions and assumptions contained in the Benchmarking Analysis. Information contained herein is not a guarantee of future results, performance or cost savings.
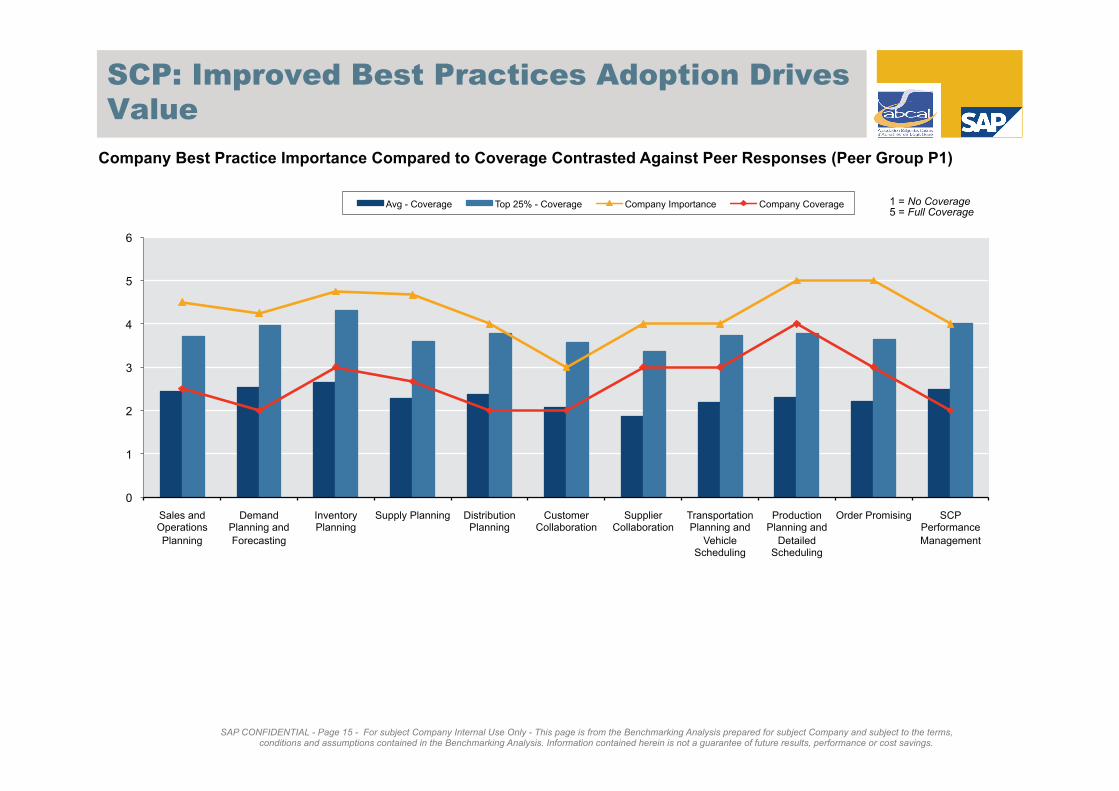
SCP: Improved Best Practices Adoption Drives
Value
0
1
2
3
4
5
6
Sales and Operations
Planning
Demand Planning and
Forecasting
Inventory Planning
Supply Planning Distribution Planning
Customer Collaboration
Supplier Collaboration
Transportation Planning and
Vehicle Scheduling
Production Planning and
Detailed Scheduling
Order Promising SCP Performance
Management
Avg - Coverage Top 25% - Coverage Company Importance Company Coverage
Company Best Practice Importance Compared to Coverage Contrasted Against Peer Responses (Peer Group P1)
1 = No Coverage 5 = Full Coverage
SAP CONFIDENTIAL - Page 16 - For subject Company Internal Use Only - This page is from the Benchmarking Analysis prepared for subject Company and subject to the terms, conditions and assumptions contained in the Benchmarking Analysis. Information contained herein is not a guarantee of future results, performance or cost savings.
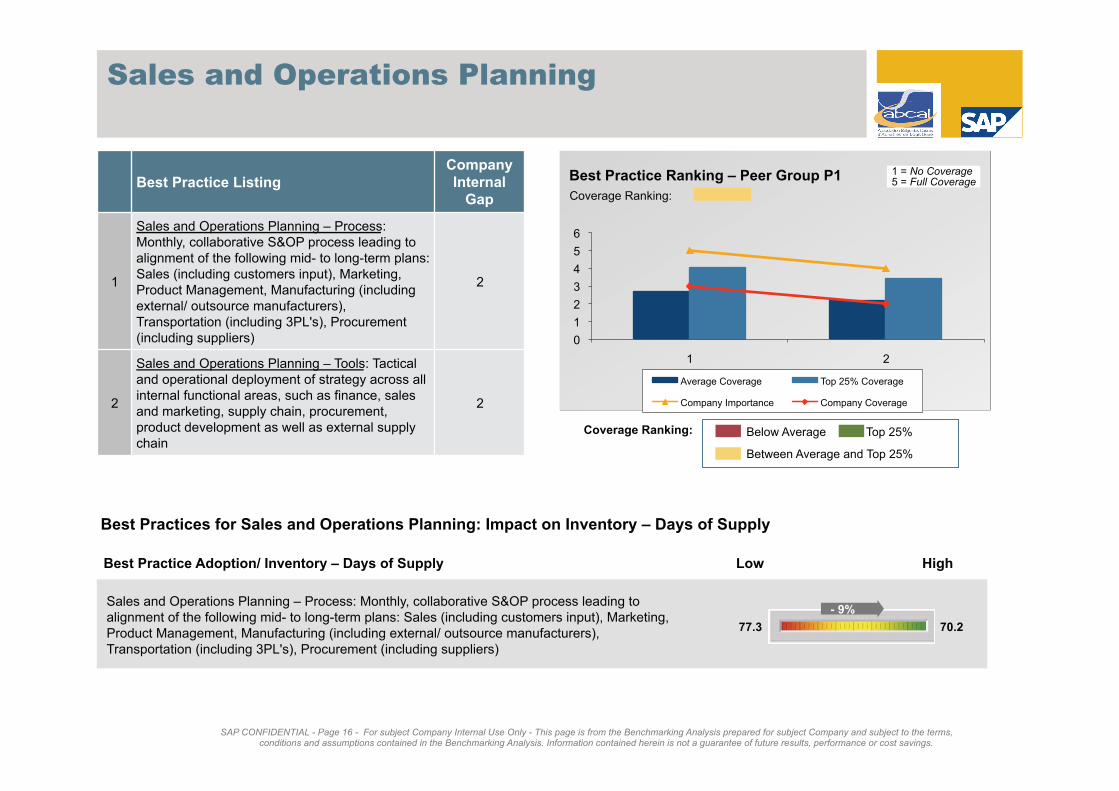
Best Practice Listing Company Internal
Gap
1
Sales and Operations Planning – Process:
Monthly, collaborative S&OP process leading to
alignment of the following mid- to long-term plans:
Sales (including customers input), Marketing,
Product Management, Manufacturing (including
external/ outsource manufacturers),
Transportation (including 3PL's), Procurement
(including suppliers)
2
2
Sales and Operations Planning – Tools: Tactical
and operational deployment of strategy across all
internal functional areas, such as finance, sales
and marketing, supply chain, procurement,
product development as well as external supply
chain
2
Sales and Operations Planning
Best Practice Ranking – Peer Group P1 1 = No Coverage 5 = Full Coverage
0
1
2
3
4
5
6
1 2
Average Coverage Top 25% Coverage
Company Importance Company Coverage
Coverage Ranking:
Best Practices for Sales and Operations Planning: Impact on Inventory – Days of Supply
Best Practice Adoption/ Inventory – Days of Supply
Sales and Operations Planning – Process: Monthly, collaborative S&OP process leading to
alignment of the following mid- to long-term plans: Sales (including customers input), Marketing,
Product Management, Manufacturing (including external/ outsource manufacturers),
Transportation (including 3PL's), Procurement (including suppliers)
70.2 77.3
- 9%
Low High
Top 25%
Between Average and Top 25%
Below Average Coverage Ranking:
SAP CONFIDENTIAL - Page 17 - For subject Company Internal Use Only - This page is from the Benchmarking Analysis prepared for subject Company and subject to the terms, conditions and assumptions contained in the Benchmarking Analysis. Information contained herein is not a guarantee of future results, performance or cost savings.
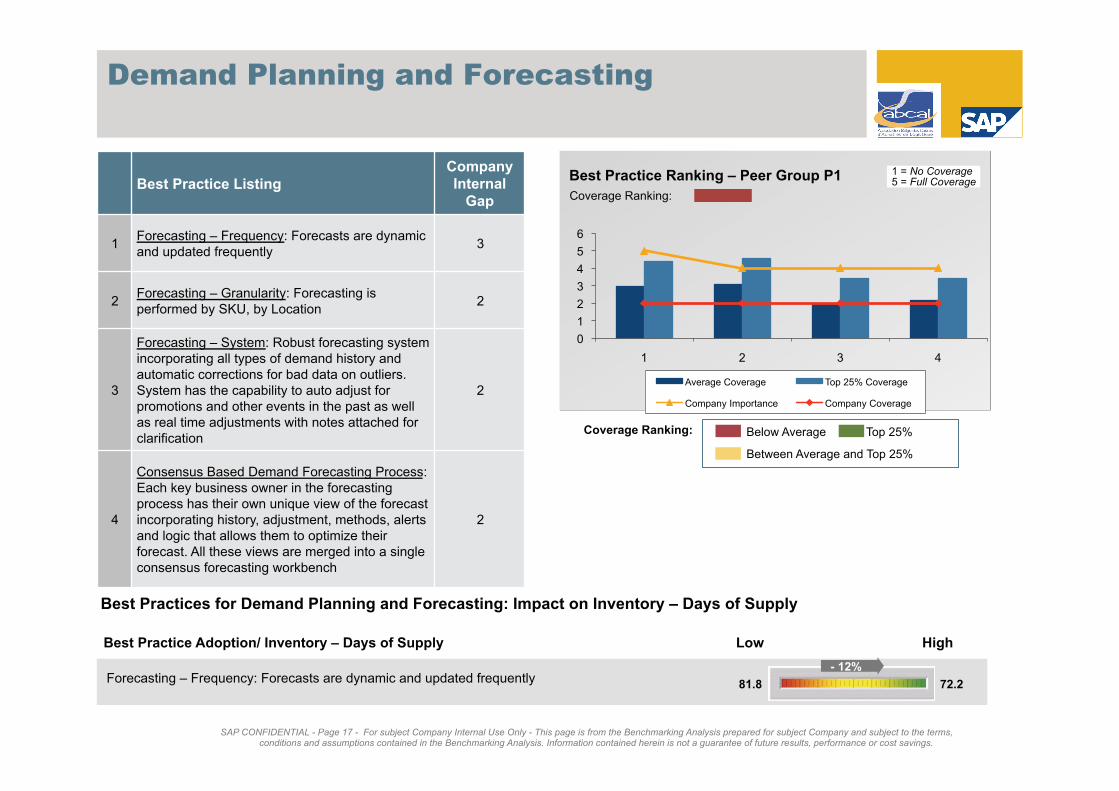
Demand Planning and Forecasting
Best Practice Listing Company Internal
Gap
1 Forecasting – Frequency: Forecasts are dynamic
and updated frequently 3
2 Forecasting – Granularity: Forecasting is
performed by SKU, by Location 2
3
Forecasting – System: Robust forecasting system
incorporating all types of demand history and
automatic corrections for bad data on outliers.
System has the capability to auto adjust for
promotions and other events in the past as well
as real time adjustments with notes attached for
clarification
2
4
Consensus Based Demand Forecasting Process:
Each key business owner in the forecasting
process has their own unique view of the forecast
incorporating history, adjustment, methods, alerts
and logic that allows them to optimize their
forecast. All these views are merged into a single
consensus forecasting workbench
2
0
1
2
3
4
5
6
1 2 3 4
Average Coverage Top 25% Coverage
Company Importance Company Coverage
Best Practice Ranking – Peer Group P1 1 = No Coverage 5 = Full Coverage
Coverage Ranking:
Best Practices for Demand Planning and Forecasting: Impact on Inventory – Days of Supply
Best Practice Adoption/ Inventory – Days of Supply
Forecasting – Frequency: Forecasts are dynamic and updated frequently 72.2 81.8
- 12%
Low High
Top 25%
Between Average and Top 25%
Below Average Coverage Ranking:
SAP CONFIDENTIAL - Page 18 - For subject Company Internal Use Only - This page is from the Benchmarking Analysis prepared for subject Company and subject to the terms, conditions and assumptions contained in the Benchmarking Analysis. Information contained herein is not a guarantee of future results, performance or cost savings.
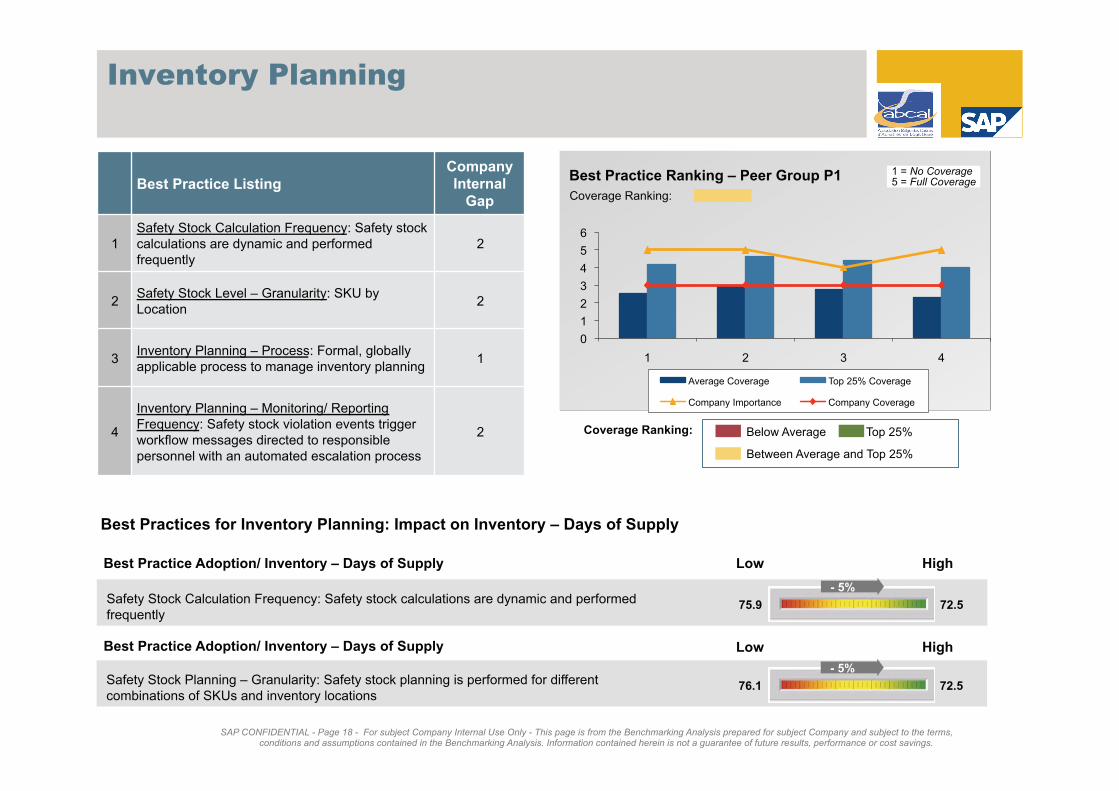
Inventory Planning
Best Practice Listing Company Internal
Gap
1
Safety Stock Calculation Frequency: Safety stock
calculations are dynamic and performed
frequently
2
2 Safety Stock Level – Granularity: SKU by
Location 2
3 Inventory Planning – Process: Formal, globally
applicable process to manage inventory planning 1
4
Inventory Planning – Monitoring/ Reporting
Frequency: Safety stock violation events trigger
workflow messages directed to responsible
personnel with an automated escalation process
2
0
1
2
3
4
5
6
1 2 3 4
Average Coverage Top 25% Coverage
Company Importance Company Coverage
Best Practice Ranking – Peer Group P1 1 = No Coverage 5 = Full Coverage
Coverage Ranking:
Best Practices for Inventory Planning: Impact on Inventory – Days of Supply
Best Practice Adoption/ Inventory – Days of Supply
Safety Stock Calculation Frequency: Safety stock calculations are dynamic and performed
frequently 72.5 75.9
- 5%
Low High
Safety Stock Planning – Granularity: Safety stock planning is performed for different
combinations of SKUs and inventory locations 72.5 76.1
- 5%
Best Practice Adoption/ Inventory – Days of Supply Low High
Top 25%
Between Average and Top 25%
Below Average Coverage Ranking:

SAP CONFIDENTIAL - Page 19 - For subject Company Internal Use Only - This page is from the Benchmarking Analysis prepared for subject Company and subject to the terms, conditions and assumptions contained in the Benchmarking Analysis. Information contained herein is not a guarantee of future results, performance or cost savings.
Supply Planning
Best Practice Listing Company Internal
Gap
1
Globally Integrated Process: Formal, globally
applicable constraint based supply planning
process performed at a regular interval
2
2
What-if Modeling: What-if modeling capability and
ability to evaluate multiple scenarios based on
multiple changing parameters
2
3
Alert Based Exception Messaging: Event
triggered, rules-based supply chain planning
process with workflow and alert messaging to
proactively influence planning events and/ or
approvals
2
0
1
2
3
4
5
6
1 2 3
Average Coverage Top 25% Coverage
Company Importance Company Coverage
Best Practice Ranking – Peer Group P1 1 = No Coverage 5 = Full Coverage
Coverage Ranking:
Best Practices for Supply Planning: Impact on Order Fulfillment Lead Time
Best Practice Adoption/ Order Fulfillment Lead Time – Make To Order (MTO) (in days)
What-if Modeling: What-if modeling capability and ability to evaluate multiple scenarios based on
multiple changing parameters 36.9 41.7
- 11%
Low High
Alert Based Exception Messaging: Event triggered, rules-based supply chain planning process
with workflow and alert messaging to proactively influence planning events and/ or approvals 7.0 9.9
- 29%
Best Practice Adoption/ Order Fulfillment Lead Time – Make To Stock (MTS) (in days) Low High
Top 25%
Between Average and Top 25%
Below Average Coverage Ranking:
SAP CONFIDENTIAL - Page 20 - For subject Company Internal Use Only - This page is from the Benchmarking Analysis prepared for subject Company and subject to the terms, conditions and assumptions contained in the Benchmarking Analysis. Information contained herein is not a guarantee of future results, performance or cost savings.
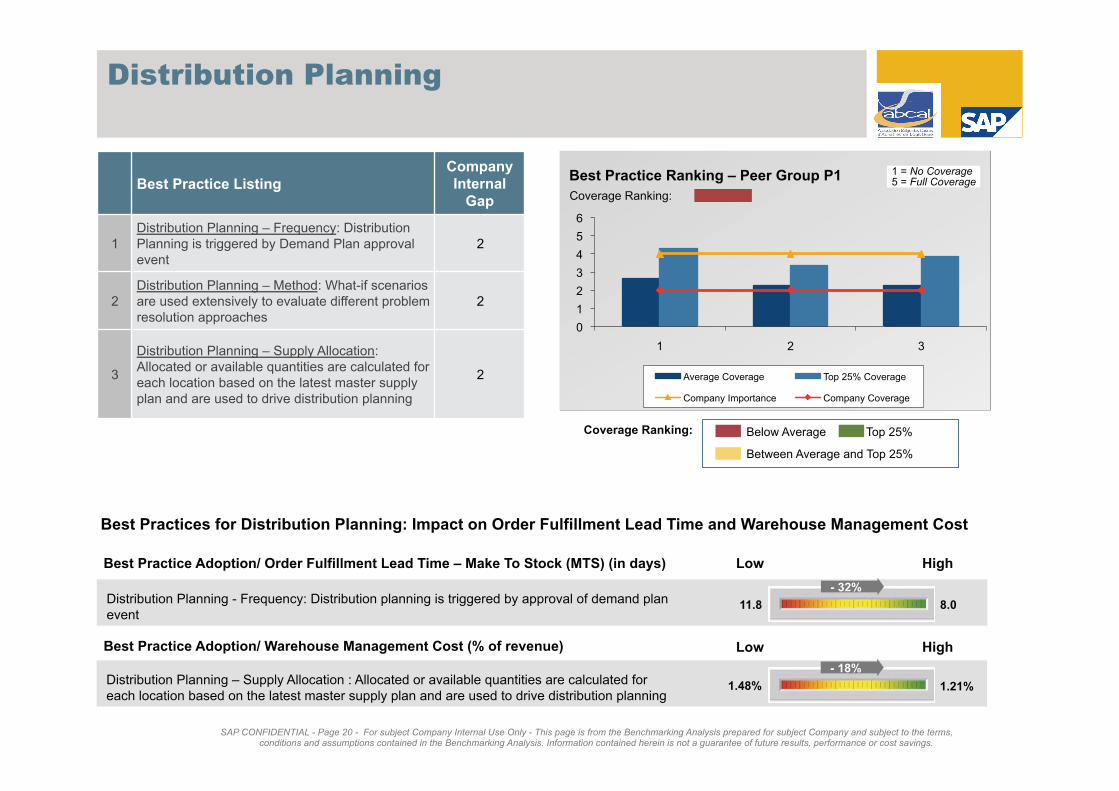
Distribution Planning
Best Practice Listing Company Internal
Gap
1
Distribution Planning – Frequency: Distribution
Planning is triggered by Demand Plan approval
event
2
2
Distribution Planning – Method: What-if scenarios
are used extensively to evaluate different problem
resolution approaches
2
3
Distribution Planning – Supply Allocation:
Allocated or available quantities are calculated for
each location based on the latest master supply
plan and are used to drive distribution planning
2
0
1
2
3
4
5
6
1 2 3
Average Coverage Top 25% Coverage
Company Importance Company Coverage
Best Practice Ranking – Peer Group P1 1 = No Coverage 5 = Full Coverage
Coverage Ranking:
Best Practices for Distribution Planning: Impact on Order Fulfillment Lead Time and Warehouse Management Cost
Best Practice Adoption/ Order Fulfillment Lead Time – Make To Stock (MTS) (in days)
Distribution Planning - Frequency: Distribution planning is triggered by approval of demand plan
event 8.0 11.8
- 32%
Low High
Distribution Planning – Supply Allocation : Allocated or available quantities are calculated for
each location based on the latest master supply plan and are used to drive distribution planning 1.21% 1.48%
- 18%
Best Practice Adoption/ Warehouse Management Cost (% of revenue) Low High
Top 25%
Between Average and Top 25%
Below Average Coverage Ranking:

SAP CONFIDENTIAL - Page 21 - For subject Company Internal Use Only - This page is from the Benchmarking Analysis prepared for subject Company and subject to the terms, conditions and assumptions contained in the Benchmarking Analysis. Information contained herein is not a guarantee of future results, performance or cost savings.
Customer (demand) Collaboration/ VMI
Best Practice Listing Company Internal
Gap
1
VMI – Data Integration/Communication:
Customer data captured directly from an external
feed (EDI)
1
2
Collaborative Forecasting Process: The
forecasting process is highly collaborative and is
used by customer teams with all key customers.
Statistical techniques can produce monthly, daily,
sub daily replenishment demands
1
3
Replenishment Planning: VMI customers are
tightly integrated into a highly automated daily/
weekly/monthly set of planning and execution
processes. Sense and respond processes and
tools are in place to react to real time demand
signals allowing for rapid replenishment re-
planning
1
0
1
2
3
4
5
6
1 2 3
Average Coverage Top 25% Coverage
Company Importance Company Coverage
Best Practice Ranking – Peer Group P1 1 = No Coverage 5 = Full Coverage
Coverage Ranking:
Best Practices for Customer (demand) Collaboration/ VMI: Impact on Forecast Accuracy and Inventory – Days of Supply
Best Practice Adoption/ Forecast Accuracy
Collaborative Forecasting Process: The forecasting process is highly collaborative and is used
by customer teams with all key customers. Statistical techniques can produce monthly, daily, sub
daily replenishment demands
84.6% 78.2%
+ 8%
Low High
Collaborative Forecasting Process: The forecasting process is highly collaborative and is used
by customer teams with all key customers. Statistical techniques can produce monthly, daily, sub
daily replenishment demands
60.9 76.2
- 20%
Best Practice Adoption/ Inventory – Days of Supply Low High
Top 25%
Between Average and Top 25%
Below Average Coverage Ranking:
SAP CONFIDENTIAL - Page 22 - For subject Company Internal Use Only - This page is from the Benchmarking Analysis prepared for subject Company and subject to the terms, conditions and assumptions contained in the Benchmarking Analysis. Information contained herein is not a guarantee of future results, performance or cost savings.
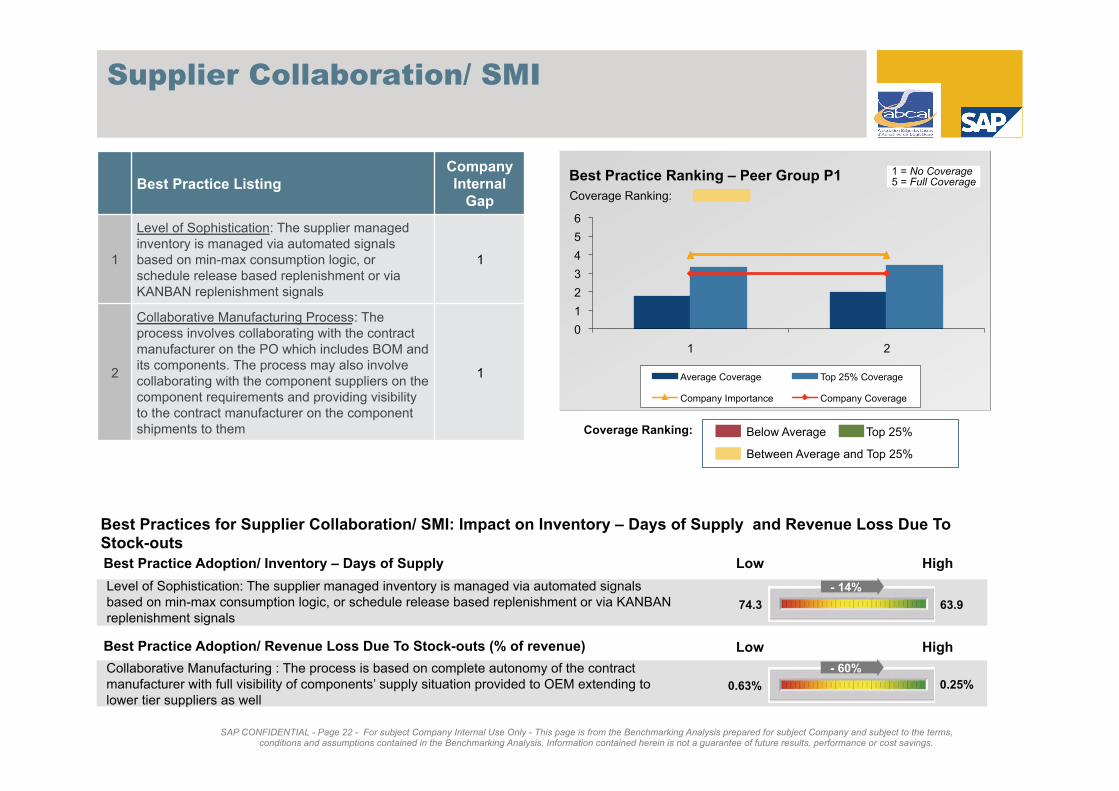
Supplier Collaboration/ SMI
Best Practice Listing Company Internal
Gap
1
Level of Sophistication: The supplier managed
inventory is managed via automated signals
based on min-max consumption logic, or
schedule release based replenishment or via
KANBAN replenishment signals
1
2
Collaborative Manufacturing Process: The
process involves collaborating with the contract
manufacturer on the PO which includes BOM and
its components. The process may also involve
collaborating with the component suppliers on the
component requirements and providing visibility
to the contract manufacturer on the component
shipments to them
1
0
1
2
3
4
5
6
1 2
Average Coverage Top 25% Coverage
Company Importance Company Coverage
Best Practice Ranking – Peer Group P1 1 = No Coverage 5 = Full Coverage
Coverage Ranking:
Best Practices for Supplier Collaboration/ SMI: Impact on Inventory – Days of Supply and Revenue Loss Due To Stock-outs
Best Practice Adoption/ Inventory – Days of Supply
Level of Sophistication: The supplier managed inventory is managed via automated signals
based on min-max consumption logic, or schedule release based replenishment or via KANBAN
replenishment signals 63.9 74.3
- 14%
Low High
Collaborative Manufacturing : The process is based on complete autonomy of the contract
manufacturer with full visibility of components’ supply situation provided to OEM extending to
lower tier suppliers as well
0.25% 0.63%
- 60%
Best Practice Adoption/ Revenue Loss Due To Stock-outs (% of revenue) Low High
Top 25%
Between Average and Top 25%
Below Average Coverage Ranking:
SAP CONFIDENTIAL - Page 23 - For subject Company Internal Use Only - This page is from the Benchmarking Analysis prepared for subject Company and subject to the terms, conditions and assumptions contained in the Benchmarking Analysis. Information contained herein is not a guarantee of future results, performance or cost savings.
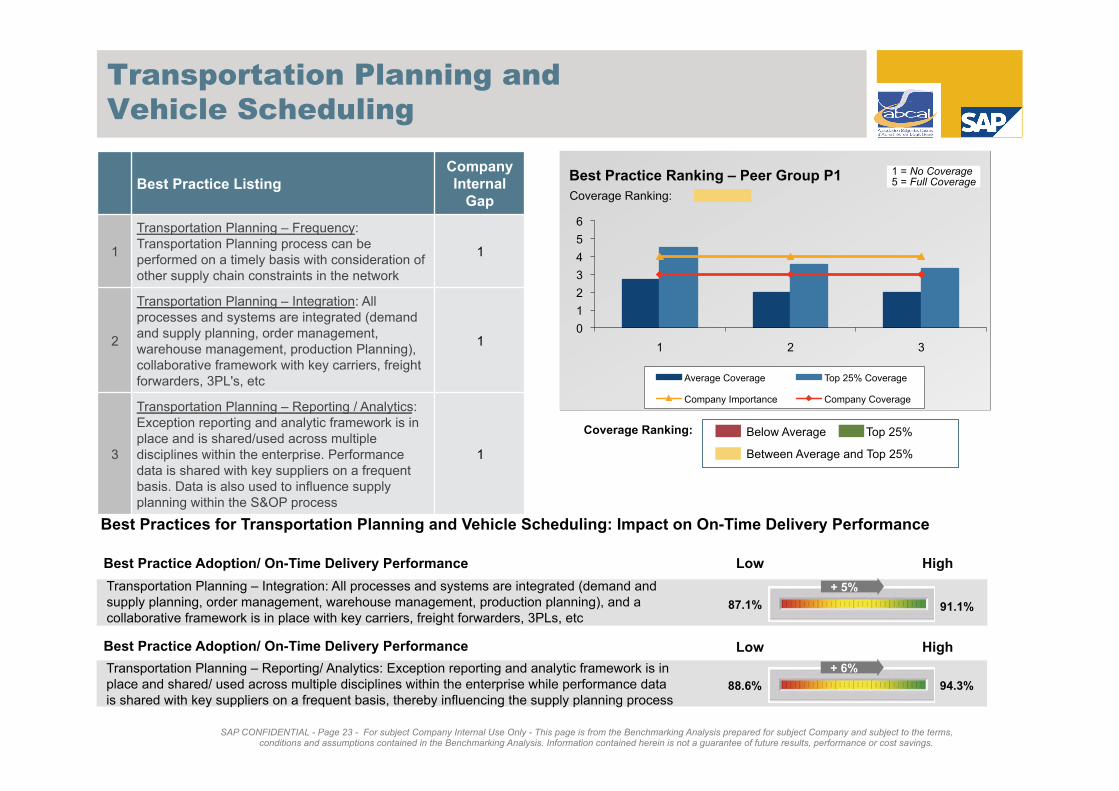
Transportation Planning and
Vehicle Scheduling
Best Practice Listing Company Internal
Gap
1
Transportation Planning – Frequency:
Transportation Planning process can be
performed on a timely basis with consideration of
other supply chain constraints in the network
1
2
Transportation Planning – Integration: All
processes and systems are integrated (demand
and supply planning, order management,
warehouse management, production Planning),
collaborative framework with key carriers, freight
forwarders, 3PL's, etc
1
3
Transportation Planning – Reporting / Analytics:
Exception reporting and analytic framework is in
place and is shared/used across multiple
disciplines within the enterprise. Performance
data is shared with key suppliers on a frequent
basis. Data is also used to influence supply
planning within the S&OP process
1
0
1
2
3
4
5
6
1 2 3
Average Coverage Top 25% Coverage
Company Importance Company Coverage
Best Practice Ranking – Peer Group P1 1 = No Coverage 5 = Full Coverage
Coverage Ranking:
Best Practices for Transportation Planning and Vehicle Scheduling: Impact on On-Time Delivery Performance
Best Practice Adoption/ On-Time Delivery Performance
Transportation Planning – Integration: All processes and systems are integrated (demand and
supply planning, order management, warehouse management, production planning), and a
collaborative framework is in place with key carriers, freight forwarders, 3PLs, etc 91.1% 87.1%
+ 5%
Low High
Transportation Planning – Reporting/ Analytics: Exception reporting and analytic framework is in
place and shared/ used across multiple disciplines within the enterprise while performance data
is shared with key suppliers on a frequent basis, thereby influencing the supply planning process 94.3% 88.6%
+ 6%
Best Practice Adoption/ On-Time Delivery Performance Low High
Top 25%
Between Average and Top 25%
Below Average Coverage Ranking:
SAP CONFIDENTIAL - Page 24 - For subject Company Internal Use Only - This page is from the Benchmarking Analysis prepared for subject Company and subject to the terms, conditions and assumptions contained in the Benchmarking Analysis. Information contained herein is not a guarantee of future results, performance or cost savings.
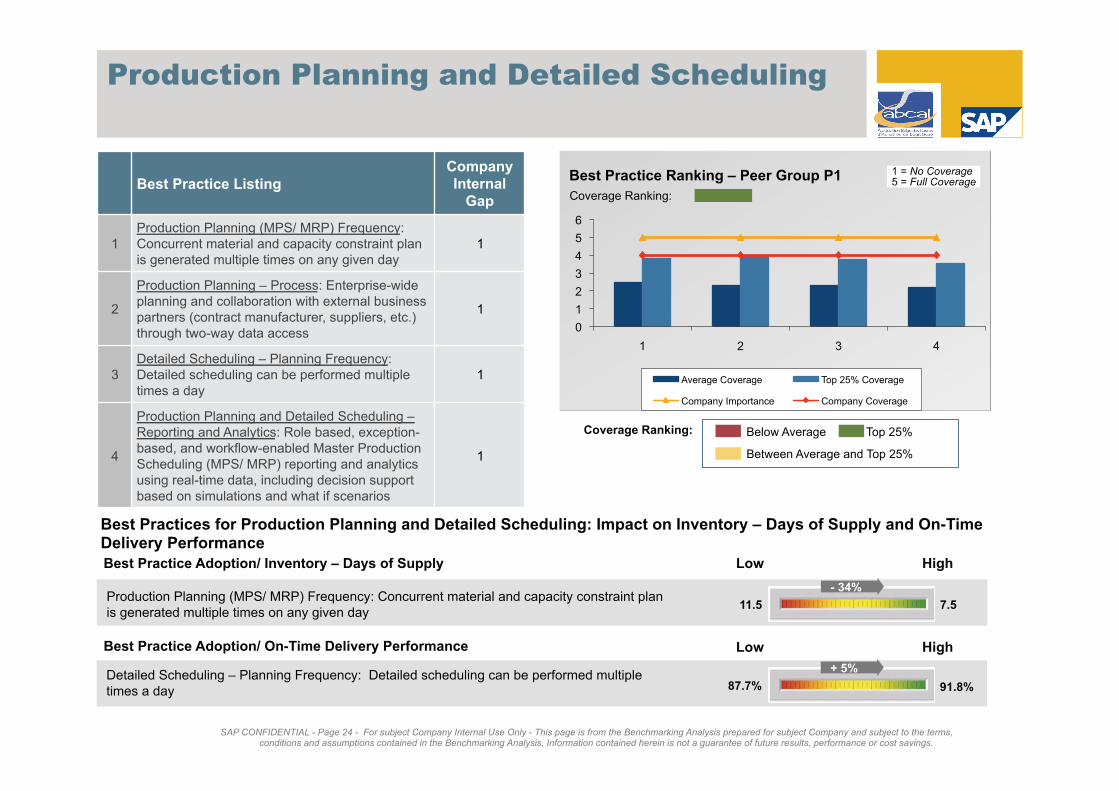
Production Planning and Detailed Scheduling
Best Practice Listing Company Internal
Gap
1
Production Planning (MPS/ MRP) Frequency:
Concurrent material and capacity constraint plan
is generated multiple times on any given day
1
2
Production Planning – Process: Enterprise-wide
planning and collaboration with external business
partners (contract manufacturer, suppliers, etc.)
through two-way data access
1
3
Detailed Scheduling – Planning Frequency:
Detailed scheduling can be performed multiple
times a day
1
4
Production Planning and Detailed Scheduling –
Reporting and Analytics: Role based, exception-
based, and workflow-enabled Master Production
Scheduling (MPS/ MRP) reporting and analytics
using real-time data, including decision support
based on simulations and what if scenarios
1
0
1
2
3
4
5
6
1 2 3 4
Average Coverage Top 25% Coverage
Company Importance Company Coverage
Best Practice Ranking – Peer Group P1 1 = No Coverage 5 = Full Coverage
Coverage Ranking:
Best Practices for Production Planning and Detailed Scheduling: Impact on Inventory – Days of Supply and On-Time Delivery Performance
Best Practice Adoption/ Inventory – Days of Supply
Production Planning (MPS/ MRP) Frequency: Concurrent material and capacity constraint plan
is generated multiple times on any given day 7.5 11.5
- 34%
Low High
Detailed Scheduling – Planning Frequency: Detailed scheduling can be performed multiple
times a day 91.8% 87.7%
+ 5%
Best Practice Adoption/ On-Time Delivery Performance Low High
Top 25%
Between Average and Top 25%
Below Average Coverage Ranking:

SAP CONFIDENTIAL - Page 25 - For subject Company Internal Use Only - This page is from the Benchmarking Analysis prepared for subject Company and subject to the terms, conditions and assumptions contained in the Benchmarking Analysis. Information contained herein is not a guarantee of future results, performance or cost savings.
Order Promising
Best Practice Listing Company Internal
Gap
1
Extended Capable-to-Promise (CTP): Dynamic
sourcing that includes not only inventory and
production locations but also the ability to
integrate key trading partners such as suppliers,
contract manufacturers or assemblers, and
logistics and transportation service providers to
confirm availability, pricing, and delivery
commitment
2
2
Available-to-Promise – Allocations: When product
is in limited quantity, able to prioritize customers,
commit an allocation quantity and then honor that
commitment as the product becomes available
2
0
1
2
3
4
5
6
1 2
Average Coverage Top 25% Coverage
Company Importance Company Coverage
Best Practice Ranking – Peer Group P1 1 = No Coverage 5 = Full Coverage
Coverage Ranking:
Best Practices for Order Promising: Impact on On-Time Delivery Performance and Order Fulfillment Lead Time
Best Practice Adoption/ Order Fulfillment Lead Time – Make to Order (MTO) (in days)
) Extended Capable-to-Promise (CTP): Dynamic sourcing that includes not only inventory and
production locations but also the ability to integrate key trading partners such as suppliers,
contract manufacturers or assemblers, and logistics and transportation service providers to
confirm availability, pricing, and delivery commitment
31.3 44.1
- 29%
Low High
Available-to-Promise – Allocations: When product is in limited quantity, able to prioritize
customers, commit an allocation quantity and then honor that commitment as the product
becomes available 12.5 16.8
- 25%
Best Practice Adoption/ Order Fulfillment Lead Time – Configure to Order (CTO) (in days) Low High
Best Practice Adoption/ On-Time Delivery Performance
Extended Capable-to-Promise (CTP): Dynamic sourcing that includes not only inventory and
production locations but also the ability to integrate key trading partners such as suppliers,
contract manufacturers or assemblers, and logistics and transportation service providers to
confirm availability, pricing, and delivery commitment 90.2% 87.7%
+ 3%
Low High
Top 25%
Between Average and Top 25%
Below Average Coverage Ranking:
SAP CONFIDENTIAL - Page 26 - For subject Company Internal Use Only - This page is from the Benchmarking Analysis prepared for subject Company and subject to the terms, conditions and assumptions contained in the Benchmarking Analysis. Information contained herein is not a guarantee of future results, performance or cost savings.
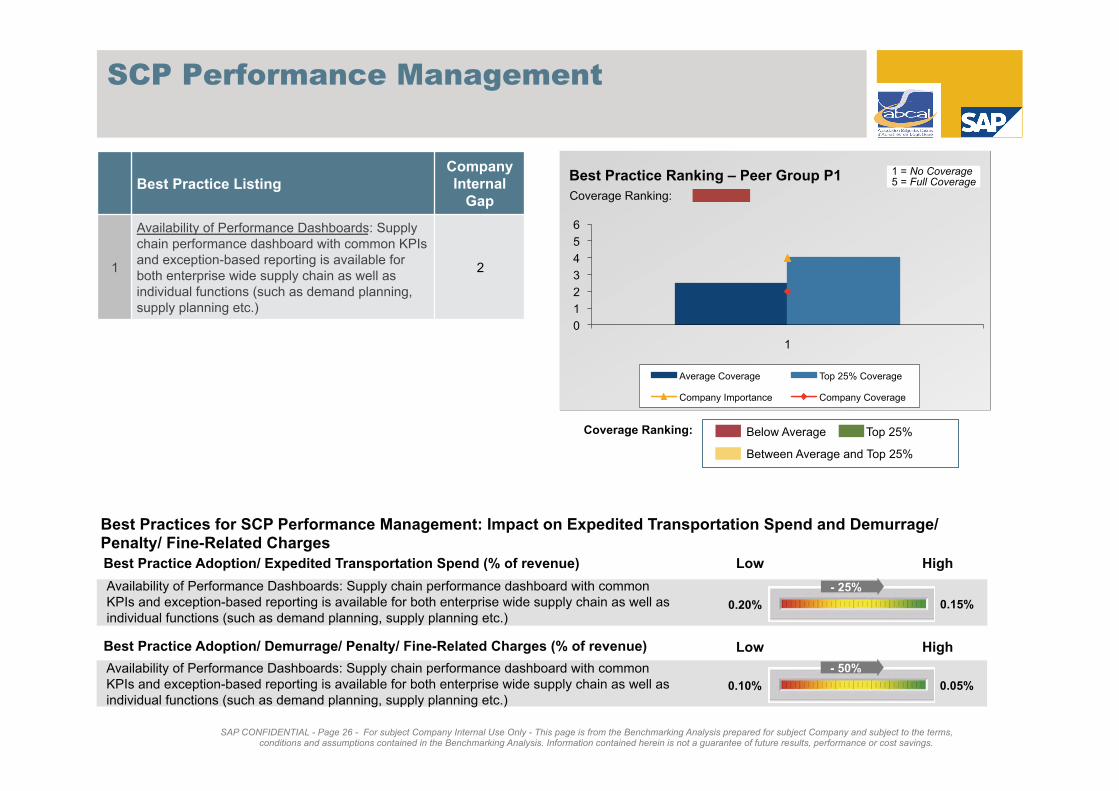
SCP Performance Management
Best Practice Listing Company Internal
Gap
1
Availability of Performance Dashboards: Supply
chain performance dashboard with common KPIs
and exception-based reporting is available for
both enterprise wide supply chain as well as
individual functions (such as demand planning,
supply planning etc.)
2
0
1
2
3
4
5
6
1
Average Coverage Top 25% Coverage
Company Importance Company Coverage
Best Practice Ranking – Peer Group P1 1 = No Coverage 5 = Full Coverage
Coverage Ranking:
Best Practices for SCP Performance Management: Impact on Expedited Transportation Spend and Demurrage/ Penalty/ Fine-Related Charges
Best Practice Adoption/ Expedited Transportation Spend (% of revenue)
Availability of Performance Dashboards: Supply chain performance dashboard with common
KPIs and exception-based reporting is available for both enterprise wide supply chain as well as
individual functions (such as demand planning, supply planning etc.) 0.15% 0.20%
- 25%
Low High
Availability of Performance Dashboards: Supply chain performance dashboard with common
KPIs and exception-based reporting is available for both enterprise wide supply chain as well as
individual functions (such as demand planning, supply planning etc.) 0.05% 0.10%
- 50%
Best Practice Adoption/ Demurrage/ Penalty/ Fine-Related Charges (% of revenue) Low High
Top 25%
Between Average and Top 25%
Below Average Coverage Ranking:

SAP CONFIDENTIAL - Page 27 - For subject Company Internal Use Only - This page is from the Benchmarking Analysis prepared for subject Company and subject to the terms, conditions and assumptions contained in the Benchmarking Analysis. Information contained herein is not a guarantee of future results, performance or cost savings.
Agenda
1. Executive Summary
2. Detailed Benchmarking Results
3. Case Studies
4. Appendix
SAP CONFIDENTIAL - Page 28 - For subject Company Internal Use Only - This page is from the Benchmarking Analysis prepared for subject Company and subject to the terms, conditions and assumptions contained in the Benchmarking Analysis. Information contained herein is not a guarantee of future results, performance or cost savings.
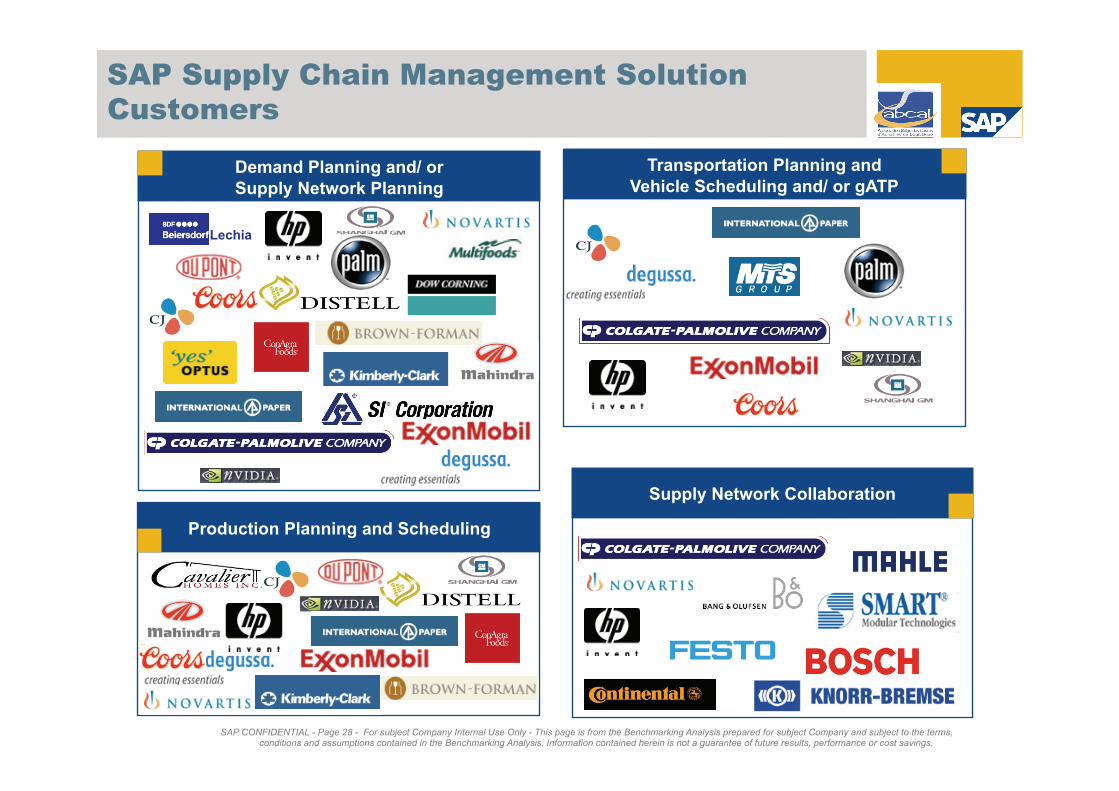
SAP Supply Chain Management Solution
Customers
Demand Planning and/ or
Supply Network Planning
Production Planning and Scheduling
Supply Network Collaboration
Lechia
Transportation Planning and
Vehicle Scheduling and/ or gATP
SAP CONFIDENTIAL - Page 29 - For subject Company Internal Use Only - This page is from the Benchmarking Analysis prepared for subject Company and subject to the terms, conditions and assumptions contained in the Benchmarking Analysis. Information contained herein is not a guarantee of future results, performance or cost savings.
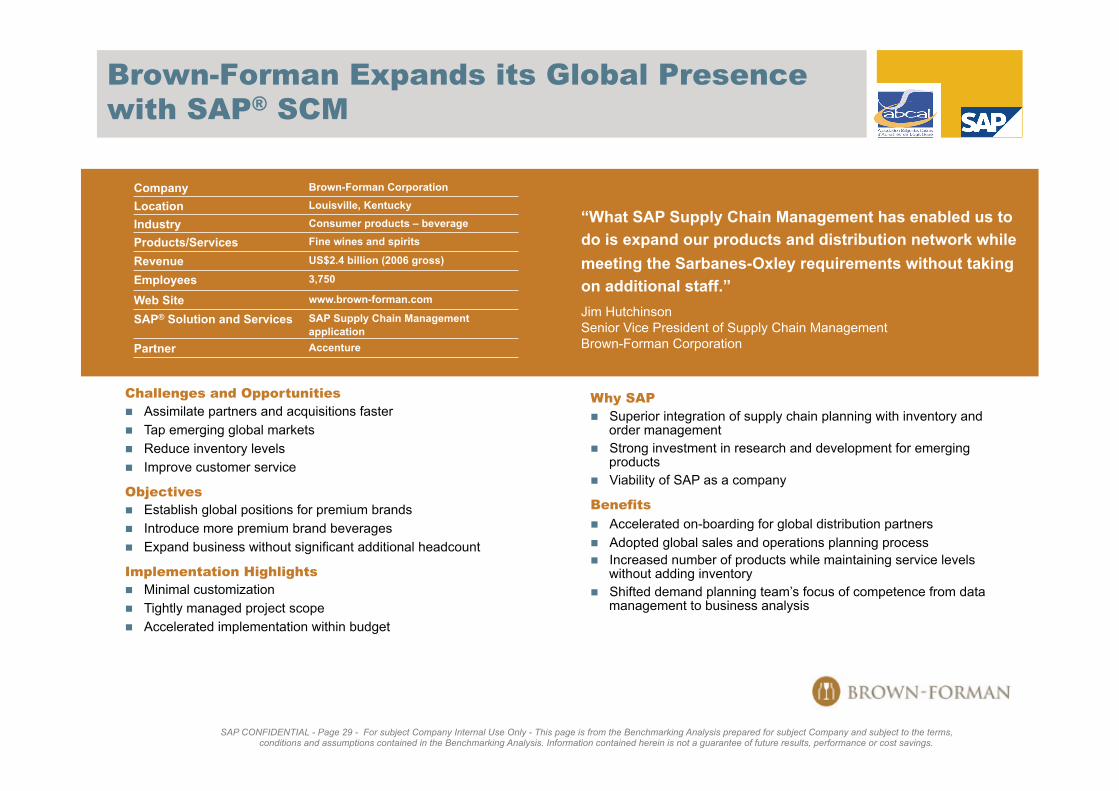
“What SAP Supply Chain Management has enabled us to
do is expand our products and distribution network while
meeting the Sarbanes-Oxley requirements without taking
on additional staff.”
Jim Hutchinson
Senior Vice President of Supply Chain Management
Brown-Forman Corporation
Company Brown-Forman Corporation
Location Louisville, Kentucky
Industry Consumer products – beverage
Products/Services Fine wines and spirits
Revenue US$2.4 billion (2006 gross)
Employees 3,750
Web Site www.brown-forman.com
SAP® Solution and Services SAP Supply Chain Management
application
Partner Accenture
Challenges and Opportunities
Assimilate partners and acquisitions faster
Tap emerging global markets
Reduce inventory levels
Improve customer service
Objectives
Establish global positions for premium brands
Introduce more premium brand beverages
Expand business without significant additional headcount
Implementation Highlights
Minimal customization
Tightly managed project scope
Accelerated implementation within budget
Why SAP
Superior integration of supply chain planning with inventory and order management
Strong investment in research and development for emerging products
Viability of SAP as a company
Benefits
Accelerated on-boarding for global distribution partners
Adopted global sales and operations planning process
Increased number of products while maintaining service levels without adding inventory
Shifted demand planning team’s focus of competence from data management to business analysis
Brown-Forman Expands its Global Presence
with SAP® SCM
SAP CONFIDENTIAL - Page 30 - For subject Company Internal Use Only - This page is from the Benchmarking Analysis prepared for subject Company and subject to the terms, conditions and assumptions contained in the Benchmarking Analysis. Information contained herein is not a guarantee of future results, performance or cost savings.
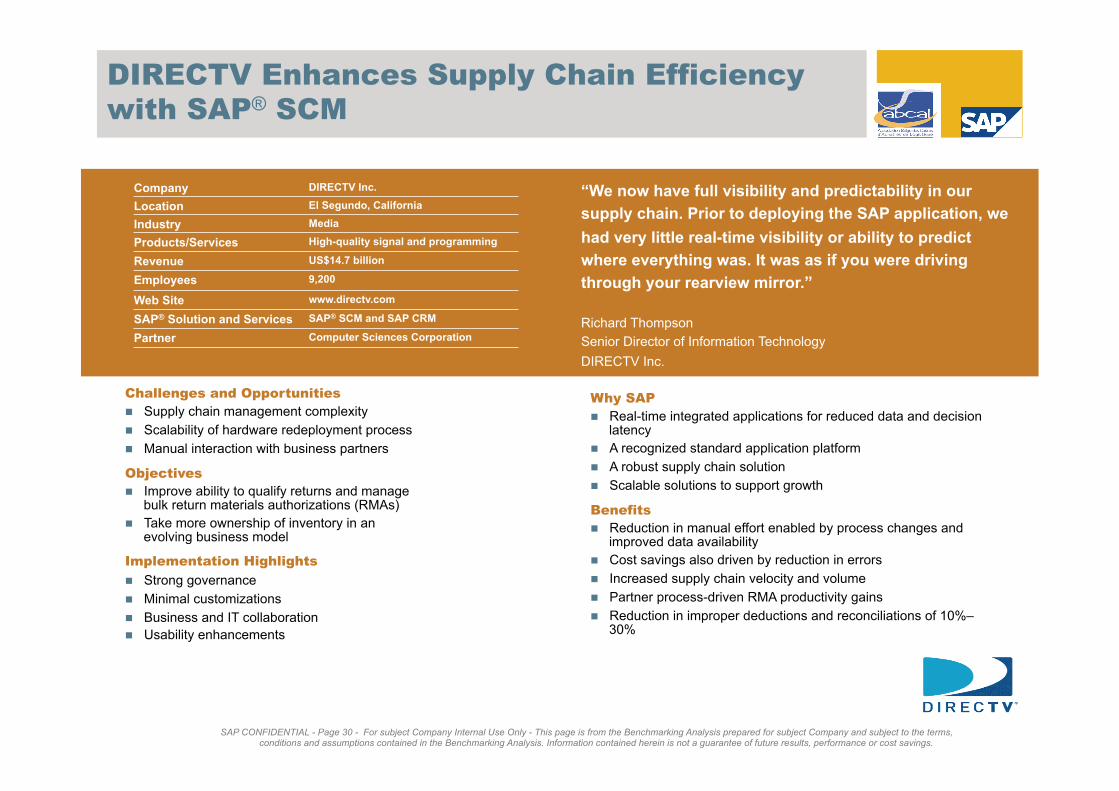
“We now have full visibility and predictability in our
supply chain. Prior to deploying the SAP application, we
had very little real-time visibility or ability to predict
where everything was. It was as if you were driving
through your rearview mirror.”
Richard Thompson
Senior Director of Information Technology
DIRECTV Inc.
Company DIRECTV Inc.
Location El Segundo, California
Industry Media
Products/Services High-quality signal and programming
Revenue US$14.7 billion
Employees 9,200
Web Site www.directv.com
SAP® Solution and Services SAP® SCM and SAP CRM
Partner Computer Sciences Corporation
Challenges and Opportunities
Supply chain management complexity
Scalability of hardware redeployment process
Manual interaction with business partners
Objectives
Improve ability to qualify returns and manage bulk return materials authorizations (RMAs)
Take more ownership of inventory in an evolving business model
Implementation Highlights
Strong governance
Minimal customizations
Business and IT collaboration
Usability enhancements
Why SAP
Real-time integrated applications for reduced data and decision latency
A recognized standard application platform
A robust supply chain solution
Scalable solutions to support growth
Benefits
Reduction in manual effort enabled by process changes and improved data availability
Cost savings also driven by reduction in errors
Increased supply chain velocity and volume
Partner process-driven RMA productivity gains
Reduction in improper deductions and reconciliations of 10%–30%
DIRECTV Enhances Supply Chain Efficiency
with SAP® SCM
SAP CONFIDENTIAL - Page 31 - For subject Company Internal Use Only - This page is from the Benchmarking Analysis prepared for subject Company and subject to the terms, conditions and assumptions contained in the Benchmarking Analysis. Information contained herein is not a guarantee of future results, performance or cost savings.
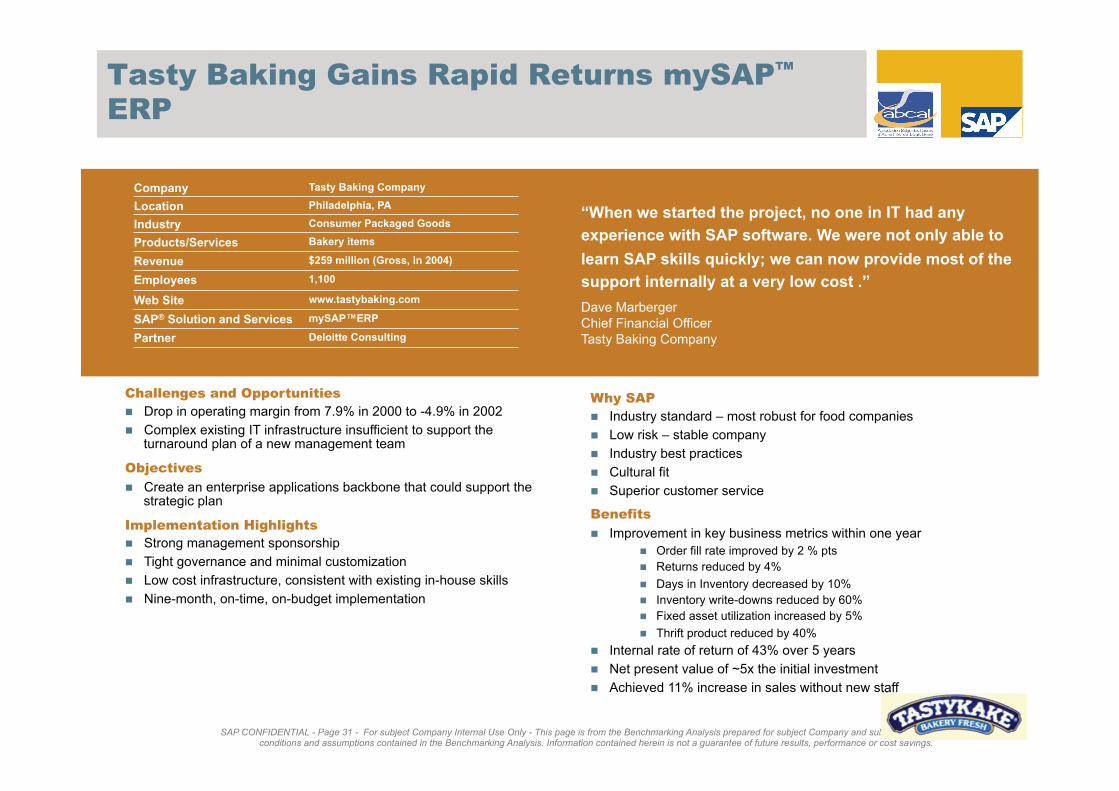
“When we started the project, no one in IT had any
experience with SAP software. We were not only able to
learn SAP skills quickly; we can now provide most of the
support internally at a very low cost .”
Dave Marberger
Chief Financial Officer
Tasty Baking Company
Company Tasty Baking Company
Location Philadelphia, PA
Industry Consumer Packaged Goods
Products/Services Bakery items
Revenue $259 million (Gross, in 2004)
Employees 1,100
Web Site www.tastybaking.com
SAP® Solution and Services mySAP™ERP
Partner Deloitte Consulting
Challenges and Opportunities
Drop in operating margin from 7.9% in 2000 to -4.9% in 2002
Complex existing IT infrastructure insufficient to support the turnaround plan of a new management team
Objectives
Create an enterprise applications backbone that could support the strategic plan
Implementation Highlights
Strong management sponsorship
Tight governance and minimal customization
Low cost infrastructure, consistent with existing in-house skills
Nine-month, on-time, on-budget implementation
Why SAP
Industry standard – most robust for food companies
Low risk – stable company
Industry best practices
Cultural fit
Superior customer service
Benefits
Improvement in key business metrics within one year
Order fill rate improved by 2 % pts
Returns reduced by 4%
Days in Inventory decreased by 10%
Inventory write-downs reduced by 60%
Fixed asset utilization increased by 5%
Thrift product reduced by 40%
Internal rate of return of 43% over 5 years
Net present value of ~5x the initial investment
Achieved 11% increase in sales without new staff
Tasty Baking Gains Rapid Returns mySAP™
ERP

SAP CONFIDENTIAL - Page 32 - For subject Company Internal Use Only - This page is from the Benchmarking Analysis prepared for subject Company and subject to the terms, conditions and assumptions contained in the Benchmarking Analysis. Information contained herein is not a guarantee of future results, performance or cost savings.
Agenda
1. Executive Summary
2. Detailed Benchmarking Results
3. Case Studies
4. Appendix

SAP CONFIDENTIAL - Page 33 - For subject Company Internal Use Only - This page is from the Benchmarking Analysis prepared for subject Company and subject to the terms, conditions and assumptions contained in the Benchmarking Analysis. Information contained herein is not a guarantee of future results, performance or cost savings.
Strategic Planning
Expertise Based/ Operational
Planning
Tactical Planning
Supply Chain Planning: Study Scope
The benchmarking study included analysis across 11 key Supply Chain Planning business processes
Sales and Operations Planning
Demand Planning and Forecasting
Inventory Planning
Supply Planning
Distribution Planning
Customer Collaboration (VMI)
Supplier Collaboration (SMI)
Transportation Planning and Vehicle Scheduling
Production Planning and Detailed Scheduling
Order Promising
SCP Performance Management
Drive
Efficiency
Drive
Effectiveness
SAP CONFIDENTIAL - Page 34 - For subject Company Internal Use Only - This page is from the Benchmarking Analysis prepared for subject Company and subject to the terms, conditions and assumptions contained in the Benchmarking Analysis. Information contained herein is not a guarantee of future results, performance or cost savings.
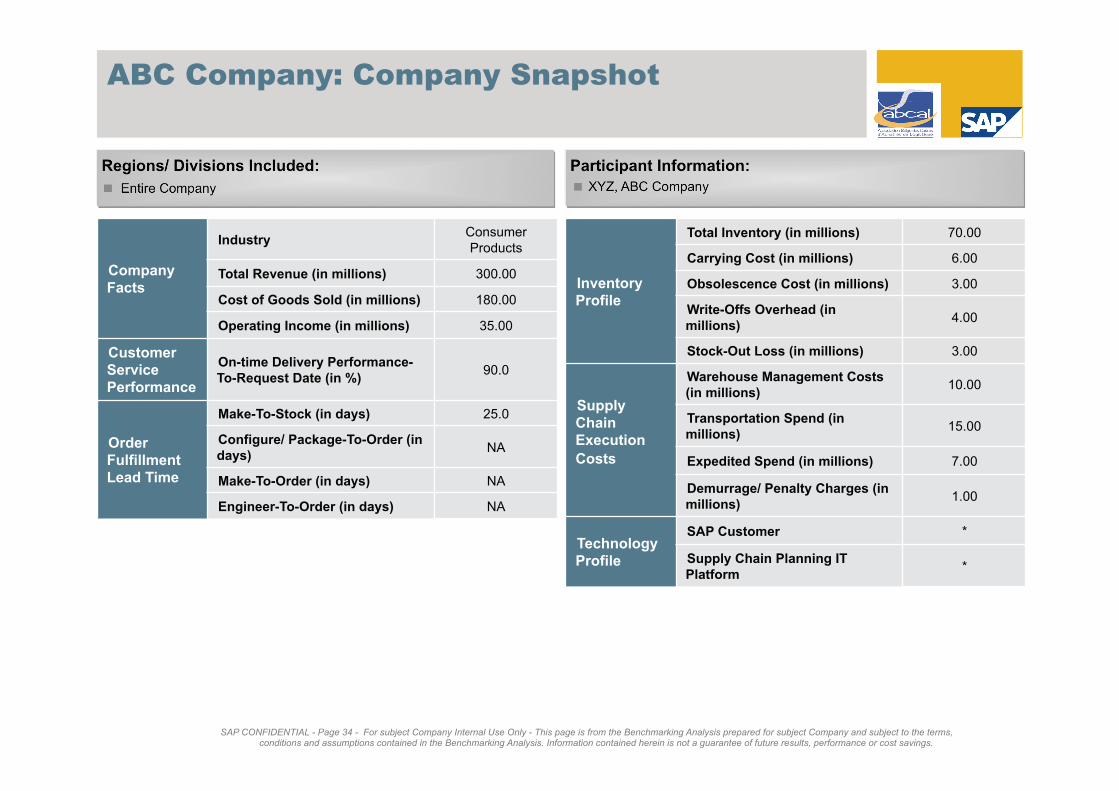
Participant Information: Regions/ Divisions Included:
ABC Company: Company Snapshot
Company Facts
Industry Consumer
Products
Total Revenue (in millions) 300.00
Cost of Goods Sold (in millions) 180.00
Operating Income (in millions) 35.00
Customer Service Performance
On-time Delivery Performance-To-Request Date (in %)
90.0
Order Fulfillment Lead Time
Make-To-Stock (in days) 25.0
Configure/ Package-To-Order (in days)
NA
Make-To-Order (in days) NA
Engineer-To-Order (in days) NA
Inventory Profile
Total Inventory (in millions) 70.00
Carrying Cost (in millions) 6.00
Obsolescence Cost (in millions) 3.00
Write-Offs Overhead (in millions)
4.00
Stock-Out Loss (in millions) 3.00
Supply Chain Execution
Costs
Warehouse Management Costs (in millions)
10.00
Transportation Spend (in millions)
15.00
Expedited Spend (in millions) 7.00
Demurrage/ Penalty Charges (in millions)
1.00
Technology Profile
SAP Customer *
Supply Chain Planning IT Platform
*
Entire Company XYZ, ABC Company
SAP CONFIDENTIAL - Page 35 - For subject Company Internal Use Only - This page is from the Benchmarking Analysis prepared for subject Company and subject to the terms, conditions and assumptions contained in the Benchmarking Analysis. Information contained herein is not a guarantee of future results, performance or cost savings.
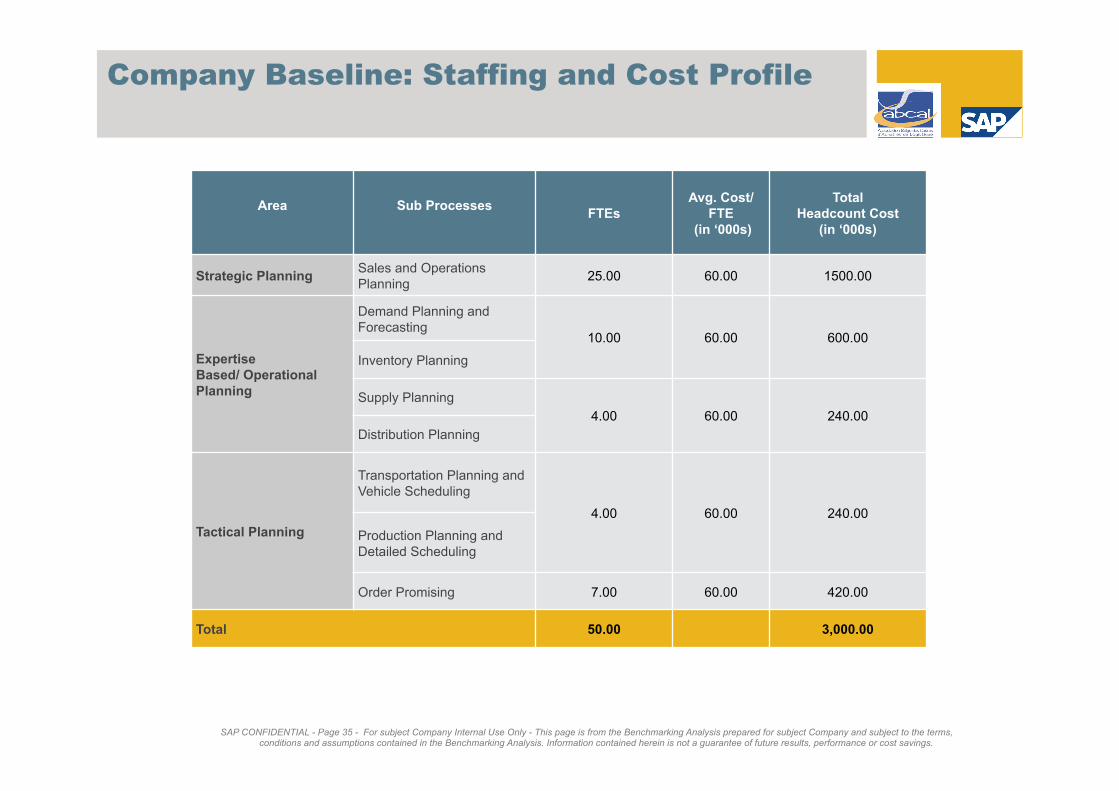
Company Baseline: Staffing and Cost Profile
Area Sub Processes FTEs
Avg. Cost/ FTE
(in ‘000s)
Total Headcount Cost
(in ‘000s)
Strategic Planning Sales and Operations
Planning 25.00 60.00 1500.00
Expertise Based/ Operational Planning
Demand Planning and
Forecasting 10.00 60.00 600.00
Inventory Planning
Supply Planning
4.00 60.00 240.00
Distribution Planning
Tactical Planning
Transportation Planning and
Vehicle Scheduling
4.00 60.00 240.00
Production Planning and
Detailed Scheduling
Order Promising 7.00 60.00 420.00
Total 50.00 3,000.00
SAP CONFIDENTIAL - Page 36 - For subject Company Internal Use Only - This page is from the Benchmarking Analysis prepared for subject Company and subject to the terms, conditions and assumptions contained in the Benchmarking Analysis. Information contained herein is not a guarantee of future results, performance or cost savings.
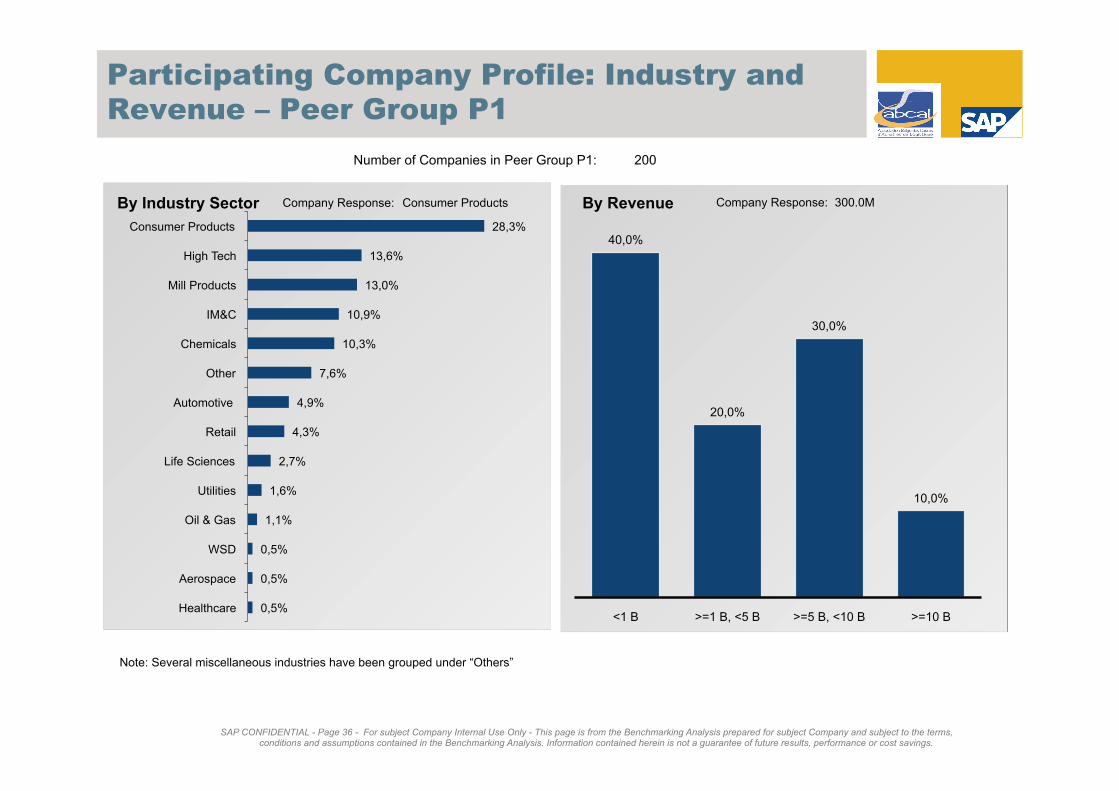
Participating Company Profile: Industry and
Revenue – Peer Group P1
By Revenue By Industry Sector Consumer Products 300.0M
0,5%
0,5%
0,5%
1,1%
1,6%
2,7%
4,3%
4,9%
7,6%
10,3%
10,9%
13,0%
13,6%
28,3%
Healthcare
Aerospace
WSD
Oil & Gas
Utilities
Life Sciences
Retail
Automotive
Other
Chemicals
IM&C
Mill Products
High Tech
Consumer Products 40,0%
20,0%
30,0%
10,0%
<1 B >=1 B, <5 B >=5 B, <10 B >=10 B
Number of Companies in Peer Group P1: 200
Company Response: Company Response:
Note: Several miscellaneous industries have been grouped under “Others”
SAP CONFIDENTIAL - Page 37 - For subject Company Internal Use Only - This page is from the Benchmarking Analysis prepared for subject Company and subject to the terms, conditions and assumptions contained in the Benchmarking Analysis. Information contained herein is not a guarantee of future results, performance or cost savings.
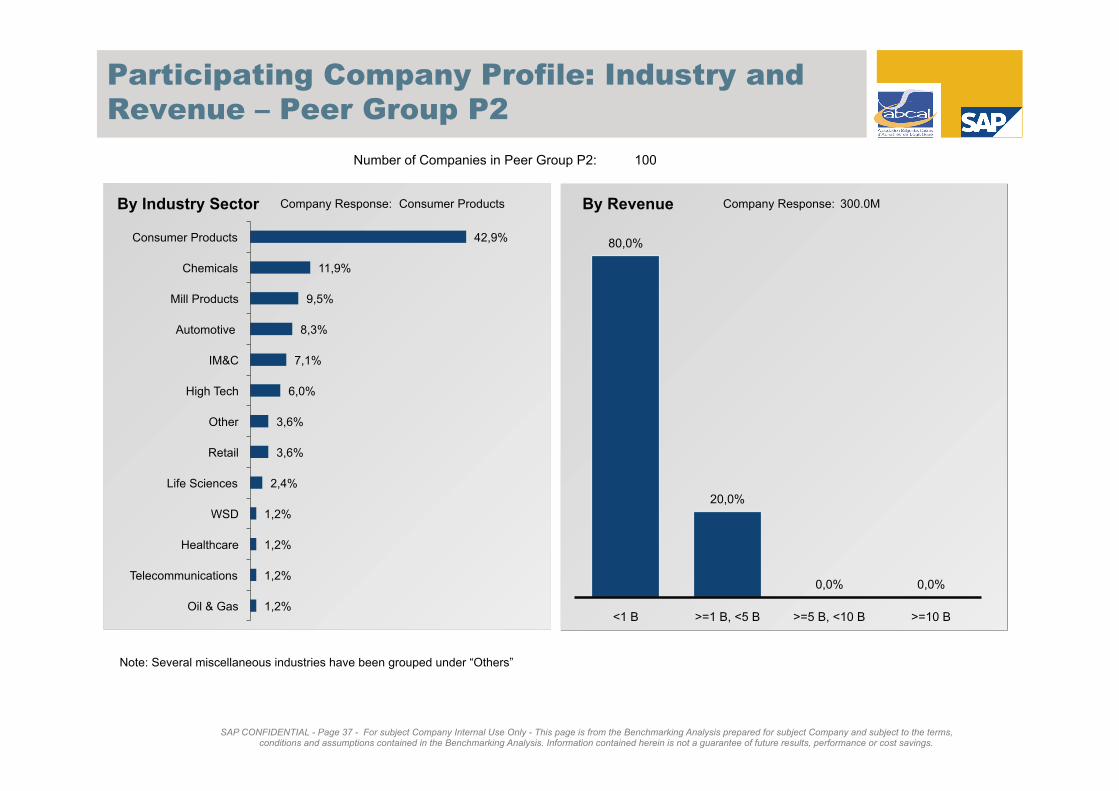
Participating Company Profile: Industry and
Revenue – Peer Group P2
By Revenue By Industry Sector Consumer Products 300.0M
1,2%
1,2%
1,2%
1,2%
2,4%
3,6%
3,6%
6,0%
7,1%
8,3%
9,5%
11,9%
42,9%
Oil & Gas
Telecommunications
Healthcare
WSD
Life Sciences
Retail
Other
High Tech
IM&C
Automotive
Mill Products
Chemicals
Consumer Products 80,0%
20,0%
0,0% 0,0%
<1 B >=1 B, <5 B >=5 B, <10 B >=10 B
Number of Companies in Peer Group P2: 100
Company Response: Company Response:
Note: Several miscellaneous industries have been grouped under “Others”
SAP CONFIDENTIAL - Page 38 - For subject Company Internal Use Only - This page is from the Benchmarking Analysis prepared for subject Company and subject to the terms, conditions and assumptions contained in the Benchmarking Analysis. Information contained herein is not a guarantee of future results, performance or cost savings.
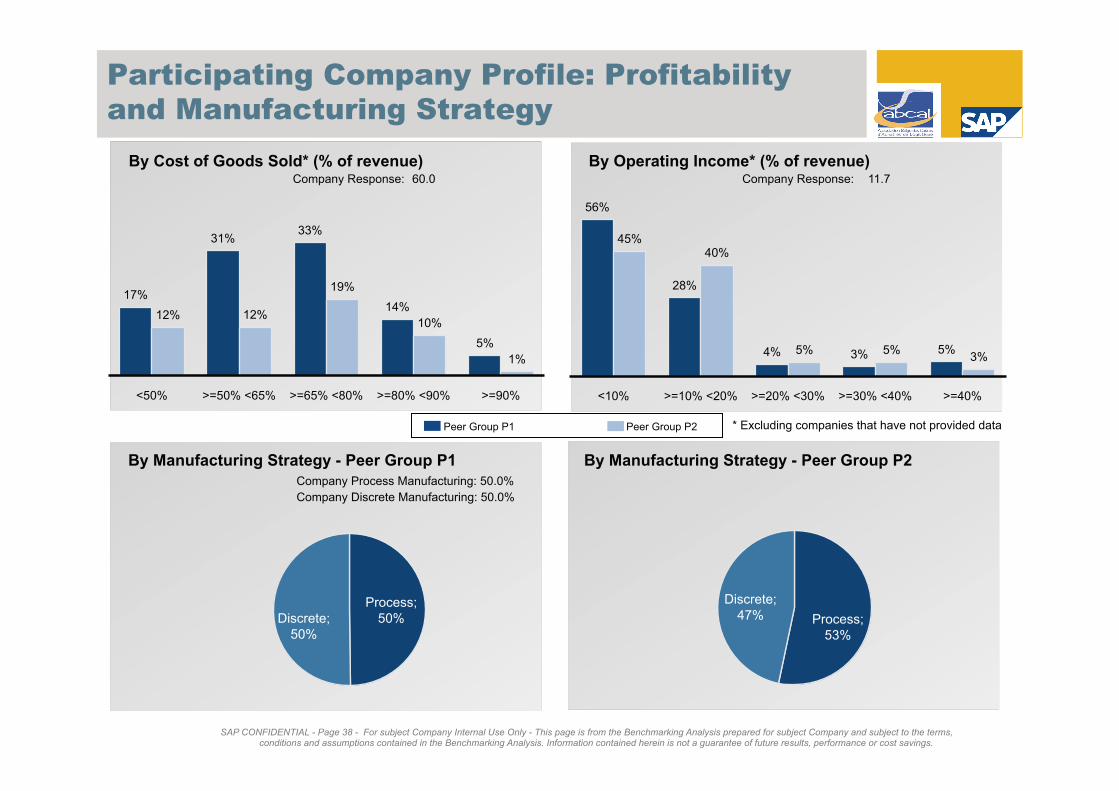
Participating Company Profile: Profitability
and Manufacturing Strategy
17%
31% 33%
14%
5%
12% 12%
19%
10%
1%
<50% >=50% <65% >=65% <80% >=80% <90% >=90%
56%
28%
4% 3% 5%
45% 40%
5% 5% 3%
<10% >=10% <20% >=20% <30% >=30% <40% >=40%
By Cost of Goods Sold* (% of revenue) By Operating Income* (% of revenue)
By Manufacturing Strategy - Peer Group P1
Process;
50% Discrete;
50% Process;
53%
Discrete;
47%
60.0 11.7
Company Process Manufacturing: 50.0%
Company Discrete Manufacturing: 50.0%
By Manufacturing Strategy - Peer Group P2
Company Response: Company Response:
* Excluding companies that have not provided data Peer Group P1 Peer Group P2

SAP CONFIDENTIAL - Page 39 - For subject Company Internal Use Only - This page is from the Benchmarking Analysis prepared for subject Company and subject to the terms, conditions and assumptions contained in the Benchmarking Analysis. Information contained herein is not a guarantee of future results, performance or cost savings.
Participating Company Profile: IT Landscape
SCP Systems Deployed
27%
1% 3%
44%
15%
2%
5%
28%
SAP ERP SAP ERP + Best of Breed SAP ERP + APO No SAP
Peer Group P1 Peer Group P2
*
Note :The sum of data labels may not add up to 100% since input on IT system deployed was not provided by all respondents
Company Response:
SAP CONFIDENTIAL - Page 40 - For subject Company Internal Use Only - This page is from the Benchmarking Analysis prepared for subject Company and subject to the terms, conditions and assumptions contained in the Benchmarking Analysis. Information contained herein is not a guarantee of future results, performance or cost savings.
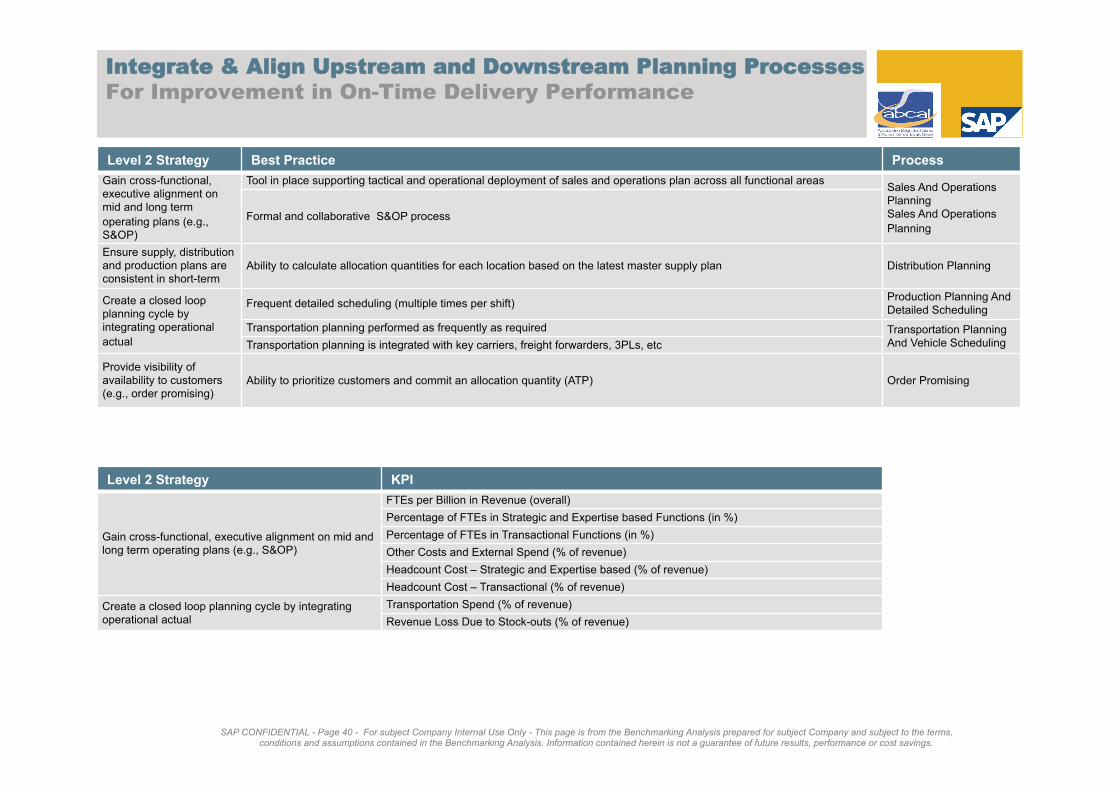
Integrate & Align Upstream and Downstream Planning Processes
For Improvement in On-Time Delivery Performance
Level 2 Strategy Best Practice Process
Gain cross-functional,
executive alignment on
mid and long term
operating plans (e.g.,
S&OP)
Tool in place supporting tactical and operational deployment of sales and operations plan across all functional areas Sales And Operations
Planning
Sales And Operations
Planning Formal and collaborative S&OP process
Ensure supply, distribution
and production plans are
consistent in short-term Ability to calculate allocation quantities for each location based on the latest master supply plan Distribution Planning
Create a closed loop
planning cycle by
integrating operational
actual
Frequent detailed scheduling (multiple times per shift) Production Planning And
Detailed Scheduling
Transportation planning performed as frequently as required Transportation Planning
And Vehicle Scheduling Transportation planning is integrated with key carriers, freight forwarders, 3PLs, etc
Provide visibility of
availability to customers
(e.g., order promising) Ability to prioritize customers and commit an allocation quantity (ATP) Order Promising
Level 2 Strategy KPI
Gain cross-functional, executive alignment on mid and
long term operating plans (e.g., S&OP)
FTEs per Billion in Revenue (overall)
Percentage of FTEs in Strategic and Expertise based Functions (in %)
Percentage of FTEs in Transactional Functions (in %)
Other Costs and External Spend (% of revenue)
Headcount Cost – Strategic and Expertise based (% of revenue)
Headcount Cost – Transactional (% of revenue)
Create a closed loop planning cycle by integrating
operational actual
Transportation Spend (% of revenue)
Revenue Loss Due to Stock-outs (% of revenue)
SAP CONFIDENTIAL - Page 41 - For subject Company Internal Use Only - This page is from the Benchmarking Analysis prepared for subject Company and subject to the terms, conditions and assumptions contained in the Benchmarking Analysis. Information contained herein is not a guarantee of future results, performance or cost savings.
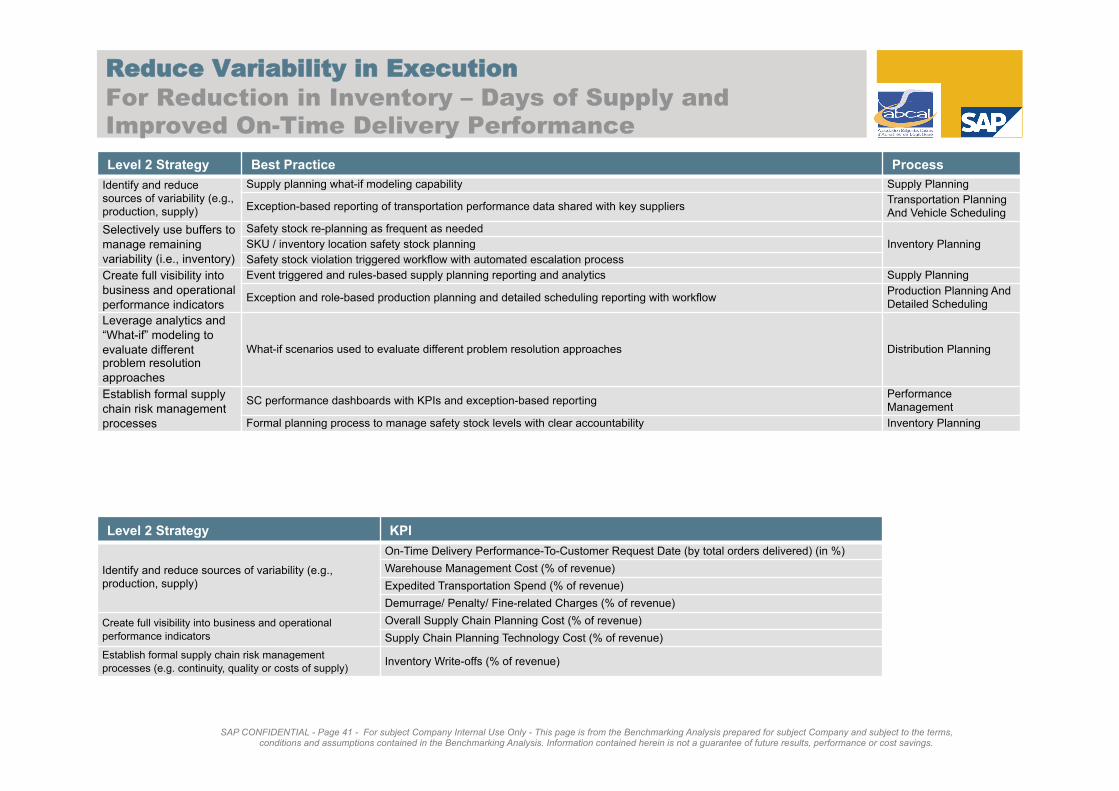
Level 2 Strategy Best Practice Process
Identify and reduce
sources of variability (e.g.,
production, supply)
Supply planning what-if modeling capability Supply Planning
Exception-based reporting of transportation performance data shared with key suppliers Transportation Planning
And Vehicle Scheduling
Selectively use buffers to
manage remaining
variability (i.e., inventory)
Safety stock re-planning as frequent as needed
Inventory Planning SKU / inventory location safety stock planning
Safety stock violation triggered workflow with automated escalation process
Create full visibility into
business and operational
performance indicators
Event triggered and rules-based supply planning reporting and analytics Supply Planning
Exception and role-based production planning and detailed scheduling reporting with workflow Production Planning And
Detailed Scheduling
Leverage analytics and
“What-if” modeling to
evaluate different problem resolution
approaches
What-if scenarios used to evaluate different problem resolution approaches Distribution Planning
Establish formal supply
chain risk management
processes
SC performance dashboards with KPIs and exception-based reporting Performance
Management
Formal planning process to manage safety stock levels with clear accountability Inventory Planning
Level 2 Strategy KPI
Identify and reduce sources of variability (e.g.,
production, supply)
On-Time Delivery Performance-To-Customer Request Date (by total orders delivered) (in %)
Warehouse Management Cost (% of revenue)
Expedited Transportation Spend (% of revenue)
Demurrage/ Penalty/ Fine-related Charges (% of revenue)
Create full visibility into business and operational
performance indicators
Overall Supply Chain Planning Cost (% of revenue)
Supply Chain Planning Technology Cost (% of revenue)
Establish formal supply chain risk management
processes (e.g. continuity, quality or costs of supply) Inventory Write-offs (% of revenue)
Reduce Variability in Execution
For Reduction in Inventory – Days of Supply and Improved On-Time Delivery Performance
SAP CONFIDENTIAL - Page 42 - For subject Company Internal Use Only - This page is from the Benchmarking Analysis prepared for subject Company and subject to the terms, conditions and assumptions contained in the Benchmarking Analysis. Information contained herein is not a guarantee of future results, performance or cost savings.
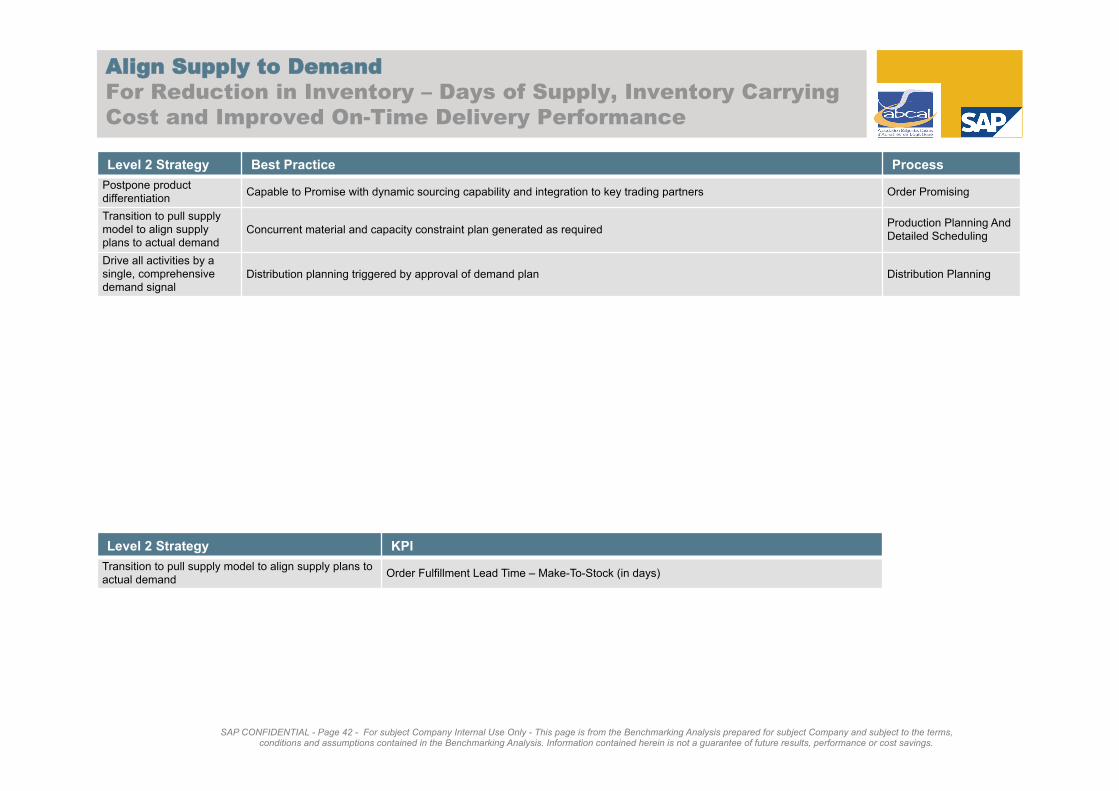
Level 2 Strategy Best Practice Process
Postpone product
differentiation Capable to Promise with dynamic sourcing capability and integration to key trading partners Order Promising
Transition to pull supply
model to align supply
plans to actual demand Concurrent material and capacity constraint plan generated as required
Production Planning And
Detailed Scheduling
Drive all activities by a
single, comprehensive
demand signal Distribution planning triggered by approval of demand plan Distribution Planning
Level 2 Strategy KPI
Transition to pull supply model to align supply plans to
actual demand Order Fulfillment Lead Time – Make-To-Stock (in days)
Align Supply to Demand
For Reduction in Inventory – Days of Supply, Inventory Carrying
Cost and Improved On-Time Delivery Performance
SAP CONFIDENTIAL - Page 43 - For subject Company Internal Use Only - This page is from the Benchmarking Analysis prepared for subject Company and subject to the terms, conditions and assumptions contained in the Benchmarking Analysis. Information contained herein is not a guarantee of future results, performance or cost savings.
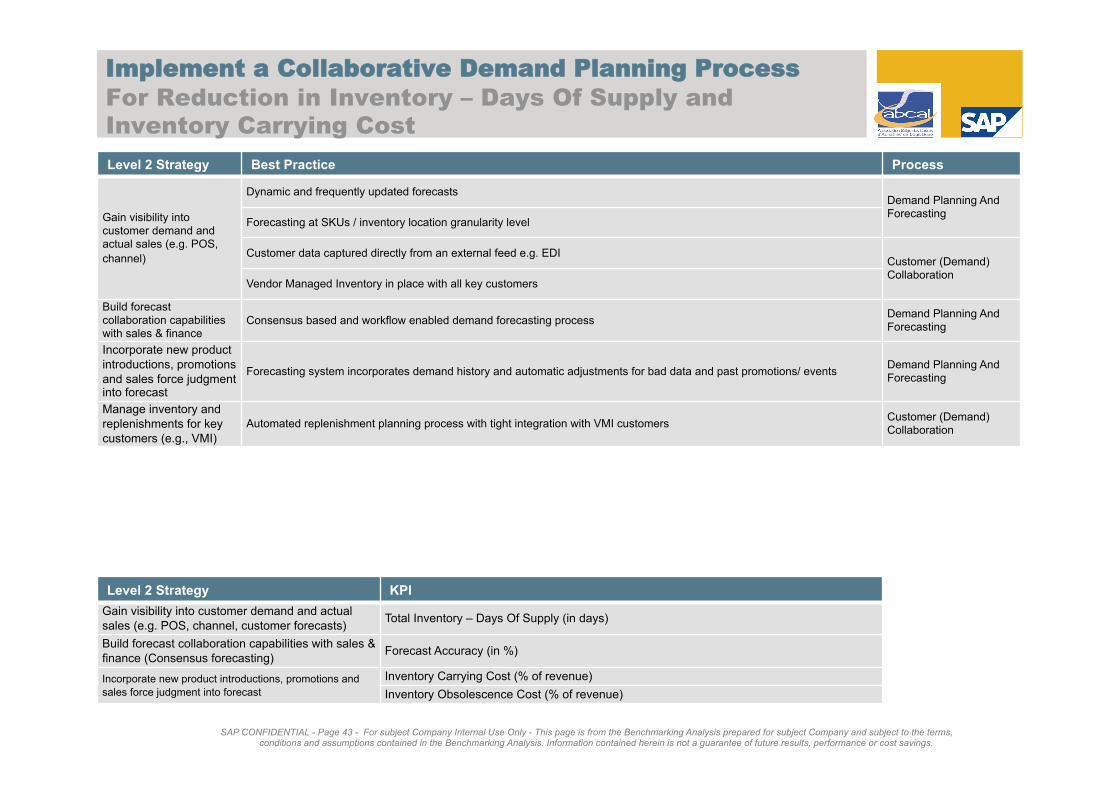
Level 2 Strategy Best Practice Process
Gain visibility into
customer demand and
actual sales (e.g. POS,
channel)
Dynamic and frequently updated forecasts Demand Planning And
Forecasting Forecasting at SKUs / inventory location granularity level
Customer data captured directly from an external feed e.g. EDI Customer (Demand)
Collaboration Vendor Managed Inventory in place with all key customers
Build forecast
collaboration capabilities
with sales & finance Consensus based and workflow enabled demand forecasting process
Demand Planning And
Forecasting
Incorporate new product
introductions, promotions
and sales force judgment into forecast
Forecasting system incorporates demand history and automatic adjustments for bad data and past promotions/ events Demand Planning And
Forecasting
Manage inventory and
replenishments for key
customers (e.g., VMI)
Automated replenishment planning process with tight integration with VMI customers Customer (Demand)
Collaboration
Level 2 Strategy KPI
Gain visibility into customer demand and actual
sales (e.g. POS, channel, customer forecasts) Total Inventory – Days Of Supply (in days)
Build forecast collaboration capabilities with sales &
finance (Consensus forecasting) Forecast Accuracy (in %)
Incorporate new product introductions, promotions and
sales force judgment into forecast
Inventory Carrying Cost (% of revenue)
Inventory Obsolescence Cost (% of revenue)
Implement a Collaborative Demand Planning Process
For Reduction in Inventory – Days Of Supply and Inventory Carrying Cost

SAP CONFIDENTIAL - Page 44 - For subject Company Internal Use Only - This page is from the Benchmarking Analysis prepared for subject Company and subject to the terms, conditions and assumptions contained in the Benchmarking Analysis. Information contained herein is not a guarantee of future results, performance or cost savings.
Integrate Supplier Network
For Reduction in Inventory – Days Of Supply
Level 2 Strategy Best Practice Process
Establish global, long term
supply plan Formal, frequent, globally applicable constraint based supply planning process Supply Planning
Secure supplier
commitment in line with
shared forecast Enterprise wide production planning process in place, integrated with external ecosystem
Production Planning And
Detailed Scheduling
Allow supplier
management of low value
inventory (e.g. SMI) Supplier managed inventory managed via automated signals Supplier Collaboration
Monitor production and
supply in real-time across
supplier network (e.g.,
inbound delays, inventory
liability, quality)
SMI: The process is based on complete autonomy of the contract manufacturer with full visibility of components’ supply
situation provided to OEM Supplier Collaboration

SAP CONFIDENTIAL - Page 45 - For subject Company Internal Use Only - This page is from the Benchmarking Analysis prepared for subject Company and subject to the terms, conditions and assumptions contained in the Benchmarking Analysis. Information contained herein is not a guarantee of future results, performance or cost savings.
Integrate Supplier Network
For Reduction in Order Fulfillment Lead Time
Level 2 Strategy Best Practice Process
Establish global, long term
supply plan Formal, frequent, globally applicable constraint based supply planning process Supply Planning
Secure supplier
commitment in line with
shared forecast Enterprise wide production planning process in place, integrated with external ecosystem
Production Planning And
Detailed Scheduling
Allow supplier
management of low value
inventory (e.g. SMI) Supplier managed inventory managed via automated signals Supplier Collaboration
Monitor production and
supply in real-time across
supplier network (e.g.,
inbound delays, inventory
liability, quality)
SMI: The process is based on complete autonomy of the contract manufacturer with full visibility of components’ supply
situation provided to OEM Supplier Collaboration
SAP CONFIDENTIAL - Page 46 - For subject Company Internal Use Only - This page is from the Benchmarking Analysis prepared for subject Company and subject to the terms, conditions and assumptions contained in the Benchmarking Analysis. Information contained herein is not a guarantee of future results, performance or cost savings.
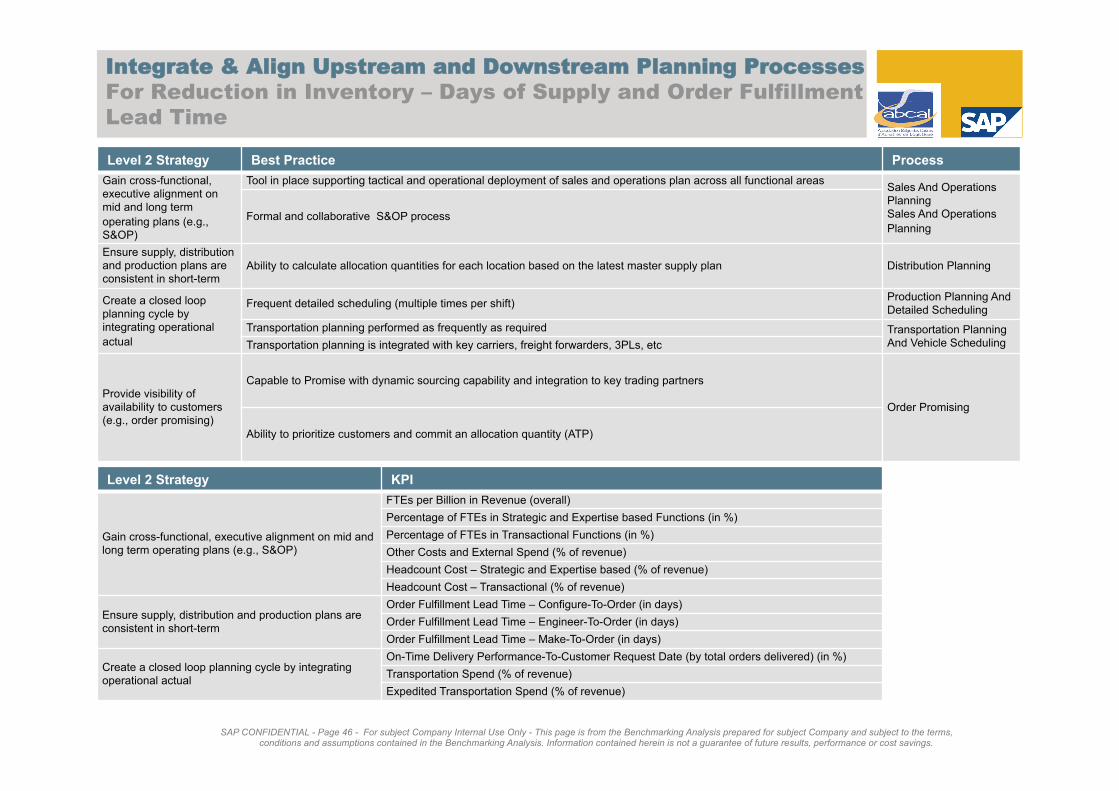
Integrate & Align Upstream and Downstream Planning Processes
For Reduction in Inventory – Days of Supply and Order Fulfillment
Lead Time
Level 2 Strategy Best Practice Process
Gain cross-functional,
executive alignment on
mid and long term
operating plans (e.g.,
S&OP)
Tool in place supporting tactical and operational deployment of sales and operations plan across all functional areas Sales And Operations
Planning
Sales And Operations
Planning Formal and collaborative S&OP process
Ensure supply, distribution
and production plans are
consistent in short-term Ability to calculate allocation quantities for each location based on the latest master supply plan Distribution Planning
Create a closed loop
planning cycle by
integrating operational
actual
Frequent detailed scheduling (multiple times per shift) Production Planning And
Detailed Scheduling
Transportation planning performed as frequently as required Transportation Planning
And Vehicle Scheduling Transportation planning is integrated with key carriers, freight forwarders, 3PLs, etc
Provide visibility of
availability to customers
(e.g., order promising)
Capable to Promise with dynamic sourcing capability and integration to key trading partners
Order Promising
Ability to prioritize customers and commit an allocation quantity (ATP)
Level 2 Strategy KPI
Gain cross-functional, executive alignment on mid and
long term operating plans (e.g., S&OP)
FTEs per Billion in Revenue (overall)
Percentage of FTEs in Strategic and Expertise based Functions (in %)
Percentage of FTEs in Transactional Functions (in %)
Other Costs and External Spend (% of revenue)
Headcount Cost – Strategic and Expertise based (% of revenue)
Headcount Cost – Transactional (% of revenue)
Ensure supply, distribution and production plans are
consistent in short-term
Order Fulfillment Lead Time – Configure-To-Order (in days)
Order Fulfillment Lead Time – Engineer-To-Order (in days)
Order Fulfillment Lead Time – Make-To-Order (in days)
Create a closed loop planning cycle by integrating
operational actual
On-Time Delivery Performance-To-Customer Request Date (by total orders delivered) (in %)
Transportation Spend (% of revenue)
Expedited Transportation Spend (% of revenue)
SAP CONFIDENTIAL - Page 47 - For subject Company Internal Use Only - This page is from the Benchmarking Analysis prepared for subject Company and subject to the terms, conditions and assumptions contained in the Benchmarking Analysis. Information contained herein is not a guarantee of future results, performance or cost savings.
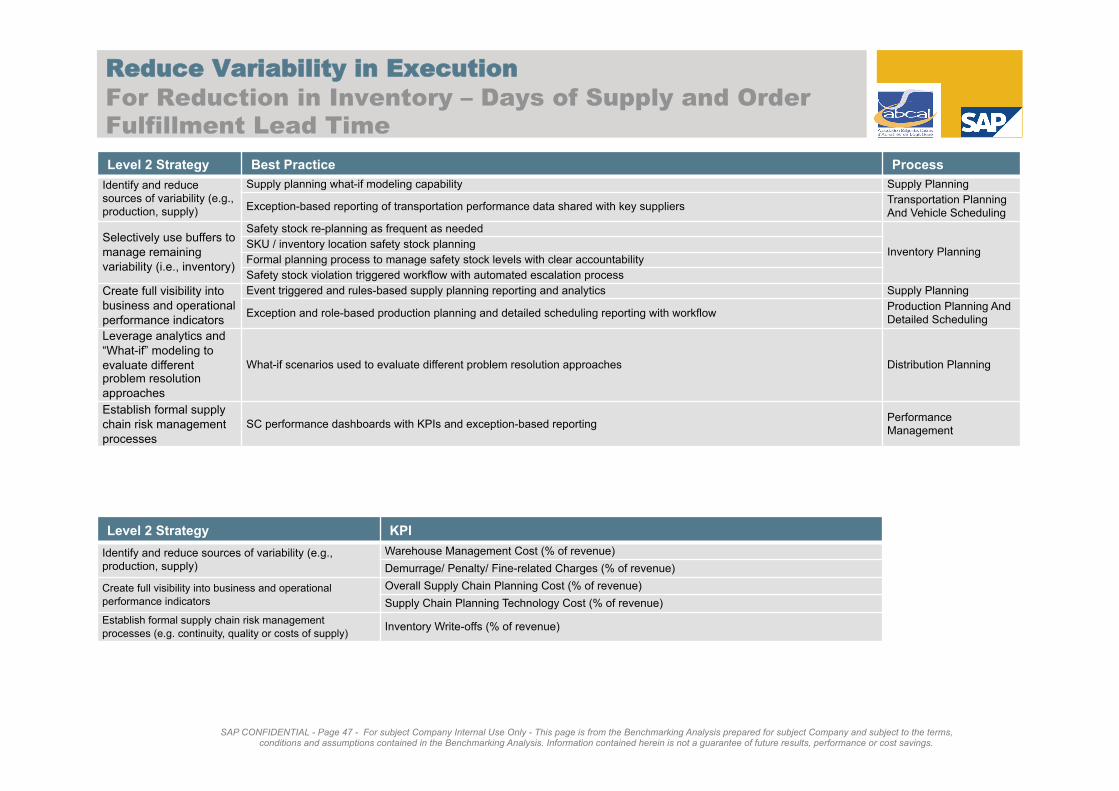
Level 2 Strategy Best Practice Process
Identify and reduce
sources of variability (e.g.,
production, supply)
Supply planning what-if modeling capability Supply Planning
Exception-based reporting of transportation performance data shared with key suppliers Transportation Planning
And Vehicle Scheduling
Selectively use buffers to
manage remaining
variability (i.e., inventory)
Safety stock re-planning as frequent as needed
Inventory Planning SKU / inventory location safety stock planning
Formal planning process to manage safety stock levels with clear accountability
Safety stock violation triggered workflow with automated escalation process
Create full visibility into
business and operational
performance indicators
Event triggered and rules-based supply planning reporting and analytics Supply Planning
Exception and role-based production planning and detailed scheduling reporting with workflow Production Planning And
Detailed Scheduling
Leverage analytics and
“What-if” modeling to
evaluate different problem resolution
approaches
What-if scenarios used to evaluate different problem resolution approaches Distribution Planning
Establish formal supply
chain risk management
processes
SC performance dashboards with KPIs and exception-based reporting Performance
Management
Level 2 Strategy KPI
Identify and reduce sources of variability (e.g.,
production, supply)
Warehouse Management Cost (% of revenue)
Demurrage/ Penalty/ Fine-related Charges (% of revenue)
Create full visibility into business and operational
performance indicators
Overall Supply Chain Planning Cost (% of revenue)
Supply Chain Planning Technology Cost (% of revenue)
Establish formal supply chain risk management
processes (e.g. continuity, quality or costs of supply) Inventory Write-offs (% of revenue)
Reduce Variability in Execution
For Reduction in Inventory – Days of Supply and Order Fulfillment Lead Time
SAP CONFIDENTIAL - Page 48 - For subject Company Internal Use Only - This page is from the Benchmarking Analysis prepared for subject Company and subject to the terms, conditions and assumptions contained in the Benchmarking Analysis. Information contained herein is not a guarantee of future results, performance or cost savings.
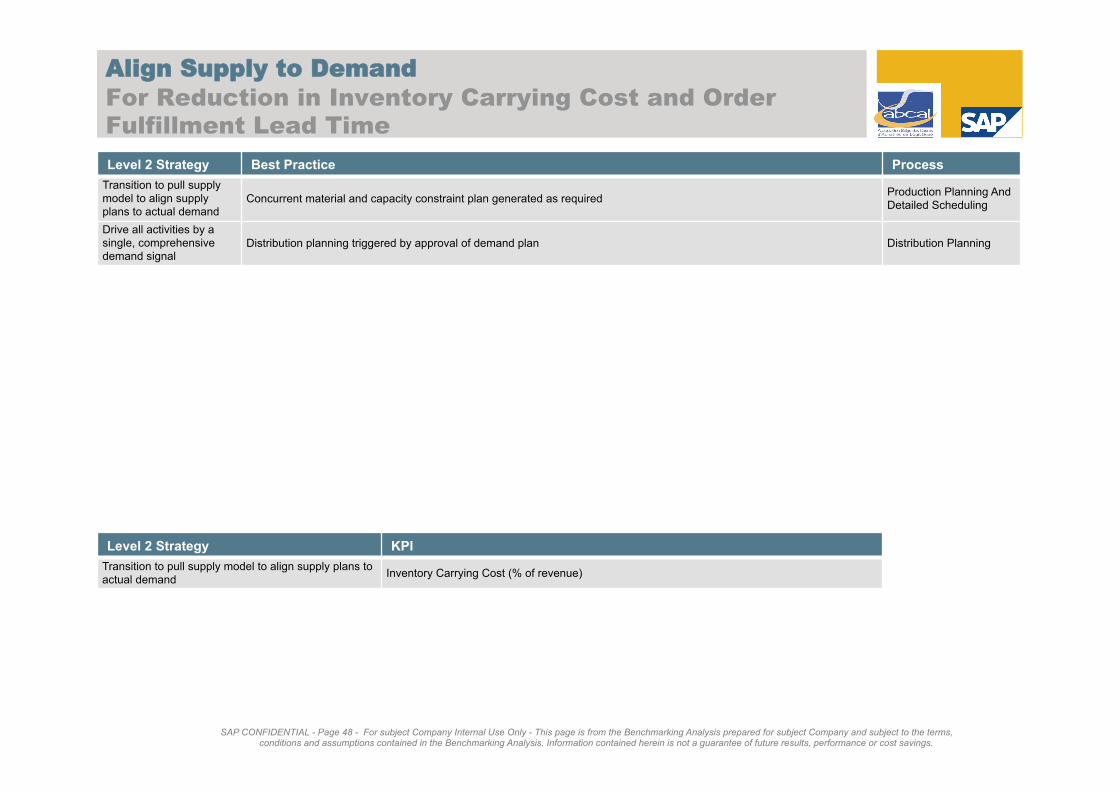
Level 2 Strategy Best Practice Process
Transition to pull supply
model to align supply
plans to actual demand Concurrent material and capacity constraint plan generated as required
Production Planning And
Detailed Scheduling
Drive all activities by a
single, comprehensive
demand signal Distribution planning triggered by approval of demand plan Distribution Planning
Level 2 Strategy KPI
Transition to pull supply model to align supply plans to
actual demand Inventory Carrying Cost (% of revenue)
Align Supply to Demand
For Reduction in Inventory Carrying Cost and Order Fulfillment Lead Time

SAP CONFIDENTIAL - Page 49 - For subject Company Internal Use Only - This page is from the Benchmarking Analysis prepared for subject Company and subject to the terms, conditions and assumptions contained in the Benchmarking Analysis. Information contained herein is not a guarantee of future results, performance or cost savings.
Level 2 Strategy Best Practice Process
Gain visibility into
customer demand and
actual sales (e.g. POS,
channel)
Dynamic and frequently updated forecasts Demand Planning And
Forecasting Forecasting at SKUs / inventory location granularity level
Customer data captured directly from an external feed e.g. EDI Customer (Demand)
Collaboration Vendor Managed Inventory in place with all key customers
Build forecast
collaboration capabilities
with sales & finance Consensus based and workflow enabled demand forecasting process
Demand Planning And
Forecasting
Incorporate new product
introductions, promotions
and sales force judgment into forecast
Forecasting system incorporates demand history and automatic adjustments for bad data and past promotions/ events Demand Planning And
Forecasting
Manage inventory and
replenishments for key
customers (e.g., VMI)
Automated replenishment planning process with tight integration with VMI customers Customer (Demand)
Collaboration
Level 2 Strategy KPI
Gain visibility into customer demand and actual
sales (e.g. POS, channel, customer forecasts) Total Inventory – Days Of Supply (in days)
Build forecast collaboration capabilities with sales &
finance (Consensus forecasting) Forecast Accuracy (in %)
Incorporate new product introductions, promotions
and sales force judgment into forecast Inventory Obsolescence Cost (% of revenue)
Implement a Collaborative Demand Planning Process
For Reduction in Inventory – Days Of Supply and Inventory Carrying Cost

SAP CONFIDENTIAL - Page 50 - For subject Company Internal Use Only - This page is from the Benchmarking Analysis prepared for subject Company and subject to the terms, conditions and assumptions contained in the Benchmarking Analysis. Information contained herein is not a guarantee of future results, performance or cost savings. © SAP 2007
Glossary
KPI Description Corresponding
Questions
On-Time Delivery Performance-
To-Customer Request Date (by
total orders delivered) (in %)
[Total number of orders delivered in full and on time as per customer's request date] /
[Total number of orders received]. Delivery measurements are based on the date a
complete order is shipped. An order must be complete to be considered fulfilled. A
complete order has all items on the order delivered in the quantities requested. Multiple
line items on a single order with different planned delivery dates constitute multiple
orders. Multiple planned delivery dates on a single line item also constitute multiple
orders.
Performance Indicator: Q8
Forecast Accuracy (in %) ( Forecasted demand - Absolute Forecasting error) / Actual demand. It is the
difference between forecasted demand and demand variance, as a % of actual demand. Performance Indicator: Q8
Revenue Loss Due To Stock-outs
(% of revenue) [Revenue lost due to stock-outs]/,[revenue] Performance Indicator: Q10
Order Fulfillment Lead Time –
Configure-to-Order (days)
A process where the trigger to begin manufacture of a product is an actual customer
order or release, rather than a market forecast. In order to be considered a configure-to-
order environment, less than 20% of the value-added takes place after the receipt of the
order or release, and virtually all necessary design and process documentation is
available at time of order receipt.
Performance Indicator: Q9
Order Fulfillment Lead Time –
Make-to-Order (days)
A manufacturing process strategy where the trigger to begin manufacture of a product is
an actual customer order or release, rather than a market forecast. For Make-to-Order
products, more than 20% of the value-added takes place after the receipt of the order or
release, and all necessary design and process documentation is available at time of
order receipt. (other manufacturing process strategies are Configure/ Package-to-Order,
Engineer-to-Order, and Make-to-Stock).
Performance Indicator: Q9
Order Fulfillment Lead Time –
Engineer-to-Order (days)
A process in which the manufacturing organization must first prepare significant product
or process documentation before manufacture may begin. Performance Indicator: Q9
Order Fulfillment Lead Time –
Make-to-Stock (days)
A manufacturing process strategy where finished product is continually held in plant or
warehouse inventory to fulfill expected incoming orders or releases based on a forecast.
(other manufacturing process strategies are Configure/ Package-to-Order, Engineer-to-
Order, and Make-to-Order).
Performance Indicator: Q9
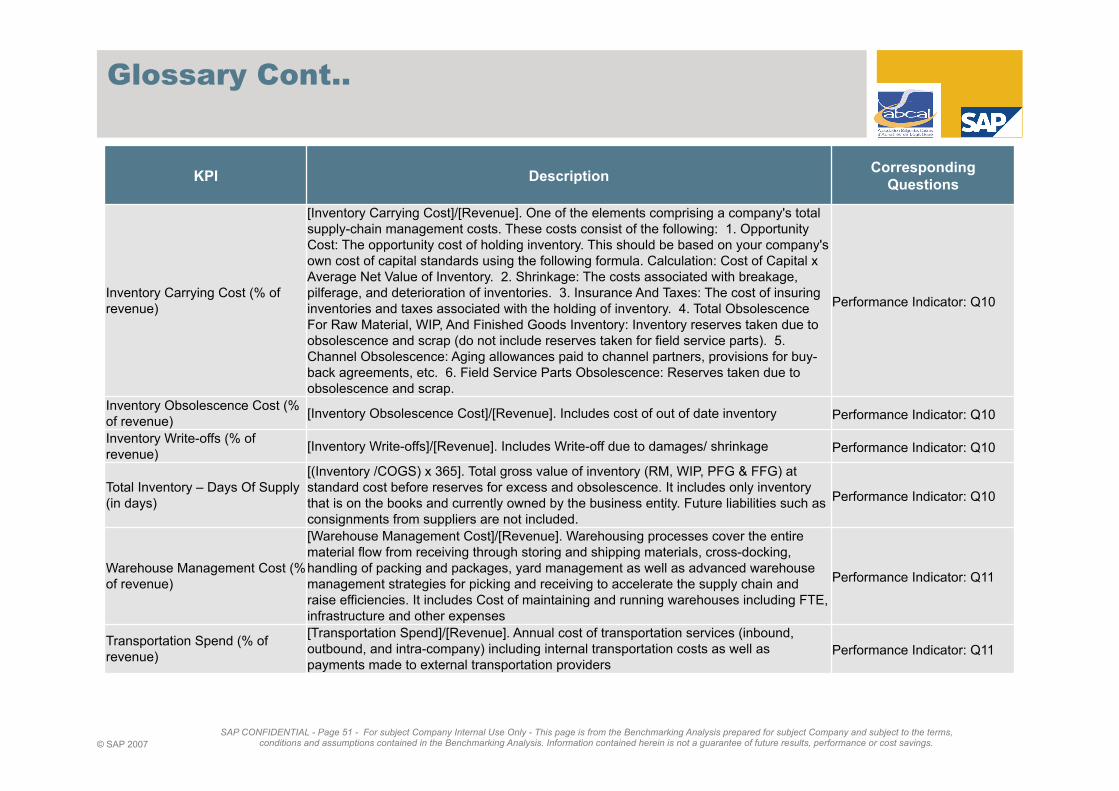
SAP CONFIDENTIAL - Page 51 - For subject Company Internal Use Only - This page is from the Benchmarking Analysis prepared for subject Company and subject to the terms, conditions and assumptions contained in the Benchmarking Analysis. Information contained herein is not a guarantee of future results, performance or cost savings. © SAP 2007
Glossary Cont..
KPI Description Corresponding
Questions
Inventory Carrying Cost (% of
revenue)
[Inventory Carrying Cost]/[Revenue]. One of the elements comprising a company's total
supply-chain management costs. These costs consist of the following: 1. Opportunity
Cost: The opportunity cost of holding inventory. This should be based on your company's
own cost of capital standards using the following formula. Calculation: Cost of Capital x
Average Net Value of Inventory. 2. Shrinkage: The costs associated with breakage,
pilferage, and deterioration of inventories. 3. Insurance And Taxes: The cost of insuring
inventories and taxes associated with the holding of inventory. 4. Total Obsolescence
For Raw Material, WIP, And Finished Goods Inventory: Inventory reserves taken due to
obsolescence and scrap (do not include reserves taken for field service parts). 5.
Channel Obsolescence: Aging allowances paid to channel partners, provisions for buy-
back agreements, etc. 6. Field Service Parts Obsolescence: Reserves taken due to
obsolescence and scrap.
Performance Indicator: Q10
Inventory Obsolescence Cost (%
of revenue) [Inventory Obsolescence Cost]/[Revenue]. Includes cost of out of date inventory Performance Indicator: Q10
Inventory Write-offs (% of
revenue) [Inventory Write-offs]/[Revenue]. Includes Write-off due to damages/ shrinkage Performance Indicator: Q10
Total Inventory – Days Of Supply
(in days)
[(Inventory /COGS) x 365]. Total gross value of inventory (RM, WIP, PFG & FFG) at
standard cost before reserves for excess and obsolescence. It includes only inventory
that is on the books and currently owned by the business entity. Future liabilities such as
consignments from suppliers are not included.
Performance Indicator: Q10
Warehouse Management Cost (%
of revenue)
[Warehouse Management Cost]/[Revenue]. Warehousing processes cover the entire
material flow from receiving through storing and shipping materials, cross-docking,
handling of packing and packages, yard management as well as advanced warehouse
management strategies for picking and receiving to accelerate the supply chain and
raise efficiencies. It includes Cost of maintaining and running warehouses including FTE,
infrastructure and other expenses
Performance Indicator: Q11
Transportation Spend (% of
revenue)
[Transportation Spend]/[Revenue]. Annual cost of transportation services (inbound,
outbound, and intra-company) including internal transportation costs as well as
payments made to external transportation providers Performance Indicator: Q11

SAP CONFIDENTIAL - Page 52 - For subject Company Internal Use Only - This page is from the Benchmarking Analysis prepared for subject Company and subject to the terms, conditions and assumptions contained in the Benchmarking Analysis. Information contained herein is not a guarantee of future results, performance or cost savings. © SAP 2007
Glossary Cont..
KPI Description Corresponding
Questions
Expedited Transportation Spend
(% of revenue)
[Expedited Transportation Spend]/[Revenue]. Expense on raising the priority level of a
shipment/ load due to a past due condition or a change in the requirement date that
necessitates compressing the normal lead time. Expedited transportation spend can be
of 2 categories â “ inbound expedition and outbound expedition. Inbound Expedition â “
To raise the priority level on an inbound shipment/ load due to a past due condition or a
change in the requirement date that necessitates compressing the normal lead time. This
involves manual checks and taking steps to hasten or to assure delivery of goods
purchased in accordance with a time schedule, usually by contract by the purchaser with
the vendor. The necessity for expediting indicates the need to improve the planning
process. Out-bound Expedition â “ To raise the priority level on an outbound shipment/
load due to a past due condition or a change in the requirement date that necessitates
compressing the normal lead time. This involves manual checks and taking steps to
hasten or to assure delivery of goods purchased in accordance with a time schedule,
usually by contract by the purchaser with the vendor. The necessity for expediting
indicates the need to improve the planning process.
Performance Indicator: Q11
Demurrage/ Penalty/ Fine-
Related Charges (% of revenue)
[Demurrage/ Penalty/ Fine-related Charges][Revenue]. Compensation paid for detention
of ship, freight car, or other cargo conveyance during loading or unloading beyond the
scheduled time of departure. The extra days beyond the lay days (being the days
allowed to load and unload the cargo), are called the days of demurrage. Delays may be
due, either by the ship's detention, for the purpose of loading or unloading the cargo,
before, during or after the voyage, or in waiting for convoy.
Performance Indicator: Q11
FTEs per Billion in Revenue
(overall) [Number of FTEs]/[Revenue in Billions] Performance Indicator: Q13
Percentage of FTEs in Strategic
and Expertise based Functions
(in %)
[Number of FTEs in Strategic & Expertise-based Functions]/[Total FTEs] Performance Indicator: Q13

SAP CONFIDENTIAL - Page 53 - For subject Company Internal Use Only - This page is from the Benchmarking Analysis prepared for subject Company and subject to the terms, conditions and assumptions contained in the Benchmarking Analysis. Information contained herein is not a guarantee of future results, performance or cost savings. © SAP 2007
Glossary Cont..
KPI Description Corresponding
Questions
Percentage of FTEs in
Transactional Functions (in %) [Number of FTEs in Transactional Functions]/[Total FTEs] Performance Indicator: Q13
Overall Supply Chain Planning
Cost (% of revenue)
[ Headcount Costs, Technology Costs, Other Costs, External Spend pertaining to
Supply Chain Planning]/[Revenue] Performance Indicator: Q12
Supply Chain Planning
Technology Cost (% of revenue)
[Supply Chain Planning Technology Cost][Revenue]. Technology costs associated with
major supply-chain management processes should include: Development costs (costs
incurred in process reengineering, planning, software development, installation,
implementation, and training associated with new and/or upgraded architecture,
infrastructure, and systems to support the described supply-chain management
processes), Execution costs (operating costs to support supply-chain process users,
including computer and network operations, EDI and telecommunications services, and
amortization/depreciation of hardware, Maintenance costs (costs incurred in problem
resolution, troubleshooting, repair, and routine maintenance associated with installed
hardware and software for described supply-chain management processes. Include
costs associated with data base administration, systems configuration control, release
planning and management.
Performance Indicator: Q12
Other Costs and External Spend
(% of revenue)
[Other Costs and External Spend]/[Revenue. This refers to supply chain planning
function cost. There may be certain activities that are completely outsourced (e.g.
logistics planning, warehouse planning) – this metric ensures that such expenses are
considered while estimating the total cost of supply chain planning. But this should only
be related to the planning related activities that require staffing and not inventory cost or
material spend.
Performance Indicator: Q12
Headcount Cost – Strategic and
Expertise based (% of revenue) [Headcount Cost of FTEs in Strategic & Expertise-based Functions]/[Revenue] Performance Indicator: Q13
Headcount Cost – Transactional
(% of revenue) [Headcount Cost of FTEs in Transactional-based Functions]/[Revenue] Performance Indicator: Q13