supply chain metrics that matter: improving supply chain...
TRANSCRIPT
Supply Chain Metrics That Matter: Improving Supply Chain Resiliency
Insights on Reliability at the Intersection of Operating Margin and Inventory Turns
3/18/2014
By Lora Cecere, Founder
Supply Chain Insights LLC
Contents Research ................................................................................................................................... 2
Disclosure .................................................................................................................................. 2
Research Methodology .............................................................................................................. 2
Executive Overview ................................................................................................................... 3
Medical Device Companies ........................................................................................................ 6
Consumer Packaged Goods ...................................................................................................... 7
Food .......................................................................................................................................... 8
Pharmaceuticals ........................................................................................................................ 9
Chemical ...................................................................................................................................10
Consumer Electronics ............................................................................................................... 11
Recommendations ....................................................................................................................12
Conclusion ................................................................................................................................12
Overview of Methodology ..........................................................................................................12
Other Reports in the Metrics That Matter Series: ......................................................................14
About Supply Chain Insights LLC ..............................................................................................15
About Lora Cecere ....................................................................................................................15
Copyright © 2014 Supply Chain Insights LLC Page 1

Research Supply Chain Metrics That Matter is a series of monthly reports published from August, 2012
through present time by Supply Chain Insights LLC. Each has been a deep focus on a specific
industry.
In these reports, we analyzed how companies made trade-offs over the course of the last
decade in balancing growth, profitability, cycles and complexity. In this report, we take a
different approach. Here we take a closer look at industry performance at the intersection of
operating margin and inventory turns. We have developed a methodology to determine
corporate reliability at this critical intersection.
Within the world of Supply Chain Management (SCM), each industry is unique. We believe that
it is dangerous to list all industries in a spreadsheet and declare a supply chain leader. Instead,
we believe that we have to evaluate change over time by peer group. In this series of reports,
we analyze the potential of each supply chain peer group, share insights from industry leaders
from each industry, and give recommendations based on general market trends.
Disclosure Your trust is important to us. As such, we are open and transparent about our financial
relationships and our research process. This independent research is 100% funded by Supply
Chain Insights.
These reports are intended for you to read, share and use to improve your supply chain
decisions. Please share this data freely within your company and across your industry. All we
ask for in return is attribution when you use the materials in this report. We publish under the
Creative Commons License Attribution-Noncommercial-Share Alike 3.0 United States and you
will find our citation policy here.
Research Methodology The basis of this report is publicly available information from corporate annual reports from the
period of 2000-2013 as available. To complete this analysis, and understand the patterns, we
partnered with the operations research team at Arizona State University in January 2014. Here
we share the results.
Copyright © 2014 Supply Chain Insights LLC Page 2

Executive Overview Ask any supply chain leader which metrics are the most important to deliver, and the most
common answers are operating margin, inventory turns, and revenue growth. In our plotting of
industry results for the Supply Chain Metrics That Matter reports, we could see that certain
industries had greater variation at the intersection of operating margin and inventory turns than
others. We wanted to know why.
The supply chain is a complex system. It is growing even more so. Supply chain leaders are
charged to deliver reliable results on The Effective Frontier for costs and inventory cycles.
Failure to do so can result in termination. The Effective Frontier is depicted in Figure 1.
Figure 1. The Effective Frontier
It is a juggling act. There are finite trade-offs and the metrics are interrelated. Each company is
operating at a different potential. A new technology can elevate the frontier and improve the
company’s ability to operate at a higher level of performance. Often when companies attempt to
drive down costs they will elevate inventory. When complexity increases, it can have an adverse
effect on both operating margin and inventory turns. It is a continuous balancing act which has
been made easier through the evolution of Advanced Planning Systems (APS).
Progress happens in small increments. It happens over the period of many years (three to five).
We believe that reliability of results at the intersection of operating margin and inventory turns is
a characteristic of supply chain excellence.
We are trying to understand who’s done it best. It is for this reason that we have been studying
these patterns for the last two years. What can we see? Over the last decade, industry progress
Copyright © 2014 Supply Chain Insights LLC Page 3
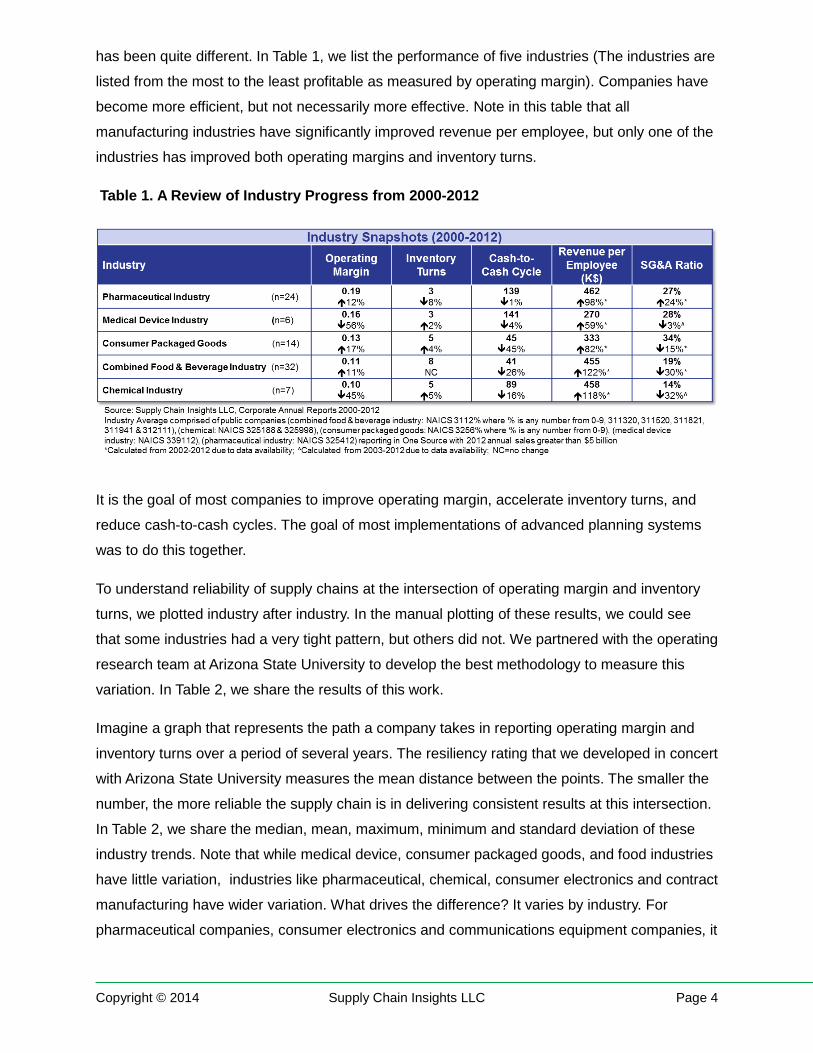
has been quite different. In Table 1, we list the performance of five industries (The industries are
listed from the most to the least profitable as measured by operating margin). Companies have
become more efficient, but not necessarily more effective. Note in this table that all
manufacturing industries have significantly improved revenue per employee, but only one of the
industries has improved both operating margins and inventory turns.
Table 1. A Review of Industry Progress from 2000-2012
It is the goal of most companies to improve operating margin, accelerate inventory turns, and
reduce cash-to-cash cycles. The goal of most implementations of advanced planning systems
was to do this together.
To understand reliability of supply chains at the intersection of operating margin and inventory
turns, we plotted industry after industry. In the manual plotting of these results, we could see
that some industries had a very tight pattern, but others did not. We partnered with the operating
research team at Arizona State University to develop the best methodology to measure this
variation. In Table 2, we share the results of this work.
Imagine a graph that represents the path a company takes in reporting operating margin and
inventory turns over a period of several years. The resiliency rating that we developed in concert
with Arizona State University measures the mean distance between the points. The smaller the
number, the more reliable the supply chain is in delivering consistent results at this intersection.
In Table 2, we share the median, mean, maximum, minimum and standard deviation of these
industry trends. Note that while medical device, consumer packaged goods, and food industries
have little variation, industries like pharmaceutical, chemical, consumer electronics and contract
manufacturing have wider variation. What drives the difference? It varies by industry. For
pharmaceutical companies, consumer electronics and communications equipment companies, it
Copyright © 2014 Supply Chain Insights LLC Page 4

revolves around successful R&D pipelines. For the chemical and contract manufacturing
companies it is based on contracts and cost of materials.
Table 2. Summary of Supply Chain Resilience Rankings By Industry
The smaller the mean value, the more reliable the results are within an industry. We find it
interesting that the wider the deviation within an industry, the greater the differences between
individual company performance within that industry. In the next section, to help readers
understand the methodology, we share orbit charts and results on resiliency by industry.
Copyright © 2014 Supply Chain Insights LLC Page 5
Medical Device Companies The most resilient industry is the medical device industry. This industry operates with both high
margins and high levels of resiliency. With a decline in operating margin of 56% over the last
decade, and rising inventories, a 2% increase of inventory was seen in an industry that turns
inventory three times a year.
This industry is struggling with increasing government compliance and the pace of innovation of
implantable devices. As hospitals have pushed back to reduce costs in the operating theatre,
the industry has increased Sales, General & Administrative Expense (SG&A) by training the
sales team on procedures and augmenting the hospital staff resources on procedures.
The medical device industry is not known for supply chain excellence. It lacks the sophisticated
inventory systems of other industries. Many devices are termed “trunk stock” and travel to the
hospital on the day of the procedure in the trunk of a sales person’s car. Instead, we believe that
these results are better defined by the industry dynamics. The product line has been less
volatile than big pharmaceutical and the make-to-order and configure-to-order processes are
quite effective on this lower-volume, highly-configured supply chain.
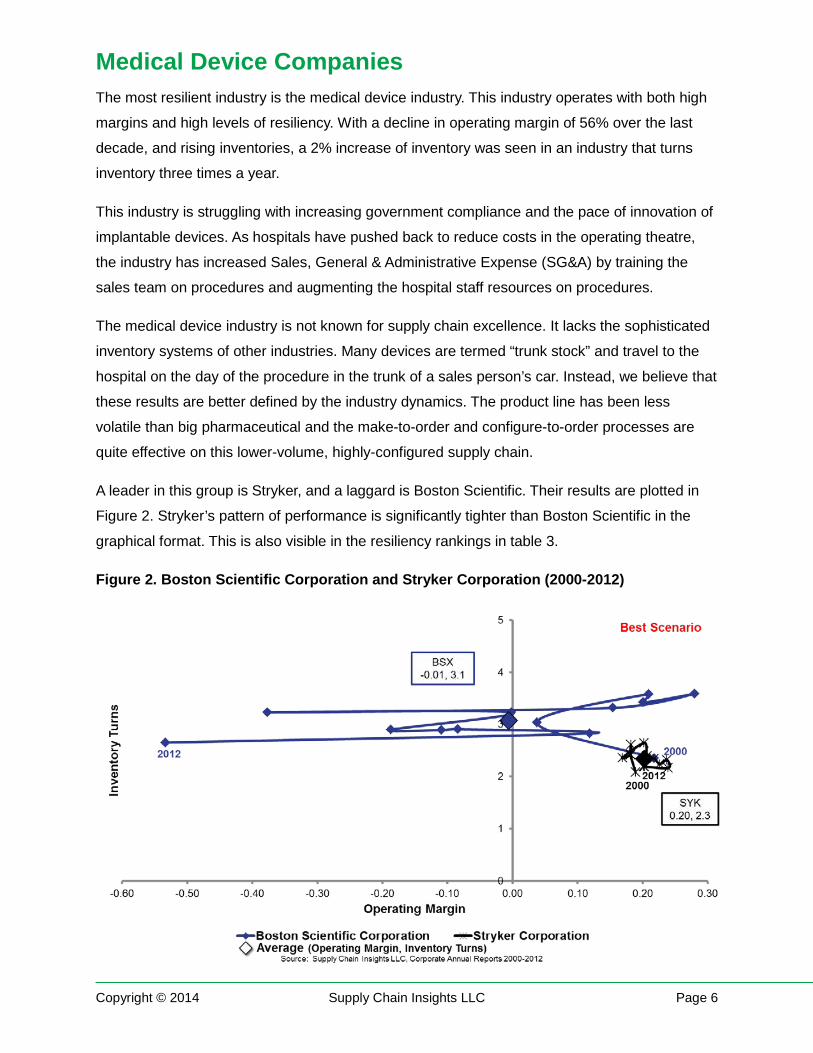
A leader in this group is Stryker, and a laggard is Boston Scientific. Their results are plotted in
Figure 2. Stryker’s pattern of performance is significantly tighter than Boston Scientific in the
graphical format. This is also visible in the resiliency rankings in table 3.
Figure 2. Boston Scientific Corporation and Stryker Corporation (2000-2012)
Copyright © 2014 Supply Chain Insights LLC Page 6

As shown in Table 3, the deviation between industry players is relatively small.
Table 3. Resiliency Rankings in the Medical Device Industry
Consumer Packaged Goods As an industry, Consumer Packaged Goods (CPG) companies have improved both operating
margin and inventory turns since 2000. They have also delivered high reliability of corporate
results at the intersection of operating margin and inventory turns. Colgate has outperformed
Procter & Gamble (P&G) Company in the reliability of these results. P&G’s loss of operating
margin in the past four years reduced their resiliency ranking.
This industry has built global supply chains and successfully executed a myriad of Mergers and
Acquisitions (M&A) since 2000. The entire industry shows good results and higher levels of
resiliency (lower values).
Figure 3. Colgate-Palmolive Company and Procter & Gamble Company (2000-2012)
Copyright © 2014 Supply Chain Insights LLC Page 7

Table 4. Resiliency Rankings in the Consumer Packaged Goods Industry
Food Commodity volatility has never been higher. The cost of new product launch is four times the
cost of five years ago. Growth has slowed. Food manufacturing companies are still regional,
lacking the economy of scale of global CPG operations. They also are facing increasing
competition.
Note in Figure 4, the wilder swings of the food players than the consumer packaged goods
manufacturers in Figure 3. Also note the extreme loss of margin of these two major food
manufacturers. The resiliency rating values are higher as a result of the erratic patterns.
Figure 4. General Mills, Inc. and H. J. Heinz Company (2000-2012)
Copyright © 2014 Supply Chain Insights LLC Page 8
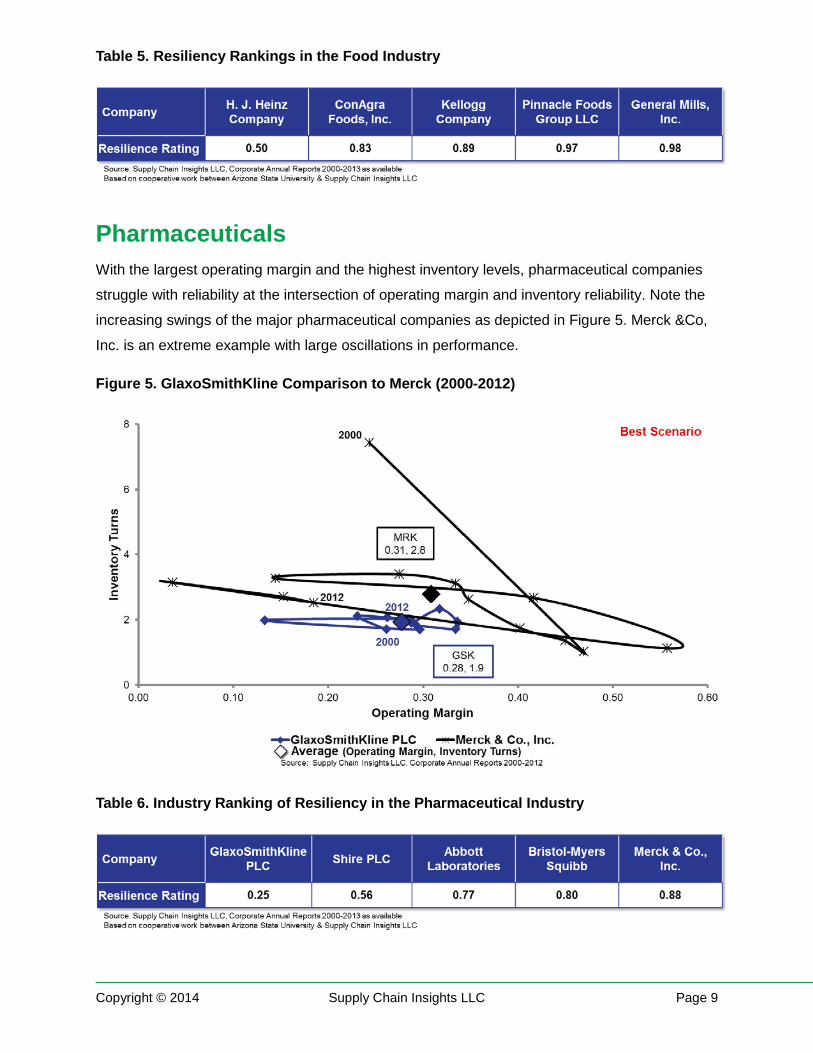
Table 5. Resiliency Rankings in the Food Industry
Pharmaceuticals With the largest operating margin and the highest inventory levels, pharmaceutical companies
struggle with reliability at the intersection of operating margin and inventory reliability. Note the
increasing swings of the major pharmaceutical companies as depicted in Figure 5. Merck &Co,
Inc. is an extreme example with large oscillations in performance.
Figure 5. GlaxoSmithKline Comparison to Merck (2000-2012)
Table 6. Industry Ranking of Resiliency in the Pharmaceutical Industry
Copyright © 2014 Supply Chain Insights LLC Page 9
While the prior industries profiled had a tight deviation of companies within the industry, within
pharmaceutical companies there is a wider range. We believe that this is based both on the
wide range of supply chain competency and the changes in product pipelines. While many
people group pharmaceutical and medical device companies together, we find it quite
interesting to see the stark difference in resiliency between these two industries.
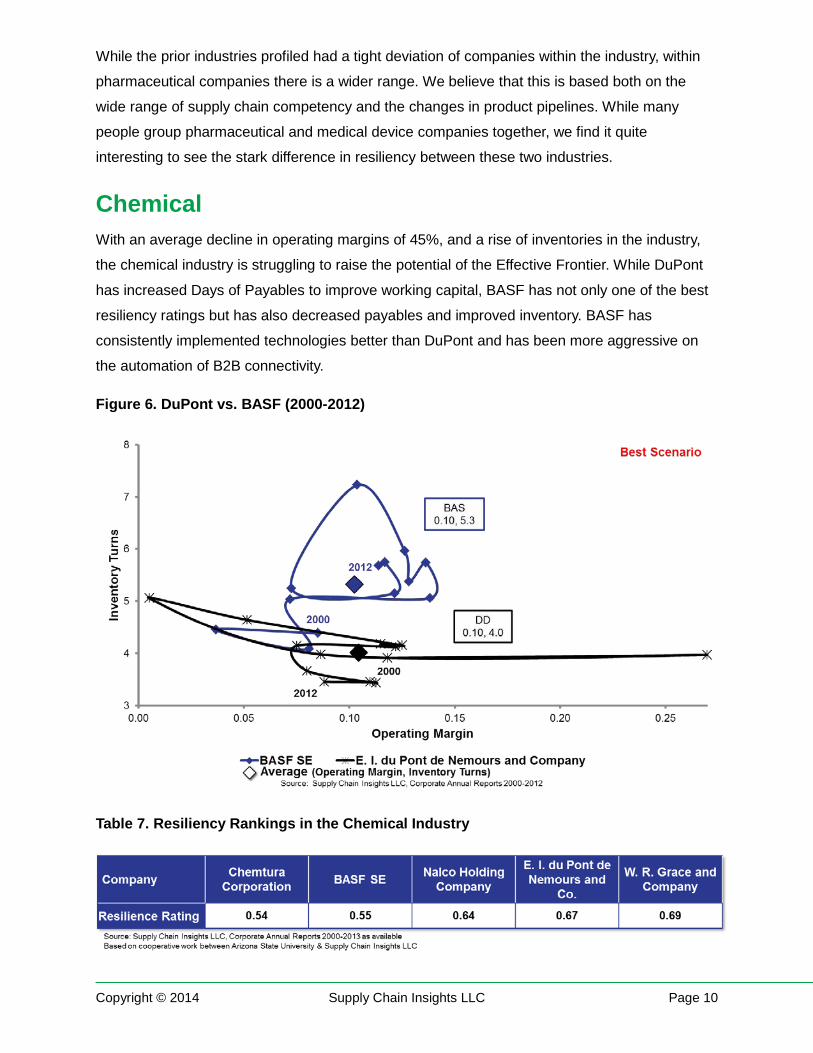
Chemical With an average decline in operating margins of 45%, and a rise of inventories in the industry,
the chemical industry is struggling to raise the potential of the Effective Frontier. While DuPont
has increased Days of Payables to improve working capital, BASF has not only one of the best
resiliency ratings but has also decreased payables and improved inventory. BASF has
consistently implemented technologies better than DuPont and has been more aggressive on
the automation of B2B connectivity.
Figure 6. DuPont vs. BASF (2000-2012)
Table 7. Resiliency Rankings in the Chemical Industry
Copyright © 2014 Supply Chain Insights LLC Page 10
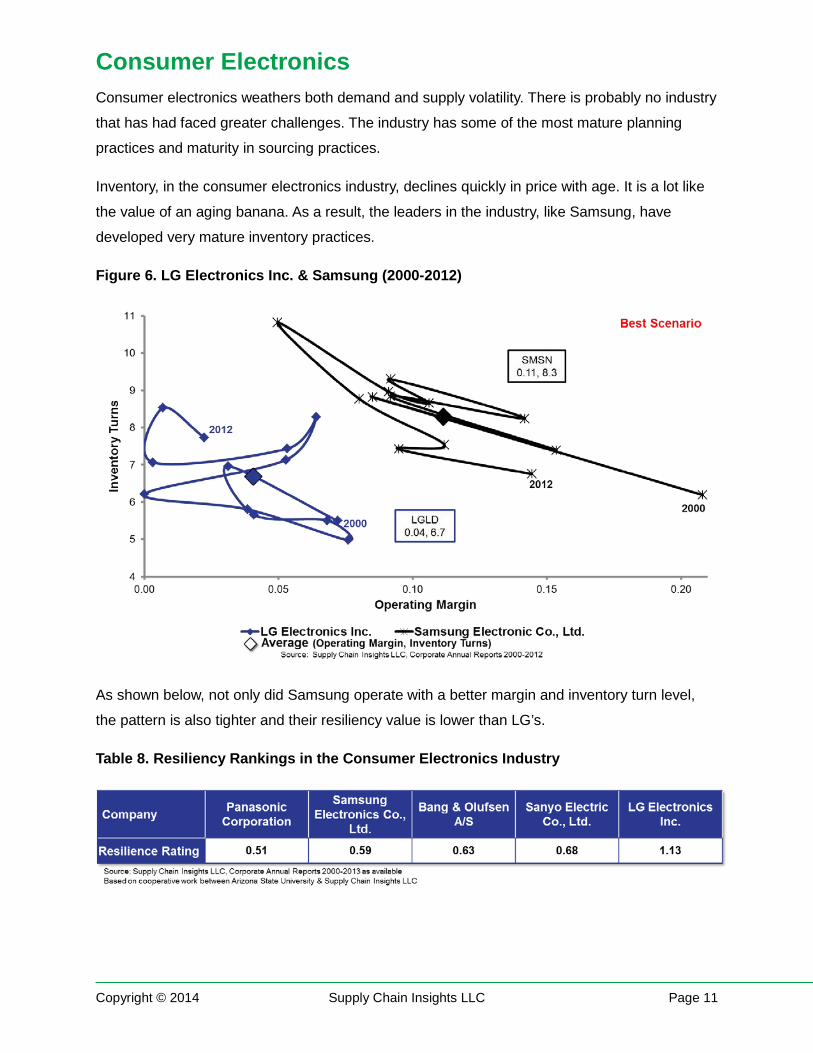
Consumer Electronics Consumer electronics weathers both demand and supply volatility. There is probably no industry
that has had faced greater challenges. The industry has some of the most mature planning
practices and maturity in sourcing practices.
Inventory, in the consumer electronics industry, declines quickly in price with age. It is a lot like
the value of an aging banana. As a result, the leaders in the industry, like Samsung, have
developed very mature inventory practices.
Figure 6. LG Electronics Inc. & Samsung (2000-2012)
As shown below, not only did Samsung operate with a better margin and inventory turn level,
the pattern is also tighter and their resiliency value is lower than LG’s.
Table 8. Resiliency Rankings in the Consumer Electronics Industry
Copyright © 2014 Supply Chain Insights LLC Page 11
Recommendations 1) Industries with High Variability Pose Risk in the Extended Supply Chain. If you are
dependent on companies with a large resiliency rating, they pose risk in the ability to post
reliable, consistent results. For example, the variability and the lack of resiliency of contract
manufacturers should be of concern for the brand owners of consumer electronics. In our
interviews, few seem aware of this issue.
2) Benchmark your Results and Look for Opportunities to Improve Reliability and Resiliency at the Intersection of Operating Margin and Inventory Turns. While still under
study, and not conclusive, we do see that companies with stronger Sales and Operations
Planning processes (S&OP) score better on resiliency within their industry. They also have
strong and parallel supply chain financial organizations and a run a more data-driven focused
process.
3) Measure Progress in Centimeters not Kilometers. Supply chain excellence happens
slowly over many years. Focus on building capabilities to power and raise the potential of the
organization on their Effective Frontier. Move in a deliberate manner to keep the organizations
balanced.
Conclusion This report is designed to give the supply chain leader an objective measurement to compare
progress across industries in a meaningful way. Use the data to mitigate risk benchmark your
progress and align your organization on a goal.
Overview of Methodology The plan was simple. Our goal was to connect corporate performance with supply chain
performance using financial ratios from corporate balance sheets. The execution has been more
difficult than we could have imagined. It sounds simple. However, it is not. We are two years into
the research and still working to deliver on our mission.
Our work began in February 2012 when Abby Mayer, Research Associate, mined online annual
reports industry-by-industry to construct spreadsheets of common financial metrics. We
experimented with a multitude of ways to turn a spreadsheet into a story. We finally discovered
orbit charts which you see scattered throughout this report. It allowed us to see the pattern at
the intersection of The Effective Frontier.
Copyright © 2014 Supply Chain Insights LLC Page 12
In August of 2012, we began work on the first of many Supply Chain Metrics That Matter
reports. These reports tell the story of an industry. They usually focus on a single industry
ranging from automotive to consumer packaged goods and everything in between. This gave us
a chance to better understand the differences between the industries and cemented our belief
that they have to be evaluated separately. The supply chain of a hard disk drive manufacturer is
inherently different from a supply chain focused on food products. It made us believers that a
methodology that compares companies within the same framework, like the Gartner Top 25, is
an apples-to-oranges comparison that benefits no one.
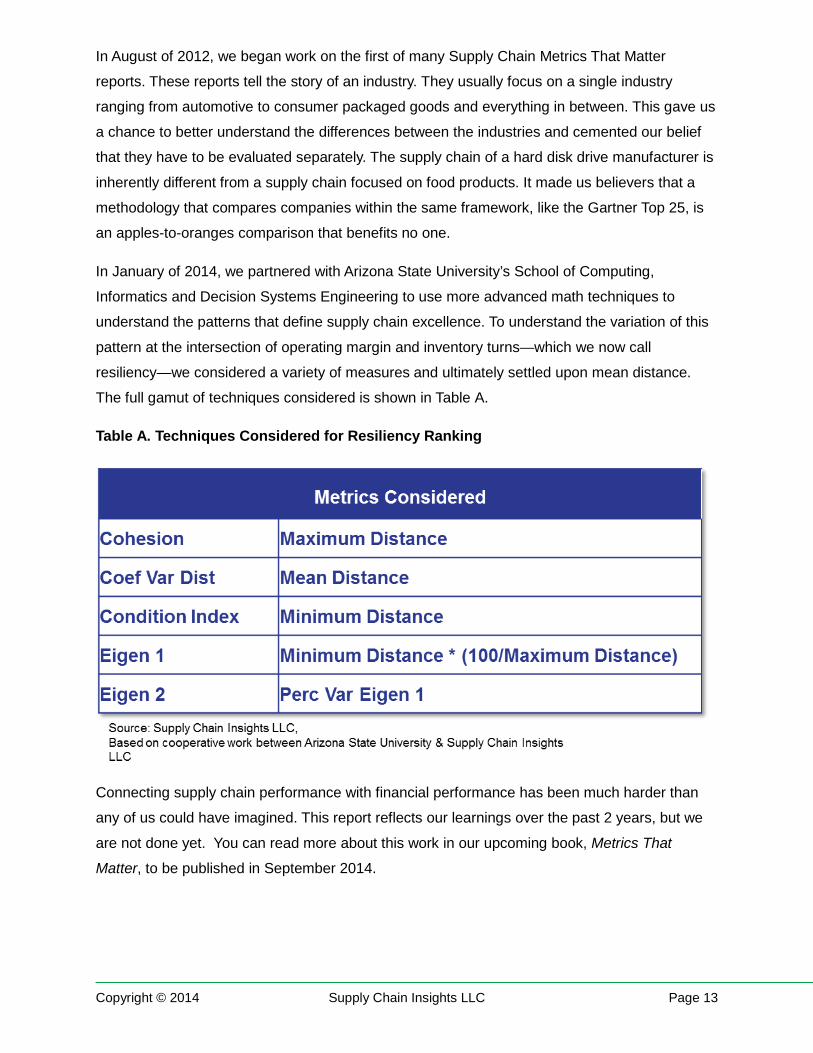
In January of 2014, we partnered with Arizona State University’s School of Computing,
Informatics and Decision Systems Engineering to use more advanced math techniques to
understand the patterns that define supply chain excellence. To understand the variation of this
pattern at the intersection of operating margin and inventory turns—which we now call
resiliency—we considered a variety of measures and ultimately settled upon mean distance.
The full gamut of techniques considered is shown in Table A.
Table A. Techniques Considered for Resiliency Ranking
Connecting supply chain performance with financial performance has been much harder than
any of us could have imagined. This report reflects our learnings over the past 2 years, but we
are not done yet. You can read more about this work in our upcoming book, Metrics That
Matter, to be published in September 2014.
Copyright © 2014 Supply Chain Insights LLC Page 13
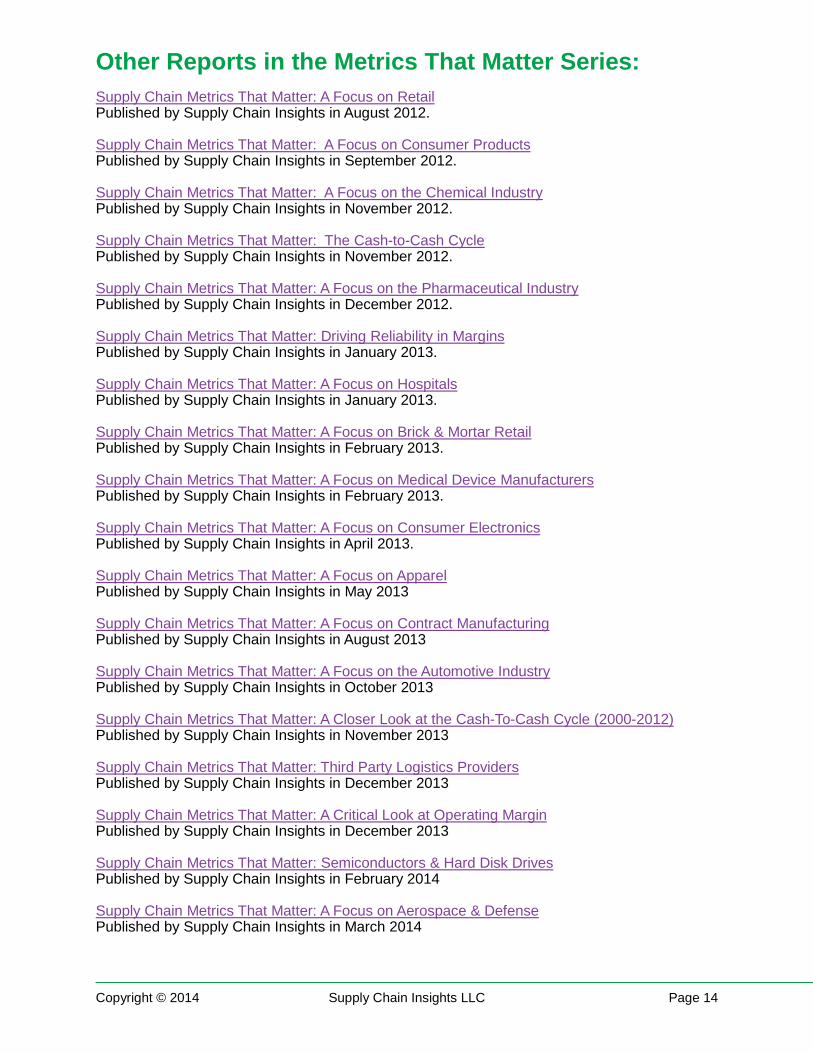
Other Reports in the Metrics That Matter Series: Supply Chain Metrics That Matter: A Focus on Retail Published by Supply Chain Insights in August 2012. Supply Chain Metrics That Matter: A Focus on Consumer Products Published by Supply Chain Insights in September 2012. Supply Chain Metrics That Matter: A Focus on the Chemical Industry Published by Supply Chain Insights in November 2012. Supply Chain Metrics That Matter: The Cash-to-Cash Cycle Published by Supply Chain Insights in November 2012. Supply Chain Metrics That Matter: A Focus on the Pharmaceutical Industry Published by Supply Chain Insights in December 2012. Supply Chain Metrics That Matter: Driving Reliability in Margins Published by Supply Chain Insights in January 2013. Supply Chain Metrics That Matter: A Focus on Hospitals Published by Supply Chain Insights in January 2013. Supply Chain Metrics That Matter: A Focus on Brick & Mortar Retail Published by Supply Chain Insights in February 2013. Supply Chain Metrics That Matter: A Focus on Medical Device Manufacturers Published by Supply Chain Insights in February 2013. Supply Chain Metrics That Matter: A Focus on Consumer Electronics Published by Supply Chain Insights in April 2013. Supply Chain Metrics That Matter: A Focus on Apparel Published by Supply Chain Insights in May 2013 Supply Chain Metrics That Matter: A Focus on Contract Manufacturing Published by Supply Chain Insights in August 2013 Supply Chain Metrics That Matter: A Focus on the Automotive Industry Published by Supply Chain Insights in October 2013 Supply Chain Metrics That Matter: A Closer Look at the Cash-To-Cash Cycle (2000-2012) Published by Supply Chain Insights in November 2013 Supply Chain Metrics That Matter: Third Party Logistics Providers Published by Supply Chain Insights in December 2013 Supply Chain Metrics That Matter: A Critical Look at Operating Margin Published by Supply Chain Insights in December 2013 Supply Chain Metrics That Matter: Semiconductors & Hard Disk Drives Published by Supply Chain Insights in February 2014 Supply Chain Metrics That Matter: A Focus on Aerospace & Defense Published by Supply Chain Insights in March 2014
Copyright © 2014 Supply Chain Insights LLC Page 14

About Supply Chain Insights LLC Founded in February, 2012 by Lora Cecere, Supply Chain Insights LLC is focused on delivering
independent, actionable and objective advice for supply chain leaders. If you need to know
which practices and technologies make the biggest difference to corporate performance, turn to
us. We are a company dedicated to this research. We help you understand supply chain trends,
evolving technologies and which metrics matter.
About Lora Cecere Lora Cecere (twitter ID @lcecere) is the Founder of Supply Chain Insights
LLC and the author of popular enterprise software blog Supply Chain
Shaman currently read by 10,000 supply chain professionals each month.
She also writes as a LinkedIn Influencer and is a contributor for Forbes. Her
book, Bricks Matter, (co-authored with Charlie Chase) was published on
December 26th, 2012. She is currently working on a second book, Metrics
That Matter, to publish in 2014.
With over nine years as a research analyst with AMR Research, Altimeter Group, and Gartner Group, and now as a Founder of Supply Chain Insights, Lora understands supply
chain. She has worked with over 600 companies on their supply chain strategy and speaks at
over 50 conferences a year on the evolution of supply chain processes and technologies. Her
research is designed for the early adopter seeking first mover advantage.
Copyright © 2014 Supply Chain Insights LLC Page 15