supply chain inventory management · supply chain inventory management prepared by dr. muhammad...
TRANSCRIPT
Supply Chain Inventory Management
Prepared By
Dr. Muhammad Saad Memon
Asst. Professor
Inventories
• Inventories are stockpiles of raw materials, supplies,
components, work in process and finished goods that appear at
numerous points throughout a firm’s production and logistics
channel or supply chain.
• Inventories are often found in warehouses, yards, shop floors,
transportation equipment and on retail store shelves. Having
inventory on hand can cost between 20 and 40 per cent of their
value per year.
• Improve Customer Service
– Operating systems usually cannot be designed to economically
respond to customer's requests for products or services in an
instantaneous manner.
– Inventories provide a level of product or service availability, which,
when located in the proximity of the customer, can meet a high
customer service requirement.
– The presence of these inventories to the customer may not only
maintain sales, but also actually increase them.
REASONS FOR INVENTORIES
• Reduce Costs
– Although holding inventories has a cost associated with it, it can indirectlyreduce operating costs in other activities and may more than offset thecarrying cost.
– First, holding inventories may encourage economies of production byallowing larger, longer and more level production runs. Production outputcan be decoupled from the variation in demand requirements wheninventories exist to act as buffers between the two.
– Second, holding inventories fosters economies in purchasing andtransportation. A purchasing department may buy in quantities beyond thefirm's immediate needs in order to realize price-quantity discounts.
REASONS FOR INVENTORIES
• Reduce Costs– Third, forward buying involves the purchasing of additional quantities of products
the logistics at a lower current price rather than at higher anticipated future prices.
– Fourth, variability in the time that it takes to produce and transport goodsthroughout the operating channel can cause uncertainties that impact on operatingcosts as well as customer service levels. Inventories are frequently used at manypoints in the channel to buffer the effects of this variability and, thereby, help tosmooth operations.
– Fifth, unplanned and unanticipated shocks can befall the logistics system. Labourstrikes, natural disasters, surges in demand, and delays in supplies are the types ofcontingencies against which inventories can afford some protection. Having someinventory at key points throughout the logistics channel allows the system tooperate for a period of time while the effect of the shock can be diminished.
REASONS FOR INVENTORIES
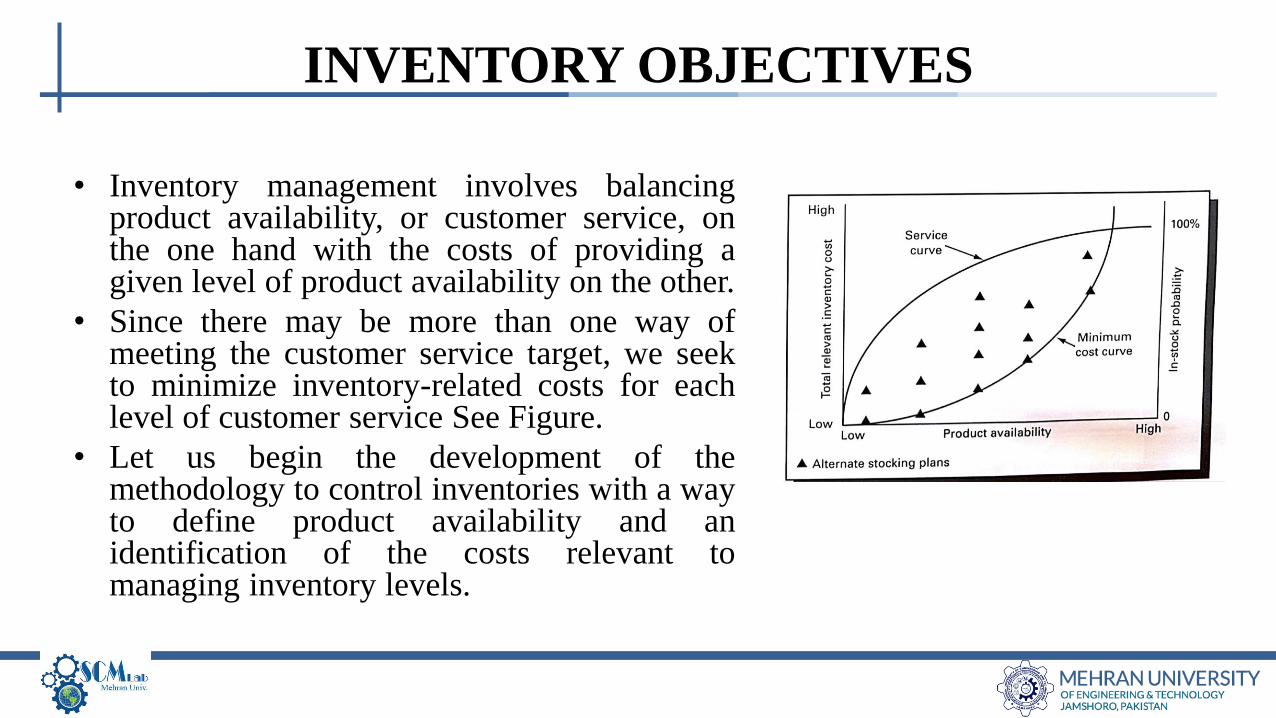
• Inventory management involves balancingproduct availability, or customer service, onthe one hand with the costs of providing agiven level of product availability on the other.
• Since there may be more than one way ofmeeting the customer service target, we seekto minimize inventory-related costs for eachlevel of customer service See Figure.
• Let us begin the development of themethodology to control inventories with a wayto define product availability and anidentification of the costs relevant tomanaging inventory levels.
INVENTORY OBJECTIVES
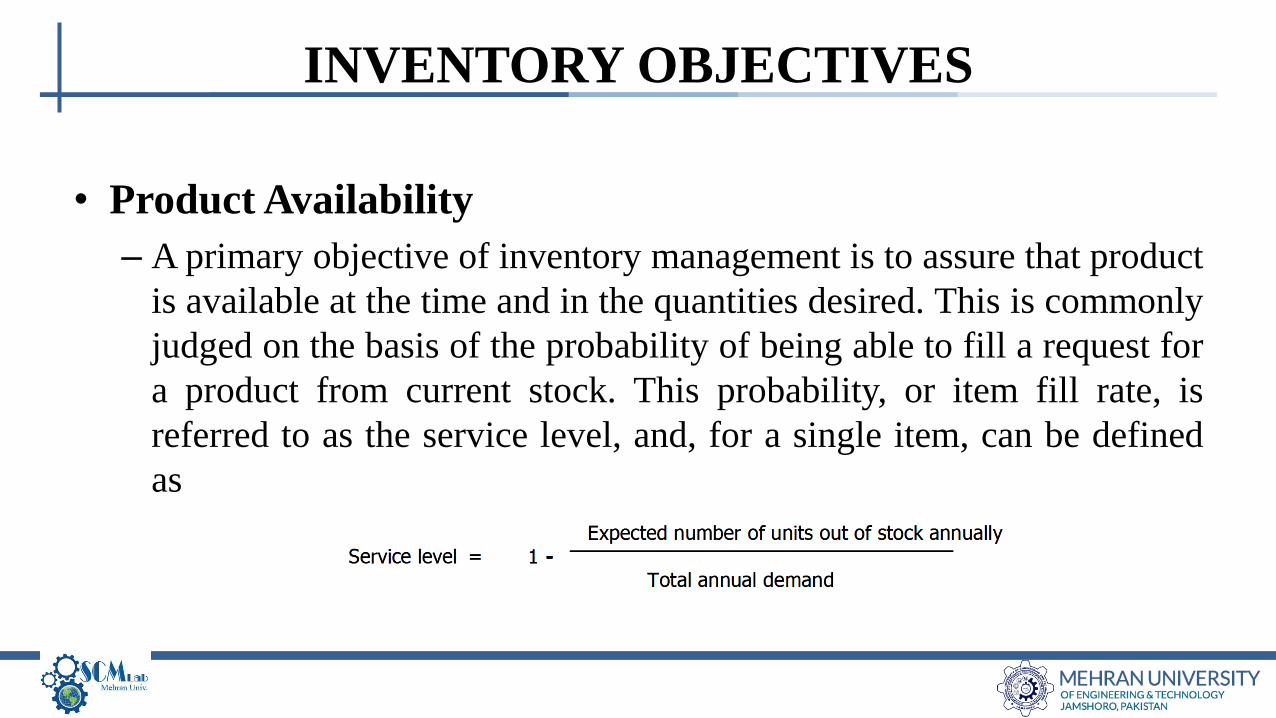
• Product Availability
– A primary objective of inventory management is to assure that product
is available at the time and in the quantities desired. This is commonly
judged on the basis of the probability of being able to fill a request for
a product from current stock. This probability, or item fill rate, is
referred to as the service level, and, for a single item, can be defined
as
INVENTORY OBJECTIVES
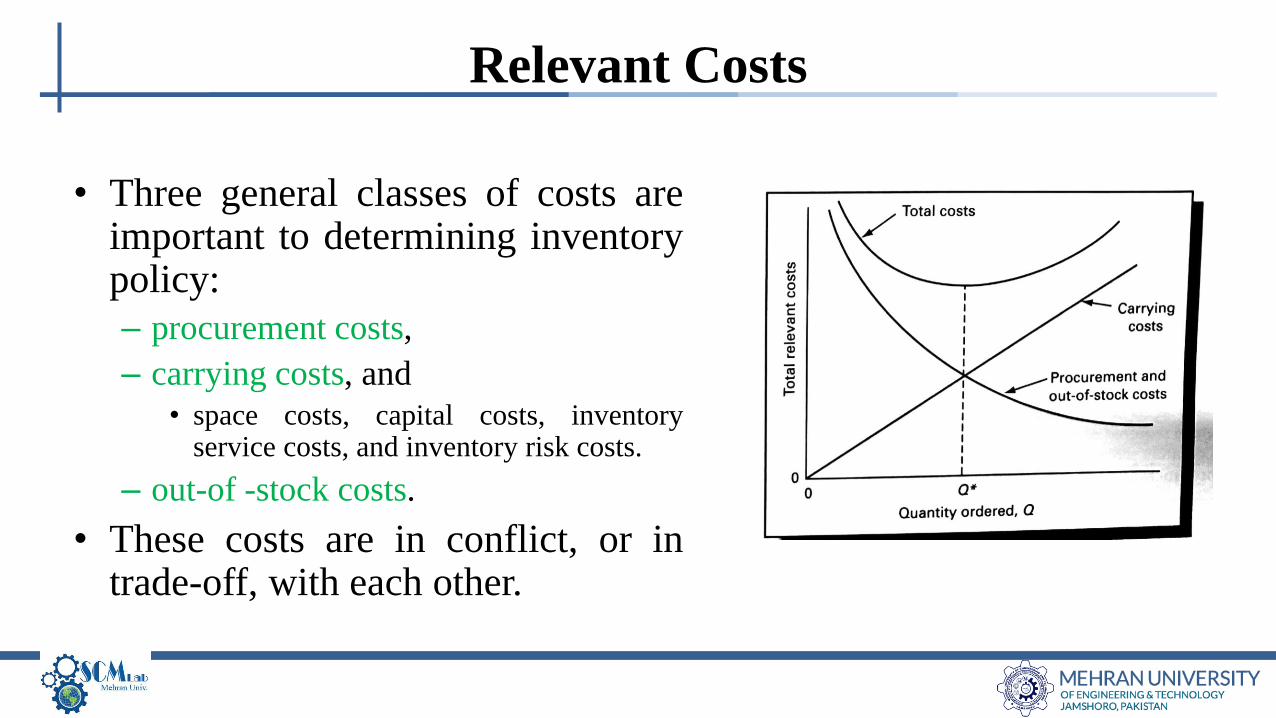
• Three general classes of costs areimportant to determining inventorypolicy:
– procurement costs,
– carrying costs, and
• space costs, capital costs, inventoryservice costs, and inventory risk costs.
– out-of -stock costs.
• These costs are in conflict, or intrade-off, with each other.
Relevant Costs
• Let us begin to develop methods for controlling inventory levels with the push philosophy.
• Recall that this method is appropriate where production or purchase quantities exceed theshort-term requirements of the inventories into which the quantities are to be shipped.
• If these quantities cannot be stored at the production site for lack of space or other reasons,then they must be allocated to the stocking points, hopefully in some way that makeseconomic sense.
• We need to address the following questions:– How much inventory should be maintained at each stocking point?
– For a particular production run or purchase, how much should be allocated to each stocking point?
– How should the excess supply over requirements be apportioned among the stocking points?
• A method for pushing quantities into stocking points involves the following steps:
PUSH INVENTORY CONTROL
1. Determine by forecasting or other means the requirements for the periodbetween now and the next expected production run or vendor purchase.
2. Find the current on-hand quantities at each stocking point.
3. Establish the stock availability level at each stocking point.
4. Calculate total requirements from the forecast plus additional quantities neededto cover uncertainty in he demand forecast.
5. Determine net requirements as the difference between total requirements and thequantities on hand.
6. Apportion the excess over total net requirements to the stocking points on thebasis of the average demand rate, that is, the forecasted demand.
7. Sum the requirements and the proration of excess quantities to find the amountto be allocated to each stocking point.
PUSH INVENTORY CONTROL
• Many practical Inventory Problems exist where the products
involved are perishable or the demand for them is a one-time
event.
• Products such as fruits and vegetables or the cut flowers,
newspapers and some pharmaceuticals have a short and defined
shelf life and they are not available for subsequent selling
periods.
BASIC PULL INVENTORY MODEL – Single-Order Quantity
• To find the most economic order size (Q*), we can use the
marginal economic analysis.
– That is Q* is found at the point where the marginal profit on the next
unit sold equals the marginal loss of not selling the next unit.
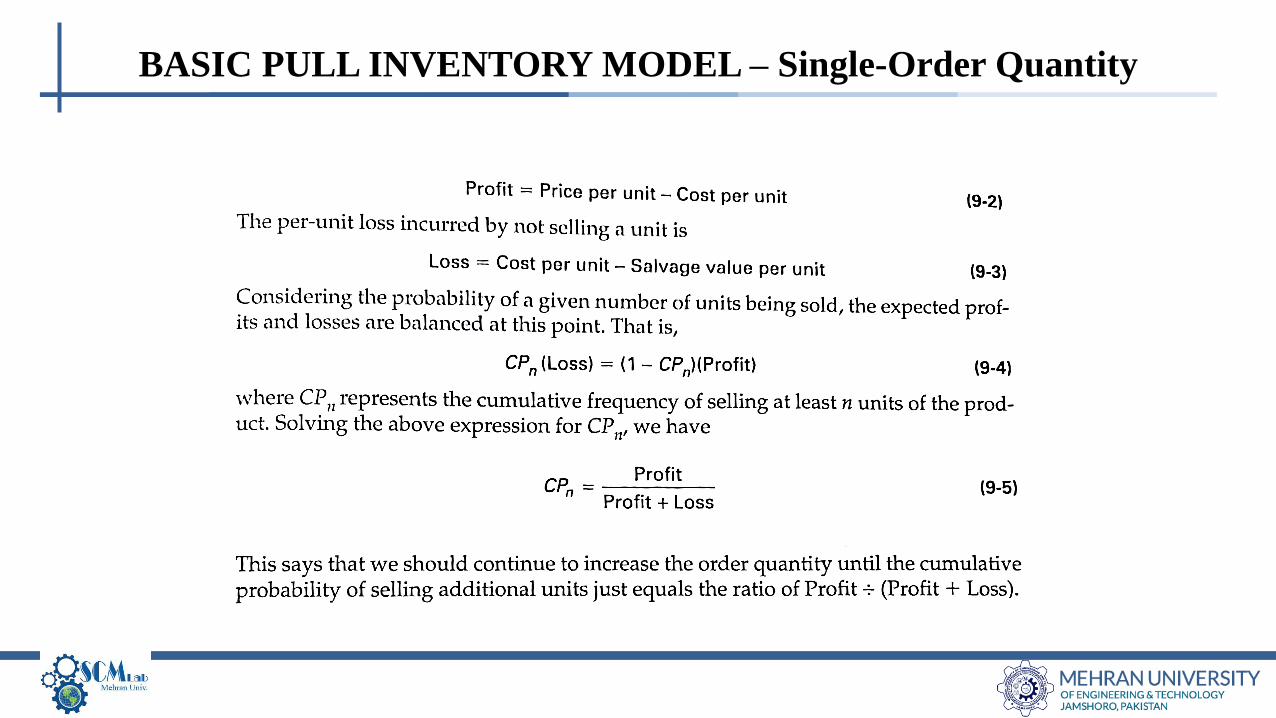
• The marginal profit per unit obtained by selling a unit is
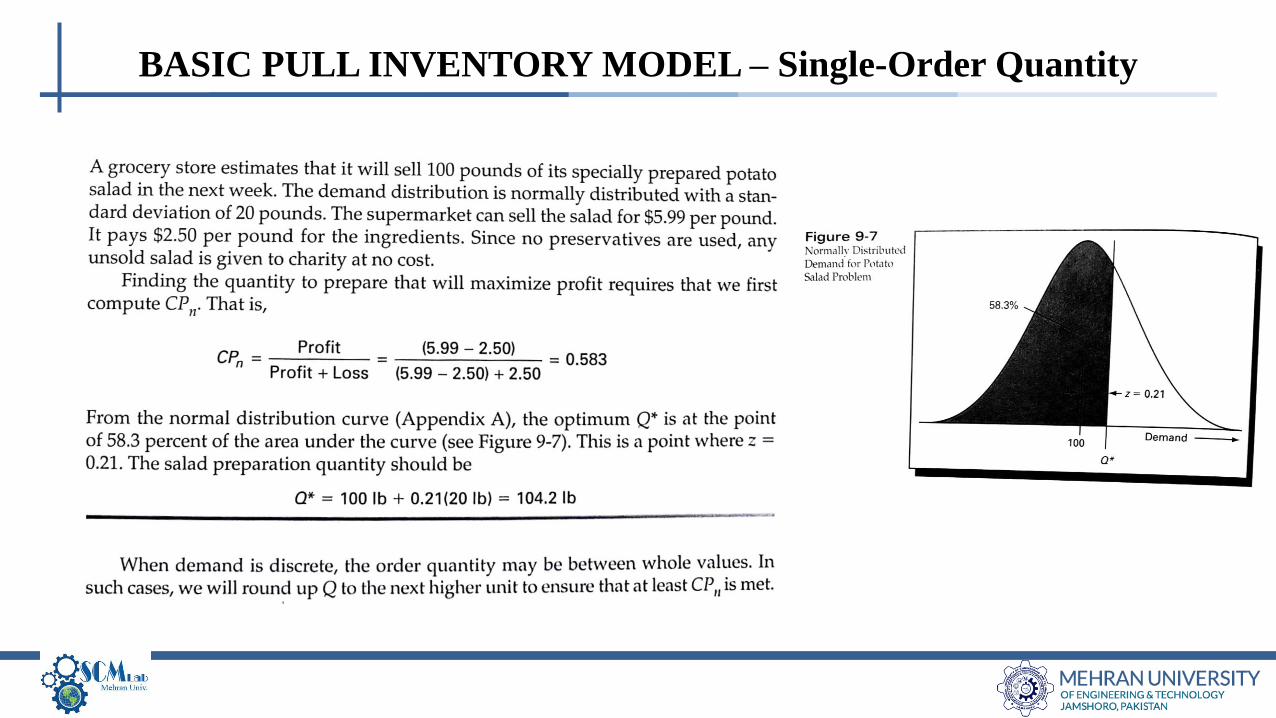
BASIC PULL INVENTORY MODEL – Single-Order Quantity
BASIC PULL INVENTORY MODEL – Single-Order Quantity
BASIC PULL INVENTORY MODEL – Single-Order Quantity
• Instantaneous Resupply
– When demand is continuous and at an essentially constant rate,
controlling inventory levels is accomplished by specifying (1) the
quantity that will be used to replenish the inventory on a periodic
basis and (2) the frequency with which the inventory should be
replenished.
– This is a problem of balancing conflicting cost patterns. In the
simplest case, it requires balancing procurement costs against carrying
costs, as was previously shown.
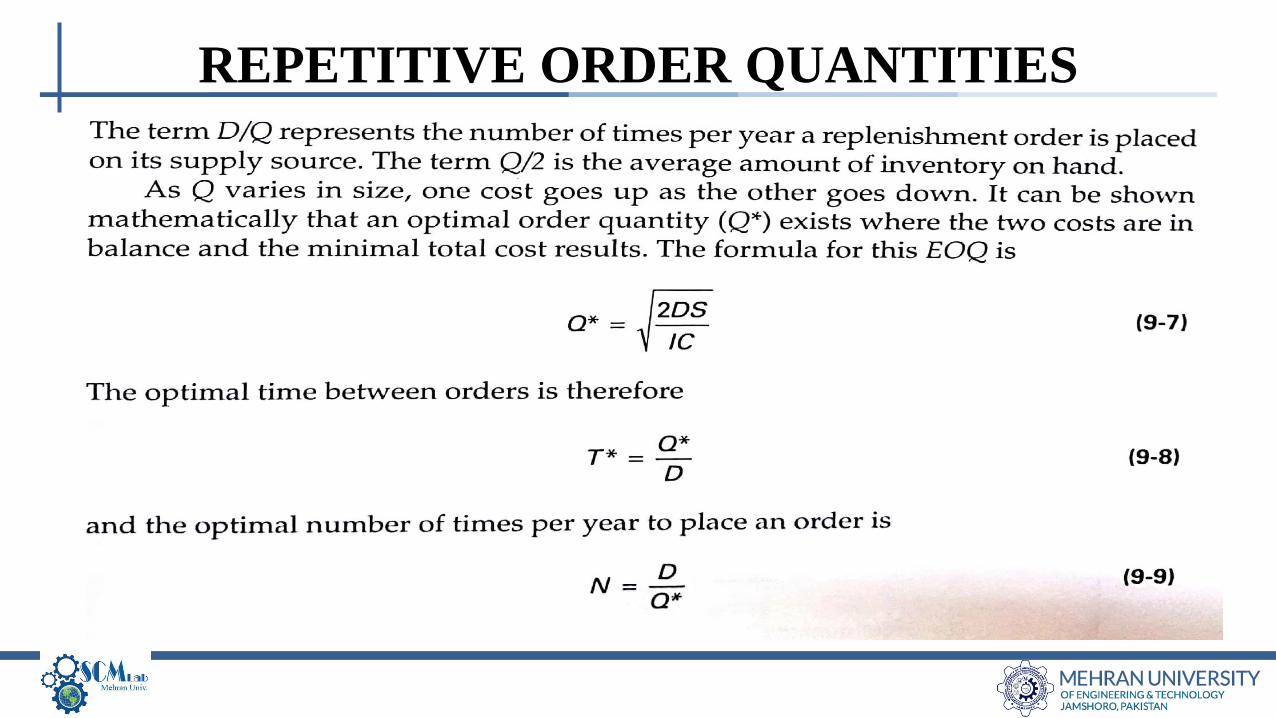
REPETITIVE ORDER QUANTITIES
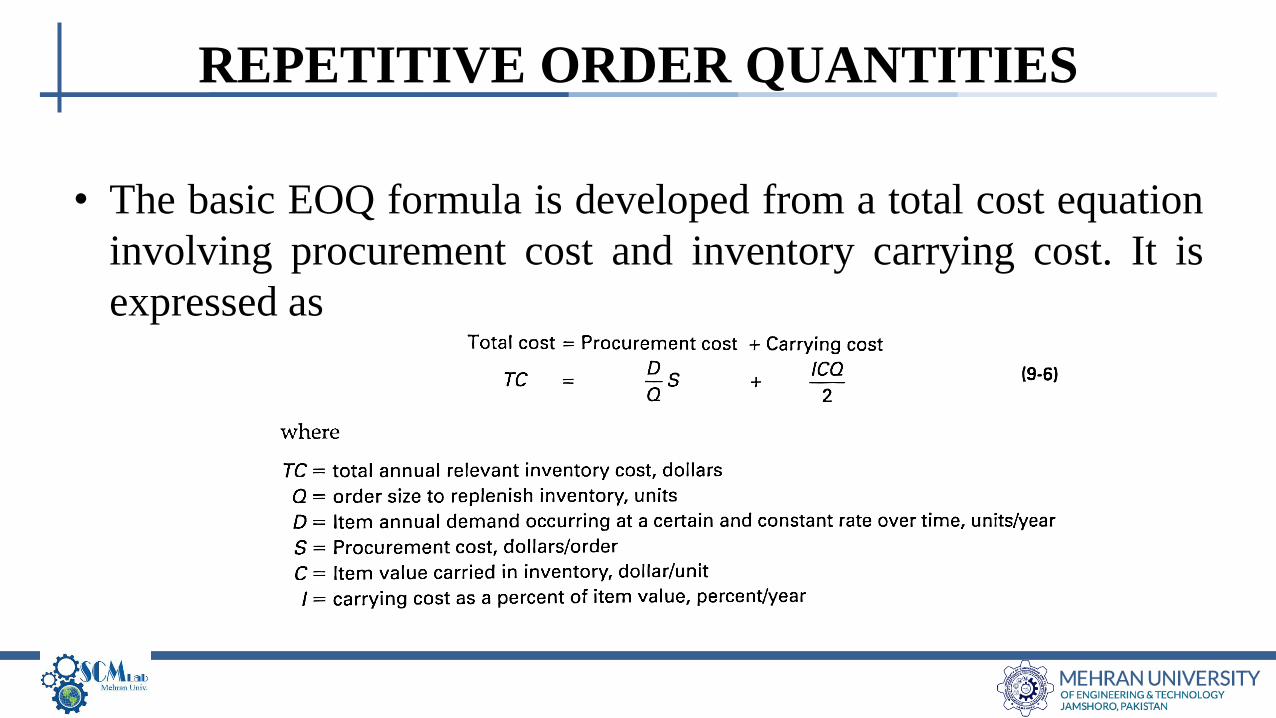
• The basic EOQ formula is developed from a total cost equation
involving procurement cost and inventory carrying cost. It is
expressed as
REPETITIVE ORDER QUANTITIES
REPETITIVE ORDER QUANTITIES
REPETITIVE ORDER QUANTITIES
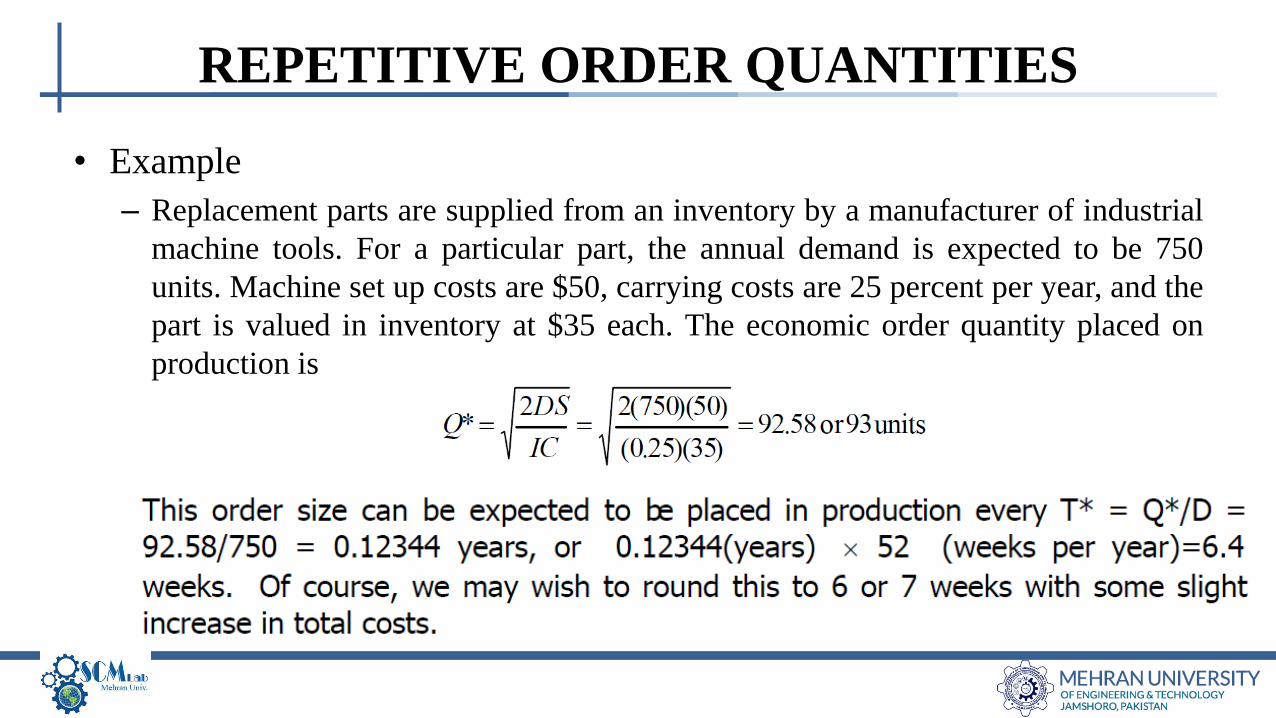
• Example
– Replacement parts are supplied from an inventory by a manufacturer of industrial
machine tools. For a particular part, the annual demand is expected to be 750
units. Machine set up costs are $50, carrying costs are 25 percent per year, and the
part is valued in inventory at $35 each. The economic order quantity placed on
production is
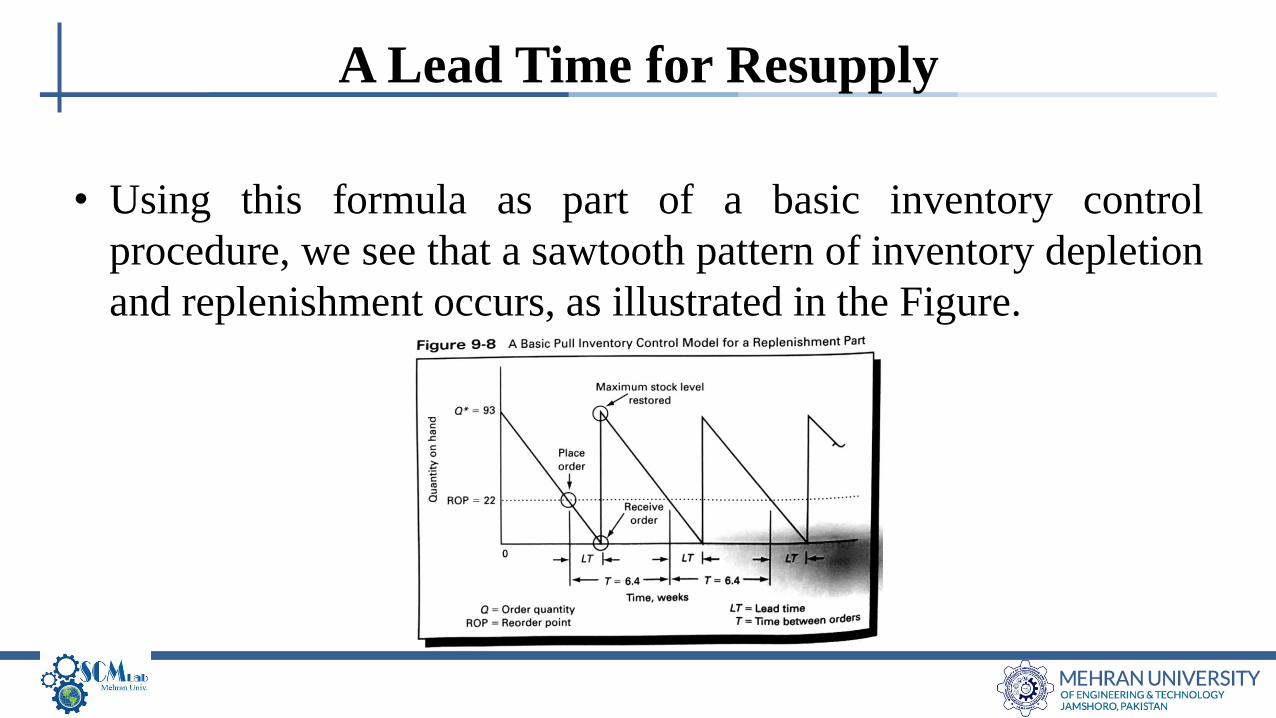
• Using this formula as part of a basic inventory control
procedure, we see that a sawtooth pattern of inventory depletion
and replenishment occurs, as illustrated in the Figure.
A Lead Time for Resupply
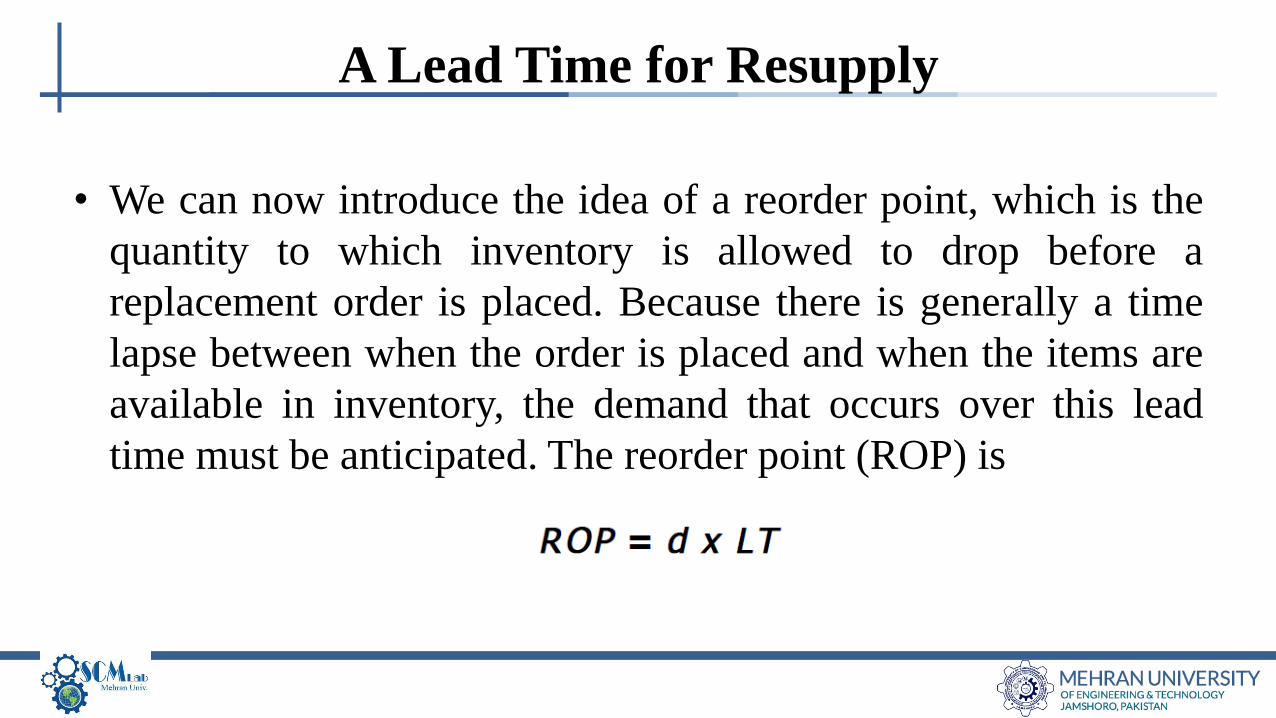
• We can now introduce the idea of a reorder point, which is the
quantity to which inventory is allowed to drop before a
replacement order is placed. Because there is generally a time
lapse between when the order is placed and when the items are
available in inventory, the demand that occurs over this lead
time must be anticipated. The reorder point (ROP) is
A Lead Time for Resupply
A Lead Time for Resupply
A Lead Time for Resupply

• Advanced pull control of inventories means that we begin to
recognize that demand and lead time cannot be known for sure.
Therefore, we must plan for the situation where not enough
stock may be on hand to fill customer requests.
• In addition to the regular stock that is maintained for the
purpose of meeting average demand and average lead time, an
increment of inventory is added.
ADVANCED PULL INVENTORY CONTROL
• Finding Q* and ROP– Reorder point inventory control assumes that demand is perpetual and continually
acts on inventory to reduce its level.
– When inventory is depleted to the point where its level is equal to or less than aspecified quantity called the reorder point, an economic order quantity of Q* isplaced on the supplying source to replenish the inventory.
– The effective inventory level at a particular point in time is the quantity on handplus the stock on order less any commitments against the inventory, such ascustomer back orders or allocations to production.
– The entire quantity Q* arrives at a point in time offset by the lead time. Betweenthe time that the replenishment order is placed at the reorder point and when itarrives in stock, there is a risk that demand will exceed the remaining amount ofinventory. We control the probability of this occurring by raising or lowering thereorder point, and by adjusting Q*.
A REORDER POINT MODEL WITH UNCERTAIN DEMAND
• Finding Q* and ROP
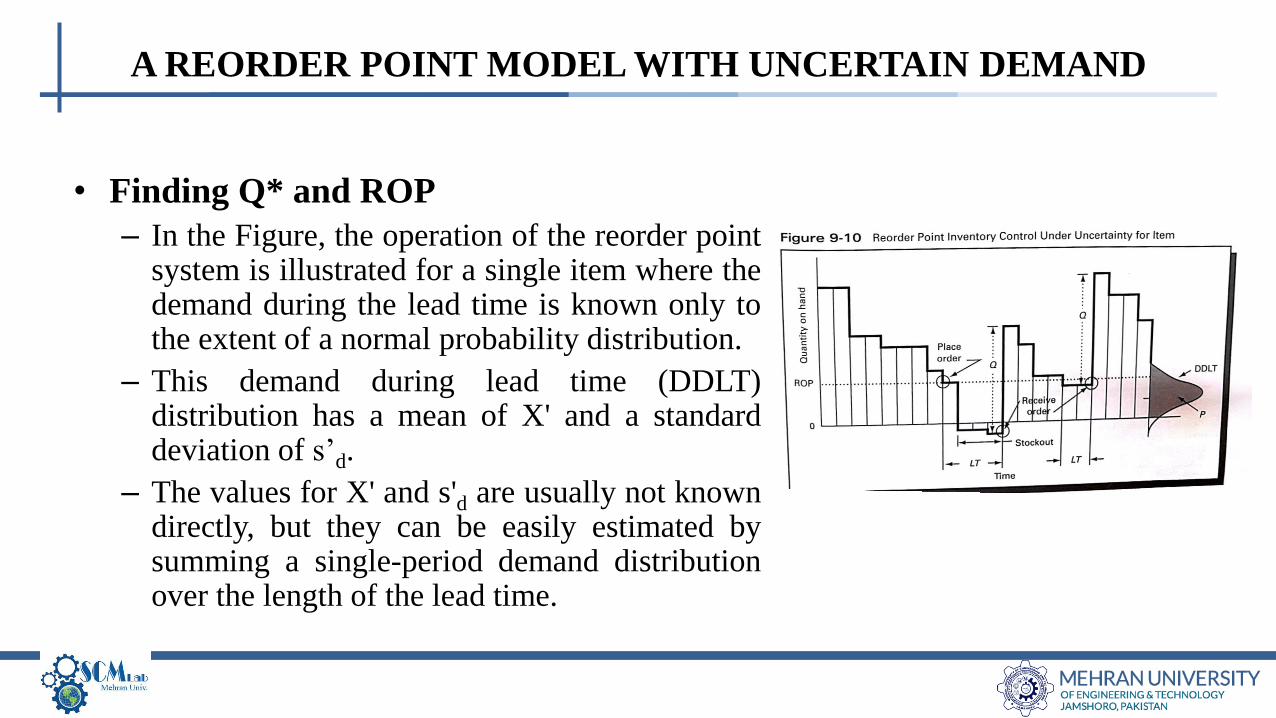
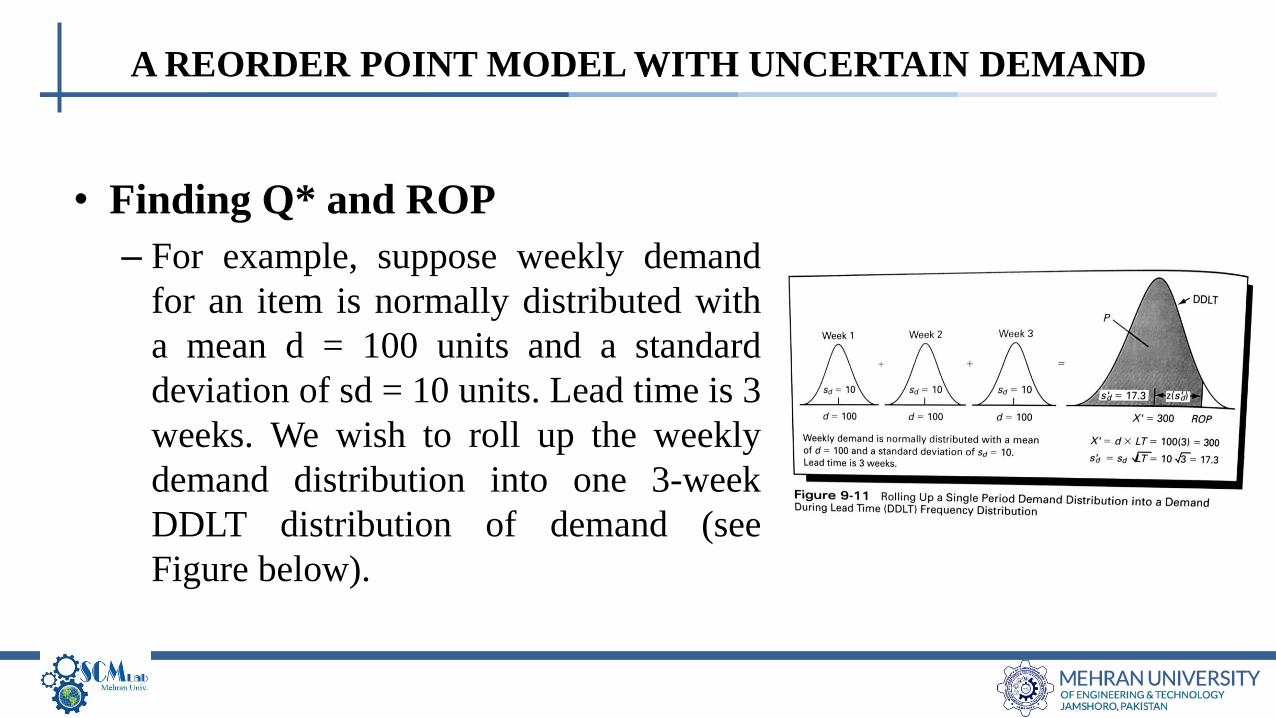
– In the Figure, the operation of the reorder pointsystem is illustrated for a single item where thedemand during the lead time is known only tothe extent of a normal probability distribution.
– This demand during lead time (DDLT)distribution has a mean of X' and a standarddeviation of s’d.
– The values for X' and s'd are usually not knowndirectly, but they can be easily estimated bysumming a single-period demand distributionover the length of the lead time.
A REORDER POINT MODEL WITH UNCERTAIN DEMAND
• Finding Q* and ROP
– For example, suppose weekly demand
for an item is normally distributed with
a mean d = 100 units and a standard
deviation of sd = 10 units. Lead time is 3
weeks. We wish to roll up the weekly
demand distribution into one 3-week
DDLT distribution of demand (see
Figure below).
A REORDER POINT MODEL WITH UNCERTAIN DEMAND
• Finding Q* and ROP
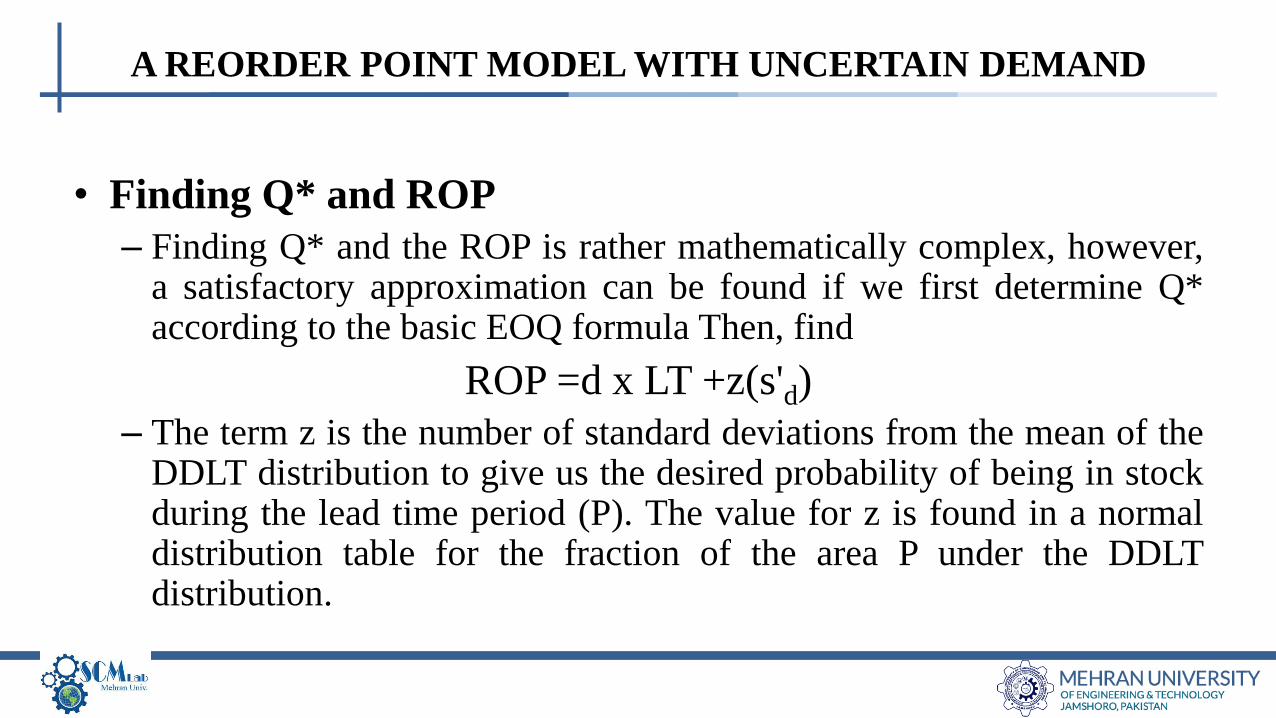
– Finding Q* and the ROP is rather mathematically complex, however,a satisfactory approximation can be found if we first determine Q*according to the basic EOQ formula Then, find
ROP =d x LT +z(s'd)
– The term z is the number of standard deviations from the mean of theDDLT distribution to give us the desired probability of being in stockduring the lead time period (P). The value for z is found in a normaldistribution table for the fraction of the area P under the DDLTdistribution.
A REORDER POINT MODEL WITH UNCERTAIN DEMAND
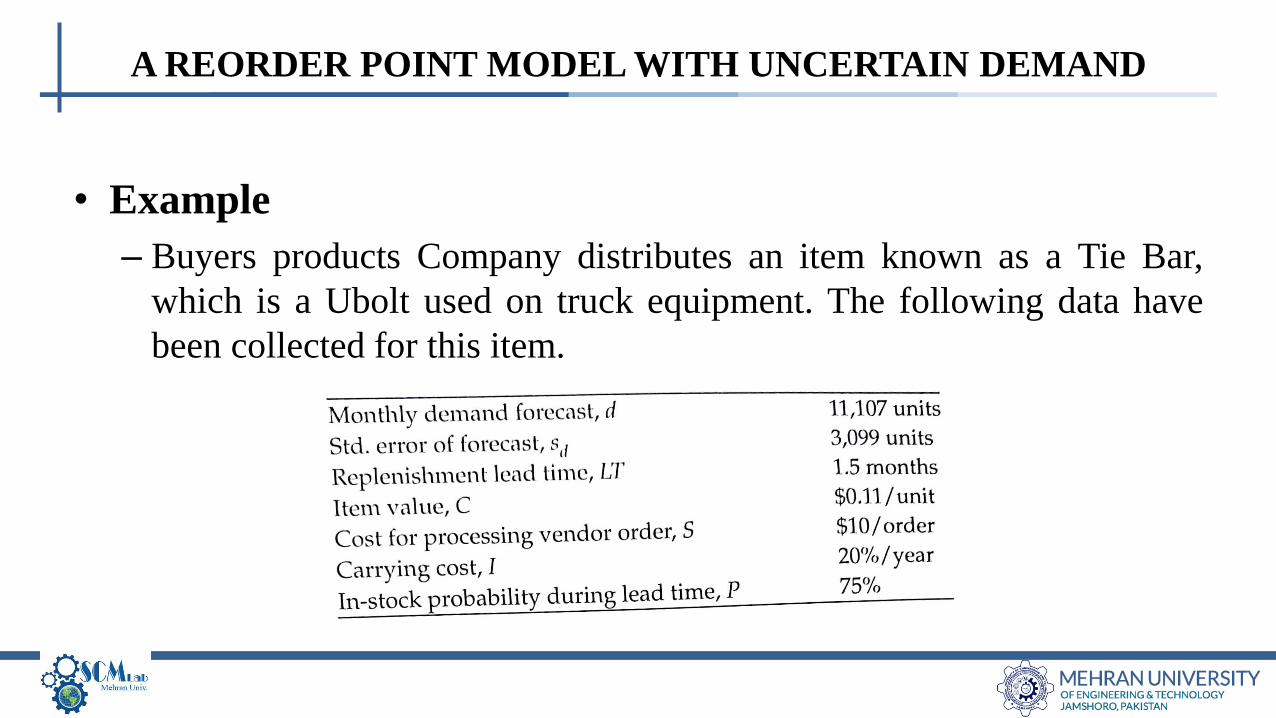
• Example
– Buyers products Company distributes an item known as a Tie Bar,
which is a Ubolt used on truck equipment. The following data have
been collected for this item.
A REORDER POINT MODEL WITH UNCERTAIN DEMAND
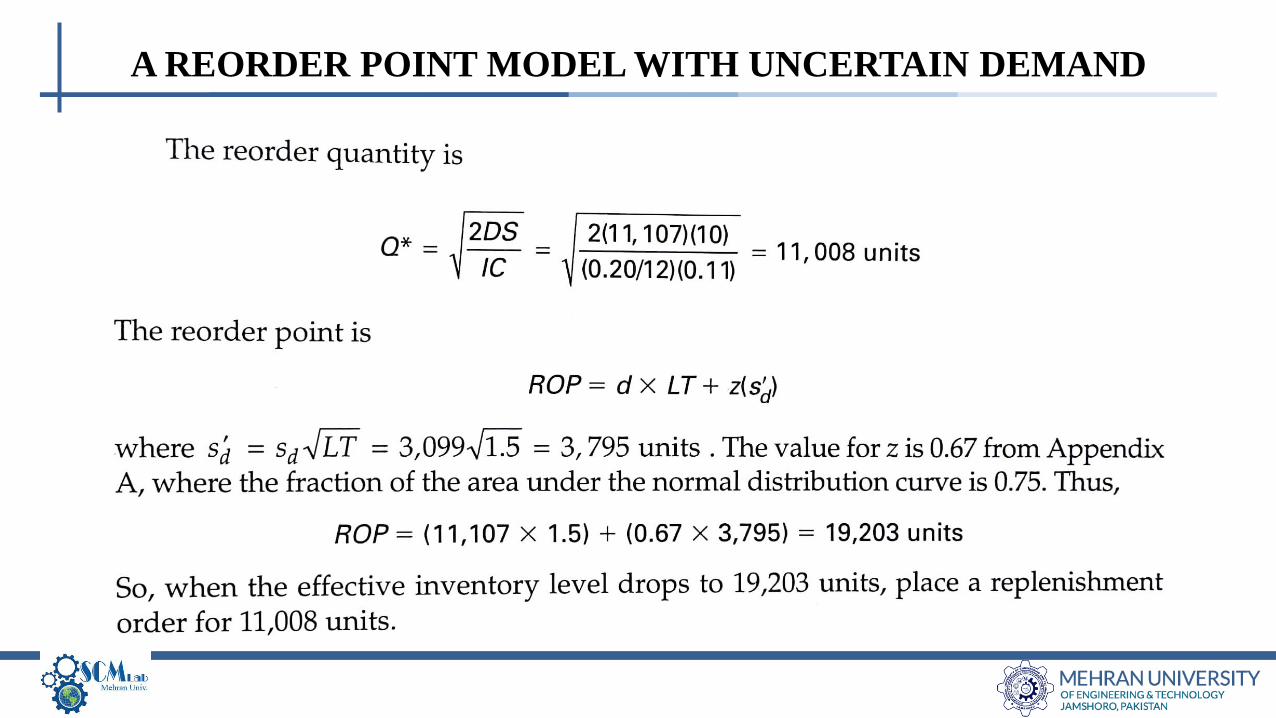
A REORDER POINT MODEL WITH UNCERTAIN DEMAND
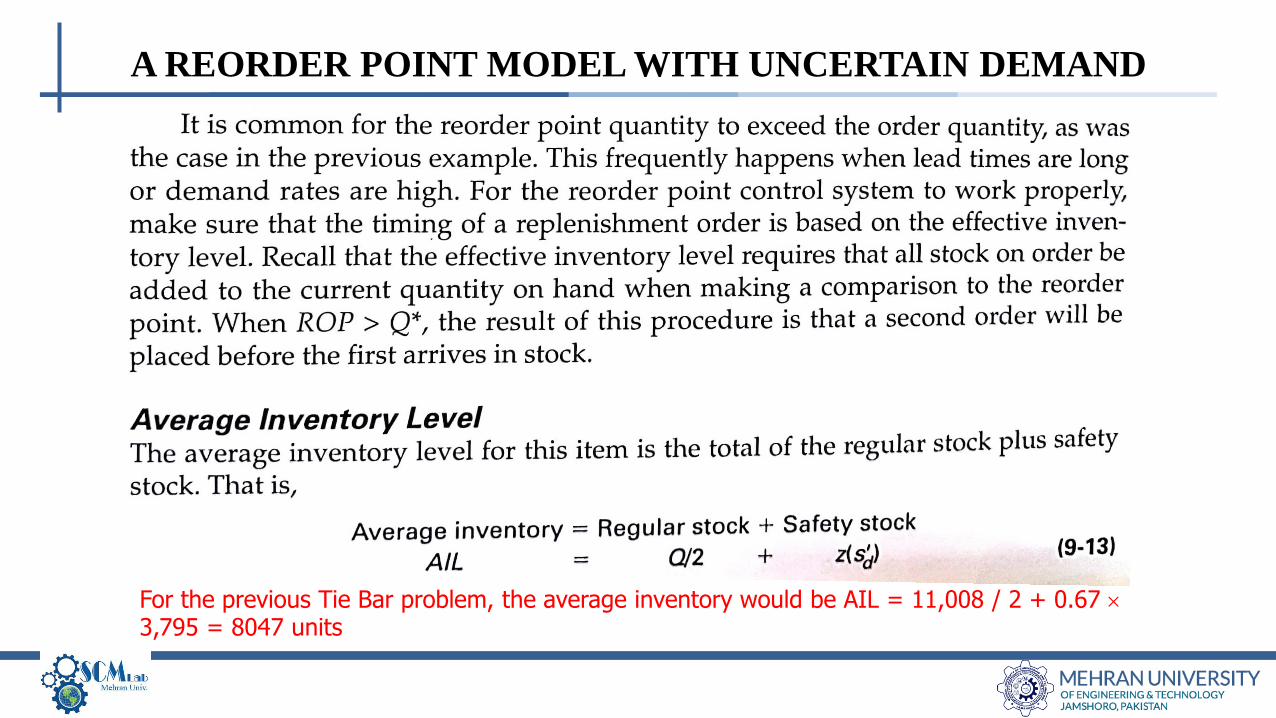
A REORDER POINT MODEL WITH UNCERTAIN DEMAND
For the previous Tie Bar problem, the average inventory would be AIL = 11,008 / 2 + 0.67 3,795 = 8047 units
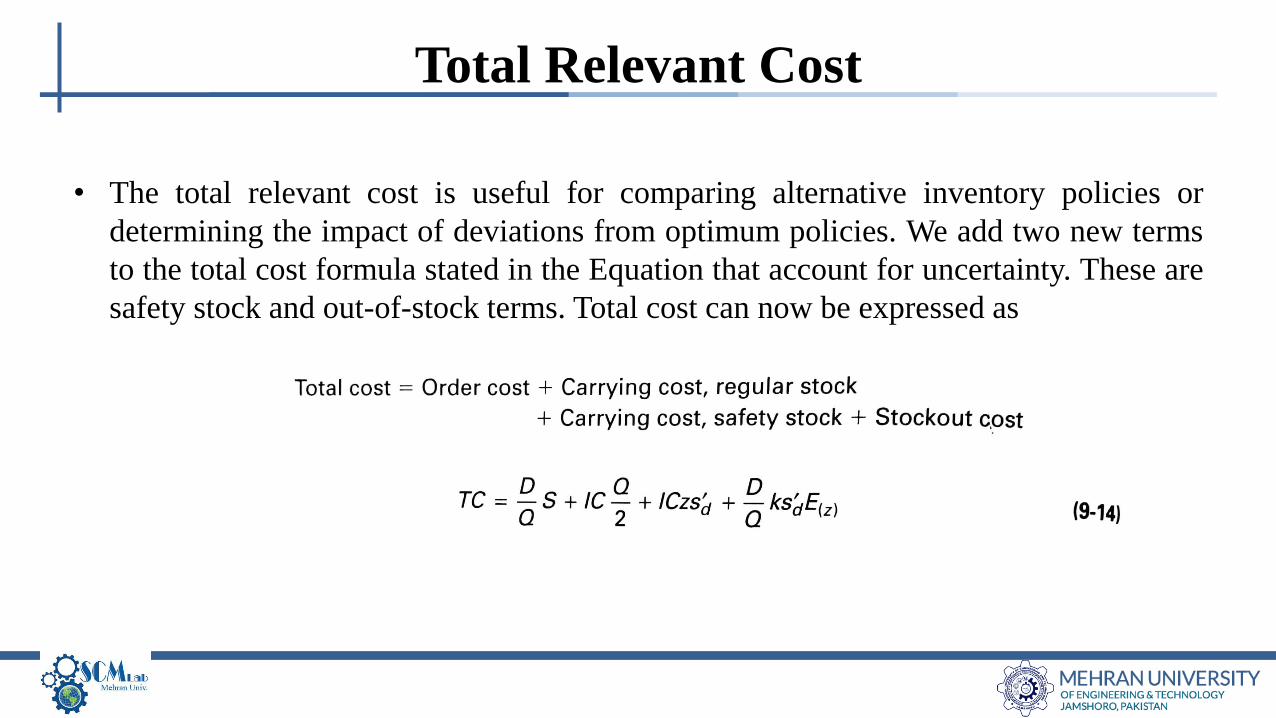
• The total relevant cost is useful for comparing alternative inventory policies or
determining the impact of deviations from optimum policies. We add two new terms
to the total cost formula stated in the Equation that account for uncertainty. These are
safety stock and out-of-stock terms. Total cost can now be expressed as
Total Relevant Cost
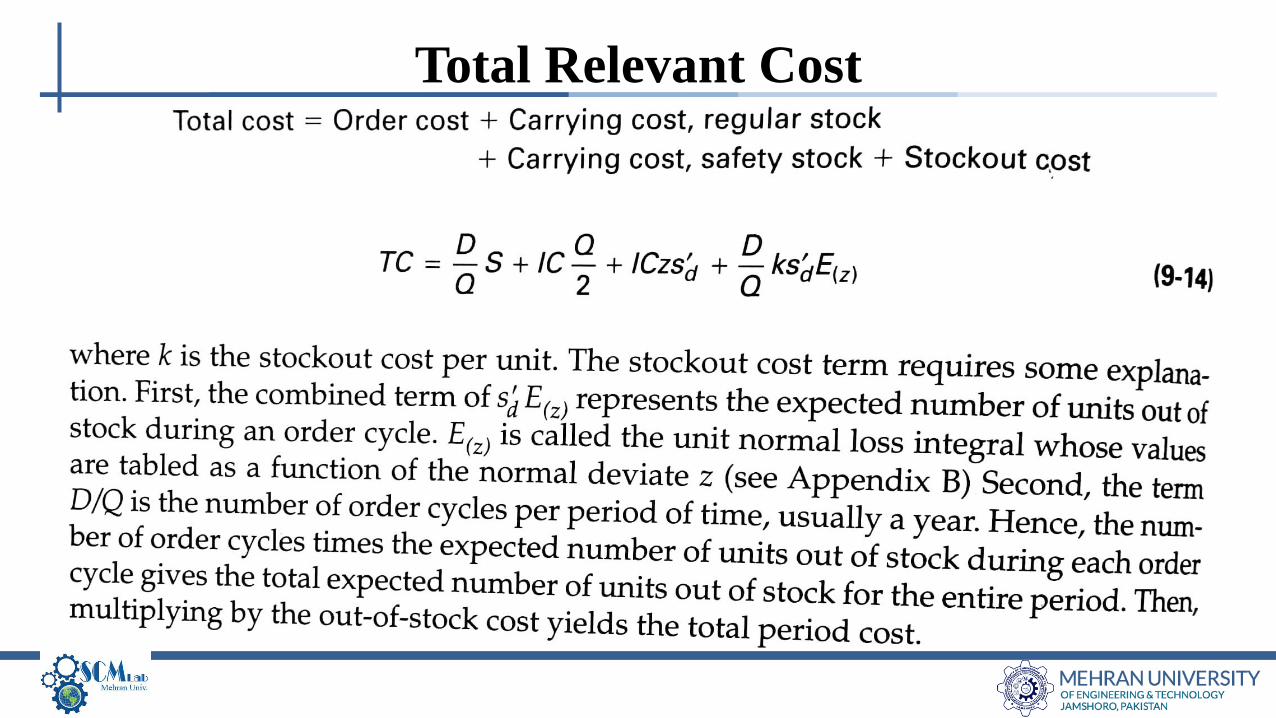
Total Relevant Cost
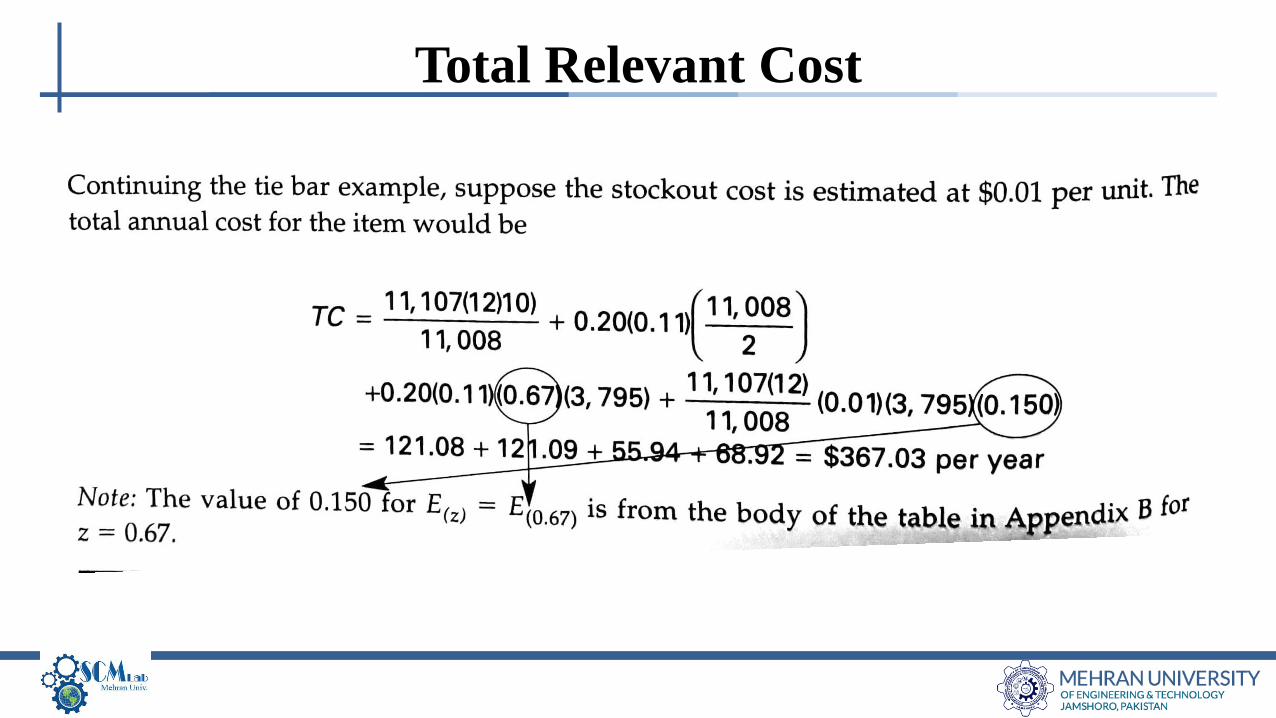
Total Relevant Cost
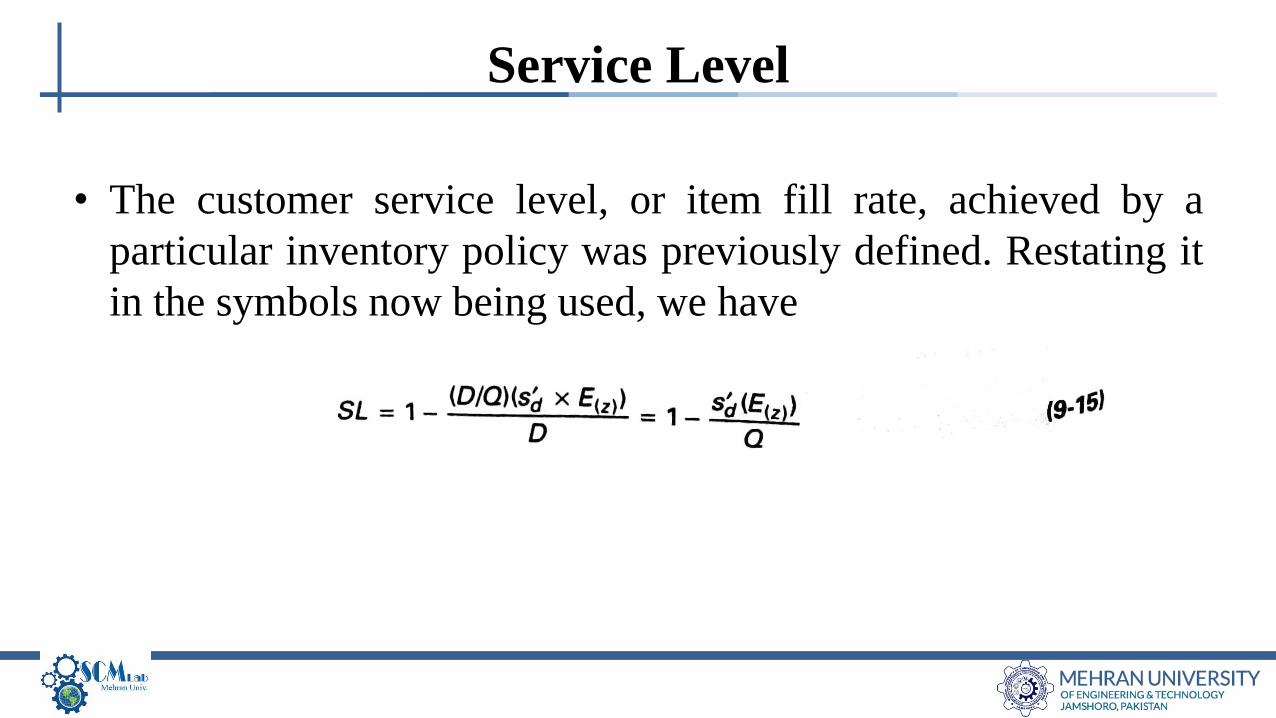
• The customer service level, or item fill rate, achieved by a
particular inventory policy was previously defined. Restating it
in the symbols now being used, we have
Service Level
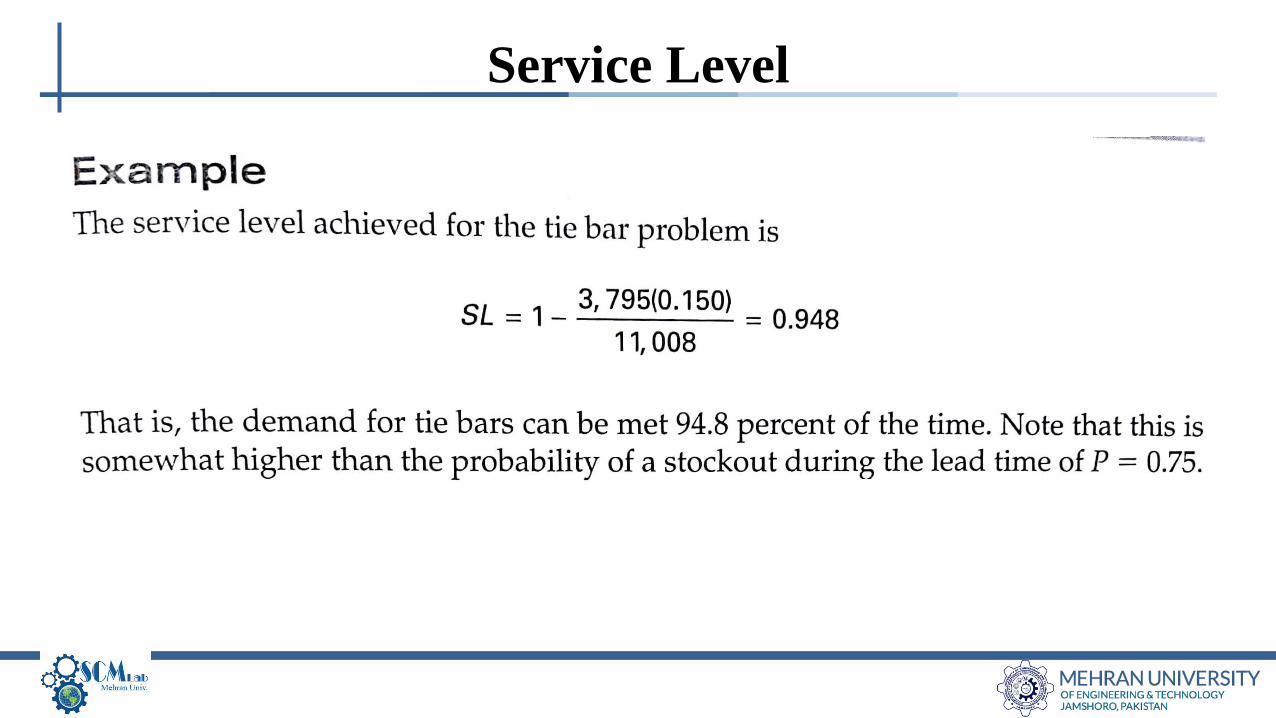
Service Level
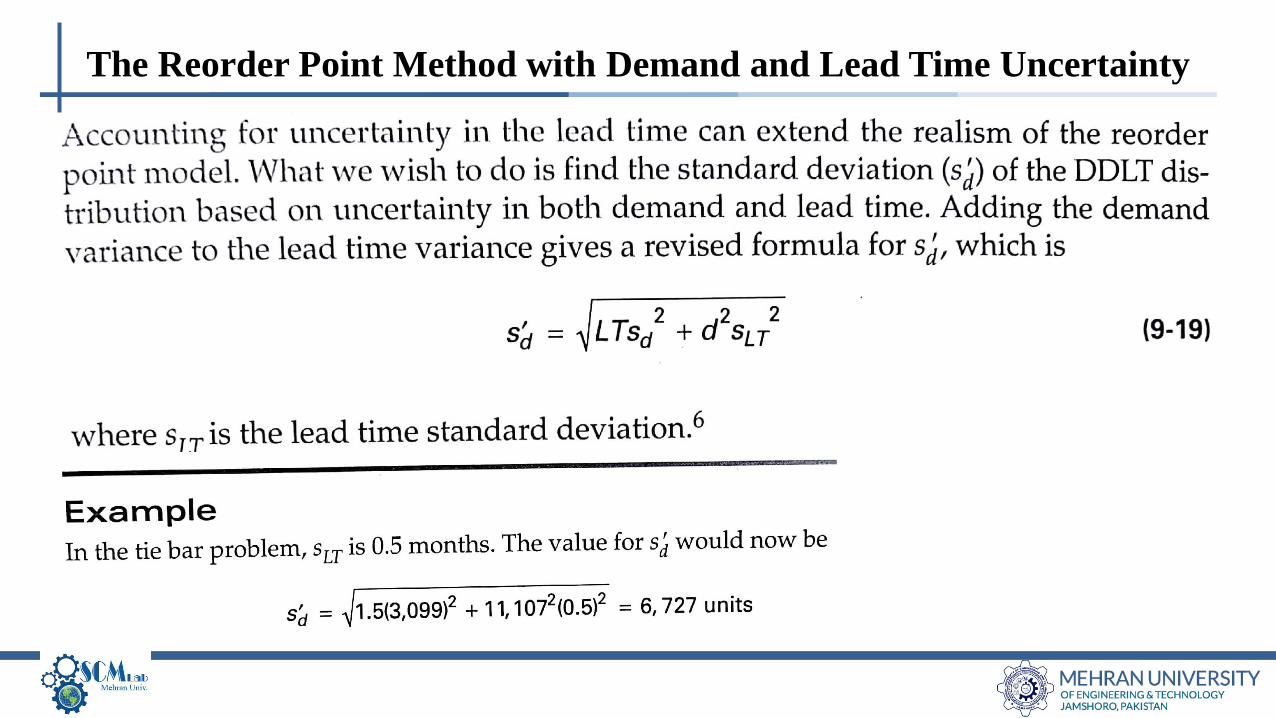
The Reorder Point Method with Demand and Lead Time Uncertainty