supply chain development at sandvik mining rock...
TRANSCRIPT
Table of Content
(McIntosh, 2007) (Chiesa & Masella, 1996)
Supply Chain Development at Sandvik Mining Rock Tools A case study in material and information flow development between Sandvik Mining Rock Tools and Ockelbo Lego-Mek Master of Science Thesis in Supply Chain Management
ISAAK MARTINEZ BENAVIDES
TARIK ZAHIROVIC Department of Technology Management and Economics Division of Quality Sciences CHALMERS UNIVERSITY OF TECHNOLOGY Gothenburg, Sweden, 2013 Report No. E2013:021

Supply Chain Development at Sandvik Mining Rock Tools A case study in material and information flow development between Sandvik Mining Rock
Tools and Ockelbo Lego-Mek
Master of Science Thesis in Supply Chain Management
ISAAK MARTINEZ BENAVIDES & TARIK ZAHIROVIC
Department of Technology Management and Economics
CHALMERS UNIVERSITY OF TECHNOLOGY
Gothenburg, Sweden 2013
Report no. E2013:021

Supply Chain Development at Sandvik Mining Rock Tools A case study in material and information flow development between Sandvik Mining Rock Tools and Ockelbo Lego-Mek ISAAK MARTINEZ BENAVIDES TARIK ZAHIROVIC
© MARTINEZ BENAVIDES, ISAAK & ZAHIROVIC, TARIK 2013 Technical report no. E2013:021 Division of Quality Sciences Department of Technology Management and Economics Chalmers University of Technology SE-412 96 Gothenburg Sweden Telephone: + 46 (0)31-772 1000

Acknowledgements
i
Acknowledgements This case study composes the finalizing part of the Master of Science Degree´s program in Supply Chain Management at Chalmers University. The case study was performed in collaboration with Sandvik Mining Rock Tools and it has been very instructive since it has given us the opportunity to apply our theoretical knowledge to a concrete case study.
The authors would like to thank all the employees that have made it possible for us to perform this case study. Special thank to Rolf Martinsson and Johan Basth who gave us the opportunity to perform the case study at Sandvik and who also have been supportive and inspired us throughout the case study.
Furthermore, we would like to give a special thanks to our supervisor, Kristian Siverbo and our examiner Sverker Alänge at Chalmers University for providing us with valuable inputs and constructive criticism during the case study.
Our biggest thanks go to our families for their support and understanding during not only the case study, but also during our entire student time.
Gothenburg. May 2013
Isaak Martinez Benavides Tarik Zahirović
Abstract
ii
Abstract Due to a very competitive market, forcing companies for cutting cost, each waste is important to deal with, for instance longer lead times than needed or low delivery precision. One of Sandvik Mining’s lego supplier’s delivery precision and lead times have been varying, which has created the interest in investigate the relationship between the companies in order to identify improvements. An investigation in form of a case study was performed by a student group at Sandvik Mining in order to investigate this relationship that Sandvik Mining has with this lego supplier, Ockelbo Lego-‐Mek (OLM). The processes, material and information flow between the companies has been mapped and further analyzed. The analyses are based on interviews, observations and data provided by Sandvik Mining. The analysis shows that there is a great potential for improvement in all areas. Therefore, a new material flow is presented, giving Sandvik Mining the possibility to cut costs in form of holding and transportation costs. Furthermore, the analysis of the information flow proposes a new organization structure towards OLM considering standard products while the already existing product organization structure should be kept when considering new and test products. The new organization structure ought to enable a more straightforward communication which also should eliminate some of the existing issues, for instance priority issues. Finally, an analysis regarding the processes is presented and shows that processes involved with OLM are in lack of control documents and are in need of standardization in order to enable continuous improvements. The conclusions are wrapped up and presented as an action plan, however some conclusions has been questioned by the student group.
Keywords: material flow, information flow, processes, supply chain management, supplier development, cost savings

Table of Content
iii
Table of Content 1 Introduction ................................................................................................................................................................... 2 1.1 Background ........................................................................................................................................................... 2 1.2 Company background ....................................................................................................................................... 2 1.3 Ockelbo Lego-‐Mek .............................................................................................................................................. 3 1.4 Problem description .......................................................................................................................................... 3 1.5 Purpose and research objectives ................................................................................................................. 3 1.6 Delimitations ........................................................................................................................................................ 4 1.7 Disposition ............................................................................................................................................................. 5
2 Theoretical framework ............................................................................................................................................. 8 2.1 Supply Chain Management ............................................................................................................................. 8 2.1.1 Supply Chain enablers .............................................................................................................................. 9 2.1.2 Organizational structures .................................................................................................................... 10 2.1.3 Information flow in the Supply Chain ............................................................................................ 10
2.2 Lean Production ............................................................................................................................................... 11 2.2.1 Waste ............................................................................................................................................................ 12 2.2.2 Standardized work ................................................................................................................................. 12 2.2.3 Lead time .................................................................................................................................................... 12 2.2.4 Tied up capital .......................................................................................................................................... 13 2.2.5 Holding cost ............................................................................................................................................... 13
2.3 Delivery service parameters ....................................................................................................................... 13 2.3.1 Delivery precision ................................................................................................................................... 14 2.3.2 Delivery assurance ................................................................................................................................. 14 2.3.3 Delivery time ............................................................................................................................................. 14 2.3.4 Delivery flexibility ................................................................................................................................... 14
2.4 Processes ............................................................................................................................................................. 14 2.4.1 Process flow analysis ............................................................................................................................. 15
3 Method .......................................................................................................................................................................... 20 3.1 Type of study ..................................................................................................................................................... 20 3.2 Purpose of method .......................................................................................................................................... 21 3.3 Data gathering ................................................................................................................................................... 21 3.3.1 Documents ................................................................................................................................................. 21 3.3.2 Interviews ................................................................................................................................................... 21 3.3.3 Direct observation .................................................................................................................................. 21
3.4 Literature ............................................................................................................................................................ 21 3.5 Method analysis ................................................................................................................................................ 22 3.6 Method discussion ........................................................................................................................................... 22
4 Empirical data ............................................................................................................................................................ 26

Table of Content
iv
4.1 Sandvik Mining ................................................................................................................................................. 26 4.1.1 Sandvik Mining Rock Tools ................................................................................................................. 26
4.2 Material Flow ..................................................................................................................................................... 27 4.2.1 Ovako AB ..................................................................................................................................................... 30 4.2.2 Tibnor AB .................................................................................................................................................... 30
4.3 Information flow between Sandvik Mining and OLM ...................................................................... 30 4.3.1 Intra and inter communication flow ............................................................................................... 30 4.3.2 Prioritization issues and rules ........................................................................................................... 33
4.4 Roles involved with OLM .............................................................................................................................. 34 4.4.1 Designers .................................................................................................................................................... 34 4.4.2 Order processors ..................................................................................................................................... 36 4.4.3 Production technicians ......................................................................................................................... 41 4.4.4 Planner ......................................................................................................................................................... 43 4.4.5 Goods receiving ........................................................................................................................................ 44 4.4.6 Purchaser .................................................................................................................................................... 45
4.5 Quality insurance process ............................................................................................................................ 46 4.5.1 Quality Engineer ...................................................................................................................................... 46 4.5.2 Quality controller .................................................................................................................................... 48 4.5.3 Measuring department ......................................................................................................................... 49
4.6 Summary of empirical data ......................................................................................................................... 50 5 Analysis ......................................................................................................................................................................... 54 5.1 Material flow analysis .................................................................................................................................... 54 5.1.1 Material flow – business case ............................................................................................................ 55 5.1.2 Material flow summary ........................................................................................................................ 57
5.2 Information flow analysis ............................................................................................................................ 58 5.2.1 Supply chain information flow analysis ........................................................................................ 58 5.2.2 Internal structure analysis .................................................................................................................. 59 5.2.3 Information flow summary ................................................................................................................. 62
5.3 Processes analysis ........................................................................................................................................... 63 5.4 Action plan .......................................................................................................................................................... 63
6 Discussion .................................................................................................................................................................... 66 6.1 Is the new material flow the primary solution to the actual problem? .................................... 66 6.2 Will the new material flow be beneficial for all parties? ................................................................ 66
7 Conclusion ................................................................................................................................................................... 70 8 References ................................................................................................................................................................... 71 9 Appendices .................................................................................................................................................................. 74 9.1 Appendix A: Questionnaire .......................................................................................................................... 74 9.2 Appendix B: Customers ................................................................................................................................. 75
Table of Content
v
Table of figures FIGURE 1-‐1: ORGANIZATIONAL STRUCTURE. .......................................................................................................... 3 FIGURE 2-‐1: SUPPLY CHAIN MANAGEMENT (LYSON & FARRINGTON, 2012, S. 93). ............................................... 8 FIGURE 2-‐2: PROCESSES IN AN ORGANIZATION (BERGMAN & KLEFSJÖ, 2010, S. 458). ....................................... 15 FIGURE 2-‐3: EXAMPLE OF A FLOWCHART. ............................................................................................................ 16 FIGURE 3-‐1: METHODOLOGICAL APPROACH ........................................................................................................ 22 FIGURE 4-‐1: ROCK TOOLS PRODUCTS. ................................................................................................................... 27 FIGURE 4-‐2: CURRENT MATERIAL FLOW. .............................................................................................................. 28 FIGURE 4-‐3: MATERIAL FLOW BETWEEN SUPPLIERS, SANDVIK MINING AND OLM. ............................................. 29 FIGURE 4-‐4: ORGANIZATION STRUCTURE INVOLVED WITH OLM. ........................................................................ 31 FIGURE 4-‐5: ILLUSTRATION OF THE COMMUNICATION BETWEEN SUB-‐DEPARTMENTS AT SANDVIK MINING AND
OLM. ............................................................................................................................................................. 32 FIGURE 4-‐6: INDIVIDUAL COMMUNICATION NETWORK WITHIN SANDVIK MINING AND TOWARDS OLM. ......... 33 FIGURE 4-‐7: DESIGNERS´ PROCESS WHEN DEVELOPING NEW PRODUCTS. .......................................................... 35 FIGURE 4-‐8: DESIGNERS´ PROCESS WHEN CONTACTED FOR CLARIFICATIONS. .................................................... 36 FIGURE 4-‐9: ORDER PROCESSOR PROCESS FOR SHORT AND LONG PRODUCTS. .................................................. 38 FIGURE 4-‐10: ORDER PROCESSOR PROCESS FOR SHORT PRODUCTS. ................................................................... 40 FIGURE 4-‐11: PRODUCTION TECHNICIAN PROCESS. ............................................................................................. 42 FIGURE 4-‐12: PRODUCTION TECHNICIAN PROCESS 2. .......................................................................................... 43 FIGURE 4-‐13: PLANNER PROCESS. ......................................................................................................................... 44 FIGURE 4-‐14: GOODS RECEIVER PROCESS. ............................................................................................................ 45 FIGURE 4-‐15: QUALITY ENGINEER PROCESS WHEN PROBLEM DETECTED ON NEW PRODUCTS AT OLM. ............ 47 FIGURE 4-‐16: QUALITY ENGINEER PROCESS WHEN OLM FINDS DEVIATION AFTER PRODUCTION. ..................... 48 FIGURE 4-‐17: QUALITY CONTROLLER PROCESS. .................................................................................................... 49 FIGURE 4-‐18: MEASURING OPERATOR PROCESS. ................................................................................................. 50 FIGURE 5-‐1: ILLUSTRATION OF THE MATERIAL FLOW IN THE CONTINGENT CASE WHERE OLM BUYS THE
MATERIAL ..................................................................................................................................................... 55 FIGURE 5-‐2: ALTERNATIVE COMMUNICATION STRUCTURE BETWEEN DEPARTMENTS FOR STANDARD
PRODUCTS .................................................................................................................................................... 60 FIGURE 5-‐3: ALTERNATIVE COMMUNICATION STRUCTURE BETWEEN INDIVIDUALS FOR STANDARD PRODUCTS
...................................................................................................................................................................... 60 FIGURE 5-‐4: ACTION PLAN ..................................................................................................................................... 64
Table of Tables TABLE 1-‐1: DISPOSITION .......................................................................................................................................... 5 TABLE 4-‐1: SUPPLIER DELIVERY ............................................................................................................................. 29 TABLE 4-‐2: FORECAST IN KILOGRAMS OF MATERIAL GOING TO OLM .................................................................. 30 TABLE 4-‐3: EXISTING CONTROL DOCUMENTS FOR EACH ROLE INVOLVED WITH OLM ........................................ 51 TABLE 5-‐1: FORECAST IN KILOGRAMS OF MATERIAL GOING TO OLM .................................................................. 56 TABLE 5-‐2: TOTAL MATERIAL COST BASED ON FORECAST AND MATERIAL PRICE ................................................ 56
Introduction
1
Introduction This chapter presents the case study, the purpose of it and how the disposition looks.

Introduction
2
1 Introduction In this chapter the case study is introduced. The background of the problem, the reason for the case study and the purpose with the case study is also presented. All information without references is referred to the interviews.
1.1 Background In order to survive and become a strong competitor companies need to get the right products, at the right price and time. This puts responsibility on the suppliers´ delivery and quality precision. To achieve this and in order to match supply and demand it is required that uncertainties within the supply chain is reduced as much as possible. This requires the information flow to be constant, accurate and in time, which in turn facilitates to create a good product flow (Lambert & Cooper, 2000). (Christopher, 2001)
Presently a vast majority of all companies outsource a part of their production. One reason is that companies lack core competencies for certain products and rather spend their time on processes they do distinctively well. Hence, letting other companies produce a part of their products. In order to have a good relationship it is necessary to have, good communication between customer and supplier, mutual benefits, shared goals and realistic expectations from both parties. Without these elements there is a risk for disappointment and a poor relationship. Furthermore, outsourcing is linked with more transportation and therefore it is important that those are efficient in order to keep the transportation costs as low as possible. (Logan, 2000)
Sandvik Mining which is the investigated company in this case study outsources a part of their production to ordinary supply chain suppliers as well as to one lego supplier Ockelbo Lego-‐Mek (OLM). The problem is that the relationship between Sandvik Mining and OLM has become on a friendly basis with no clear boundaries or authorities. In addition, there seems to be more interfaces towards OLM than needed. As a consequence Sandvik Mining is facing several problems with the information flow towards OLM. Furthermore, the material flow seems not be optimal. The delivery precision for instance is low and the lead times are inaccurate and volatile. In addition, priority issues seems also to be a problem due to all the interfaces towards OLM, which might have an influence on the lead times and delivery precision. This has created an urge to investigate the relationship with OLM regarding both the material and information flow in order to identify possible improvements in these two areas.
1.2 Company background Sandvik AB was founded in 1862, by Göran Fredrik Göransson in Sandviken. Sandvik AB first started out by producing steel in a successful way due to that Göransson were the first one who successfully managed to use the Bessermer-‐method in an industrial scale. Sandvik AB has during the years had different markets such as production of saws which 1999 was phased out. Sandvik AB’s strategy is “One Sandvik to be number one”, with the ambition to be number one in every business area. Sandvik AB is today divided into five business areas, which are Sandvik Mining, Sandvik Machining Solutions, Sandvik Materials Technology, Sandvik Construction and Sandvik Venture. The organizational structure is illustrated in Figure 1-‐1 below (Sandvik, 2013).

Introduction
3
Figure 1-‐1: Organizational structure.
Today is Sandvik AB represented in 130 countries and has about 50 000 employees where 5500 are located at the facilities in Sandviken. The revenue for 2011 was 94 billion SEK and the profit was about 5,8 billion SEK. (Sandvik, 2011)
1.3 Ockelbo Lego-‐Mek Ockelbo Lego-‐Mek (OLM) is a lego supplier located approximately 35 kilometers from Sandvik Mining in Sandviken. The company is 100% dependent on Sandvik Mining and has been so ever since the company was founded in 1984. OLM has currently 27 employees and a revenue of 32MSEK (Allabolag, 2011). OLM is seen as a natural complement to Sandvik´s production since they produce small batches of odd products with which Sandvik Mining does not want to interrupt their main production. The company is flexible in terms of capability to produce a variety of products and has the reputation of delivering highly qualitative products.
1.4 Problem description During 2012 the delivery precision from OLM has been varying a lot, with an average of 76 %, which has resulted in varying lead times. This problem seems not to depend only on OLM, but also on Sandvik Mining. One of the biggest contributors to this problem seems to be poor information flow between the two companies, which according to Christopher (2001) is one of the most important aspects to become a strong competitor. One other aspect that might affect the delivery precision is the amount of interfaces between the companies. Furthermore, as stated previously by Lambert & Cooper (2000) a good information flow enables a good material flow; therefore it is important to investigate this matter since the material flow is one of the problems that Sandvik Mining is facing with OLM for the moment. Vanpoucke et al (2009) argues that supply chains with vast information sharing are performing better and as stated above the information sharing between the companies is poor which contributes to a varying delivery precision. Therefore, an increase in information sharing could generate an improvement in delivery precision. This raises the interest and gives the opportunity to investigate the issue and thereby identify improvements for the information and material flow and possibly identify a potential for cost reduction.
1.5 Purpose and research objectives The purpose with this case study is to clarify Sandvik Mining´s overall relationship with OLM by mapping the material and information flow between these two companies and also the processes of the different roles at Sandvik Mining that are involved with OLM. In addition, improvement proposals and recommendations for these subjects will be given.
To fulfill the purpose, three main research questions with objectives have been identified and will be investigated. All investigations should include the roles that are involved and briefly
Introduction
4
describe what is done in each step. To answer the research questions a few objectives have been developed, which can be seen below
• How does the material flow between Sandvik Mining and OLM look like in the current situation?
o Map the material flow between Sandvik Mining and OLM o Pinpoint the amount of incoming material and frequency of the deliveries o Investigate if there is enough space and resources to handle the incoming
material
• How does the intra and inter information flow between Sandvik Mining and OLM look like?
o Investigate which interfaces, channels and structure of communication exists o Investigate which priority rules that are followed regarding the decision of what
to put on lego at OLM
• How does the process of each role involved with OLM look? o Map how the work procedures looks including the quality insurance and follow
up process o Investigate which steering group and documents that exist if any, regarding OLM
After answering the research questions, an analysis will be performed on all the findings, with more focus on the area where the greatest improvement potential is found. The analysis of this area will be presented as a business case. Finally, an action plan, improvement proposals and recommendations will be given, generating a higher delivery precision and more accurate lead times. This will stand as a base for further development in the future of the relationship between Sandvik Mining and OLM.
1.6 Delimitations This case study does not consider any production neither at Sandvik Mining nor OLM. All mappings and flow charts consider only the information and material flow regarding OLM. The depth of the investigation will be adapted with consideration to the size and believed importance of that specific area, and also to the time restriction of the case study.

Introduction
5
1.7 Disposition In the Table 1-‐1 below it is further described what every chapter concerns.
Table 1-‐1: Disposition
Chapter Content 2. Theoretical framework
In this chapter the theories that are relevant for the case study is presented which also gives the reader knowledge about these theories.
3. Method
This chapter presents the approach of the case study and what kind of information that has been gathered.
4. Empirical data
In this chapter the present situation between Sandvik Mining and OLM is presented i.e. how the material and information flows look.
5. Analysis
This chapter presents an analysis of identified improvement areas and one of them is presented as a business case.
6. Discussion
This is the chapter where the authors discuss the analysis base on two main questions.
7. Conclusion
This chapter concludes the key findings of the case study.

Introduction
6

Theoretical Framework
7
Theoretical Framework In this chapter the theories that are relevant for the case study is presented which also gives the reader knowledge about these theories.

Theoretical Framework
8
2 Theoretical framework This chapter contains academical theories that are used to support the current situation at Sandvik Mining. The theories that are used are relevant for the purpose and research objectives of the case study. The chapter starts with general theories about supply chain management and continues with some theories about lead times and calculation of holding cost. The chapter is concluded with general theories about processes.
2.1 Supply Chain Management Supply Chain Management (SCM) is a term that usually appears linked to logistics (Segerstedt, 2009). The definition of SCM according to (Christopher, 2011, s. 3) is:
“The management of upstream and downstream relationships with suppliers and customers in order to deliver superior customer value at less cost to the supply chain as a whole”.
Christopher (2011) also means that SCM strives to reduce costs and increase value creation through integrating and improve the whole supply chain. The cost reduction and value creation is created through conveying the customers´ specific needs upstream in the value chain through different information flows. Simultaneously as the company has control of the material flow up and downstream in the value chain in order to achieve an effective material flow. At the end, this will lead to achieving a higher service level with less resource consumption. An important aspect in order to establish a good relationship through the supply chain is to create a win-‐win situation for all parties involved. (Segerstedt, 2009) In Figure 2-‐1 below, there is an illustration of a supply chain.
Figure 2-‐1: Supply Chain Management (Lyson & Farrington, 2012, s. 93).
As mentioned above SCM should cooperate with every entity in the supply chain in order to make a smoother supply chain. Collaboration between all departments in the focal organization in together with information sharing and usage of SCM processes should be combined in order to create a well-‐working supply chain. In order to have a successful supply chain four critical

Theoretical Framework
9
enablers have been identified by Lyson & Farrington (2012). These are listed below with consideration to their importance, where number one is the most important. (Lyson & Farrington, 2012)
1. Organizational infrastructure 2. Technology 3. Strategic alliances 4. Human resource management
(Lyson & Farrington, 2012, s. 95)
2.1.1 Supply Chain enablers As seen, in order to have a well working supply chain it is important to have an organizational structure that enables collaboration with other organizations. Important attributes of an organizational structure include:
• Having a coherent business strategy that aligns business units towards the same goal • Having a formal process – flow methodologies to enable SCM improvements • Having the right process metrics to guide the performance of operating units towards
the strategic organizational SCM objectives
(Lyson & Farrington, 2012, s. 95)
Technology is the second most important enabler, it is important to consider how intercompany relationships are build. Important attributes of technology include:
• Having operations, marketing and logistics data coordinated within the company • Having data readily available to managers and the coordination of operations, marketing
and logistics data between supply chain members.
(Lyson & Farrington, 2012, s. 95)
The third most important enabler is the strategic selection of allies in the supply chain and in order to make this work it is important to have the following attributes:
• Having expectations clearly stated, understood and agreed to upfront • Collaboration on supply chain design and product and service strategies • Having top management of partnering companies interface on a regular basis • Having compatible IT systems.
(Lyson & Farrington, 2012, s. 95)
The fourth and last enabler for a well-‐functioning SCM is the human resource management, important attributes of this aspect include:
• Sourcing, hiring and selecting skilled people at all management levels • Finding change agents to manage SCM implementation • Having compensation and incentives programs in plan for SCM performance • Finding internal process facilitators knowledgeable about SCM
(Lyson & Farrington, 2012, s. 96)

Theoretical Framework
10
2.1.2 Organizational structures The structure of the organization has everything to do with execution, the way of how the organization is build up is in order to match and fulfill the strategy that is set for a company. From a small and simple functional structure to a large and complex matrix organization, how are the operating units organized in order to achieve customer value? (Carr & Nanni Jr, 2009)
Galbraith, Downey & Kates (2001) also state that organization structure is a vital part of the organizational design, in order to achieve the strategy and aim of a company. The design of the structure is a key success factor, not only on a divisional level but also on an individual level. That is why it is important to define the responsibility and authority for every involved part in the organization. There are different kinds of ways to organize the structure of a company. The structure can e.g. be based on functional, product, customer and front-‐back hybrid. These are further described below (Galbraith, Downey, & Kates, 2001)
2.1.2.1 Functional organization structure A functional structure is based on organizing around major activity groups such as operations, research and development (R&D), marketing, finance and human resources (HR). The company is divided by the function of every division and the advantage of the structure is knowledge sharing, specialization, leverage with vendors, economies of scale and standardization while the disadvantages are the lack managing of diverse product or services and lack of cross-‐functional processes. (Galbraith, Downey, & Kates, 2001).
2.1.2.2 Product organization structure A product division is where a company is divided by the product it is producing. Each division has its own functional structure to support its product/products. A product structure often evolves from a functional structure when a company grows and diversifies its product or service lines, when these lines become large enough to support their own production. The advantages of this structure are, more rapid product development cycles, products are developed to excellence and there is a broad operating freedom. While the disadvantages are divergence due to that divisions work independently, duplication of resources, loss of economies of scale and multiple customer points of contact. (Galbraith, Downey, & Kates, 2001)
2.1.2.3 Customer organization structure A customer structure divides the company around major markets segments such as industries, customer groups or population groups. While functional and product organizational structure have internal advantages, customer organization structure is more based on the customer to make it easier for the buyer to do business with the organization. The advantages of this structure are customization of products or services, relationships with customers and the possibility to offer solutions. While the disadvantages are the same as in product organization structure i.e. divergence, duplication and loss of economy of scale. (Galbraith, Downey, & Kates, 2001)
2.1.2.4 Front-‐back hybrid structure The front-‐back hybrid structure combines the elements of both product – and customer structures in order to gain benefits from both. It allows for product excellence in the back end of the company in combination with increasing customer satisfaction at the front end of the company. The advantages of this structure are single point of interface for customers, cross-‐selling, value added systems and solutions, product focus and multiple distribution channels. While the disadvantages are contention over resources, disagreements over price and customer needs, determining the placement of marketing, conflicting metrics and information and accounting complexity. (Galbraith, Downey, & Kates, 2001)
2.1.3 Information flow in the Supply Chain As mentioned earlier, technology is one of the most important enabler for a successful supply chain i.e. sharing information both internally and externally, making information available for

Theoretical Framework
11
other companies that are part of the focal organization´s supply chain (Lyson & Farrington, 2012). Due to that technology evolves, organizations tend to integrate more. Therefore, information sharing has become critical when improving the performance of the supply chain. (Zhou & Benton, 2007)
There is a relation between the amount of information shared and the overall performance of the supply chain. Supply chains with less information sharing perform poorer in comparison to supply chains that use more information sharing. Inter-‐firm information flow is an important factor of supply chain management. Potential benefits of information sharing might be supply chain coordination and decreased supply chain cost (Vanpoucke, Boyer, & Vereecke, 2009).
2.1.3.1 Collaborative planning, forecasting and replenishment (CPFR) CPFR is a collaboration process between organizations in the supply chain, whereby they can jointly plan different key supply chain activities with the aspect of the whole supply chain, from raw material to customer. (Blackstone & Cox, 2005)
CPFR is a web-‐based attempt to coordinate various activities such as, production & purchasing planning, demand forecasting and inventory replenishment between different organizations in the supply chain. The aim of CPFR is to exchange selected information on a shared web server in order to provide reliable information and long term future views of demand between the organizations in the supply chain. (Fliedner, 2003)
As Fliedner (2003, p.16) states “The potential benefits of sharing information for enhanced visibility in the supply chain are enormous”. The potential benefits of using CPFR differ depending what kind of actor the organization is in the supply chain. (Fliedner, 2003)
• Retailer benefits o Increased sales o Higher service levels o Faster order response times o Lower product inventories, obsolescence, deterioration
• Manufacturer benefits o Increased sales o Higher order fill rates o Lower product inventories o Faster cycle times o Reduced capacity requirements
• Shared supply chain benefits o Direct material flows (reduced number of stocking points) o Improved forecast accuracy o Lower system expenses
(Fliedner, 2003, s. 17)
2.2 Lean Production Lean Production has its roots in the Japanese automotive industry, beginning in the 1950s. To keep it simple the basic idea with Lean Production is to reduce the time between customer order and delivery, by eliminating waste (Liker & Meier, 2006). This initiative resulted in Toyota Production System (TPS) which today is synonymous with Lean Production. (Segerstedt, 2009)
Lean Production means that a company´s resources are used efficiently and that no excess in resources are used in order to produce efficiently. Hence the purpose of Lean Production is to identify and eliminate all the activities that does not add any value to the product, in other words identify and eliminate all waste. (Olhager, 2000)

Theoretical Framework
12
2.2.1 Waste According to Liker & Meier (2006) there are eight different kinds of wastes that a company should eliminate in order to become a leaner company and survive in the tough market. They also mean that every process whether it is a business or manufacturing process has waste, regardless if it is a production line process, order taking process or a product development process. The different kinds of wastes are described below. (Liker & Meier, 2006)
• Overproduction – When producing too early or in greater quantities than the customer need. This in turn generates other wastes such as overstaffing, transportation cost and excess inventory for instance.
• Waiting time – Staff watching a machine or waiting for the next processing step, due to no stock, capacity bottlenecks or equipment downtime for instance.
• Transportation or conveyance – All type of movement of work in progress up and down in a process. This also includes moving material or finished goods from or to storage between processes.
• Over processing or incorrect processing – When producing products with higher quality than is necessary, when steps unneeded are taken to produce a product or when processing inefficiently, due to poor tool or product design which results in producing defects.
• Excess inventory – All work in progress, finished goods or raw material that causes obsolescence, transportation and storage costs, longer lead times or delays. Furthermore, excess in inventory might hide late deliveries from suppliers, production imbalances, defects, set up times and equipment downtime.
• Unnecessary movement – All movement including walking that is not value adding for the product e.g. looking for, reaching for or stacking parts.
• Defects – All defective products or products that need to be corrected including repair, scrap and additional production.
• Unused employee creativity – All ideas, skills improvement possibilities that are lost by not engaging or listening to the employees.
(Liker & Meier, 2006)
2.2.2 Standardized work Standardization is about performing a task according to the currently best known established solution. The work performance is only to be changed when a better solution is identified. (Segerstedt, 2009)
Further Liker & Meier (2006, s. 124) mean that standardized work is a prerequisite for improvements by stating the following.
“If the work is not standardized and it is different each time, there is no basis for evaluation”
This means that if no standardization is settled there is no reference point from which to compare. Therefore, it is important to have a standardized way of performing the tasks so that improvement can be made from a reference point with the currently best known solution. One of the main prerequisites for having a standardized work is that the work is repeatable. (Liker & Meier, 2006)
2.2.3 Lead time Lead time is a concept of time that can be used in different situations. The general definition for lead time is the time it takes for one part to make its way through manufacturing, beginning with arrival as raw material to shipment to the customer. (Rother & Shook, 1999)

Theoretical Framework
13
Olhager (2000) argues that lead time can be seen from different perspectives which are for instance, the lead time it takes to develop a new product, the lead time for delivery in customer’s perspective and also the lead time to customer in the producing company’s perspective.
Lead time is also connected to tied up capital such as inventory. A reduction in inventory lowers the lead time meaning that products reach the market faster when inventory is lowered. (Srinivasan, 2004)
2.2.4 Tied up capital A company’s assets can be divided into fixed assets and turnover assets. All of the assets have a monetary value and examples of fixed assets can be land, buildings and machinery while turnover assets can be inventory, transportation and production cost. (Jonsson & Mattsson, 2005)
When doing investments, capital is tied up and which affect the company’s cash flow while it also generates a cost, corresponding the income the money would have generated if they were e.g. put on a bank account (Jonsson & Mattsson, 2005).
Tied up capital affect a company’s profitability directly and also the delivery service indirectly i.e. if the inventory would be lowered too much it would result in bad delivery performance. The average tied up capital indicates how much money is tied up in inventories, work in progress, finished stock and transportations. The tied up capital can be presented in absolute numbers, but if this is not possible, it can also be present as inventory turnover rate and average lay time of product in inventory. (Jonsson & Mattsson, 2005)
2.2.5 Holding cost All inventory that is not tied to a specific customer order runs the risk to not be sold, hence increasing the holding cost (Gudehus & Kotzab, 2012). The holding cost is the amount of money a company has to pay to keep material in stock. The holding cost includes warehousing, obsolescence, pilferage, damage, insurance and taxes. (Timme, 2003).
Jonsson & Matsson (2005) sums all of these variables into three and presents a formula of how to calculate the holding cost interest. The formula is presented below:
Holding cost interest =
capital avoidable cost + warehouse avoidable cost + contingency avoidable cost 𝑎𝑣𝑒𝑟𝑎𝑔𝑒 𝑣𝑎𝑙𝑢𝑒 𝑠𝑡𝑜𝑐𝑘
All of these variables that are included in the holding cost interest which is presented as a percentage number, so when calculating what the holding cost for an inventory is this percentage cost is multiplied with the average value of the inventory during a year (Jonsson & Mattsson, 2005). Example, average value stock is 1 350 000 SEK and the holding cost interest is 15 % meaning that the holding cost for this specific inventory is 202 500 SEK, the calculation is presented below.
0,15 ∗ 1 350 000 𝑆𝐸𝐾 = 202 500 𝑆𝐸𝐾
2.3 Delivery service parameters The service considering the accomplishment of order-‐to-‐delivery process is often mentioned as delivery service. This process includes the phases from order until delivery and during the delivery itself. To explain delivery service there are a couple of delivery service parameters used in order to describe the delivery performance. The importance of the parameters varies
Theoretical Framework
14
depending on the situation it is describing. Following is a description of the most used delivery service parameters (Jonsson & Mattsson, 2005)
2.3.1 Delivery precision Delivery precision explains to what extent deliveries arrive at right time i.e. the time that the customer and supplier have agreed on. Delivery precision differs from warehouse service level in that matter that delivery precision considers only articles that are not in stock but articles that have to be assembled or produced directly to order (Jonsson & Mattsson, 2005). Delivery precision can be applied both externally and internally, between departments, in a company. (Madhusudhana Rao, Prahlada Rao, & Muniswamy, 2011)
Delivery precision can be measured as the ratio between delivered orders on time and in comparison to total number of orders. The delivery point can be a single day or an interval of days and this is something that is agreed between the supplier and customer depending on the product itself and the demand of the product. (Jonsson & Mattsson, 2005)
2.3.2 Delivery assurance Delivery assurance measures the deliveries quality in terms of if it is the right product being delivered and if the quantity is correct. When having a low delivery assurance it often leads to unnecessary activities, which would not occur if the delivery assurance would be satisfying. Jonsson & Mattsson (2005) states that delivery assurance can be measured as the ratio between the number of orders with remarks (wrong product or wrong quantity delivered) in comparison to the total number of orders sent. (Segerstedt, 2009)
2.3.3 Delivery time Delivery time is the time it takes from the point an order is received until products are delivered. Delivery time consists of administrations and order processing time, dispatch and transportation time and in some cases design and manufacturing time. Delivery time is normally expressed in days or weeks. The longer delivery time, the poorer flexibility due to that orders take longer time to deliver. This results in an increase in tied up capital since material is tied for a longer time. (Jonsson & Mattsson, 2005)
2.3.4 Delivery flexibility Delivery flexibility considers the capability to adjust to change in customer demand. Changes could be in time, quantity or even changes in products themselves. There is a difference in delivery flexibility before received order and during a received order. Delivery flexibility before received order concerns the possibility to accept changes in delivery time, minor order quantities than agreed or changes on products. While delivery flexibility during a received order concerns the possibility to adjust to higher demand in short time and to changes such as to change delivery date on orders or deliver higher quantity than agreed. (Jonsson & Mattsson, 2005)
2.4 Processes What is a process? According to Bergman & Klefsjö (2010, s. 456) “a process is a network of activities that are repeated in time, whose objective is to create value to external or internal customers”. Due to that there are a lot of different activities that can be called a process, a classification of processes has been done. Processes in an organization has been divided into three groups (main, support and management processes) which are illustrated in Figure 2-‐2 below.

Theoretical Framework
15
Figure 2-‐2: Processes in an organization (Bergman & Klefsjö, 2010, s. 458).
• Main processes -‐ These processes’ task is to fulfill the needs of the external customer and refine the products that are provided to the process. These kinds of processes are in a way “the life nerves” of the organization since the processes’ output is what generates the income for the organization. Examples of this type of processes are product development processes, production processes and distribution processes.
• Support processes – These processes’ task is to provide resources for the main processes and most often these processes have internal customers. Examples of this type of processes are recruitment, maintenance and information processes
• Management processes – These processes’ task is to make decisions regarding the targets and strategies of the organization, and to implement improvements into other organizational processes. Likewise support processes the management processes most often have internal customers. Examples of processes are strategic planning, targeting and auditing
(Bergman & Klefsjö, 2010, s. 458)
2.4.1 Process flow analysis Process flow analysis is a method used to document activities in detail and graphically as basic data in order to give a better understanding of the process and clarify potential process improvements. A process flow analysis can be performed on all three types of processes mentioned above. Different types of schedules and charts are preferably used to describe and analyze processes and organizations. The analyses that are made with the charts may have different purposes, hence why a process flow analysis can vary in level of detail and information. It can concern a production process in its fullness including all the activities, a part of a production process, or a detailed mapping of individual processes. When doing the actual chart different types of symbols are used for different activities. (Olhager, 2000) The fundamental steps in a process flow analysis are the following:
1. Identify and categorize the process activities 2. Document the process as a whole
Theoretical Framework
16
3. Analyze the process and identify possible improvements 4. Recommend appropriate process changes 5. Perform decided changes
(Olhager, 2000, s. 92)
When analyzing the process each work activity in the process chart is scrutinized through the questions What? When? By who? Where? For how long? How? and especially Why?. Why is this process performed at all? Why is it done in this way? Other questions might be when, where and how could it be done differently? (Olhager, 2000)
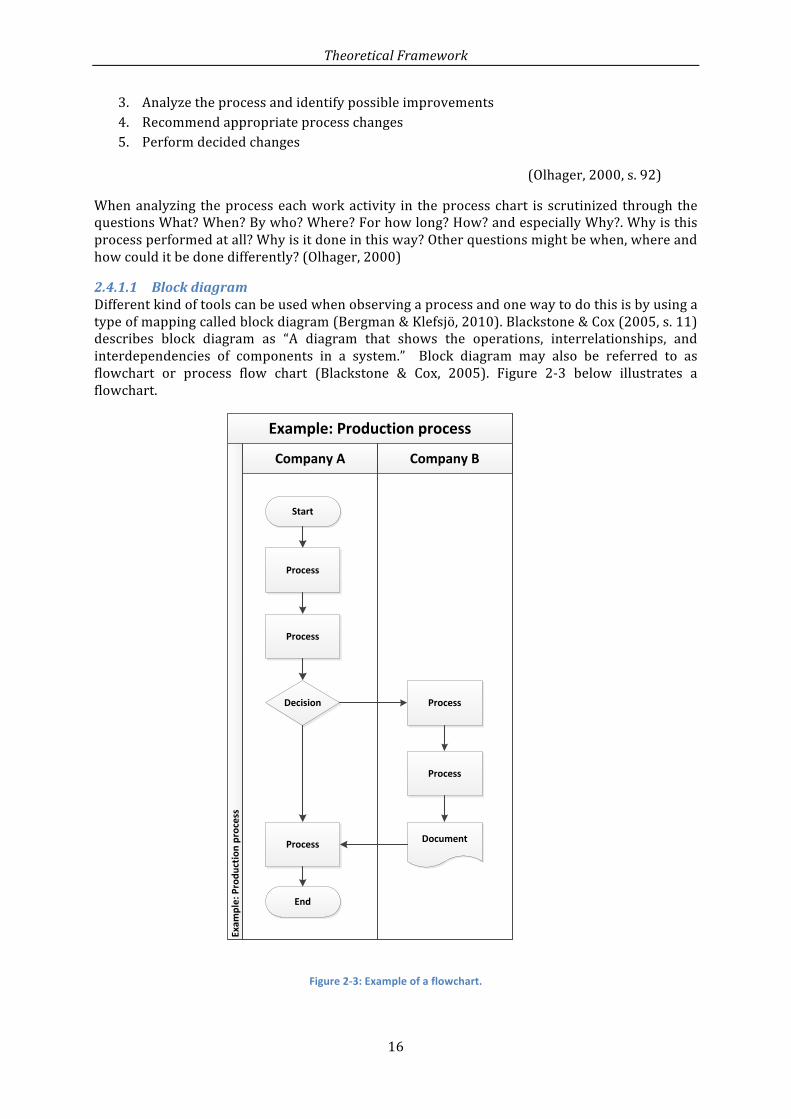
2.4.1.1 Block diagram Different kind of tools can be used when observing a process and one way to do this is by using a type of mapping called block diagram (Bergman & Klefsjö, 2010). Blackstone & Cox (2005, s. 11) describes block diagram as “A diagram that shows the operations, interrelationships, and interdependencies of components in a system.” Block diagram may also be referred to as flowchart or process flow chart (Blackstone & Cox, 2005). Figure 2-‐3 below illustrates a flowchart.
Figure 2-‐3: Example of a flowchart.
Example: Production process
Company BCompany A
Exam
ple: Produ
ction process
Process
Process
Decision Process
Process
Start
DocumentProcess
End
Theoretical Framework
17
All the theories in this chapter are used to explain the current situation through an academic perspective and thereby enable the authors to approach the problem with proven theories. Furthermore, the theories ought to function as a base to facilitate the authors to give improvement suggestions and recommendations as well as increasing the validity of the case study.

Theoretical Framework
18

Method
19
Method This chapter presents the approach of the case study and what kind of information that has been gathered.

Method
20
3 Method The content of this chapter presents the approach of the case study and which kind of information that has been gathered and used.
3.1 Type of study There are different approaches of collecting data for a research project. The approaches for collecting data can be quantitative or qualitative. If the purpose of the research project is to collect numerical data, statistics, standardization and generalization then it is recommended to use a quantitative method. This data can be gathered with polls and inquiry sheets that consist of questions and data that cohere to the research project. (Olsson & Sörensen, 2011)
On the other hand if the situation of the research project is unique, complex and/ or based on individual perception then a more qualitative method is recommended. The purpose with qualitative methods is to characterize a specific task by using models, description or categorization in order to describe a specific phenomenon. The information for qualitative studies can be gathered through interviews, observations and/ or literature. When doing research about a specific case, person, group or social entities, a common term used for this research method is case study. The gathered information is further used to present a the current situation and also to do an analysis. The information that is gathered is finally summarized with a discussion and conclusion. (Olsson & Sörensen, 2011)
In order to fulfill the purpose the authors decided to perform a case study in order to get an understanding of how the relationship between Sandvik Mining and OLM looks. To get a deeper understanding about the relationship, the case study was divided into three main areas, which are the, material flow, information flow and processes.
In order to get information about how the material flow, information flow and the processes between Sandvik Mining and OLM looks, the authors chose to use flow charts. A particular flowchart used is called block diagram, which gives the opportunity, besides mapping the process, to identify where in the organization the process is performed. (Bergman & Klefsjö, 2010).
Most processes have a great potential for improvement, therefore it is often worth the effort performing these mappings. As Bergman & Klefsjö (2010, s. 462) state, “The knowledge that is created by defining and mapping a process is highly valuable in itself. In addition, it is an excellent platform for the improvement work, as it generates a shared picture of current events”. (Bergman & Klefsjö, 2010)
Every employee that was found necessary for the case study was interviewed. The aim with these interviews was to sketch the block diagrams and get the most truthful picture regarding the relationship and interfaces between Sandvik Mining and OLM. Furthermore, the aim with the block diagrams in this case study was to illustrate the work-‐processes of each role involved with OLM, which is one of the research questions in the purpose chapter.
By using this method it gave the opportunity to get an overview of how the material and information flow looks and which processes that are performed in the existing interfaces between Sandvik Mining and OLM, which is one of the research objectives.
After the mapping, it was clear that all investigated areas had potential for improvements and was therefore further investigated. One of the areas, the material flow, was identified to have a higher grade of potential for improvements and was therefore in collaboration with Sandvik Mining chosen to put most focus on. A business case including cost savings and suggestions for improvement was made. Due to the deeper investigation in this area, the recommendations are more thorough than for the other areas´.

Method
21
3.2 Purpose of method The purpose of the method is to function as guidance and help for the authors in order to fulfill the purpose of the case study. When the mapping of the processes was done the flow charts were the basis for identification of improvements for the material and information flow and processes between Sandvik Mining and OLM.
3.3 Data gathering According to (Yin, 2007) there are different kinds of sources of information and these are presented below.
• Documents • Interviews • Direct observation
In combination with these sources the authors has additionally used one more source of information that is literature. Literature comprises books, articles and homepages and has been used to gather the necessary literature
3.3.1 Documents Yin (2007) describes documents as internal documents at a company, which can be used in order to accomplish the purpose of a case study. Patel & Davidson (2003) divides documents into different sub-‐groups such as statistical, public, private, figure-‐documents and audio-‐documents. The authors have used some of these documents, provided by Sandvik Mining in order to do the case study.
3.3.2 Interviews When doing case studies interviews can be a very important source of information, information that only specific persons have and are not on paper. There are two different aspects to be considered when using interviews, the aspects of standardization and structure. Interviews with high level of standardization consist of questions that are made up before and used on all interview objects, while interviews with low level gives the opportunity to make up questions during the interview. (Patel & Davidson, 2003)
The aspect of structure regards how specific the question is and how much room that is left for the interviewee to interpret the question. With high level of structure the questions are very strict and spot on while interviews with low level of structure gives the interviewee the room to interpret the question in their own kind of way. (Patel & Davidson, 2003) The interviews that were held by the authors had a quite high aspect of standardization and also a quite high level of structure. However during the interviews other complementary questions related to the main questions were added and the interviewees was allowed to give their own input regarding the questions, which makes the type of interviews held to semi-‐structured.
3.3.3 Direct observation Observations are one of the best forms when it comes to get information, and by being present and doing observations. Information can be gathered to see how it really looks at a specific situation. (Patel & Davidson, 2003) The authors performed some direct observation at the site of the company where the case study was performed. Observations were performed when the existing data were not sufficient for the purpose.
3.4 Literature The authors gathered information through literature in form of books and articles. The authors, which used books and articles that had been used in previous courses did the selection of literature. The authors did also use new literature in form of books and articles that was found necessary for the case study that had not been used by the authors before. The search engine at Chalmers University Library (SUMMON) has been used as the primary source of information

Method
22
regarding articles. Besides books and articles, the Internet and supervisor was used to find literature that was relevant to achieve the purpose.
3.5 Method analysis When the material and information flow and processes were mapped, the next step was to analyze these areas. In Figure 3-‐1 the work process and methods used by the authors are illustrated. Literature that was considered suitable for the case study was gathered through books, articles, Internet and supervisor. Remaining information, that was considered essential, was gathered from interviews, observation and archive documents provided by Sandvik Mining.
Figure 3-‐1: Methodological approach
The case study was performed at Sandvik Mining’s site in Sandviken, where regular steer-‐group meetings occurred. The progress of the case study where controlled by weekly check-‐up meeting where the progress was presented and discussed with concerned personnel in order to ensure that the project were heading in the right direction.
3.6 Method discussion Due to that the purpose of this research project was to map and present the processes, the material and information flow between Sandvik Mining and OLM, the method of performing a case study at the site of Sandvik Mining seems to us as a valid approach to this research project, because it gave us the possibility to create a theoretical paper of a complex reality.
We chose to use block diagram as a tool to start with, which we also find as a good choice not only because the tool show the process that is mapped but also where in the company this process is done giving us the possibility to identify the connections between the different roles and processes.
What we lacked in our opinion when using this tools was that we did not proceed deeper in the processes, due to that the company wanted us to focus more on the material and information flow and not the processes themselves. We could have investigated the processes more thoroughly, identifying waste within every process and the system as whole and made it more efficient, but as mentioned due to requests from Sandvik Mining and the lack of time this was not done.

Method
23
We used different kind of approaches when collecting information. Firstly we had meetings with our supervisor at the company and went trough all individuals that are involved with OLM in any kind of way. Later we interviewed these persons where we used a questionnaire we made with questions that were align with the purpose. The supervisor checked this questionnaire before being sent to the interviewees, and thereafter the interviews were held. We are of the opinion that the collection of that was performed in a good way since we collected data at the spot from persons that are related to the project and also since these questions were checked before being used, which assures that the questions being asked were relevant and valid.
In order to increase the validity of the flowchart a second interview was held with every interviewee to confirm that the flowchart that was sketched is correct. One aspect that could have been done better regarding the interviews that could increase the validity was to interview all of the individuals that are involved with OLM, but already from the beginning the amount of interviewees was limited due to that many of them had similar work tasks.
The other part of the information that was gathered was received from the company in form of documents or direct observation that were performed by the authors. The information from the company is considered as valid, due to that this information is the same information as the company is using but also because it is the only information available. However the observations by the authors was only done once, but in order to increase the validity of the observation it could have been done several times.
Due to that we have used a known tool when mapping the processes and interviewed employees involved directly, the reliability of the research study is high. We are of the opinion that the reliability of the process maps is high because they should be the same regardless of who creates them. We are of the same opinion regarding the information and material flow due to that both are based on information received from the company or what we have gathered. The issue that can be questioned regarding the reliability is if a different research group would have done this research, the interview questions would probably have been different and thereby other important information would have been gathered. This could have made the research group to take a different approach to the task but due to the purpose we still believe that even though different approaches would have been used, similar result would have been achieved. Furthermore, during the whole case study, steering meetings were held with the authors, supervisor and manager at Sandvik Mining. This increases the reliability of the case study since the supervisor and manager have been updated and given the possibility to comment and influence on the progress and findings of the case study.

Method
24

Empirical Data
25
Empirical Data In this chapter the present situation between Sandvik Mining and OLM is presented i.e. how the material and information flows look

Empirical Data
26
4 Empirical data This chapter comprises an overview of the current situation at Sandvik Mining regarding Ockelbo Lego-‐Mek (OLM), based on personal interviews of employees that are involved with OLM. All the research questions and objectives are answered in this chapter and a part of it is further analyzed in the next chapter. The recommendations and improvement proposals are partly based on this chapter and the following one.
This chapter starts with a description of Sandvik Mining and thereafter continues with description of the material flow. Furthermore, there are figures in this chapter illustrating the information flow between different departments and roles at Sandvik Mining that are involved with OLM. Additionally flow charts describing the work processes of the different roles are presented. Only suppliers, departments, persons and flows that are involved with Sandvik Mining´s relationship with OLM are included in these flow charts and figures. Finally, there is a description of the quality process that occurs between Sandvik Mining and OLM.
4.1 Sandvik Mining As mentioned earlier Sandvik AB is divided into five business areas and one of them is Sandvik Mining, see Figure 1-‐1. The case study was performed at the site in Sandviken, Sweden. The subdivision that today is Sandvik Mining started in 1907 when Sandvik AB started to produce hollow steel drills (Sandvik, 2011)
Sandvik Mining with its headquarters in Amsterdam, Netherlands, is the second biggest division considering both number of employees and revenue. Sandvik Mining’s revenue was 32 232 MSEK and the number of employees was 13 300 in 2011. (Sandvik, 2011).
Sandvik Mining is a global supplier of equipment, tools, service and technical solutions for the mining industry and is producing highly specialized performance products, solutions and services. Sandvik Mining has ten business segments and these are:
• Rock Tool and Systems • Drill rigs and rock drills • Load and haul equipment • Continuous mining and tunneling machines • Crushers and screeners • Conveyor components • Bulk materials and handling equipment • Breakers and demolition tools • Mine automation systems • Safety and environmental products
(Sandvik, 2011)
4.1.1 Sandvik Mining Rock Tools Rock Tools is one of ten business segments within Sandvik Mining with focus on manufacturing of tools used when mining. Sandvik Mining Rock Tools (Sandvik Mining) offer the widest range of tools and accessories for exploration, rock drilling, raise boring, coal and mineral cutting, tunneling, trenching, road grading and cold planning. (Sandvik, 2011)
Sandvik Mining has as mentioned one of the widest product segments and in Figure 4-‐1 below some of the products are illustrated. The production at Sandvik Mining is divided into two flows, short respectively long products. The short product flow includes products such as; bits (1), adapters (4), sleeves (5) and thread ends. The long product flow considers pipes (2) and bars (3).

Empirical Data
27
Figure 4-‐1: Rock Tools Products.
As mentioned in the introduction Sandvik Mining is represented in more than 130 countries. For more information about the largest customers that Sandvik Mining has see Appendix B.
4.2 Material Flow Sandvik Mining purchases the material that is processed at OLM from two raw material suppliers whereof one of the suppliers is located at three geographical locations. The material from these three suppliers is merged at Sandvik Mining before being delivered to OLM. Figure 4-‐3 below is an illustration of how the material flow looks between Sandvik Mining, OLM and the suppliers of the raw material in form of pellets, bars and pipes.
Sandvik Mining has daily deliveries to OLM at 07:00 every morning and when offloaded at OLM the same truck is on loaded with processed products and sent back to Sandvik Mining. The amount that is being sent is approximately 13 pallets per delivery and consists of materials from suppliers, which are presented later in this chapter. The material that is sent to OLM from Sandvik Mining can either go through Tempo 1 at OLM or both Tempo 1 and Tempo 2 (see Figure 4-‐2). Tempo 1 is when the material leaves Sandvik Mining for the first time to be processed at OLM. After being processed at OLM the material is returned to Sandvik Mining for heat-‐treatment and after that some material has to be sent back to OLM for further processing (Tempo 2). This can only be done after heat-‐treatment at Sandvik Mining. The decision regarding where to produce is taken by the order processor when an order is approved. The ratio between Tempo 1 and 1 & 2 is 84.3% for Tempo 1 and 15.7% for Tempo 1 & 2.
The lead time calculation starts when Sandvik Mining receives and registers the raw material at the goods receiving before being sent to OLM for Tempo 1. Data shows that the average lead-‐time for all of the orders that were sent to OLM for Tempo 1 during 2012 was 16 days as it is illustrated in Figure 4-‐2. Also notable is that the ERP-‐system is set to calculate the finish-‐date for an order to the Friday of that week i.e. if an order is calculated to be finished Tuesday week 5 the ERP-‐system changes the end-‐date automatically to Friday week 5.
The following figure illustrates the material flow from the raw material supplier to Sandvik Mining including Tempo 1 & 2. Note that only 15.7% of the material goes through Tempo 2.
1 2
3
4
5

Empirical Data
28
Supplier Sandvik Mining
OLM
Sandvik Mining
OLM
Sandvik Mining
Tempo 1
Tempo 2
16 days5 days
Figure 4-‐2: Current material flow.
Another figure demonstrating the amount of material delivered by each supplier is illustrated in Figure 4-‐3.
The information sharing between Sandvik Mining and OLM is done both electronically and physically. The type of information sharing differs depending on the stage of the product. At Sandvik Mining there are three different stages of product and the first one is when a product is a test-‐product. At this stage a few number of the product is produced in order to test the product and see if it is good enough to be taken to the next stage, which is a new product. At this stage the product is introduced and if it sells good enough it will be taken to the last stage, which is a standard product. The new and test products have the most uncertain production lead time and are also the ones with the longest production lead time. However these products only correspond for approximately 2% of all the orders sent to OLM.
The ordering towards OLM for standard products going through Tempo 1 is made electronically by EDI and is generated automatically when the material are registered in the ERP after being received from the raw material suppliers. Standard products that are going to Tempo 2, together with new and test products that are going either to Tempo 1 or 2 are sent to OLM with a physical order sheet that is written manually by the goods receiver. Standard products that are sent to Tempo 2 and new and test products are not registered in the ERP-‐system, hence the reason why the goods receiver writes manual orders. This is illustrated with the two dark arrows that go from Sandvik Mining to OLM in Figure 4-‐3. Note that only material sent to OLM is included in this figure.

Empirical Data
29
Figure 4-‐3: Material flow between suppliers, Sandvik Mining and OLM.
A 3PL company that Sandvik Mining hires on full time performs the transportation from Ovako Forsbacka. Other 3PL companies independent from Sandvik Mining performs the transportations from Tibnor and Ovako Hällefors. The transportation from Ovako Hällefors goes through Ovako Hofors and the transportation from Tibnor goes from Eskilstuna as illustrated in Figure 4-‐3 above.
Due to the lack of space at the goods receiving department all the received material that is supposed to go to OLM is stacked outside. The fact that some of Sandvik Mining´s suppliers deliver the material too early forces Sandvik Mining to deliver the material to OLM as soon as possible due to the lack of space. However there are enough of resources to handle the incoming material. This information gives the answer to two of the objectives stated in the purpose regarding if there is enough space to handle the material that comes from OLM. OLM´s delivery precision is 76 %, including both the material received too early and too late, which is very low in comparison to other suppliers´, which end up on a delivery precision above 95%.
The delivery frequency, amount of pallets and weight in tons coming to Sandvik Mining and the amount that goes to OLM per year can be seen in Table 4-‐1 and is an average from February 2013 and April 2012.
Table 4-‐1: Supplier delivery
Supplier Total pallets
Pallets to OLM
% to OLM
Pallets allocation
Total Weight
Weight to OLM
% to OLM
Weight allocation
Delivery frequency
Forsbacka 6576 1626 25% 51% 2900 685 26% 53% 8-‐10/w Hällefors 5676 1374 24% 43% 2090 533 25% 42% 4/w Tibnor 228 198 87% 6% 76 67 88% 5% 3/w Sum 12480 3198 100% 5065 1285 100%
!"#$%&'()**+,%-./0123&4#**+5.6&7+#-
89:;%-&'<.$9*.5=;#/&0>?&4#**+5.6&7+#-
!"#$%&'@%-.:#A$#/&0BCB&4#**+5.6&7+#-
!"#$%&'(%,%-./&D&4#**+5.&5%&!EF
G#;H"9$&F9;9;I&10>?&4#**+5.6&
7+#-
!EF?3J�&8+K4%&0&
0BJ�&8+K4%&0LC

Empirical Data
30
A forecast for March, April and May 2013 was gathered and shows the merged forecast in kilograms for five different steel types. The last row in Table 4-‐2 shows what the demand for a whole year ought to have been if the monthly demand would be the same through the whole year.
Table 4-‐2: Forecast in kilograms of material going to OLM
Month Mar-‐13 Apr-‐13 May-‐13 Forecast 129 829 132 343 135 546 Sum/ year 1 557 953 1 588 117 1 626 548
4.2.1 Ovako AB Ovako, which is the biggest supplier of material to Sandvik Mining, is located in three different locations, Hällefors, Hofors and Forsbacka. However only products coming from Hällefors and Forsbacka are further transported to OLM even though the same truck picks up material from both Hällefors and Hofors within the same route. Hällefors delivers pellets, bars and pipes while Hofors only delivers pipes which are not delivered to OLM. The frequency of the truck coming from Hällefors is 4 times a week.
The material that Sandvik Mining receives from Ovako Forsbacka consists of pellets and bars and the frequency of the deliveries are 8-‐10 times per week.
The material that Sandvik Mining receives from Ovako Forsbacka is not tempered while the material coming from Ovako Hällefors can be tempered or un-‐tempered depending on what Sandvik Mining is requiring. Ovako in Hällefors and Hofors has five days of delivery time while Forsbacka has three days of delivery time.
4.2.2 Tibnor AB Tibnor is located in Eskilstuna and delivers pellets consisting of a special material that Sandvik Mining uses. The material is received three times a week and Tibnor has a delivery time of 5 days.
4.3 Information flow between Sandvik Mining and OLM The following communication structure charts are the result from the interviews (see Appendix A: Questionnaire) that were performed with the employees that are involved with OLM. Firstly the communication structure charts are presented in order to get an overview of the current situation followed by a sub-‐chapter regarding prioritization. The upcoming block diagrams in sub-‐chapter 4.4 are partly the base for the presented communication structure charts in this sub-‐chapter but are presented afterwards, since it makes it easier for the reader to understand the communication structure.
4.3.1 Intra and inter communication flow Most of the communication between Sandvik Mining and OLM occurs through e-‐mail, phone or electronic data interchange (EDI), which answers a part of the first objective under the second research question in the purpose chapter. Communication also occurs between different sub-‐departments, and some employees at Sandvik Mining are more involved than others and may influence on OLM´s production to a certain degree. To get a brief description of the different departments that are involved with OLM, an organization structure is illustrated in Figure 4-‐4 below. Note that only departments involved with OLM are included.
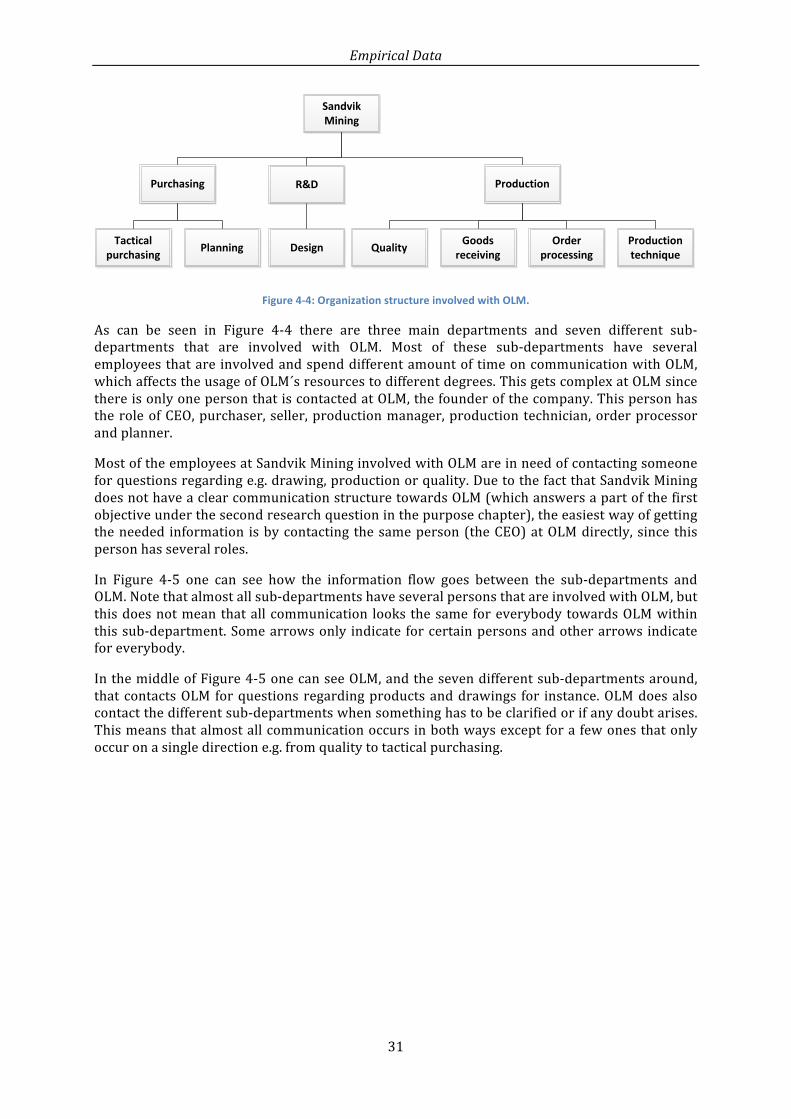
Empirical Data
31
Sandvik Mining
Production
Purchasing
Order
processing
Production technique
Planning
Quality
R&D
Tactical
purchasing
Goods
receiving
Design
Figure 4-‐4: Organization structure involved with OLM.
As can be seen in Figure 4-‐4 there are three main departments and seven different sub-‐departments that are involved with OLM. Most of these sub-‐departments have several employees that are involved and spend different amount of time on communication with OLM, which affects the usage of OLM´s resources to different degrees. This gets complex at OLM since there is only one person that is contacted at OLM, the founder of the company. This person has the role of CEO, purchaser, seller, production manager, production technician, order processor and planner.
Most of the employees at Sandvik Mining involved with OLM are in need of contacting someone for questions regarding e.g. drawing, production or quality. Due to the fact that Sandvik Mining does not have a clear communication structure towards OLM (which answers a part of the first objective under the second research question in the purpose chapter), the easiest way of getting the needed information is by contacting the same person (the CEO) at OLM directly, since this person has several roles.
In Figure 4-‐5 one can see how the information flow goes between the sub-‐departments and OLM. Note that almost all sub-‐departments have several persons that are involved with OLM, but this does not mean that all communication looks the same for everybody towards OLM within this sub-‐department. Some arrows only indicate for certain persons and other arrows indicate for everybody.
In the middle of Figure 4-‐5 one can see OLM, and the seven different sub-‐departments around, that contacts OLM for questions regarding products and drawings for instance. OLM does also contact the different sub-‐departments when something has to be clarified or if any doubt arises. This means that almost all communication occurs in both ways except for a few ones that only occur on a single direction e.g. from quality to tactical purchasing.
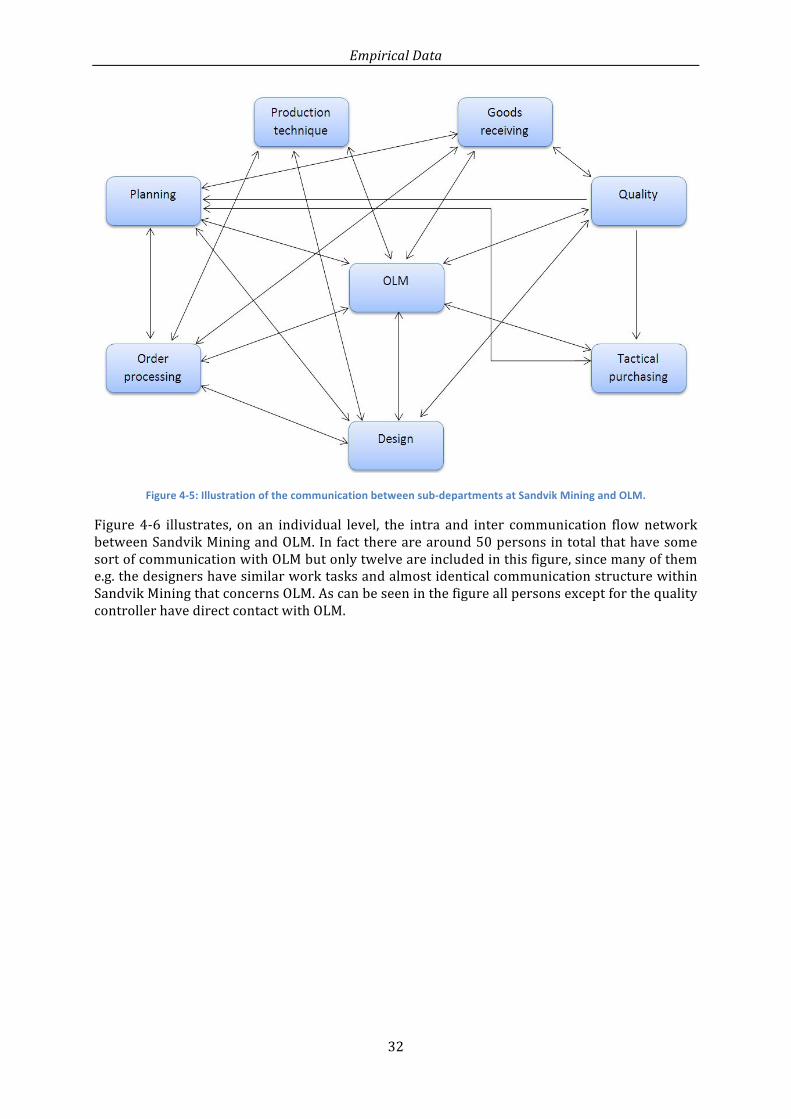
Empirical Data
32
Figure 4-‐5: Illustration of the communication between sub-‐departments at Sandvik Mining and OLM.
Figure 4-‐6 illustrates, on an individual level, the intra and inter communication flow network between Sandvik Mining and OLM. In fact there are around 50 persons in total that have some sort of communication with OLM but only twelve are included in this figure, since many of them e.g. the designers have similar work tasks and almost identical communication structure within Sandvik Mining that concerns OLM. As can be seen in the figure all persons except for the quality controller have direct contact with OLM.

Empirical Data
33
Figure 4-‐6: Individual communication network within Sandvik Mining and towards OLM.
Due to that there is no formal structure in the communication flow for the different product types, the figures Figure 4-‐5 and Figure 4-‐6 illustrates the merged communication flow on a departmental and individual level for all product types (standard, new and test products). These figures answers the other part of the first objective under the second research question in the purpose regarding how the intra and inter information flow towards OLM look like. The CEO at OLM was interviewed and confirmed that all these roles has some kind of communication with the CEO.
4.3.2 Prioritization issues and rules The different persons contacting OLM causes priority problems at OLM according to some of the interviewees´. For instance when a new product is being developed a lot of time is spent on communication, setting up machines and testing until an acceptable product is attained. This might prolong the lead time for standard products with up to four days which causes prioritization issues at OLM. In some other cases when a designer or order processor calls and asks how the production of their order is going, it might be interpreted at OLM as a priority call. This means that OLM might interrupt the production of the current product in order to prioritize another product, which means that the machines must be set-‐up and thereby the lead times are extended. This interpretation at OLM is confirmed by several employees at Sandvik Mining even though OLM denies that priority is given to someone that calls and asks for the status of a product.
From Sandvik Mining´s point of view there should only be one person that has the authority to call and prioritize an order. However, as mentioned this is not how it actually works according to some of the interviewees´ at Sandvik Mining, even though the planner formally is the one with this authority. From OLM´s point of view there are only two different sub-‐departments (Design and Planning) that contact them to have their products prioritized, of which OLM prioritizes one of them more than the other. According to the planner, priority calls are only based on customer
Empirical Data
34
demand or if the production at Sandvik Mining needs a specific component. There are three priority rules followed from Sandvik Mining when deciding where production should take place, which are:
• Available capacity • Technically possible • Profitable (frequency & batch order)
The first one considers if there is capacity available at Sandvik Mining. The second considers if Sandvik Mining has the technical capacity to produce the product and the last one concerns if it is financially profitable to produce these products with consideration to set-‐up times, frequency and batch quantity. These rules answer the second objective in the second research question in the purpose chapter.
In the following sub-‐chapters there are several flow charts, one for each person that was interviewed with exception of the tactical purchaser, from now on only called purchaser. These are also results from the same interviews as mentioned earlier. These flow charts were created in order to map the work processes that each person involved with OLM goes through and to answer the third research question in the purpose chapter.
4.4 Roles involved with OLM As mentioned earlier a more thorough investigation of each role involved with OLM were performed resulting in a block diagram for each role. These are now presented in this sub-‐chapter.
4.4.1 Designers There are several designers at Sandvik Mining that are in contact with OLM. Many of them have similar work tasks when it comes to the procedure towards OLM and therefore only two of them have been interviewed, which means that the following flow charts are based on these two. However the two designers contacts different persons for the same type of questions. For instance one designer contacts the planner for questions regarding the status of a specific order, while the other designer contacts OLM directly for the same question. OLM does in some cases contact the designers directly for questions regarding drawings i.e. the communication occurs in both ways. Also notable is that none of the designers knew anything about any control documents, which mean that almost everything is based on experience and how it currently is done.
The whole process for the designers at Sandvik Mining starts with development of new products that either come from a development project or from a customer order with specific needs. The development is done as a CAD-‐drawing and sent to the order processors as a test order. The order processor decides where to produce the new product, and when needed a production technician is involved in this decision. If the test order is approved without the need of correction the process for the designers ends, conversely to the case where a correction is needed. In that case the designer is contacted by a production technician either from Sandvik Mining or OLM depending on where the product has been decided to be produced. In the latter case several outcomes are possible e.g. a small or big change might be needed but in some cases a total redesign is required.
When this is the case the designer corrects the drawing until it is approved and thereafter the process ends. In the worst case when the product is too complicated to produce, the decision to cancel the production of this product can be taken. The communication between the designers, order processors and OLM varies from time to time, in some cases it is more, depending on the amount of work that is given to OLM at that specific time. Overall the time spent on this communication is small. The designers’ procedure is illustrated in Figure 4-‐7.

Empirical Data
35
Designer
OLMSandvik MiningDe
signer
Start
CAD-‐model created/ corrected
Changes needed?
Production technician contacts
designer (2)
End
Yes No
1. Test order is sent to order processor and decision where to produce it is taken. If needed a production technician is involved in the decision.
2. Depending on the decision of where to produce the production technician either at OLM or Sandvik AB contacts designer to inform that correction is required. Several outcomes are possible, e.g. small or big changes can be needed or a total redesign.
3. If it occurs that the product is too complicated to produce, the decision to cancel production is taken and thereby the process ends.
Test order sent to order
processor (1)
Too complicated
? (3)No
Yes
Figure 4-‐7: Designers´ process when developing new products.
In some cases, when the decision to produce at OLM has been taken, even though the drawing goes through all steps as illustrated in the flow chart above, there could be doubts that need to be clarified for OLM by e-‐mail or phone. It necessarily do not have to be doubts, it could also be improvement proposals that has been detected or just a reflection. Nevertheless, in that case a solution is given to OLM and when no change is needed the process ends, otherwise a change is done and sent to the order processor at Sandvik Mining for approval. When the new drawing is approved it is released and the order processor is notified. Most steps are based on experience and no control documents exist. Figure 4-‐8 illustrates the process when this occurs.

Empirical Data
36
Designer
OLMSandvik MiningDe
signer
Start
OLM contacts designer for
clarifications (1)
Changed needed?
Change is made and sent to
order processor
Order processor
approves new drawing
End
New drawing released and
order processor notified
YesNo
1. OLM contacts designer for clarifications, improvement proposals, misses or other kind of reflections/ doubts. In some cases it is solved immedietaly and no further actions are needed.
Figure 4-‐8: Designers´ process when contacted for clarifications.
4.4.2 Order processors There are only two order processors that have contact with OLM and these two were interviewed. The main differences between them are that one is more experienced and handles both short and long products while the other one only handles short products. According to the order processor responsible for short and long products there are no control documents to follow, which means that no standardization is followed. The order processors work procedure differs a bit from each other’s and some steps and decisions are taken independently, especially the one handling both short and long products. The following text and flow charts only concerns new and test products, since the standardized products are handled automatically through the EDI system.

Empirical Data
37
For the order processor that handles short and long products the work is initiated when updating the list of new articles (see Figure 4-‐9). This list shows all the new products that R&D has developed and that needs to be produced. The new products are thereafter put into a T-‐line (manufacturing line), which shows what type of machines the product will go through. This information is partly the base for the order processors to determine if the product will be produced in-‐house or at OLM.
After the article update a CAD-‐drawing is received from R&D for approval and if everything is ok an e-‐mail with approval is sent to the responsible designer. The designer hence releases the drawing by uploading it to team center, which is a database for all the new drawings. The order processor thereby downloads the released drawing from team center and sends it to OLM if the decision to produce at OLM has been taken. A confirmation is received from OLM by mail if everything is ok and then an operation list is created, including OLM in the operations list, by the order processor and finished when a quote from the purchaser is received. When this is done an approval is sent by e-‐mail to the planner, which has the authority to change the location of manufacturing (in-‐house vs. OLM) depending on the capacity use in-‐house.
Other factors that are significant for the decision of where to produce are the quantity of orders per month and if Sandvik Mining is capable of producing this product. The time spent on communicating with OLM besides the e-‐mailing and confirmation is minimal and only occurs if there are any corrections regarding orders. In the flow chart below the order processor´s work procedure towards OLM is illustrated.

Empirical Data
38
Order Processor: Short & long products
OLMSandvik MiningOrder processor
Start
Article-‐update (1)
CAD drawing received for approval. (2)
Drawing donwloaded & sent to OLM (3)
Operation list created (4)
Confirmation from OLM by
CAD-‐drawing confirmed
Mail sent to planning with
approval
1. Articles are updated and mail is received about new products. T-‐line shows what type of machines the product will go through.
2. Mail with CAD-‐drawing received from R&D for approval.
3. Drawing is downloaded from Team Center and sent to OLM.
4. Operation list is started and finished when quote from purchasing is received.
End
Produce at OLM ?
YesNo
Figure 4-‐9: Order processor process for short and long products.
The work procedure for the order processor that handles short products is quite similar to the first one (see Figure 4-‐10). However, there do exist work procedures according to this order processor. The whole procedure starts through an article update. After the article update the order processor waits until an order is received from R&D to continue with this product. When

Empirical Data
39
the order is received it is decided in collaboration with the production technique and planning department where the product will be produced. Thereafter a CAD drawing is received from R&D or downloaded from team center and sent to OLM to confirm that the drawing is ok. OLM confirms the drawing through a phone call and then the order processor creates an operations list, uploads it in the article register and confirms it for planning. When this is done an order number is received from the planning department and the order processor creates an order. Finally, a product cost calculation is made based on cost for similar products and assumptions.
The contact with OLM occurs when needed and not on a regular basis. What takes most time is to create the order specification including the manufacturing line. Note that if Tempo 2 is performed in-‐house instead of at OLM as initially decided, the goods receiving department might be contacted. On the other hand when doubts about a drawing occurs the responsible designer might be contacted. This order processors work procedure towards OLM is illustrated in the following flow chart.

Empirical Data
40
Figure 4-‐10: Order processor process for short products.
Empirical Data
41
4.4.3 Production technicians There are several production technicians involved with OLM but only two of them have been interviewed. The production technician´s work procedure towards OLM is supposed to be equal, however the flow charts differs from each other’s. There are no control documents for the decision of what is going to be done at Sandvik Mining or OLM, instead the order processors´ and production technicians´ experience and knowledge are used for this decision. Since the production technician only have contact with OLM regarding new and test products it might be difficult to have control documents describing each step since the procedure might differ from product to product according to this production technician.
In Figure 4-‐11 one can see that the work procedure starts with OLM contacting a production technician if any technical deviation is found. Primarily the order processor is contacted and if he or she is available the order processor contacts the production technician if his or her skills are needed. If possible the production technician gives a solution immediately, but sometimes an investigation is needed and in that case the order processor is notified with a solution after the technical investigation. If the production technician does not have the competence to solve the problem it is forwarded to appropriate person e.g. the designer, and thereby the production technician´s process ends.
In the case where the order processor not is available OLM contacts the production technician directly for clarifications. If a solution is found it is given, but if not, an investigation is done or appropriate person is contacted to get a solution. As an alternative OLM is forwarded to appropriate person directly if it is found to be easier in that way.

Empirical Data
42
Production technician
OLMSandvik MiningProd
uctio
n technician
Start
OP available?
OP contacts production
technician (1)
Competence to solve
problem? (2)
Solve and notify OP after investigation
(3)
End
No Yes
Yes No
1. Order processor contacts production technician if his or her skills are needed.
2. If production technician do not have the competence to solve the problem, it is forwarded to another person and the production technician´s process ends.
3. Problem is solved and the order processor is notified. if no solution is found immediately, appropriate person is contacted and a solution is given to OLM. In some cases the problem is forwarded to appropriate person and department directly.
OLM contacts Sandvik AB if any technical deviations are
found
If OP is not available PT is contacted for clarification
Figure 4-‐11: Production technician process.
The second production technician has the same role towards OLM but for the short products. However he described his role as a support function. As with the former production technician the process starts with OLM contacting the production technician, which in turn gives OLM support. It could be questions regarding a drawing or minor errors that the production technician can solve, otherwise the responsible designer is contacted to correct the drawing. If no solution can be given OLM is directed to appropriate department and thereby the process for the production technician ends. This production technician´s work procedure is illustrated in Figure 4-‐12.
The contact between OLM and the production technicians occurs a few times per month and mostly by phone. There are existing work procedures regarding how to work when new products are being brought up, however some of them are still in progress.

Empirical Data
43
Production technician
OLMSandvik MiningProd
uctio
n technician
Contacts Sandvik Mining for support
Start
Gives OLM support (1)
End
1. Support is given and if necessary OLM is referred to appropriate department e.g. the purchasing or R&D department.
Figure 4-‐12: Production technician process 2.
4.4.4 Planner Concerning OLM there is only one planner and this person receives order from the order processors. These orders are already planned either to be produced at OLM or in-‐house. However the planner has the right to change an order from being produced at OLM to be produced at Sandvik Mining if capacity is available. Regardless of this decision an order is created in the ERP-‐system at Sandvik Mining. If the order is going to OLM an e-‐mail is sent and if no answer is received it means that the order is confirmed. If the order is to be produced at Sandvik Mining the process ends after the creation of the order in the ERP-‐system.
A lot of time is spent on changing, mixing and prioritizing orders, and sometimes the due dates needs to be changed. The planner always tries to fill up the capacity use at Sandvik Mining and since there is no existing work procedure for how to handle OLM´s products this is the only guideline that is followed. The planner is also the only one that formally has the executive authority to contact OLM and prioritize orders. When an order status needs to be confirmed the planner might contact the goods receiver. Figure 4-‐13 illustrates the planner´s work procedure.

Empirical Data
44
Figure 4-‐13: Planner process.
4.4.5 Goods receiving The goods receiving process is the procedure that occurs when material is moved between Sandvik Mining and OLM. In Figure 4-‐14 below the process of goods receiving is illustrated. The first step in this process is the receiving of material from the raw material suppliers, Ovako and Tibnor. The materials received from these suppliers are ordered when the planner starts a work-‐order towards OLM. The ordering is done automatically via the ERP-‐system when the planner starts the work-‐order, however this order is not visible for OLM. After receiving the material the next step is to register the material in the ERP-‐system and by this an order is generated and sent to OLM automatically.
After registering the following step is to send the material to OLM for processing (Tempo 1) which is scheduled to take 15 days for long product and 10 days for short products. After Tempo 1 the material is sent back to Sandvik Mining. When arriving to Sandvik Mining the material is registered again, order cards are printed and material is sorted out according to destination. The order cards are printed out in purpose of serving as information for the following processes.
The next step in the process is heat-‐treatment of the material. After heat-‐treatment, material that is going to OLM for Tempo 2 returns to the good receiving and before being sent to OLM there is a process of administration. Order cards that were printed are folded and order sheet is printed. The order sheet is filled in manually with article number, quantity, price, drawing number and desired due date. This physical order sheet and a manufacturing list, containing information of what is needed to be processed on the material, is sent together with the material

Empirical Data
45
to OLM for Tempo 2. After being processed at OLM in Tempo 2 the material is sent back to Sandvik Mining where it is received and registered at the goods receiving.
There are no existing documents regarding work description for the goods receiver. All the routines are based on the good receiver´s experience and nothing is written down.
Goods receiving
OLMSandvik Mining
Goo
ds re
ceiving
Start
Material registered in ERP and order sent to OLM by
EDI
Material handling process (1)
OLM material sent to heat treatment (2)
Order administration
(3)
Material from OLM received and registered
Material from supplier received
Tempo 1(4)
Tempo 2 (5)
End
1. Material from OLM received and registered. Order cards are printed and the material are sorted according to their destination.
2. Material which is supposed to go to OLM for the second tempo is heat treated.
3. Order cards foldered and order sheet printed. Article number, quantity, price, drawing number and desired due date is filled in on order sheet. A manufacturing list is also printed out and sent together with the order sheet and material to OLM.
4. Material is processed (tempo 1)
5. Material is processed (tempo 2)
Figure 4-‐14: Goods receiver process.
4.4.6 Purchaser The purchaser works with development of suppliers, price negotiations, legal agreements and other important issues with suppliers. However with OLM there are no legal agreements. When quality or delivery precision is fading the purchaser may also get involved. The work procedure

Empirical Data
46
for the purchaser towards OLM is vague, therefore no flow chart has been created for this role. The purchaser and planner sit within the same department and works closely with each other when it comes to OLM. The purchaser also has contact with OLM and the quality manager, though very seldom.
In some cases OLM contacts the purchaser for instance when orders are late or when it comes to questions regarding price or lead times. As for the most of the other roles that have been interviewed regarding OLM there are no control documents for the purchaser to be followed.
4.5 Quality insurance process In this sub-‐chapter the quality process is presented and further answers a part of the first research objective under the third research question. The quality insurance process consists of the following roles:
• Quality engineer • Quality controller • Measuring operators.
The quality department has contact with OLM and several sub-‐departments at Sandvik Mining regarding OLM. Departments contacted are R&D, purchasing or goods reception department depending on the type of issue. The contact regarding OLM is initiated when four issues occurs which are the following:
• When Sandvik Mining finds deviation in quality at their site. • When there is a problem concerning a drawing. • When OLM finds deviation on the products at their site but do not know if it still is
acceptable. • When different tools are in need of calibration.
Depending on type of issue different persons at Sandvik Mining are involved, these four issues will be further presented below with text and flow charts under the headlines of respectively responsible person.
4.5.1 Quality Engineer As showed in Figure 4-‐6 the quality engineer is in contact with the quality controller, designers, purchaser and planner regarding OLM. There are two situations that initiate the quality engineer’s work towards OLM. The first situation is when OLM finds a problem with the drawing that has been received about a new product. It starts with a detection of error on a drawing, contact is then initiated with the quality engineer. There can be different kind of problems regarding the drawing. There can be a situation where OLM already has produced parts and then realized that there is an error. The other situation that might occur is that the error is identified on the drawing before production.
Both issues have more or less the same solving-‐process, regardless of how serious the problem is. As illustrated in Figure 4-‐15 below a quality deviation is detected and contact is initiated with the quality engineer. If it shows to be a minor issue that can be solved instantly the quality engineer notifies OLM about what to change.
If the issue is of major concern then an investigation is done at Sandvik Mining in order to locate the reason for this problem. When a solution and counter-‐measure is found, OLM is contacted and given the information about this in order to prevent it from happening again. In these situations it might happen that the quality engineer is not the adequate person to identify a solution for the problem. If so is the case, the problem is delegated to the person who has the
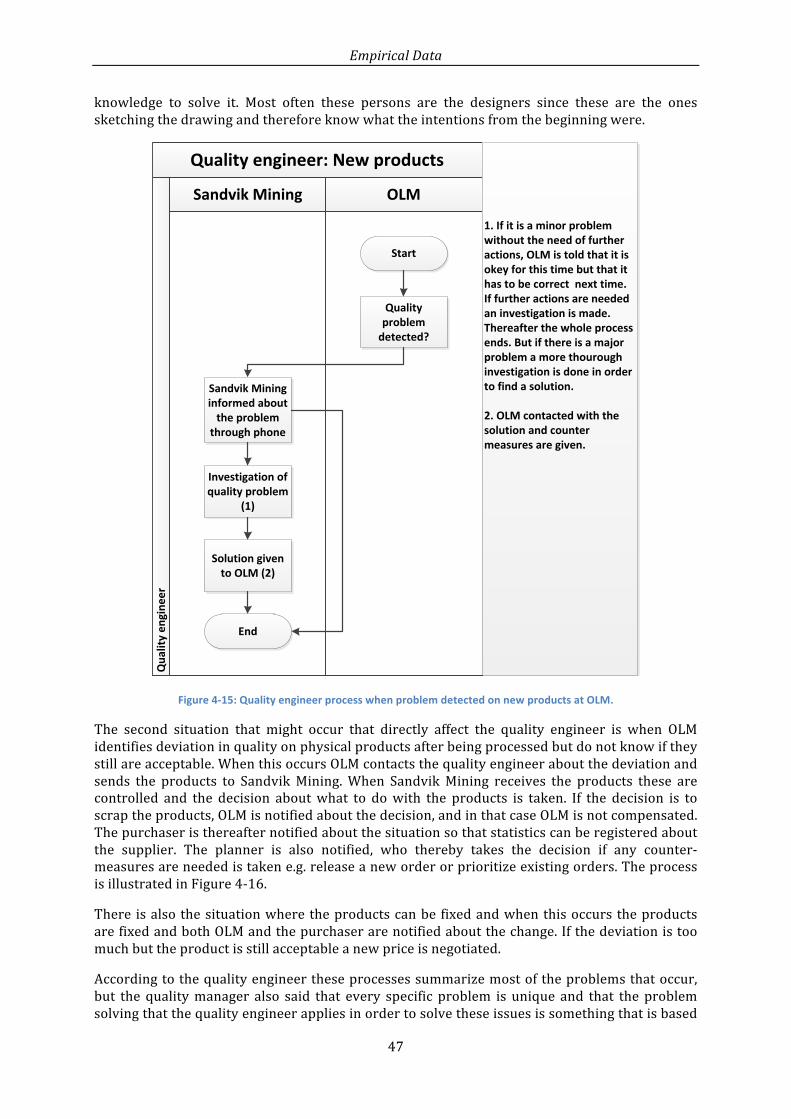
Empirical Data
47
knowledge to solve it. Most often these persons are the designers since these are the ones sketching the drawing and therefore know what the intentions from the beginning were.
Quality engineer: New products
OLMSandvik Mining
Qua
lity en
gine
er
Start
Investigation of quality problem
(1)
Solution given to OLM (2)
End
Quality problem detected?
Sandvik Mining informed about the problem
through phone
1. If it is a minor problem without the need of further actions, OLM is told that it is okey for this time but that it has to be correct next time. If further actions are needed an investigation is made. Thereafter the whole process ends. But if there is a major problem a more thourough investigation is done in order to find a solution.
2. OLM contacted with the solution and counter measures are given.
Figure 4-‐15: Quality engineer process when problem detected on new products at OLM.
The second situation that might occur that directly affect the quality engineer is when OLM identifies deviation in quality on physical products after being processed but do not know if they still are acceptable. When this occurs OLM contacts the quality engineer about the deviation and sends the products to Sandvik Mining. When Sandvik Mining receives the products these are controlled and the decision about what to do with the products is taken. If the decision is to scrap the products, OLM is notified about the decision, and in that case OLM is not compensated. The purchaser is thereafter notified about the situation so that statistics can be registered about the supplier. The planner is also notified, who thereby takes the decision if any counter-‐measures are needed is taken e.g. release a new order or prioritize existing orders. The process is illustrated in Figure 4-‐16.
There is also the situation where the products can be fixed and when this occurs the products are fixed and both OLM and the purchaser are notified about the change. If the deviation is too much but the product is still acceptable a new price is negotiated.
According to the quality engineer these processes summarize most of the problems that occur, but the quality manager also said that every specific problem is unique and that the problem solving that the quality engineer applies in order to solve these issues is something that is based

Empirical Data
48
on experience. There are no what so ever documents regarding work procedures and all knowledge is inherent.
Quality engineer: Detection by OLM
OLMSandvik Mining
Qua
lity en
gine
er
Start
Internal quality problem detected
Sandvik Mining informed about quality problem
Products received and controlled
Scrap? (1)
YesNo
Fix products(2)
End
1. Whether the products are scrapped or not OLM is contacted to inform this and if products are scrapped OLM is not being payed. If the products are scrapped the purchasing department is contacted to inform this.
2. If products are not scrapped they are fixed either at Sandvik Mining or OLM and a new price is negotiated if needed.
Deviation report is done
Figure 4-‐16: Quality engineer process when OLM finds deviation after production.
4.5.2 Quality controller The quality controller’s task is to perform quality controls on the products that arrive at Sandvik Mining. These quality controls are performed randomly on both standard and new products that are introduced. The quality controller’s process is illustrated in Figure 4-‐17.

Empirical Data
49
Quality controller
OLMSandvik MiningQua
lity controller
Start
Sampling
Deviation in quality
Register in system(1)
Notify quality engineer
End
1. Whether there is a deviaiton in quality or not it is registered in the system and thereby the process ends. If there is a deviation the quality engineer is notified before ending the process.
NoYes
Figure 4-‐17: Quality controller process.
During this process, the first thing that happens is to quality check a sample of the received material. If the material passes the control the next step is to register this in an excel-‐file and no further action is taken. If there is a deviation in quality the next step is to register this in the excel-‐file and later notify the quality engineer about it and the quality controllers process ends.
Currently there are no control documents regarding the work for the quality controller, but there are existing control documents regarding how often suppliers products are going to be sampled during a specific period of time.
4.5.3 Measuring department Sandvik Mining provides OLM with equipment for the quality control performed at OLM, and when the expiration date on these tools has expired the tools have to be sent to Sandvik Mining for calibration. In Figure 4-‐18 an illustration of this process is presented.

Empirical Data
50
Measuring operator
OLMSandvik MiningMeasurin
g op
erator
Start
Notification sent to OLM
Expiration date
Calibration and registration (1)
End
Tools sent to Sandvik Mining
Notification received
1. Tools received and calibrated. Thereafter it is registered in the system.
Tools sent to OLM
Figure 4-‐18: Measuring operator process.
Sandvik Mining keeps track of the expirations dates and when the time comes Sandvik Mining sends a notification physically together with the daily deliveries to OLM, informing about which tools that have to be sent to Sandvik Mining for calibration. Further the tools are sent to Sandvik Mining and after the calibration the tools are sent back to OLM.
Currently at the measuring unit there are no existing control documents regarding the practice of the work that is performed at the measuring unit but according to the operators this is in progress.
4.6 Summary of empirical data Following is a brief summary of what have been presented in this chapter.
At first the material flow between Sandvik Mining and OLM was presented. As illustrated in Figure 4-‐3 Sandvik Mining orders material from raw material suppliers (Ovako Forsbacka, Ovako Hällefors and Tibnor), with a delivery time of 5 days. After receiving and registering the material it is sent to OLM for Tempo 1, which has the lead time of 16 days. After Tempo 1 the material is sent back to Sandvik Mining for heat treatment where 84.3% of the material will be left at Sandvik Mining for further processing while the remaining 15.7 % of the material is sent back to OLM for Tempo 2. The annual weight of material sent to OLM is approximately 5060 tons.

Empirical Data
51
The second part that was presented was the information flow. Firstly a chart (see Figure 4-‐5) including all of the departments at Sandvik Mining that are involved with OLM was presented in order to get an overview of how the communication looks. Later on a more thorough chart was presented (see Figure 4-‐6) showing how the communication, on an individual level looks like internally at Sandvik Mining and externally towards OLM.
Lastly, the roles that are involved with OLM were presented more thoroughly. Where their work procedure is presented in form of block-‐diagrams in order to get an understanding of how the work looks on an individual level. Also presented was if there are any control documents regarding the work procedure.
The following table (Table 4-‐3) is a summary of which of the roles that have control documents regarding their work procedure. As seen in the table it is showed that the only roles that are involved with OLM that has some kind of control documents regarding their work procedure are the order processor for short products and the production technicians to some extent. The production technicians have control documents regarding some processes of their work. The rest of the roles do not have any control documents meaning that all of the work performed by these persons is inherent. Furthermore, no steering group or formal boundaries of authorities exists, enabling everyone to contact everybody. This answers the second objective in the third research question in the purpose chapter.
Table 4-‐3: Existing control documents for each role involved with OLM
Role Control documents Designer None Designer None Order processor short & long products None Order processor short products Existing Production technician Existing to some degree Production technician Existing to some degree Planner None Goods receiving None Purchaser None Quality engineer None Quality controller Existing to some degree Measuring operator None

Empirical Data
52
Analysis
53
Analysis This chapter presents an analysis of identified improvement areas and one of them is presented as a business case
Analysis
54
5 Analysis All the figures and flow charts that have been described to this point stands as a base for the decision, concerning an elaboration of the areas where potential for improvement were identified. Three main areas were found to have potential for improvement and are therefore further analyzed in this chapter whereof one is presented as a business case. The upcoming data and calculations in this chapter are based on internal data provided by Sandvik Mining.
The business case will show the possible cost savings in a contingent case where the material that are supposed to go to OLM goes directly to OLM from the raw material suppliers, instead of coming to Sandvik Mining for unloading/ loading and thereafter going to OLM a after day or two. This contingent case would incur a few hours less work per month for the goods receiving staff handling material, while it would incur a few minutes extra work for e.g. the order processors and planner. This amount of time is marginal and has therefore it has not been considered in any cost saving calculations.
The second improvement area that is analyzed concerns the information flow i.e. how should the information flow be structured towards OLM, which steering groups should exist and how should the information be transmitted.
The last area with potential for improvement that was analyzed is about the processes and how these can be improved e.g. by standardization and by having control documents. The chosen elaboration areas were decided in collaboration with the supervisor and purchasing manager at Sandvik Mining.
5.1 Material flow analysis The business case covers the main cost savings in the contingent case where OLM buys the material. However the whole business case is based on forecasts and incoming material to OLM during February 2013 and April 2012, however the two months differed a bit. February was chosen since it was the most recent month at that specific time and April was chosen since it is not affected by any vacations or fluctuations in the demand due to season.
OLM is currently seen and treated in many ways as a part of Sandvik Mining even though it is an external supplier. The information sharing between OLM and Sandvik is quite poor and OLM receives an order a few days before the material is sent to OLM. OLM receives an order with a maximum of one week in advance from Sandvik Mining. This might be a contributing factor for why OLM has low delivery precision and long lead times since they only can plan one week in advance.
As mentioned earlier new and test products correspond to 2% of all orders sent to OLM and these products have the highest uncertainty and longest production lead time. The risk with this uncertainty is that the new and test products might interrupt the production at OLM causing the low delivery precision and extending lead time for standard products. Another aspect that might affect the delivery precision are that no forecasts are shared with OLM resulting in planning issues. In addition, due to that some suppliers deliver the material too early and that there is a lack of space, Sandvik Mining sends the material as soon as possible. This also means that the material arrives too early at OLM, hindering them to plan and prioritize their production in an efficient way, which also could be a contributing factor to the poor delivery precision and inaccurate lead times.
According to Lyson & Farrington (2012) collaboration and information sharing is vital in order to achieve a well-‐functioning supply chain. Therefore, it is important that these two things work properly. Segerstedt (2009) means that SCM strives to reduce costs and increasing value creation through improving the whole supply chain. With these two statements in mind and with the investigation of the material flow it has been identified that it could exist a great
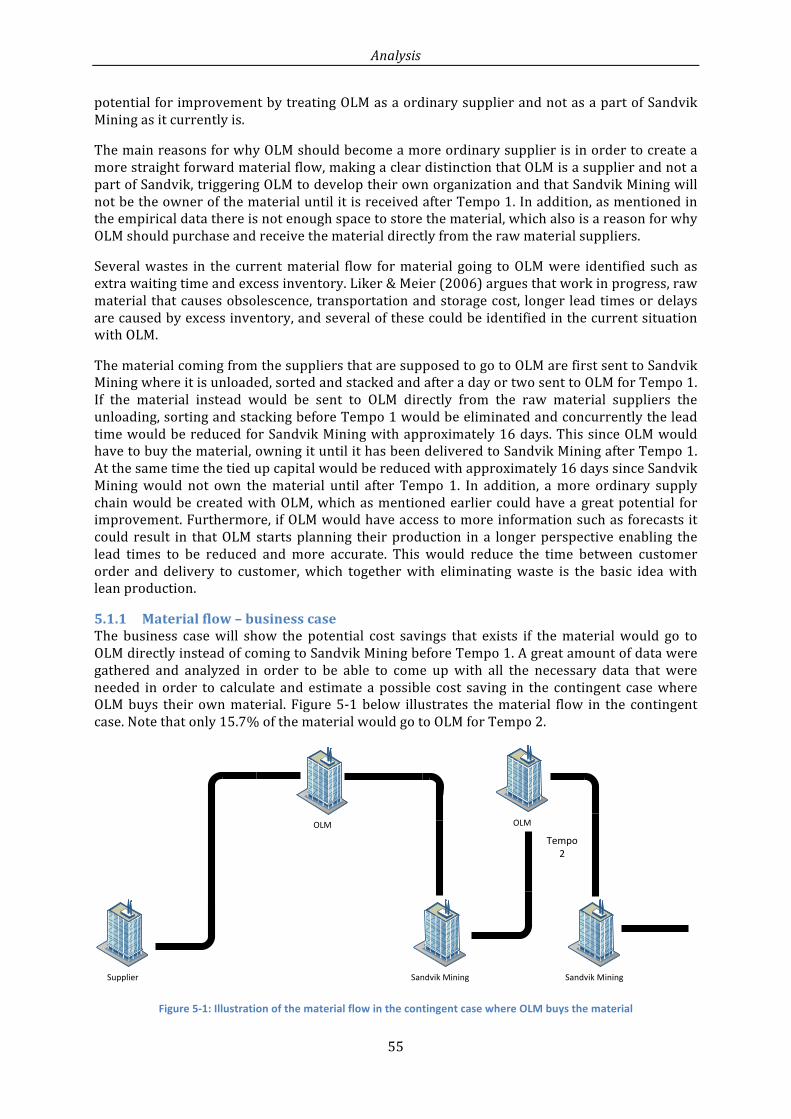
Analysis
55
potential for improvement by treating OLM as a ordinary supplier and not as a part of Sandvik Mining as it currently is.
The main reasons for why OLM should become a more ordinary supplier is in order to create a more straight forward material flow, making a clear distinction that OLM is a supplier and not a part of Sandvik, triggering OLM to develop their own organization and that Sandvik Mining will not be the owner of the material until it is received after Tempo 1. In addition, as mentioned in the empirical data there is not enough space to store the material, which also is a reason for why OLM should purchase and receive the material directly from the raw material suppliers.
Several wastes in the current material flow for material going to OLM were identified such as extra waiting time and excess inventory. Liker & Meier (2006) argues that work in progress, raw material that causes obsolescence, transportation and storage cost, longer lead times or delays are caused by excess inventory, and several of these could be identified in the current situation with OLM.
The material coming from the suppliers that are supposed to go to OLM are first sent to Sandvik Mining where it is unloaded, sorted and stacked and after a day or two sent to OLM for Tempo 1. If the material instead would be sent to OLM directly from the raw material suppliers the unloading, sorting and stacking before Tempo 1 would be eliminated and concurrently the lead time would be reduced for Sandvik Mining with approximately 16 days. This since OLM would have to buy the material, owning it until it has been delivered to Sandvik Mining after Tempo 1. At the same time the tied up capital would be reduced with approximately 16 days since Sandvik Mining would not own the material until after Tempo 1. In addition, a more ordinary supply chain would be created with OLM, which as mentioned earlier could have a great potential for improvement. Furthermore, if OLM would have access to more information such as forecasts it could result in that OLM starts planning their production in a longer perspective enabling the lead times to be reduced and more accurate. This would reduce the time between customer order and delivery to customer, which together with eliminating waste is the basic idea with lean production.
5.1.1 Material flow – business case The business case will show the potential cost savings that exists if the material would go to OLM directly instead of coming to Sandvik Mining before Tempo 1. A great amount of data were gathered and analyzed in order to be able to come up with all the necessary data that were needed in order to calculate and estimate a possible cost saving in the contingent case where OLM buys their own material. Figure 5-‐1 below illustrates the material flow in the contingent case. Note that only 15.7% of the material would go to OLM for Tempo 2.
Supplier
OLM
Sandvik Mining
OLM
Sandvik Mining
Tempo 2
Figure 5-‐1: Illustration of the material flow in the contingent case where OLM buys the material
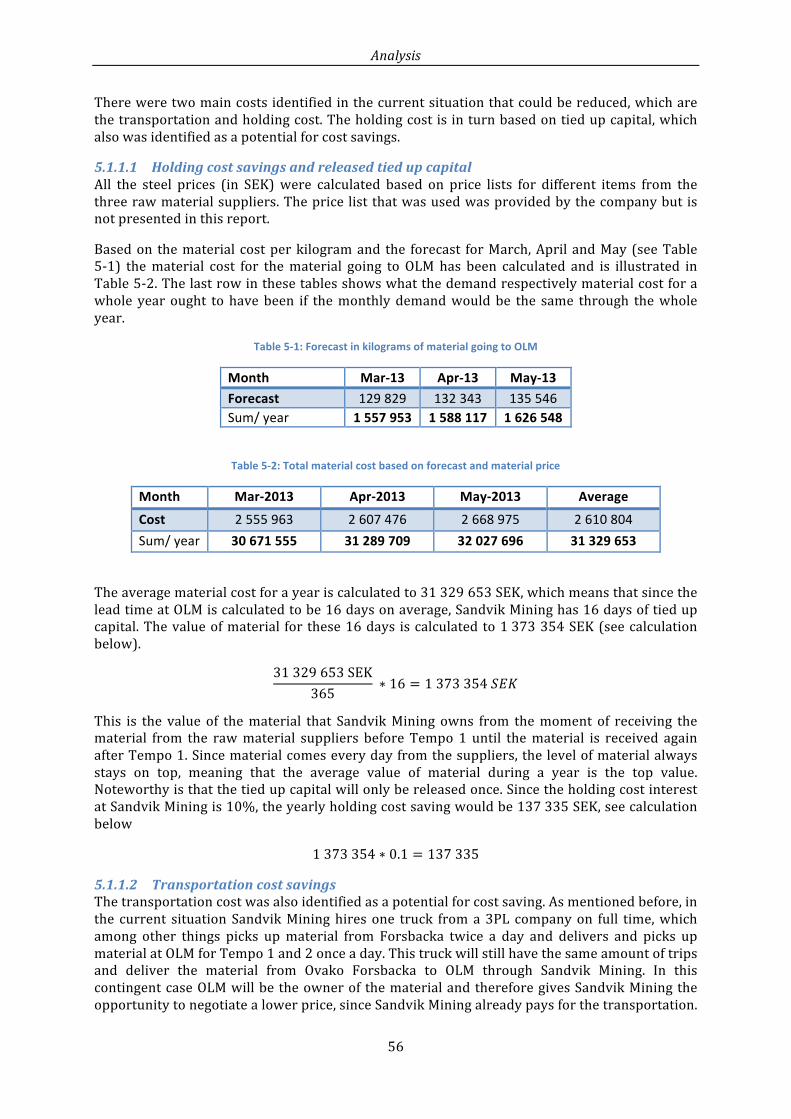
Analysis
56
There were two main costs identified in the current situation that could be reduced, which are the transportation and holding cost. The holding cost is in turn based on tied up capital, which also was identified as a potential for cost savings.
5.1.1.1 Holding cost savings and released tied up capital All the steel prices (in SEK) were calculated based on price lists for different items from the three raw material suppliers. The price list that was used was provided by the company but is not presented in this report.
Based on the material cost per kilogram and the forecast for March, April and May (see Table 5-‐1) the material cost for the material going to OLM has been calculated and is illustrated in Table 5-‐2. The last row in these tables shows what the demand respectively material cost for a whole year ought to have been if the monthly demand would be the same through the whole year.
Table 5-‐1: Forecast in kilograms of material going to OLM
Month Mar-‐13 Apr-‐13 May-‐13 Forecast 129 829 132 343 135 546 Sum/ year 1 557 953 1 588 117 1 626 548
Table 5-‐2: Total material cost based on forecast and material price
Month Mar-‐2013 Apr-‐2013 May-‐2013 Average
Cost 2 555 963 2 607 476 2 668 975 2 610 804 Sum/ year 30 671 555 31 289 709 32 027 696 31 329 653
The average material cost for a year is calculated to 31 329 653 SEK, which means that since the lead time at OLM is calculated to be 16 days on average, Sandvik Mining has 16 days of tied up capital. The value of material for these 16 days is calculated to 1 373 354 SEK (see calculation below).
31 329 653 SEK365
∗ 16 = 1 373 354 𝑆𝐸𝐾
This is the value of the material that Sandvik Mining owns from the moment of receiving the material from the raw material suppliers before Tempo 1 until the material is received again after Tempo 1. Since material comes every day from the suppliers, the level of material always stays on top, meaning that the average value of material during a year is the top value. Noteworthy is that the tied up capital will only be released once. Since the holding cost interest at Sandvik Mining is 10%, the yearly holding cost saving would be 137 335 SEK, see calculation below
1 373 354 ∗ 0.1 = 137 335
5.1.1.2 Transportation cost savings The transportation cost was also identified as a potential for cost saving. As mentioned before, in the current situation Sandvik Mining hires one truck from a 3PL company on full time, which among other things picks up material from Forsbacka twice a day and delivers and picks up material at OLM for Tempo 1 and 2 once a day. This truck will still have the same amount of trips and deliver the material from Ovako Forsbacka to OLM through Sandvik Mining. In this contingent case OLM will be the owner of the material and therefore gives Sandvik Mining the opportunity to negotiate a lower price, since Sandvik Mining already pays for the transportation.
Analysis
57
Another aspect is that material coming from Ovako Hällefors and Tibnor will not go through Sandvik Mining anymore. With less material being sent to OLM by the truck hired from Sandvik Mining, gives the opportunity to revise the usage of this truck and see if there is a possibility for cost savings. However, this cost saving has not been included in the business case due to the complexity to investigate.
Nevertheless, there are two other transportation costs, one from Tibnor and one from Hällefors that that has been taken into consideration since the material coming from these suppliers are delivered in other trucks. These transportation costs are calculated below.
Internal data shows that Tibnor, which only produces one out of five steel types sent to OLM, charges 4.79 SEK/ kilogram in transportation costs and since 88% (51 696kg/ year) of the material weight sent from Tibnor is supposed to go to OLM, it means that there is a great potential for cost reduction. The calculations below show how much that can be saved in transportation costs from Tibnor in the contingent case.
51 696 ∗ 4.79 = 247 624 𝑆𝐸𝐾 𝑝𝑒𝑟 𝑦𝑒𝑎𝑟
Another aspect that needs to be considered with the new material flow and Tibnor is that the transportation cost is based on weight and a minimum weight is required to obtain the current price. Since 88% of the material coming from Tibnor goes to OLM it is of essence to consider the new transportation cost for the remaining 12%, i.e. approximately 500 kg/ month that Sandvik Mining still will receive.
The annual weight of material coming from Hällefors is 942 588 kg. Giving that the transportation cost from Hällefors is 0.20 SEK/ kg it would give a total transportation cost saving of 188 518 SEK/ year, see calculation below.
942 588 ∗ 0.2 = 188 518 𝑆𝐸𝐾
The total transportation cost saving for transports from Tibnor and Hällefors is:
247 624 + 188 518 = 436 142 𝑆𝐸𝐾 𝑝𝑒𝑟 𝑦𝑒𝑎𝑟
The annual cost savings from both the holding cost and transportation cost gives the sum of:
436 142 + 137 335 = 573 477 𝑆𝐸𝐾 𝑝𝑒𝑟 𝑦𝑒𝑎𝑟
Finally, it is of essence to consider OLM’s new cost, which has not been calculated since there are many factors to take into consideration. Furthermore, it was not within the scope of the purpose.
5.1.2 Material flow summary Due to that the calculations are based on forecast the results from the calculations have been rounded to an annual saving of 570 000 SEK and released tied up capital to 1 370 000 SEK
Besides the cost savings it is important to consider that if OLM buys the material it means that Sandvik Mining will be charged a higher price. This due to that OLM not only will charge Sandvik Mining for the processing cost but also for the material cost and all extra costs such as transportation and holding cost that supervene if OLM buys the material. Initially it will not create any value for OLM, however it should trigger OLM to develop their planning which is a step towards reducing the lead times and increasing the delivery precision, which is a benefit for both companies and the purpose of a supply chain according to Christopher (2011).
The main advantages with the contingent case are that Sandvik Mining will release tied up capital due to the reduced lead time as well as reduce the holding and transportation costs. Other advantages are that OLM will be considered as an external part by becoming a more ordinary supplier, which purchases the material and by this creating a more straightforward

Analysis
58
supply chain. Furthermore, it should also trigger OLM to develop their organization since OLM no longer will be treated as a part of Sandvik Mining. Additionally the goods receiving department at Sandvik Mining will not handle the material before Tempo 1, which for the moment is done and can be seen as a waste. If OLM would receive forecasts it would enable them to plan their production in a longer perspective and thereby possibly reduce the lead time for the whole supply chain as well as gaining economies of scale. Lastly, the structure towards OLM will be as a more ordinary supply chain enabling Sandvik Mining to work with OLM as a ordinary supplier, improving the delivery precision and continuing eliminating waste from an improved position.
5.2 Information flow analysis
5.2.1 Supply chain information flow analysis As mentioned earlier Sandvik Mining should consider making OLM a more ordinary supplier. In order to have a well-‐functioning supply chain the information flow and technology between OLM and Sandvik Mining should become better, since technology is one of the most important enablers for a well-‐functioning supply chain (Lyson & Farrington, 2012). According to Vanpoucke et al (2009) there is a relation between the amount of information shared and the overall performance of the supply chain, supply chains with less information sharing perform poorer in comparison to supply chains that use more information sharing.
5.2.1.1 Internal data analysis As mentioned earlier Sandvik Mining uses fixed lead times for their standard products when being sent to OLM for processing even though these lead times are not updated to the actual lead time. Long products have a lead time of 15 days, short products 10 days and product sent for Tempo 2 has 10 days as well. By letting the ERP-‐system to set the end dates to specific days (not only on Fridays), and set the lead times more accurately i.e. set specific lead time for every product type, the delivery precision should be improved. Furthermore, the theoretical lead time would also be decreased since the end dates not will be extended to the next Friday in that specific week. This means that the lead time for the next operation can be planned to start up to four days earlier.
Therefore, the recommendation for Sandvik Mining is to revise the existing information data, such as the lead times, making the lead times more accurate and adjusted to specific product types. By updating this information it generates the possibility to improve the supply chain since more accurate data will be used.
5.2.1.2 Inter-‐company communication analysis The communication between OLM and Sandvik Mining occurs through phone, e-‐mail, ERP-‐system and physical meetings. Lyson & Farrington (2012) state that one of the most important enablers of a well-‐performing supply chain is achieved by having compatible IT-‐systems. This is not the case with OLM and Sandvik Mining in the current situation. The ERP connection between OLM and Sandvik Mining consists today of that an automatic order is generated and sent to OLM when Sandvik Mining receives the raw material. The order is then printed out at the site at OLM and manually registered into the ERP-‐system at OLM.
Also notable is that the forecast that OLM receives from Sandvik Mining is as a maximum one week in advance, making it difficult for OLM to plan their production. Improving the collaboration between companies by using tools such as CPFR will give the possibility to automatize different processes between the companies such as sharing information about planning, forecasting and replenishment. Fliedner (2003) states that the supply chain benefits of using CPFR are improved forecast accuracy, lower system expenses and reduction of stocking points (making a more direct material flow). By reducing the number of stock points the amount of inventory in the supply chain will decrease which in turn will shorten the total lead time of the supply chain (Srinivasan, 2004). A compatible IT-‐system will also automatize the ordering

Analysis
59
and billing, without any manual labor. In addition, according to Vanpoucke et al (2009) a more sophisticated information sharing between the companies could improve the supply chain coordination and decrease the supply chain cost, which is desired in this case
5.2.2 Internal structure analysis As presented in the chapter “Empirical data” it is identified that there are different divisions with several employees at Sandvik Mining that are involved with OLM, matter of fact there are approximately 50 employees that are in contact with OLM.
The organizational structure that is present at Sandvik Mining, though it is not formal, can be identified as Galbraith et al (2001) claims a product form, where the company is divided according to products. This since it was identified that Sandvik Mining had multiple contact points with OLM, divisions working independently, and that there were a poor internal collaboration between the divisions, which might hinder the possibility to achieve benefits such as economies of scale (Shani, Chandler, Coget, & Lau, 2009). Economies of scale could be achieved by placing orders with similar products next to each other’s for instance. This is only possible if there is collaboration and mutual planning at Sandvik Mining, which currently is poor.
Due to that Sandvik Mining was identified to have a product organizational structure with many employees contacting OLM results in an issue regarding prioritization of orders. Furthermore, there are a lot of different employees with different information resulting in difficulties for OLM to cope with all of this information. As Lyson & Farrington (2012) states the most important enabler of a well-‐functioning supply chain is the organizational infrastructure. Furthermore, it is important to have a structure that facilitates to follow the strategy and also to have an organizational structure of business units and functional areas that suits the company in order to enable a smooth supply chain. Hence the need to build an organizational structure in order to create a more clear and straight forward information sharing between Sandvik Mining and OLM.
In some cases a functional organization structure is more efficient than organizations with a product organization structure Shani et al (2009). Having a more functional structure interface towards OLM would generate a more straightforward information sharing and a clearer hierarchy of which persons that has the authority when it comes to prioritizing and decision making.
5.2.2.1 Standard products The process flow charts in the empirical data chapter showed that most of the communication occurs when new and test products are being developed or produced. The communication regarding standard products occurs automatically without any human intervention. Therefore, two different information flow structures have been developed depending on the type of product that will be produced. Since all communication occurs automatically when it comes to standard products there is no need for human intervention between some departments, hence the possibility to only allow a few individuals in the new information flow structure to have contact with OLM for standard products. Figure 5-‐2 below illustrates an alternative structure for the communication structure towards OLM between departments for the standard products.

Analysis
60
Figure 5-‐2: Alternative communication structure between departments for standard products
Figure 5-‐2 has been further developed to an individual level to illustrate how the future communication flow between the individuals ought to be for the standard products, see Figure 5-‐3. In the middle of the figure one can also see a box consisting of the planner and order processors which are the ones that form a steering group, see Steering group in sub-‐chapter 5.2.2.3. The thickness of the arrows illustrates the level of authority towards OLM where the thickest is the most authorized.
Figure 5-‐3: Alternative communication structure between individuals for standard products

Analysis
61
While the current communication structure towards OLM is vague, this alternative one is a functional structure which according to Galbraith et al (2001) has the advantages of knowledge sharing, specialization and standardization. One of the disadvantages might be that there is a lack of cross-‐functional processes but since the standard products rarely causes any problems there is no risk for that. If necessary the different roles at Sandvik Mining should have the possibility to contact each other even though this not might happen too often. Nevertheless, the knowledge and information sharing towards OLM is vital in this case which is achieved with a functional structure and which also are some of the advantages of having a functional structure according to Galbraith et al (2001). This structure should lie as a base for all lego-‐suppliers in order to create an identical and standardized interface towards all lego-‐supplier.
5.2.2.2 New and test products There are more departments involved with OLM when developing new and test products. Therefore, it is of great importance to keep the communication between OLM and these departments because of the importance of OLM´s involvement in the development process. This means that everybody at Sandvik Mining should be allowed to contact whoever is necessary as long as it is for development issues.
As mentioned earlier the current communication structure (see Figure 4-‐6) can be seen as a product structure which for the new and test products might be the most appropriate one. Since two different structures are proposed depending on product type the main structure for Sandvik Mining will be a hybrid structure. This structure allows the employees to follow the functional structure for standard products and the product structure for new and test products. However regardless of structure a clear division of authority towards OLM is also recommended in order to create an efficient communication flow. The steering group created for the standard products would be the same for the new and test products.
5.2.2.3 Steering group A steering group is proposed consisting of the planner and order processors which ought to be the ones managing the relationship with OLM for all products. This since they already are the ones deciding what to produce at OLM in the current situation and also because they are the ones with the necessary knowledge and data to follow the three priority rules, which still will be followed. For instance the order processors are the one with the knowledge of what can and should be produced at OLM while the planner is the one who has the overall view of the capacity. However the planner should be the one with the executive authority. Since the standard products stands for approximately 98% of all the orders sent to OLM it is of essence that a clear and organized structure is emphasized and followed for these at Sandvik Mining.
Furthermore, the steering group has the purpose to create a united Sandvik Mining front towards OLM. The steering group should when necessary, during meetings discuss what should and can be produced at OLM during a specific period. Sandvik Mining should use existing information at to create forecast and solve issues that occurs with OLM. Since the administrational handling of standard product is automatized there is not a high human interference in that flow. Therefore, the meetings should occur when there is a need of new forecasts, priority issues and decisions regarding where to produce (Sandvik Mining or OLM) or other kind of deviations that needs to be solved.
5.2.2.4 Goods receiver, quality manager and purchaser The goods receiver and quality manager should also be allowed to have direct contact with OLM to a limited extent, since some issues only regards these roles e.g. the calibration of tools and quality problems detected at either OLM or Sandvik Mining. This direct contact enables these persons to handle an issue within their specialized area such as a quality problem direct with OLM, mitigating the risk of dropping information due to a longer information chain. The specialization is one of the advantages with a functional structure and is therefore another

Analysis
62
reason for having a functional structure. The roles at the bottom of the structure may not be involved with OLM for standard products but should not be excluded.
Lastly, the purchaser should also have contact with OLM regarding negotiation about pricing and legal agreements but also perform follow-‐ups when there are deviations in delivery precision and quality etc. The purchaser should only discuss the issues mentioned above and not the products, priority or product status per se. The purchaser has therefore been placed at the same level as the planner but with focus on other kind of questions.
5.2.2.5 Designers, production technicians and quality manager The communication with OLM from designers, production technicians and quality manager should only consider development and quality issues i.e. each role should have clear boundaries and responsibilities. The goods receiving department will still have the paper sheet transferred to OLM for Tempo 2, even though this in the future could be improved with a more sophisticated ERP-‐system, which already is in progress. Furthermore, the steering group should consist of the same role i.e. the planner and order processor, regardless of structure. As mentioned earlier the planner should be the only one with the authority to prioritize orders since this person is the most appropriate one for this purpose regardless of structures.
5.2.3 Information flow summary As stated earlier the information sharing between OLM and Sandvik Mining is poor. In order to enable the information sharing with OLM, Sandvik Mining should consider developing their ERP-‐system collaboration with OLM. Today the communication occurs through phone, e-‐mail, mail or physical meeting and a lot of these processes can be excluded and automatized by a more sophisticated ERP-‐system collaboration. This collaboration should generate benefits for the supply chain as whole in terms of shorter lead times and more accurate delivery precision.
The data that Sandvik Mining is using is too inaccurate, the data should be revised and used on a product type level. In order to increase the accuracy of the information and reduce the theoretical lead time, the end-‐dates, which today are set to Fridays, should also be revised and changed so that end-‐dates can be set to specific days.
Finally, the organizational structure should be revised and looked upon. Sandvik Mining has been identified to have a product group organization, and one of the cons of this organization is that there are too many contact interfaces present in the relationship between OLM and Sandvik Mining for standard products. These interfaces can create priority issues at OLM resulting in low delivery precision. Therefore, a new organizational structure has been suggested for standard products, a more functional one, where there is a clearer division of the organization and authority. This structure should be the formal one for standard products while the structure for new and test products should be the same as the current one. Both structures should be emphasized as the formal ones depending on product type i.e. a functional structure for standard products and a product structure for new and test products i.e. a hybrid structure. Furthermore, the new structures should lie as a base and be possible to be applied for all lego suppliers in order to create an identical and standardized interface towards all lego suppliers. The main differences for the different roles due to the change in the communication structure towards OLM would be that a steering group consisting of the order processors and planner (which takes the final decisions) is created.
Analysis
63
5.3 Processes analysis As Olhager (2000) states the analysis of the processes can vary in level of detail and information depending on the purpose of the charts. In this case the purpose was to map the interfaces in the information flow in the current situation. Therefore, detailed mappings of individual processes were performed to identify all the interfaces towards OLM. The process activities were identified and categorized and at the same time the whole process for each role regarding OLM was documented which according to Olhager (2000) are the fundamental steps in a process flow analysis.
It was identified that the amount of roles involved with OLM varies depending on type of product that is referred. For the standard products there are almost no contact between individuals since most of the communication occurs automatically through the ERP-‐system while there are a lot of communication through e-‐mail, phone and physical meetings between individuals when it comes to new and test products that are being developed. Irrespective of product type there are no standardized ways of working or any control documents (except for a few ones, see Table 4-‐3) towards OLM i.e. almost everything is based on know-‐how and experience. According to Liker & Meier (2006) standardization is needed in order to be able to compare possible improvements but if there are no standardizations there are no reference points to compare with.
Also having no standardization makes Sandvik Mining vulnerable since almost nothing is written down. For instance, if a new person is employed it is impossible for that person to follow any guidelines for their work. In addition, the analysis showed that some individuals e.g. the designers act differently in the same situation. This might be due to that there are no standardized ways of working. Hence why the designers do what for the moment is most comfortable, even though this might not be the most adequate. For instance, one designer contacts OLM directly for order status while another designer contacts the planner for the same type of question. This order status contact with OLM might be one of the reasons that cause a priority issue for OLM.
Even though the new and test products only stand for approximately 2% of all the orders, most of the contact occurs regarding these products, hence the importance of having control documents and standardized processes. But Liker & Meier (2006) state that a main prerequisite for standardization is that the tasks are repeatable. This could be an issue since every contact and procedure during the development process might differ from each other even though the contacts are repeatable.
5.4 Action plan As mentioned earlier in the analysis, several improvements have been suggested for a better relationship such as formalizing the organizational structure, standardize the work tasks and making OLM a more ordinary supplier by changing the material flow. In Figure 5-‐4, an action plan is presented which shows how the work should progress at Sandvik Mining in order to, improve the accuracy of the lead times, reduce the lead times and improve the relationship with OLM.
Firstly, it is recommended to standardize the work tasks, which also should be the base for the creation of control documents and will be used as guidelines for every role. This process should approximately take 6 months and be created by the different roles involved with OLM. Since some roles involve several persons e.g. the designers and order processors, it is important that these persons agree upon a common standard that all persons with this role follows. This process ought to be controlled by the manager of each role to secure that it has been done.
Simultaneously the organizational structure should be formalized in order to create a structure with clear division of authority at Sandvik Mining. This process does not have a formal end date, it is a change that should be made and maintained in the future as well as emphasized for every

Analysis
64
role involved with OLM. Therefore, it is important to involve the top managers consisting of the production unit manager, purchasing & logistics manager, production manager, R&D manager and sourcing manager and that this group reaches consensus and decides that the new structure is the currently best one and thereby should be followed. The top managers should thereby work as a supportive function towards the involved roles and secure that the new structure is followed. It is important to achieve the top managers´ support since it otherwise will risk phasing out and return to how it was done before. This is a top-‐down management way of performing a change i.e. that the power to execute the change lies on the top management, which pushes the change through the organization (Tsai & Beverton, 2007). Furthermore, OLM has to be informed that the new structure is the formal one and that the planner is the only one with the executive authority.
It is also recommended to initiate the revision of the data about the lead times, which currently is recognized as inaccurate. The process of updating the lead times is seen as the beginning of implementing a new material flow and is considered to take approximately 2 months. The next process that follows is to negotiate new prices with OLM, which should take approximately 3 months. The purchaser in collaboration with OLM should perform the update and agreement of new lead times and prices. Finally, the new material flow should be implemented, which is approximated to take 6 months. The implementation should be held and chaired by the purchaser.
Figure 5-‐4: Action plan
During this time, while these steps are executed there will be a development of the ERP-‐system. The planning of a new ERP-‐system at Sandvik Mining has already been initiated and is a process that involves Sandvik Mining as a whole and not only the relationship with OLM. This is a process that is ongoing throughout the whole supplier development between Sandvik Mining and OLM. Still it is of the essence to implement an ERP-‐system that will enable a more efficient collaboration between Sandvik Mining and OLM. Moreover, the new ERP-‐system ought to be able to be used equally with all suppliers but at the same time differently depending on type of relationship.
Discussion
65
Discussion This is the chapter where the authors discuss the analysis base on two main questions.

Discussion
66
6 Discussion 6.1 Is the new material flow the primary solution to the actual problem? Can the real problem lie in the information sharing between Sandvik Mining and OLM? Our focus has primarily been on the material flow between the companies. But, what if the real solution lies in the information sharing between the companies.
Are the new and test products causing the low delivery precision? As we mention earlier approximately 2% of all orders regards new and test products, and these can delay standard products up to 4 days. The 16 days of lead time at Tempo 1 has most likely been affected negatively by these 2%, since these products use to have a longer lead time than standard products. Our opinion is that Sandvik Mining might have too little information about OLM’s production and capacity making it harder for Sandvik Mining to know what and how much to put on lego and which problems it causes OLM. According to Lyson & Farrington (2012), information sharing is vital for a well-‐functioning supply chain, therefore it is important that the information sharing between these two companies work properly in our opinion.
How does the prioritization affect the delivery precision? Sandvik Mining seems to have problems planning the prioritization at OLM between standard and new and test products, and that could be a reason why OLM has a low delivery precision. The problem with capacity usage when producing standard and development products in the same production seems to be a common problem for manufacturing companies with R&D departments, Macintosh (2007).We are of the opinion that Sandvik Mining does not know how much their prioritization affects the production at OLM. We think that prioritizations made by Sandvik Mining should not affect the delivery precision i.e. if Sandvik Mining prioritizes a product causing a delay for other products, it is important to emphasize that this is due to Sandvik Mining themselves and not due to OLM.
Can capacity reservation be a part of the solution? One solution to this might be to have reserved capacity for these type of products which the R&D department can dispose as they want. However the steering group should be notified when new and test products are being developed and needs to be produced at OLM. This would enable the planner to plan the production and prioritize orders more efficiently.
Maybe not all suppliers should be treated equally! It is also important to consider if OLM´s delivery precision ought to be as high as other supplier´s which not produces complex products as OLM does. It maybe should be allowed that OLM has a delivery precision with a wider range of acceptance due to the complexity and quality of the products and the high service level from OLM.
6.2 Will the new material flow be beneficial for all parties? The purpose with SCM is that all parties involved gain benefits i.e. that a win-‐win situation is created for all parties involved through collaborating. Furthermore, SCM is also about focusing on one´s core competence and capabilities. Hence the reason to ask oneself, what it is that differentiates one’s company from the competitors´. (Christopher, 2001)
In the contingent case, that is presented, where OLM buys the material instead of Sandvik Mining the question that we ask ourselves is if this is a win-‐win situation for both companies. The risk is that only one company gains benefit, or that both of the companies lose when going through this change. It is easy to only go after what is measurable and miss other important things that are more complex to put a monetary value on e.g. the R&D collaboration with OLM.
What if only Sandvik Mining benefits from the new material? It is important to remember that OLM´s core competence is to produce a variety of complex products and small batches with an almost excellent quality and service level. By initiating this change it forces OLM to start with three new functions, which are purchasing, transportation and storing. A win-‐lose situation that

Discussion
67
might occur in this change according to us is that OLM maintains the same quality and capability to produce various products but the initiation of three new functions strikes harsh on the company financially, while Sandvik Mining do not pay more. We think that it is important to consider if it is necessary to treat OLM in the same way as an ordinary supplier; what if the current material flow is the best one? OLM is maybe not a good performer in purchasing material, storing material and planning transportations. OLM should maybe only focus on their core competence which is to produce products that Sandvik Mining cannot, helping Sandvik Mining when they are in need when it comes to capacity and support Sandvik Mining’s R&D department.
What if only OLM benefits from the new material flow? A lose–win situation that might occur in this change is that the material flow change triggers OLM to improve their business in general and that OLM manages to successfully do this change. This would make OLM a more complete and competitive supplier, giving them the opportunity to acquire new customers. Challenging the suppliers is in accordance with SCM in order to improve the whole supply chain, however, this might in turn affect Sandvik Mining due to that OLM´s capacity has to be shared with other customers. This would thereby force Sandvik Mining financially due to that Sandvik Mining might have to get a new supplier. We think that Sandvik Mining should consider the risk with making OLM an ordinary supplier, is there a possibility that, maybe in a far or near future, Sandvik Mining will lose OLM as a supplier together with their knowledge and capabilities.
What if neither company benefits from the new material flow? The worst scenario that might occur is that neither of the companies benefits on the change. OLM is considered as a rather important part of Sandvik Mining’s R&D, and by making OLM a more ordinary supplier it could lead to that Sandvik Mining loses out on the expertise given by OLM in the product development process. There is a strong relationship between long-‐term profitability and investment in R&D according to Chiesa & Masella (1996), and in this case Sandvik Mining might just be doing the opposite. We are of the opinion that it is important for Sandvik Mining to see past the tangible cost savings that are presented in our material flow case and consider potential consequences with OLM´s involvement in the development process if the material flow is changed. We also think that by forcing OLM to deal with the new functions could affect OLM’s core competence in a negative way, since it probably would be the key person at OLM that will manage these new functions. In addition, OLM might not even be capable of managing new functions. It is according to us a big challenge that OLM has to go through and OLM is the company that has to deal with all the additional costs involved with the new material flow, which can affect the company financially, making them the loser.
Is it even necessary to change the material flow? Maybe the relationship can be improved just by structuring up the organization at Sandvik Mining. The risk with changing the material flow is that the problems that actually exist at Sandvik Mining not are solved. In addition, another problem might be created at OLM. The actual problem that seems to exist is that the structure and boundaries towards OLM is poor, and not the actual purchasing of material or transportation from the suppliers per se. At a first look there are some savings to achieve by changing the material flow but at the same time the new costs have not been taken into consideration in the business case due to its complexity and the risk is that the new costs will exceed the savings. Furthermore, the risk of losing some of OLM´s core competence.
How does Sandvik Mining see the relationship with OLM in the future? Is the aim with the relationship making OLM an ordinary supplier or to maintain the current competences and capabilities? The real question maybe is if it is possible to change OLM to an ordinary supplier and at the same time maintaining their core businesses.

Discussion
68

Conclusion
69
Conclusion This chapter concludes the key findings of the case study

Conclusion
70
7 Conclusion As stated in the purpose, this case study aims to clarify how the overall relationship looks between Sandvik Mining and OLM. This was done by investigating and analyzing three areas that were identified as improvement areas. These areas are the material flow, information flow and processes that are performed regarding OLM.
The material flow business case was identified to have the highest potential for cost reduction and lead time reduction. The information flow analysis showed that no formal structure exist towards OLM and therefore the communication occurs in a unstructured way, causing priority issues and extended and inaccurate lead times. Finally, the processes analysis of each role involved with OLM showed that most tasks are made on experience, which makes the company vulnerable in the future since almost nothing is written down on paper.
The first issue the case study cover is the material flow that is present between Sandvik Mining and OLM. Currently Sandvik Mining is purchasing the material from raw material supplier, receiving it at their plant before being sent to OLM. This material flow has been analyzed and a new contingent material flow has been suggested and presented as a business case. In the new material flow the material is re-‐directed from the raw material suppliers to go directly to OLM and thereby skip the holdup at Sandvik Mining. The business case shows that Sandvik Mining will reduce the lead times with 16 days, releasing approximately 1 370 000 SEK in tied up capital. Furthermore, the business case also shows that there will be a cost saving of approximately 570 000 SEK annually with the new material flow due to saving in the transportation and holding cost.
The second issue the case study cover is the information flow between Sandvik Mining and OLM, which today is vague. Furthermore, it turned out that the data about lead times is inaccurate and no clear structure towards OLM exists. This has among other things led to priority issues for OLM, which in turn has generated that the delivery precision is lower than other lego suppliers’. The authors have recommended that Sandvik Mining should have two different approaches towards OLM. When standard products are being discussed the only contact with OLM should occur through the steering group that consists of the planner and the order processors. On the other hand when new and test products are being discussed and developed it is of the essence to have the communication between for instance the designers and OLM due to importance of OLM´s involvement when developing new products. Therefore, the structure towards OLM for new and test products should be the same as the current one, which was identified as a product structure. However it must be emphasized that there are boundaries and that there is a steering group which has the executive authority. Furthermore, the aims with the new structures are that they should be applicable to be used for all lego suppliers that Sandvik Mining has.
The final area that the case study covers is the work processes of the different roles´ at Sandvik Mining that regards OLM. All of the processes are illustrated and finally analyzed on a brief level. The authors identified that the standardization of the processes are vague, which makes Sandvik Mining vulnerable. Therefore, it has been recommended that the work processes has to be standardized and written down in order to be able to improve the processes from the best known practice and thereby make it easier to introduce new employees.
Finally, the thesis is wrapped up with a discussion about two important main questions that are worth thinking through before performing any changes mentioned in the case study. The first question is if the new material flow is the primary solution to the actual problem and the second question is if the new material flow will be beneficial for all parties.

References
71
8 References Allabolag. (2011). allabolag. Retrieved Mars 26, 2013, from www.allabolag.se
AngloAmerican. (2013). AngloAmerican. Retrieved March 5, 2013, from http://www.angloamerican.com/about/ataglance
Bergman, B., & Klefsjö, B. (2010). Quality from customer needs to customer satisfaction. Lund: Studentlitteratur.
BHPBilliton. (2013). BHP Billiton. Retrieved March 5, 2013, from http://www.bhpbilliton.com/home/Pages/default.aspx
Blackstone, J. H., & Cox, J. F. (2005). APICS DICTONARY. Athens, Georgia: APICS The association for operations management.
Boliden. (2013). Boliden. Retrieved March 5, 2013, from http://www.boliden.com/
Carr, L. P., & Nanni Jr, A. J. (2009). Delivering results: Managing what matters (1st ed.). New York: Springer US.
Chiesa, V., & Masella, C. (1996). Searching for an effective measure of R&D performance. Management Decision, 49-‐57.
Christopher, M. (2001). An integrated model for the design of agile supply chains. International Journal of Physical Distribution & Logistics Management, 31, 235-‐246.
Christopher, M. (2011). Logistics & Supply Chain Managment (4th ed.). Harlow: Financial Time Prentice Hall.
Fliedner, G. (2003). CPFR: an emergin supply chain tool. Industrial Management & Data Systems, 103(1), 14-‐21.
Galbraith, J., Downey, D., & Kates, A. (2001). Designing Dynamic Organizations: A Hands-‐On Guide for Leaders at All Levels. Saranac Lake: AMACOM Books.
Gudehus, T., & Kotzab, H. (2012). Comprehensive Logistics (2nd ed.). Berlin: Springer.
Johnson, G., Scholes, K., & Whittington, R. (2008). Exploring Corporate Strategy. Essex: Prentice Hall.
Jonsson, P., & Mattsson, S.-‐A. (2005). Logistik: Läran om effektiva materialflöden (1:4 ed.). Malmö: Studentlitteratur.
Lambert, D., & Cooper, M. (2000). Issues in Supply Chain Management. Industrial Marketing Management, 29, 65-‐83.
Liker, J., & Meier, D. (2006). The Toyota way fieldbook: A practical guide for implementing toyota´s 4Ps. New York: McGraw-‐Hill.
Logan, M. (2000). Using Agency Theory to Design Successful Outsourcing Relationship. The International Journal of Logistics Management, 11(2), 21-‐32.
Lyson, K., & Farrington, B. (2012). Purchasing and Supply Chain Management (8th ed.). Harlow: Pearson Education Limited.

References
72
Madhusudhana Rao, C., Prahlada Rao, K., & Muniswamy, V. (2011). DELIVERY PERFORMANCE MEASUREMENT IN A INTEGRATED SUPPLY CHAIN MANAGEMENT: CASE STUDY IN BATTERIES MANUFACTURING FIRM. Serbian Journal of Manamgement, VI(2), 205-‐220.
McIntosh, J. (2007). Changing Relationships at th R&D/Production Interface. Emerald Back Files, 74-‐84.
Olhager, J. (2000). Produktionsekonomi (1:11 ed.). Lund: Studentlitteratur.
Olsson, H., & Sörensen, S. (2011). Forskningsprocessen: Kvalitativa och kvantitativa perspektiv (3rd ed.). Stockholm: Liber.
Patel, R., & Davidson, B. (2003). Forskningsmetodikens grunder: Att planera, genomföra och rapportera en undersökning (Vol. 3). Lund: Studentlitteratur.
Pickton, D. W. (1998). What's SWOT in strategic analysis. Strategic Change, 101-‐109.
Piercy, N., & Giles, W. (2007). Making SWOT analysis work. Cardiff business school and Strategic Marketing Development unit, Marlow, 5-‐7.
Rother, M., & Shook, J. (1999). Learning to see Value stream mapping to create value and elimate muda (1.2 ed.). Brookline, Massachsetts: The Lean Enterprise Institute.
Sandvik. (2011). Sandvik Annual Report. Sandviken: Sandvik AB.
Sandvik. (2011). Sandvik Mining. Retrieved February 26, 2013, from http://www.mining.sandvik.com/
Sandvik. (2013). http://www.sandvik.com/sv/om-‐sandvik/om-‐foretaget/historia/. Retrieved January 22, 2013, from http://www.sandvik.com/sv/om-‐sandvik/om-‐foretaget/historia/: http://www.sandvik.com/sv/om-‐sandvik/om-‐foretaget/historia/
Sandvik. (2013). http://www3.sandvik.com/ar/11/sv/finansiellanyckelt/finansiella_nyckelt.html. Retrieved January 22, 2013, from http://www3.sandvik.com/ar/11/sv/finansiellanyckelt/finansiella_nyckelt.html: http://www3.sandvik.com/ar/11/sv/finansiellanyckelt/finansiella_nyckelt.html
Sandvik. (n.d.). http://www3.sandvik.com/ar/11/sv/redovisningkoncern/resultatrakning/resultatrakning.html. Retrieved January 22, 2013, from http://www3.sandvik.com/ar/11/sv/redovisningkoncern/resultatrakning/resultatrakning.html: http://www3.sandvik.com/ar/11/sv/redovisningkoncern/resultatrakning/resultatrakning.html
Segerstedt, A. (2009). Logistik med fokus på Material och Produktionsstyrning. Malmö: Liber.
Shani, A. B., Chandler, D., Coget, J.-‐F., & Lau, J. B. (2009). Behavior in organizations: An Experiental Approach (9th ed.). New Work: McGraw-‐Hill Irwin.
Srinivasan, M. M. (2004). Streamlined: 14 principles for Building & Managing The Lean Supply Chain. Mason, Ohio: Thomson Learning.
Swotmatrix. (2009). SWOT Matrix. Retrieved Februari 17, 2013, from SWOT Matrix: http://www.swotmatrix.com/
Timme, S. G. (2003). The real cost of holding inventory. Supply Chain Management Review, VII(4), 30-‐37.

References
73
Tsai, Y., & Beverton, S. (2007). Top-‐down management: An effective tool in higher education? International Journal of Educational Management, 21(1), 6-‐16.
Vanpoucke, E., Boyer, K. K., & Vereecke, A. (2009). Supply chain information flow strategies: an empirical taxonomy. International Journal of Operations & Production Management, 29(12), 1213-‐1241.
Xstrata. (2012). Xstrata. Retrieved March 5, 2013, from http://www.xstrata.com/about/at-‐a-‐glance/
Yin, R. K. (2007). Fallstudier: design och genomförande. Malmö: Liber.
Zhou, H., & Benton, W. C. (2007). Supply chain practice and information sharing. Journal of Operations Management, 25, 1348–1365.

Appendices
74
9 Appendices 9.1 Appendix A: Questionnaire
1. What is your picture of the process with OLM?
a. What it your role b. Do you have any documents regarding work description? c. What triggers your first action regarding OLM? d. Who do you collaborate with within Sandvik AB regarding OLM (merge any
orders)? 2. Which channels are used for contact regarding OLM (internal contacts)?
a. How often are you in contact with someone regarding OLM? b. Who do you contact and who contacts you? c. How much time is spent on contact regarding OLM? d. What takes most time?
3. Which channels are used for contact with OLM (external contact)? a. How often are you in contact with OLM? b. Who do you contact and who contacts you? c. How much time is spent on contact with OLM? d. What takes most time?
4. What is good respectively less good with OLM? a. What do you think should be kept b. What do you think should and could be improved?

Appendices
75
9.2 Appendix B: Customers
AngloAmerican
AngloAmerican is a mining company that is world leading in mining platinum and diamonds but is also producing other commodities such as nickel, iron, copper and coal. AngloAmerican is present in North and South America, Asia, Europe, Africa and Australia. The headquarters are in London, UK, about 100 000 employees and a revenue of 30.6 billion USD (AngloAmerican, 2013)
Xstrata
Xstrata is a mining company with headquarters in Zug, Switzerland. The company is mining for commodities such as nickel, copper and zinc. The company has approximately 70 000 employees, is present in 20 countries and has a revenue of 33.9 billion USD (Xstrata, 2012)
Boliden
Boliden is a Swedish company with headquarters in Stockholm, the company is mining for commodities such as nickel, copper, gold and silver. Boliden is present in Sweden, Norway, Finland and Ireland. The company has approximately 4 400 employees and a revenue of 40 billion SEK. (Boliden, 2013)
BHP Billiton
BHP Billiton is a mining company with headquarters in Melbourne, Australia, the company is producing commodities such as aluminum, copper, iron, silver and uranium. The company is present at over 100 locations over the world, having 100 000 employees and a revenue of 72.2 billion USD (BHPBilliton, 2013)