supply and demand: theory chapter - dr. asad karim...
TRANSCRIPT

Supply and Demand:
Theory 3CHAPTER

Markets and Prices
A market is any arrangement that enables buyers and sellers to get
information and do business with each other.
A competitive market is a market that has many buyers and many
sellers, all small relative to the market, so no single buyer or seller can
influence the price.
The money price of a good is the amount of money needed to buy it.
The relative price of a good—the ratio of its money price to the
money price of the next best alternative good—is its opportunity cost.
Opportunity cost – the highest valued alternative forgone
e.g. A cup of coffee worth $1 vs. a gum worth 50 cents. Therefore the
relative price of coffee or opportunity cost of coffee is 2 gums.

Demand
If you demand something, then you:
Want it,
Can afford it, and
Have made a definite plan to buy it.
Wants are the unlimited desires or wishes people have for
goods and services. Demand reflects a decision about
which wants to satisfy.
The quantity demanded of a good or service is the
amount that consumers plan to buy during a particular
time period, and at a particular price.

Demand
What Determines Buying Plans?
The amount of any particular good or service that
consumers plan to buy is influenced by
1. The price of the good,
2. The prices of other goods,
3. Expected future prices,
4. Income,
5. Population, and
6. Preferences.

Mnemonic
Rearranging,
P for Prices;
Y for Income [econ jargon – Y stands for Income]
N for Numbers – or population
T for Tastes – or ‘preferences’ and
E for Expectations
Old English spelling – PYNTE for Pint (0.57 liter); PYNTE is the mnemonic to remember things that can change Demand.

Demand
The Law of Demand
The law of demand states:
Other things remaining the same, the higher the price of a
good, the smaller is the quantity demanded.
Or, the amount you want to buy goes down as the price
goes up.
The law of demand results from
a substitution effect
an income effect

Demand
Substitution effect—when the relative price
(opportunity cost) of a good or service rises, people
seek substitutes for it, so the quantity demanded
decreases. If something becomes more expensive, you
want to buy less of it, more of something cheaper.
Income effect—when the price of a good or service
rises relative to income, people cannot afford all the
things they previously bought, so the quantity
demanded decreases. With lower ‘real’ income, you
want to buy less of most things.

Demand
Demand Curve and Demand Schedule
The term demand refers to the entire relationship between
the price of the good and quantity demanded of the good;
in other words, how much people want to buy at all
different possible ‘own-prices’ of the good.
A demand curve shows the relationship between the
quantity demanded of a good and its price when all other
influences on consumers’ planned purchases remain the
same; in other words, how much will be bought at all
different possible ‘own-prices’ of the good, everything
except the ‘own-price’ of the good held constant.

Demand
This Figure shows a
demand curve for
recordable compact discs
(CD-Rs).
A rise in the price, other
things remaining the same,
brings a decrease in the
quantity demanded [how
much will be bought] and a
movement along the
demand curve.

Demand
A demand curve is also
a willingness-and-
ability-to-pay curve.
The smaller the quantity
available, the higher is
the price that someone
is willing to pay for
another unit.
Willingness to pay
measures marginal
benefit.

Demand
A Change in Demand
When any factor that influences buying plans other than
the price of the good changes, there is a change in
demand for that good. The quantity of the good that
people plan to buy changes at each and every price, so
there is a new demand curve.
When demand increases, the quantity that people plan to
buy increases at each and every price so the demand
curve shifts rightward.
When demand decreases, the quantity that people plan to
buy decreases at each and every price so the demand
curve shifts leftward.
Demand
Factors that change demand are as follows:
Prices of related goods
A substitute is a good that can be used in place of
another good.
A complement is a good that is used in conjunction with
another good.
When the price of substitute for CD-Rs rises or when the
price of a complement for CD-Rs falls, the demand for CD-
Rs increases.
Demand
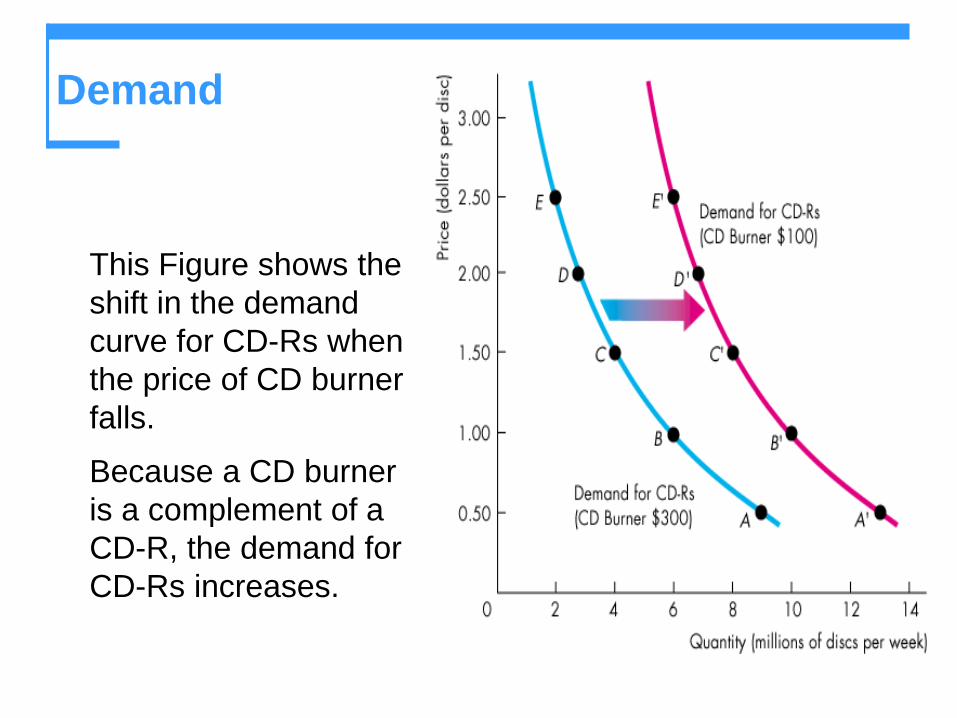
This Figure shows the
shift in the demand
curve for CD-Rs when
the price of CD burner
falls.
Because a CD burner
is a complement of a
CD-R, the demand for
CD-Rs increases.

Demand
Income
When income increases, consumers buy more of most
goods and the demand curve shifts rightward. A normal
good is one for which demand increases as income
increases. An inferior good is a good for which demand
decreases as income increases.
Population
The larger the population, the greater is the demand for all
goods.

Demand
Taste or Preferences
People with the same income have different demands if
they have different preferences.
Expected future prices
If the price of a good is expected to rise in the future,
current demand increases and the demand curve shifts
rightward.

Demand
A Change in the Quantity
Demanded Versus a
Change in Demand
This Figure illustrates the
distinction between a
change in demand and a
change in the quantity
demanded.
Demand
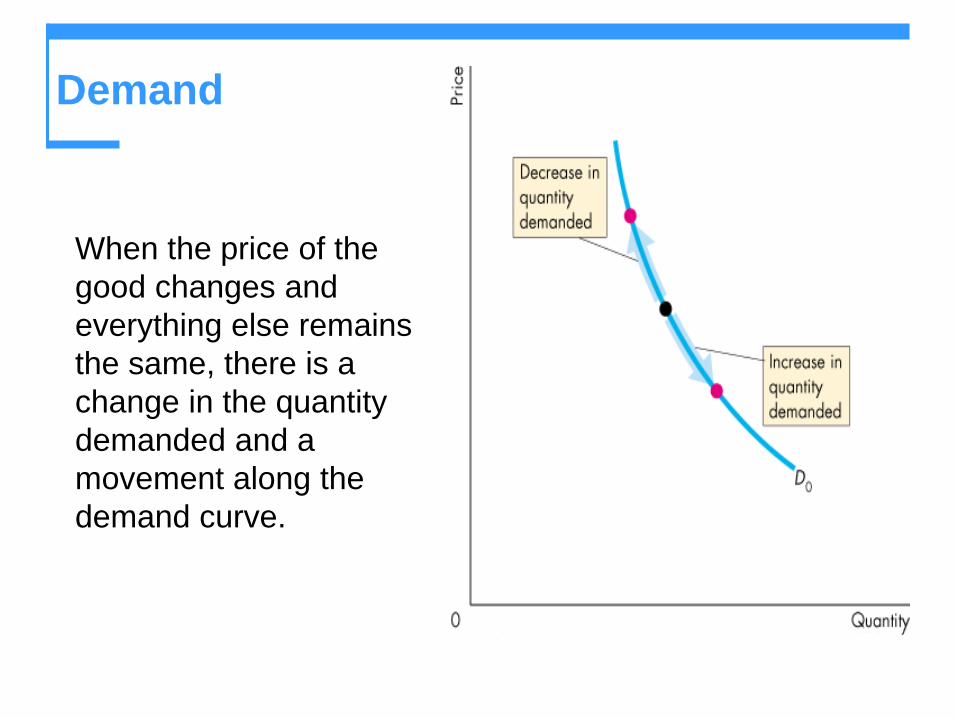
When the price of the
good changes and
everything else remains
the same, there is a
change in the quantity
demanded and a
movement along the
demand curve.

Demand
When one of the other
factors that influence
buying plans changes,
there is a change in
demand and a shift of the
demand curve.
Supply
If a firm supplies a good or service, then the firm:
Has the resources and the technology to produce it,
Can profit from producing it, and
Has made a definite plan to produce and sell it.
Resources and technology determine what is possible to produce. Supply reflects a decision about which technologically feasible items to produce.
The quantity supplied of a good or service is the amount that producers plan to sell during a given time period at a particular price.

Supply
What Determines Selling Plans?
The amount of any particular good or service that a firm
plans to supply is influenced by
1. The price of the good,
2. The prices of resources needed to produce it,
3. The prices of related goods produced,
4. Expected future prices,
5. The number of suppliers, and
6. Available technology.

Mnemonic
Rearranging,
P for Prices, of the good, inputs
[resources], and related goods;
E for Expectations;
S for Supplier numbers; and
T for Technology.
PEST is the mnemonic to remember things that
can change Supply.
Supply
The Law of Supply
The law of supply states:
Other things remaining the same, the higher the price of a good, the greater is the quantity supplied.
Sellers will want to sell more, the higher the price they get.
The law of supply results from the general tendency for the marginal cost of producing a good or service to increase as the quantity produced increases.
Producers are willing to supply only if they at least cover their marginal cost of production.
Supply
Supply Curve and Supply Schedule
The term supply refers to the entire relationship between
the quantity supplied and the price of a good. In other
words, how much sellers will want to sell at all different
possible ‘own-prices’ of the good.
The supply curve shows the relationship between the
quantity supplied of a good and its price when all other
influences on producers’ planned sales remain the same.
In other words, how much sellers will want to sell at all
different possible ‘own-prices’ of the good, everything
except the ‘own-price’ of the good held constant.
Supply
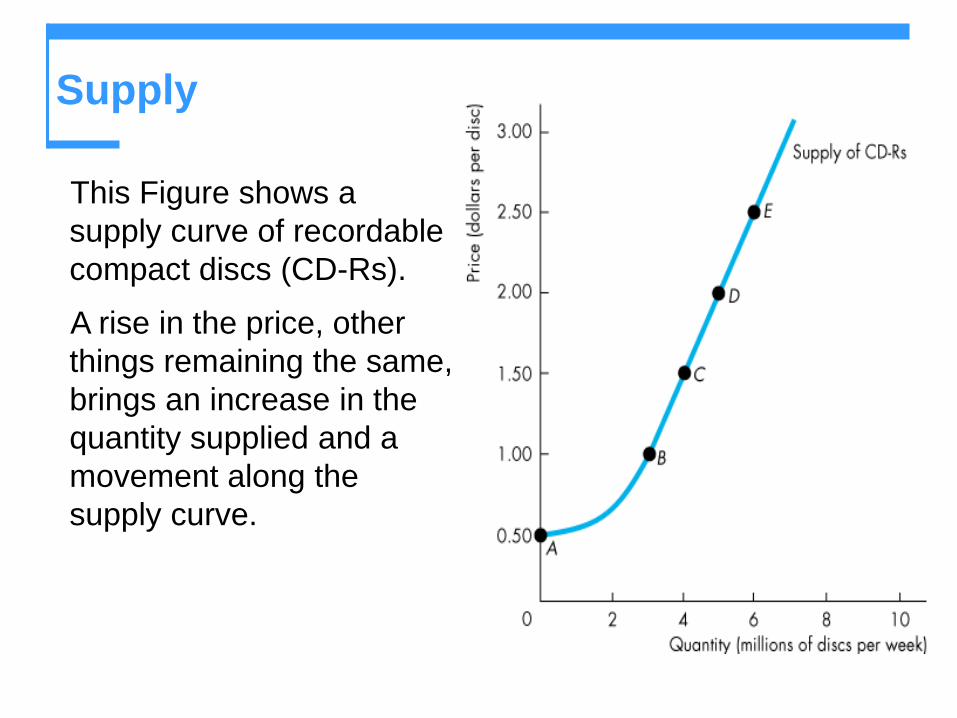
This Figure shows a
supply curve of recordable
compact discs (CD-Rs).
A rise in the price, other
things remaining the same,
brings an increase in the
quantity supplied and a
movement along the
supply curve.

Supply
A supply curve is also a
minimum-supply-price
curve.
The greater the quantity
produced, the higher is the
price that producers must
be offered to be willing to
offer that quantity for sale.

Supply
A Change in Supply
When any factor that influences selling plans other than
the price of the good changes, there is a change in
supply of that good. The quantity of the good that
producers plan to sell changes at each and every price, so
there is a new supply curve.
When supply increases, the quantity that producers plan
to sell increases at each and every price so the supply
curve shifts rightward.
When supply decreases, the quantity that producers plan
to sell decreases at each and every price so the supply
curve shifts leftward.

Supply
The factors that change supply are as follows:
Prices of productive resources [‘inputs’]
If the price of a resource used to produce a good rises, the
minimum price that a supplier is willing to accept for
producing each quantity of that good rises. So a rise in the
price of productive resources decreases supply and shifts
the supply curve leftward.

Supply
Prices of related goods produced
A substitute in production for a good is another good that can be
produced using the same resources. Goods are complements in
production if they must be produced together.
Examples:
Substitute in production: A farmer may be able to grow corn or
soybeans while a garments manufacturer may be able to produce
men’s or women’s clothing using the same resources.
Complement in production: Certain lubricants and other petroleum
products are byproducts of making gasoline from crude oil.
The supply of a good increases and its supply curve shifts rightward if
the price of a substitute in production falls or if the price of a
complement in production rises.
Supply
Expected future prices
If the price of a good is expected to fall in the future,
current supply increases and the supply curve shifts
rightward.
The number of suppliers
The larger the number of suppliers of a good, the
greater is the supply of the good. An increase in the
number of suppliers shifts the supply curve rightward.

Supply
Technology
Advances in technology create new products and lower
the cost of producing existing products, so they
increase supply and shift the supply curve rightward.

Supply
This Figure shows how
an advance in the
technology for producing
recordable CDs
increases the supply of
CD-Rs and shifts the
supply curve for CD-Rs
rightward.

Supply
A Change in the Quantity
Supplied Versus a
Change in Supply
This Figure illustrates the
distinction between a
change in supply and a
change in the quantity
supplied.

Supply
When the price of the
good changes and other
influences on selling
plans remain the same,
there is a change in the
quantity supplied and a
movement along the
supply curve.
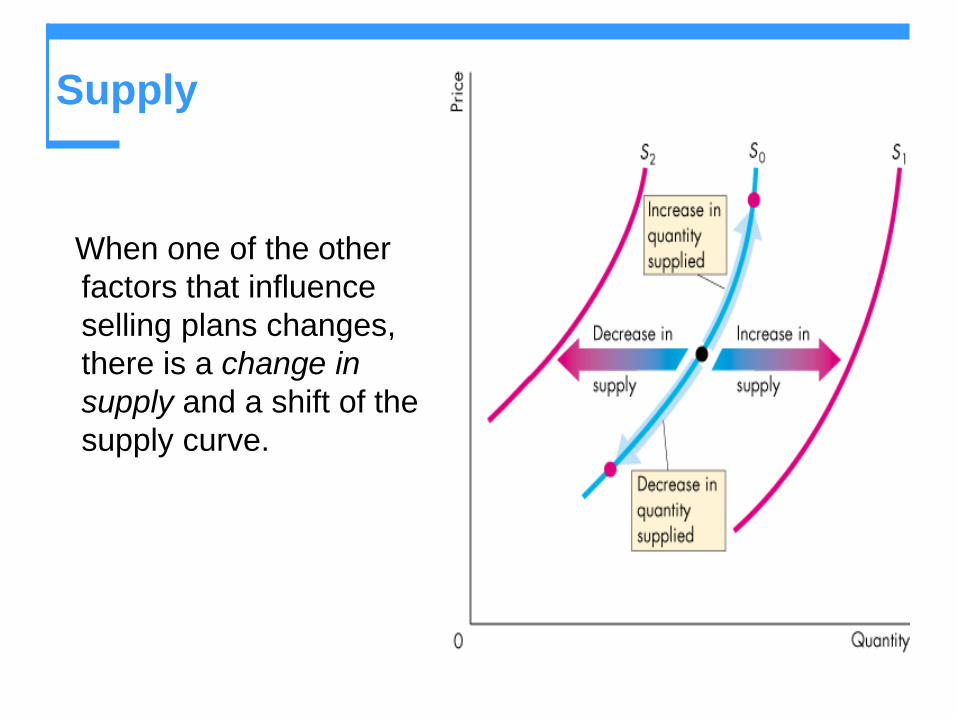
Supply
When one of the other
factors that influence
selling plans changes,
there is a change in
supply and a shift of the
supply curve.

Market Equilibrium
Equilibrium is a situation where there is no tendency to
change or in which opposing forces balance each other.
Equilibrium in a market occurs when the price balances
the plans of buyers and sellers.
The equilibrium price is the price at which the quantity
demanded equals the quantity supplied.
The equilibrium quantity is the quantity bought and sold
at the equilibrium price.
Price regulates buying and selling plans.
Price adjusts when plans don’t match.

Market Equilibrium
Price as a Regulator
This Figure illustrates the
equilibrium price and
equilibrium quantity in the
market for CD-Rs.
If the price of a disc is $2,
the quantity supplied
exceeds the quantity
demanded and there is a
surplus of discs.

Market Equilibrium
If the price of a disc is $1, the quantity demanded exceeds the quantity supplied and there is a shortage of discs.
If the price of a disc is $1.50, the quantity demanded equals the quantity supplied and there is neither a shortage nor a surplus of discs.
Market Equilibrium
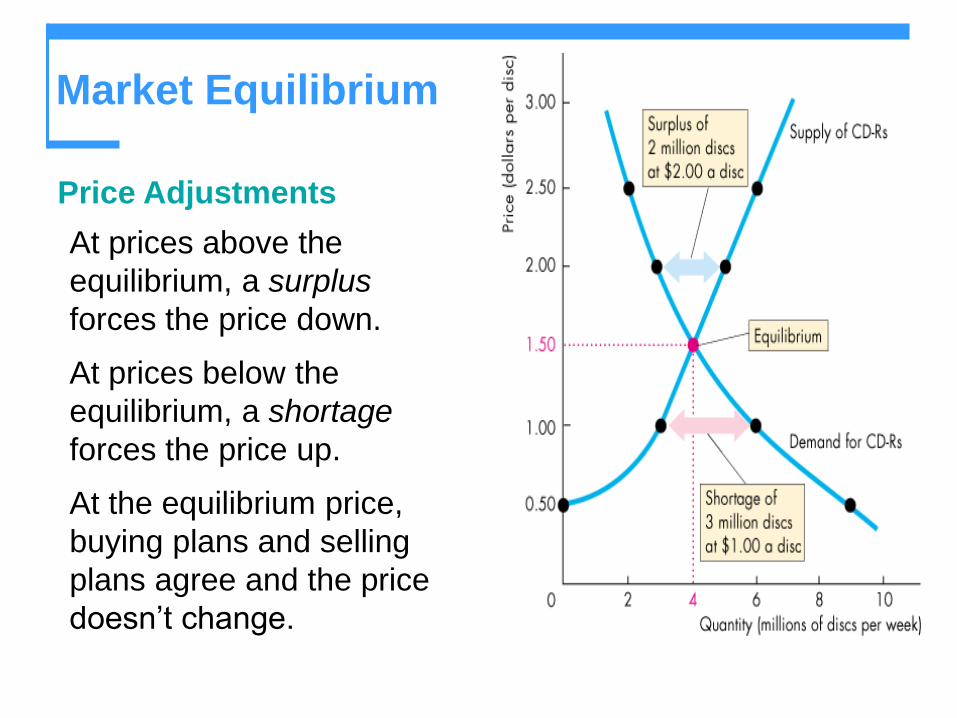
Price Adjustments
At prices above the
equilibrium, a surplus
forces the price down.
At prices below the
equilibrium, a shortage
forces the price up.
At the equilibrium price,
buying plans and selling
plans agree and the price
doesn’t change.
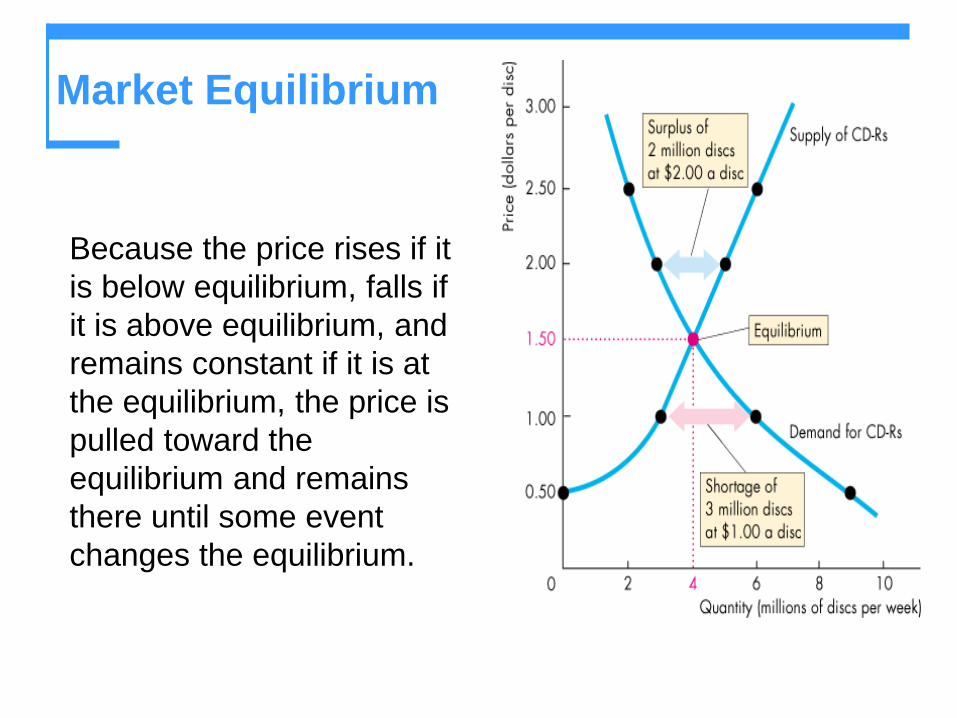
Market Equilibrium
Because the price rises if it
is below equilibrium, falls if
it is above equilibrium, and
remains constant if it is at
the equilibrium, the price is
pulled toward the
equilibrium and remains
there until some event
changes the equilibrium.
Predicting Changes in Price and Quantity
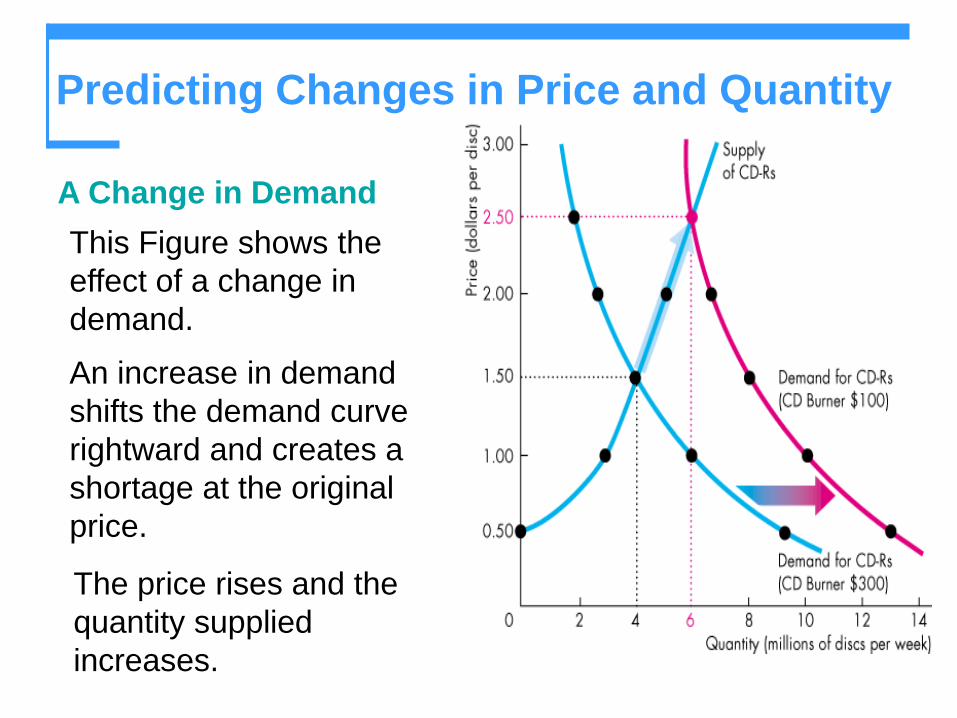
A Change in Demand
This Figure shows the
effect of a change in
demand.
An increase in demand
shifts the demand curve
rightward and creates a
shortage at the original
price.
The price rises and the
quantity supplied
increases.

Predicting Changes in Price and Quantity
A Change in Supply
This Figure shows the effect of a change in supply.
An increase in supply shifts the supply curve rightward and creates a surplus at the original price.
The price falls and the
quantity demanded
increases.

Predicting Changes in Price and Quantity
A Change in Both
Demand and Supply
A change in both demand
and supply changes the
equilibrium price and the
equilibrium quantity, but
we need to know the
relative magnitudes of the
changes to predict some of
the consequences.

Predicting Changes in Price and Quantity
This Figure shows the
effects of a change in both
demand and supply in the
same direction. An
increase in both demand
and supply increases the
equilibrium quantity but
has an uncertain effect on
the equilibrium price.

Predicting Changes in Price and Quantity
This Figure shows the
effects of a change in both
demand and supply when
they change in opposite
directions. An increase in
supply and a decrease in
demand lowers the
equilibrium price but has
an uncertain effect on the
equilibrium quantity.

Caveat
- This is the model of a competitive market,which requires many, small, buyers and sellers. Ifthat condition is not met, for example if there is onlyone or a few sellers, we may not be able to drawboth the curves – there is no supply curve undermonopoly.