supplimentary materials experimental methodsthefauve.hwa.ucsd.edu/~thwa/pub/lac-sm.pdf ·...
TRANSCRIPT
SUPPLIMENTARY MATERIALS
EXPERIMENTAL METHODS
a. Plasmids and Strains. E. coli K-12 MG1655 and derived mutants were used in all
experiments reported in the main text. Chromosomal deletions were performed using the method
of Datsenko & Wanner (1). For each deletion the kanamycin resistance gene kan was amplified
from the template plasmid pKD4 using primer sites P0 and P2 including 45 bp homology
extensions. The PCR products were then transformed into electrocompetent MG1655 cells, and
kan was eliminated using plasmid pCP20 bearing FLP recombinase (1). The resulting strains
TK110, TK120, TK130, TK140, and TK150 are listed in Table S1 together with the start and end
coordinates of the respective deletions. All mutations were verified using PCR. Multiple deletion
strains were constructed by serially transferring and eliminating the TK100 series of kan
insertion mutants into the target strain using P1 transduction in the order indicated in column 3 of
Table S1, with the exception of strain TK200 carrying lacI lacY double mutation. The close
proximity of lacI to lacY necessitated the de novo synthesis of both mutations in the same host
strain.
Measurements of the variation of CRP levels were performed on strain TK500. This strain
was derived from strain TK400, which was derived in turn from E. coli BW25113 (Datsenko &
Wanner, 2000), with cyaA deletion performed as explained above. The crp promoter Pcrp was
amplified from MG1655 genomic DNA from start coordinate 3483424 to end coordinate
3483721 and inserted into the EcoRI and BamHI sites of PRS551 (2). The resulting Pcrp-lacZ
fusion was inserted into the chromosome of TK400 using the method of Simons et al (1987).
Measurements of the effect of the CRP operator on the lac promoter were performed using strain
TK600 which is also derived from strain TK400. The lac promoter was amplified from start
coordinate 365438 to end coordinate 365669 and cloned into the EcoRI and BamHI sites of
pRS551. The CRP operator site at position -61.5 was altered from TGTGAGTTAGCTCACT to
CAGACGTTAGCTCACT using site-directed mutagenesis (Stratagene) and the resulting
construct was inserted into the chromosome of strain TK400 using the method of Simons et al
(2).
b. -galactosidase Assay. Assays of -galactosidase activity were performed according to
Miller (3) and Griffith (4) with changes as follows. Overnight cultures of bacterial strains were
grown in 3ml M9 minimal medium (M9, 1 mM MgSO4, 0.1 mM CaCl2) containing 0.5%
glucose as the sole carbon source and the standard concentrations of any necessary antibiotics in
a 37oC water bath until saturation. This culture was diluted
1 into 24 well plates (Costar)
containing 1ml M9 medium in each well with glucose, antibiotics, and varying concentrations of
3’,5’-cyclic adenosine monophosphate (cAMP) (0-10 mM) and isopropyl -D
thiogalactopyranoside (IPTG) (0-1 mM). The plates were then grown with vigorous shaking at
200 rpm in a humidity-controlled incubator, with OD600 measurements taken every two hours in
a Tecan Genios Pro plate reader. The cell-doubling rate ( 12) for each sample was calculated as
the slope of log2(OD600) vs. time plot via linear regression analysis.
When OD600 of a sample reaches 0.2-0.4, 0.5 ml of the sample was transferred to a 2-ml 96
well polypropylene block containing 0.5 ml Z-buffer (3), 20 µl 0.1% SDS, and 40 µl chloroform.
All samples were thoroughly disrupted by repeated agitation with a multichannel pipettor. 200 µl
of each sample was transferred to a flat-bottom transparent 96 well plate (Costar). 40 µl of Z-
buffer containing 4 mg/ml o-nitrophenyl- -D-galactopyranoside (ONPG) was added to each well
and OD420 measurements were performed in a Tecan Genios Pro plate reader, at 1-minute
intervals for the first 10 minutes, and at increasing intervals (1 hour, 5 hour, etc.) thereafter2 until
sufficient color had developed in all samples for measurement, and the measured OD420 showed
an extended regime of linear dependence on time (data not shown). Samples were maintained at
25oC throughout incubation. All assays were performed in triplicate or more.
c. Promoter activity. In the regime where the OD420 readings were sufficiently large to ensure a
linear dependence on time of measurements but below 1.0 (above which the OD420 readings
saturate), the slope (s) of OD420 versus time (in minutes) was calculated via linear regression. -
galactosidase activity (A) was expressed in Miller Units (MU) according to the
1 In M9 medium, the growth rate of cyaA strains increases from 0.4 doubling/hour at 0 cAMP to a maximum of 0.6
doubling/hour at ~1 mM cAMP; see Fig. S2. As such, the initial inoculation of samples was performed at different
dilutions (~1000x dilution for samples in 1 mM cAMP and ~ 100x dilution for samples at lower cAMP
concentrations) such that all samples would reach OD600 = 0.2-0.4 in approximately 12-15 hours. We verified that
samples assayed with various initial dilutions in the given range gave no measurable systematic variations in
results (data not shown). 2 For the lowest expression encountered in the experiments performed (e.g., the crp null mutants in Fig. 1a), this
took up to 50 hours.

formulaA = (1000 s) / (0.5 OD600 ) . To verify the reliability of the deduced activity for the
weakly expressed promoters, we performed a serial dilution experiment, using MG1655 grown
in M9 medium with 0.5% glucose and 1 mM IPTG, which yielded a -galactosidase activity of ~
1000 MU. We mixed this strain with strain BW25113, deleted of the lac operon, in varying
proportions (up to 106-fold dilution), and measured the apparent -galactosidase activity of the
mixture using the procedure specified above. We found a nearly perfect inverse dependence of
the observed -galactosidase activity with the fold-dilution applied down to ~ 0.03 MU (data not
shown). As the lowest -galactosidase activity encountered in the experiments was ~0.1 MU, our
data lay completely in the responsive regime of the measurements.
In the text, we report the “promoter activity” ( ) as
= A 12 (S1)
where 12 is the cell-doubling rate defined above (in unit of 1/hr). This measure of the promoter
activity is motivated by the fact that the enzyme -galactosidase is very stable (5) so that in the
balanced exponential growth phase, its “turnover” is governed by dilution due to cell growth; see
discussion below. Note that with the definition (S1), we take into account some straightforward
growth-dependent effects on -galactosidase activity as previously reported (6, 7). There are of
course other residual effects, e.g., variation in the cellular levels of RNA polymerase, ribosomes,
etc at the different growth rates. However, these effects are apparently quite limited in magnitude
and will be neglected in our analysis: As seen in Fig. S2b (triangles), the growth-rate adjusted
activity of -galactosidase expressed by the (constitutive) Plac crp promoter in cyaA- cells
changed very little in growth medium with various cAMP concentrations, even though the
growth rate itself changed appreciably over this range of cAMP concentrations (Fig. S2a).
THEORETICAL MODELING
a. Activation of the Regulatory Proteins. The concentrations of the active regulators are
controlled by the total concentrations of the regulators, the intracellular inducer concentrations,
and the biochemistry of inducer-regulator interaction. The interaction of CRP with cAMP is
quite straightforward (8-11) and will be discussed first. The active component is the CRP dimer
associated with one cAMP molecule (10-12). For simplicity, we will assume that all the CRP
monomers associate in the dimer form, as justified by the very small dimer dissociation constant
(0.1 – 1 nM; (13)) The concentration of the activated CRP dimer (denoted by[CRP*] ) is then
given by
CRP* [cAMP CRP] = [CRP][cAMP]in
*
[cAMP]in*+ KcAMP
, (S2)
where [CRP] denotes the total CRP dimer concentration, KcAMP = 10 µM is the relevant
dissociation constant (10), and [cAMP]
in
* is the intracellular concentration of cAMP. Intracellular
cAMP is believed to be rapidly exported by PMF pumps (14, 15). For cyaA strains which cannot
synthesize cAMP endogenously, the high export/import ratio leads to a much smaller
intracellular cAMP concentration compared to the extracellular concentration. It is this
intracellular cAMP concentration which dictates the degree of CRP activation (assuming that
cAMP-CRP equilibration is much faster than cAMP transport.) The details of cAMP transport
are not understood; even the cAMP pump has not been identified despite many years of study.
Here, we appeal to the results of Epstein et al (16) and assume that the intracellular cAMP
concentration is linearly related to the extracellular concentration across the range of
concentrations used, i.e., [cAMP]
in
*=
cAMP[cAMP] , where [cAMP] is the cAMP level of the
medium. Since cAMP
103 according to Ref. (16), we have
[cAMP]in
*= cAMP [cAMP] KcAMP
for most of the range of cAMP used in our experiment (0 – 10 mM). Hence Eq. (S2) is simplified
to
CRP* [CRP] [cAMP] cAMP / KcAMP . (S3)
Obtaining the active concentration of the Lac repressor is more involved. The Lac repressor
is a dimer of dimers (17). Co-crystal structure of LacR and operator DNA indicates that the
dimer binds specifically to the operator sequence as a unit in the absence of IPTG, while the
IPTG-bound dimers do not have the required structure to bind specifically to operator DNA.
Additionally, since the two dimeric units of the LacR tetramer interact very weakly (18), we do
not expect the IPTG binding by one dimeric unit to affect the specific DNA binding of the other
dimeric unit. Finally, we do not expect a dimeric unit to be able to bind specifically to operator
sites if either one of its monomeric subunit is bound to IPTG. This assumption is based on the
work of Winter, Berg and von Hippel (19), who showed that sequence specific binding would
only occur if the energy gained from sequence-specific binding more than compensates the loss
of electrostatic energy the repressor molecule could gain in a conformation that does not allow
specific DNA binding. When one of the monomers bind to IPTG, that monomer could not
contribute to specific DNA binding, and the other monomer would not be able to contribute
enough to compensate given what we know about the energetics of LacR-DNA binding (19).
The last feature described above, that both monomers of a dimeric unit need to be free of IPTG
binding in order for the dimeric unit to bind specifically to operator DNA, is a crucial source of
cooperativity in our model. While there is no direct biochemical proof of this feature, we
mention that a MWC model incorporating this feature of LacR-DNA binding (Kuhlman and
Hwa, unpublished) is able to reproduce the effective Hill coefficient of 1.4 ~ 1.6 which describes
the IPTG dependence of specific operator binding, as observed in the experiments of O’Gorman
et al (20). It then follows that there are two species of “active repressors” in our model: (i) Only
one of the two dimeric units is not bound at all by IPTG (denoted by LacR*), and (ii) neither of
the dimeric units is bound by IPTG (denoted by LacR**).
To find the concentrations of these two active species (denoted by [LacR*] and [LacR**]
respectively) in terms of the total LacR tetramer concentration [LacR] and the IPTG
concentration[IPTG] , we need to keep track of all possible molecular species of LacR-IPTG
complex. As illustrated in Fig. S9, there is one species with no IPTG (denoted by LacR-0), 4
sub-species with one IPTG bound (LacR-1), 2 sub-species with two IPTG bound to a single
dimer (LacR-2a), 4 sub-species with two IPTG bound to two different dimers (LacR-2b), 4
subspecies with 3 IPTG bound (LacR-3) and one subspecies with 4 IPTG bound (LacR-4). Since
the IPTG-LacR binding is non-cooperative (20), the equilibrium between any two subspecies
linked by a line in Fig. S9 is described by the same dissociation constantKIPTG . Taking into
account of the indistinguishability of the subspecies, we arrive at the following equilibrium
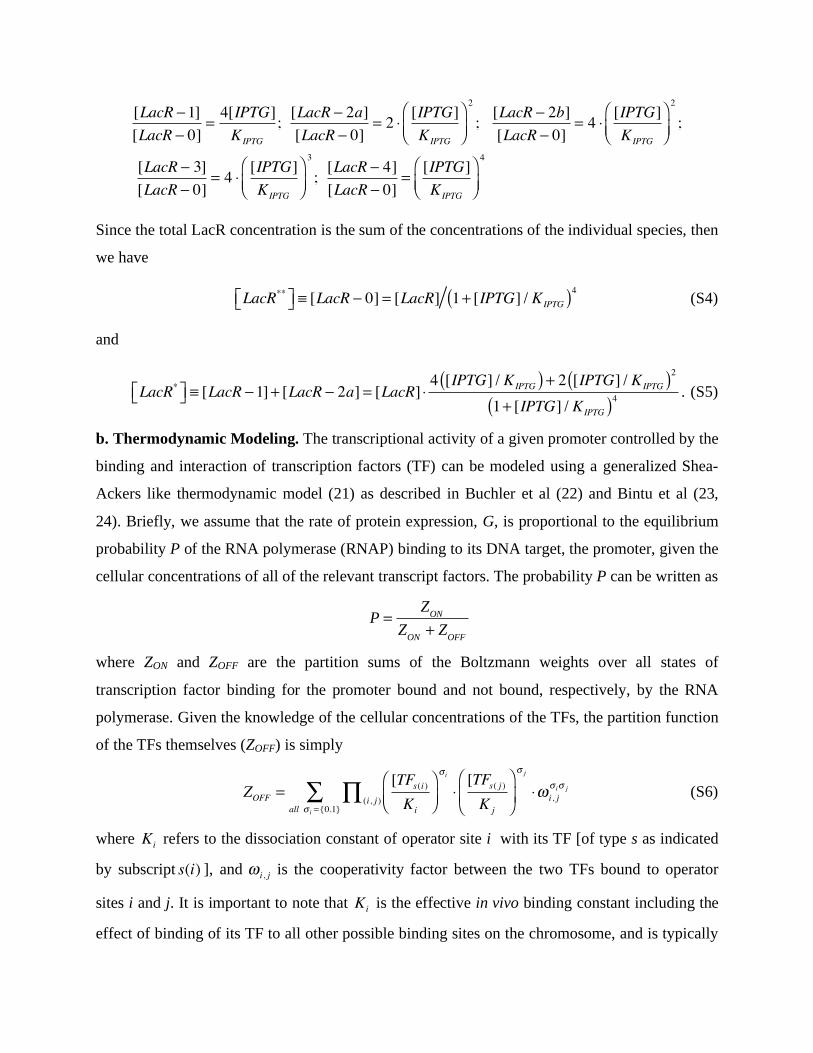
relations among the species of LacR-IPTG complex:
[LacR 1]
[LacR 0]=4[IPTG]
KIPTG
;[LacR 2a]
[LacR 0]= 2
[IPTG]
KIPTG
2
;[LacR 2b]
[LacR 0]= 4
[IPTG]
KIPTG
2
;
[LacR 3]
[LacR 0]= 4
[IPTG]
KIPTG
3
;[LacR 4]
[LacR 0]=[IPTG]
KIPTG
4
Since the total LacR concentration is the sum of the concentrations of the individual species, then
we have
LacR** [LacR 0] = [LacR] 1+ [IPTG] / KIPTG( )4
(S4)
and
LacR* [LacR 1]+ [LacR 2a] = [LacR]4 [IPTG] / KIPTG( ) + 2 [IPTG] / KIPTG( )
2
1+ [IPTG] / KIPTG( )4 . (S5)
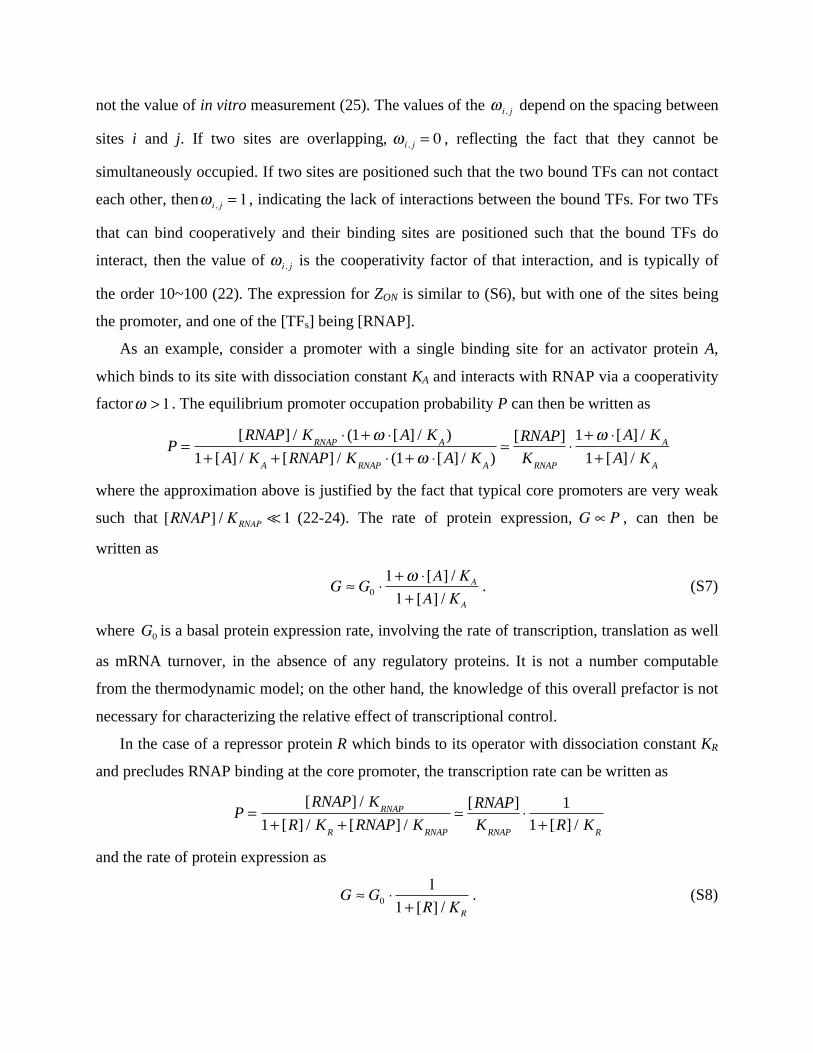
b. Thermodynamic Modeling. The transcriptional activity of a given promoter controlled by the
binding and interaction of transcription factors (TF) can be modeled using a generalized Shea-
Ackers like thermodynamic model (21) as described in Buchler et al (22) and Bintu et al (23,
24). Briefly, we assume that the rate of protein expression, G, is proportional to the equilibrium
probability P of the RNA polymerase (RNAP) binding to its DNA target, the promoter, given the
cellular concentrations of all of the relevant transcript factors. The probability P can be written as
P =Z
ON
ZON
+ ZOFF
where ZON and ZOFF are the partition sums of the Boltzmann weights over all states of
transcription factor binding for the promoter bound and not bound, respectively, by the RNA
polymerase. Given the knowledge of the cellular concentrations of the TFs, the partition function
of the TFs themselves (ZOFF) is simply
ZOFF =[TFs(i )Ki
i [TFs( j )K j
j
i, ji j
(i, j )all i ={0.1}
(S6)
where Ki refers to the dissociation constant of operator site i with its TF [of type s as indicated
by subscript s(i) ], and i, j is the cooperativity factor between the two TFs bound to operator
sites i and j. It is important to note that Ki is the effective in vivo binding constant including the
effect of binding of its TF to all other possible binding sites on the chromosome, and is typically
not the value of in vitro measurement (25). The values of the i, j depend on the spacing between
sites i and j. If two sites are overlapping, i, j = 0 , reflecting the fact that they cannot be
simultaneously occupied. If two sites are positioned such that the two bound TFs can not contact
each other, then i, j = 1 , indicating the lack of interactions between the bound TFs. For two TFs
that can bind cooperatively and their binding sites are positioned such that the bound TFs do
interact, then the value of i, j is the cooperativity factor of that interaction, and is typically of
the order 10~100 (22). The expression for ZON is similar to (S6), but with one of the sites being
the promoter, and one of the [TFs] being [RNAP].
As an example, consider a promoter with a single binding site for an activator protein A,
which binds to its site with dissociation constant KA and interacts with RNAP via a cooperativity
factor > 1 . The equilibrium promoter occupation probability P can then be written as
P =[RNAP] / K
RNAP(1+ [A] / K
A)
1+ [A] / KA+ [RNAP] / K
RNAP(1+ [A] / K
A)
[RNAP]
KRNAP
1+ [A] / KA
1+ [A] / KA
where the approximation above is justified by the fact that typical core promoters are very weak
such that [RNAP] / KRNAP 1 (22-24). The rate of protein expression, G P , can then be
written as
G G0
1+ [A] / KA
1+ [A] / KA
. (S7)
where G0 is a basal protein expression rate, involving the rate of transcription, translation as well
as mRNA turnover, in the absence of any regulatory proteins. It is not a number computable
from the thermodynamic model; on the other hand, the knowledge of this overall prefactor is not
necessary for characterizing the relative effect of transcriptional control.
In the case of a repressor protein R which binds to its operator with dissociation constant KR
and precludes RNAP binding at the core promoter, the transcription rate can be written as
P =[RNAP] / K
RNAP
1+ [R] / KR+ [RNAP] / K
RNAP
[RNAP]
KRNAP
1
1+ [R] / KR
and the rate of protein expression as
G G0
1
1+ [R] / KR
. (S8)
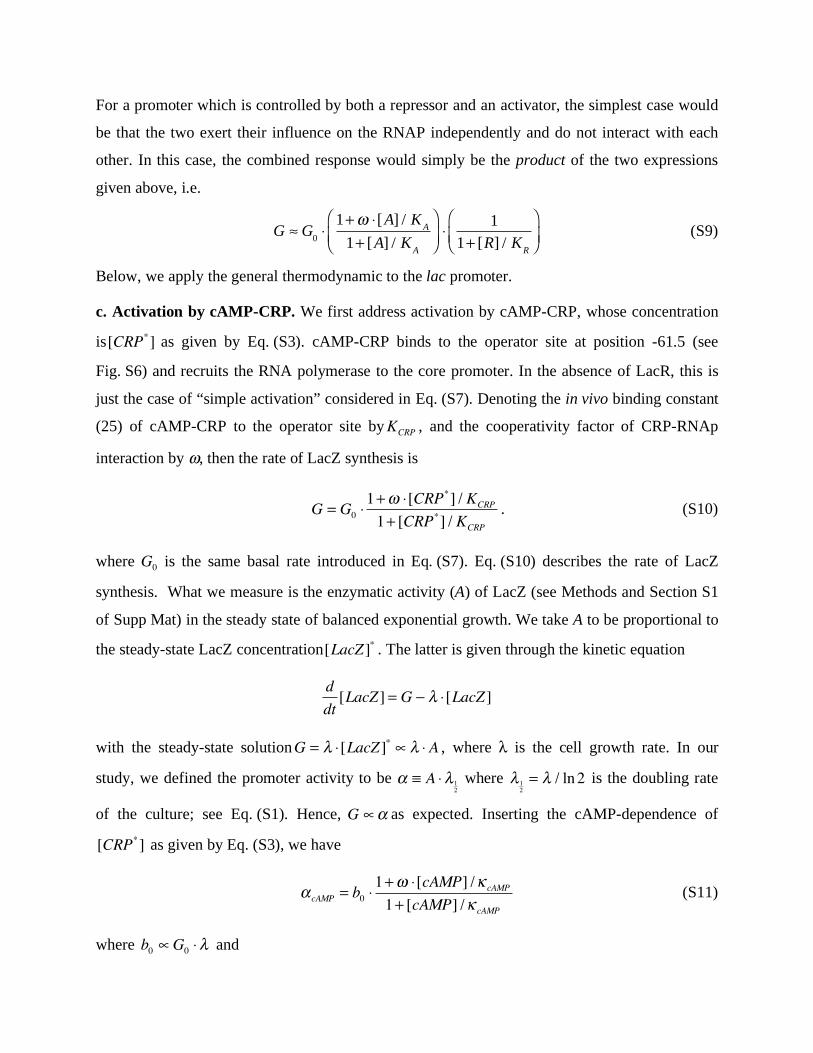
For a promoter which is controlled by both a repressor and an activator, the simplest case would
be that the two exert their influence on the RNAP independently and do not interact with each
other. In this case, the combined response would simply be the product of the two expressions
given above, i.e.
G G0
1+ [A] / KA
1+ [A] / KA
1
1+ [R] / KR
(S9)
Below, we apply the general thermodynamic to the lac promoter.
c. Activation by cAMP-CRP. We first address activation by cAMP-CRP, whose concentration
is[CRP*] as given by Eq. (S3). cAMP-CRP binds to the operator site at position -61.5 (see
Fig. S6) and recruits the RNA polymerase to the core promoter. In the absence of LacR, this is
just the case of “simple activation” considered in Eq. (S7). Denoting the in vivo binding constant
(25) of cAMP-CRP to the operator site byKCRP , and the cooperativity factor of CRP-RNAp
interaction by , then the rate of LacZ synthesis is
G = G0
1+ [CRP*] / KCRP
1+ [CRP*] / KCRP
. (S10)
where G0 is the same basal rate introduced in Eq. (S7). Eq. (S10) describes the rate of LacZ
synthesis. What we measure is the enzymatic activity (A) of LacZ (see Methods and Section S1
of Supp Mat) in the steady state of balanced exponential growth. We take A to be proportional to
the steady-state LacZ concentration[LacZ ]* . The latter is given through the kinetic equation
d
dt[LacZ ] = G [LacZ ]
with the steady-state solutionG = [LacZ ]* A , where is the cell growth rate. In our
study, we defined the promoter activity to be A 12 where 1
2= / ln2 is the doubling rate
of the culture; see Eq. (S1). Hence, G as expected. Inserting the cAMP-dependence of
[CRP*] as given by Eq. (S3), we have
cAMP = b01+ [cAMP] / cAMP
1+ [cAMP] / cAMP
(S11)
where b0 G0 and
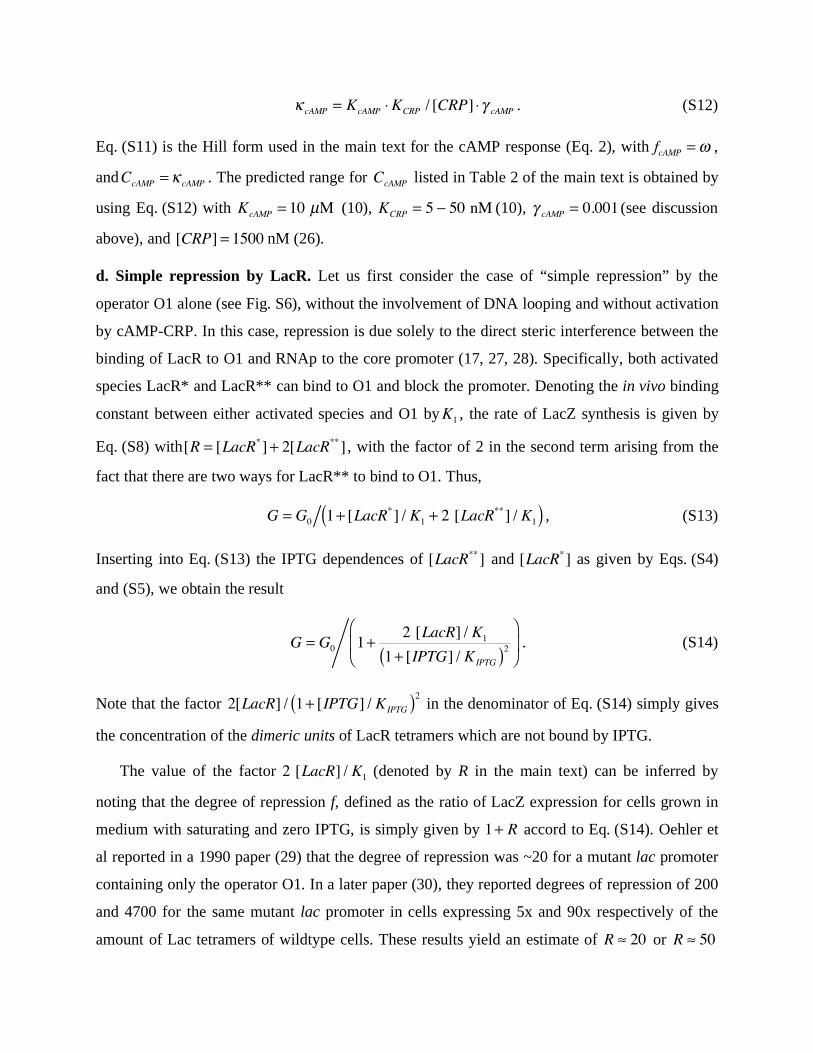
cAMP = KcAMP KCRP / [CRP] cAMP . (S12)
Eq. (S11) is the Hill form used in the main text for the cAMP response (Eq. 2), with fcAMP = ,
andCcAMP = cAMP . The predicted range for CcAMP listed in Table 2 of the main text is obtained by
using Eq. (S12) with KcAMP = 10 µM (10), KCRP = 5 50 nM (10), cAMP = 0.001 (see discussion
above), and [CRP] = 1500 nM (26).
d. Simple repression by LacR. Let us first consider the case of “simple repression” by the
operator O1 alone (see Fig. S6), without the involvement of DNA looping and without activation
by cAMP-CRP. In this case, repression is due solely to the direct steric interference between the
binding of LacR to O1 and RNAp to the core promoter (17, 27, 28). Specifically, both activated
species LacR* and LacR** can bind to O1 and block the promoter. Denoting the in vivo binding
constant between either activated species and O1 byK1 , the rate of LacZ synthesis is given by
Eq. (S8) with[R = [LacR*]+ 2[LacR**] , with the factor of 2 in the second term arising from the
fact that there are two ways for LacR** to bind to O1. Thus,
G = G0 1+ [LacR*] / K1 + 2 [LacR**] / K1( ) , (S13)
Inserting into Eq. (S13) the IPTG dependences of [LacR**] and [LacR*] as given by Eqs. (S4)
and (S5), we obtain the result
G = G0 1+2 [LacR] / K1
1+ [IPTG] / KIPTG( )2 . (S14)
Note that the factor 2[LacR] / 1+ [IPTG] / KIPTG( )2 in the denominator of Eq. (S14) simply gives
the concentration of the dimeric units of LacR tetramers which are not bound by IPTG.
The value of the factor 2 [LacR] / K1 (denoted by R in the main text) can be inferred by
noting that the degree of repression f, defined as the ratio of LacZ expression for cells grown in
medium with saturating and zero IPTG, is simply given by 1+ R accord to Eq. (S14). Oehler et
al reported in a 1990 paper (29) that the degree of repression was ~20 for a mutant lac promoter
containing only the operator O1. In a later paper (30), they reported degrees of repression of 200
and 4700 for the same mutant lac promoter in cells expressing 5x and 90x respectively of the
amount of Lac tetramers of wildtype cells. These results yield an estimate of R 20 or R 50

for wildtype cells. In the following analysis we use R 50 , although results of similar quality are
obtained forR 20 .
e. LacR-mediated DNA looping. To include repression due to DNA looping, we take into
account of the additional possibility that a completely uninduced LacR tetramer (i.e., LacR**)
may bind to two operator sites, the main operator O1 and one of the two auxiliary operator sites
O2 or O3; see Fig. S6. This is incorporated into the thermodynamic model by adding two
looping terms3 to the denominator of the expression in Eq. (S13), i.e.,
G = G0 1+[LacR*]K1
+2 [LacR**]
K1+[LacR**][L12 ]
K1K2
+[LacR**][L13]
K1K3
(S15)
with K2 and K3 being the dissociation constant of the LacR tetramer with O2 and O3
respectively, and [L12 ] and [L13] describing the effective “local concentration” of the repressor
at O2 and O3 respectively given that the tetramer is bound at O1; see (22-24). The effective
concentrations [L12 ] and [L13] involve the free energy cost of DNA looping and have not been
directly characterized4 by biochemical or biophysical methods for the lac promoter in the
absence of CRP binding. Inserting again the IPTG-dependence of[LacR**] , we obtain
G = G0 1+2 [LacR] / K1
1+ [IPTG] / KIPTG( )2 +
[LacR] / K1( ) [L12 ] / K2 + [L13] / K3( )
1+ [IPTG] / KIPTG( )4 . (S16)
As the Plac activity is proportional to G (see above), we have
IPTG = b0 1+R
1+ [IPTG] / KIPTG( )2 +
R L01+ [IPTG] / KIPTG( )
4 (S17)
3 In the full thermodynamic treatment, each of the two looping term, [LacR**][L1i]/K1Ki, where i = 2 or 3, is further
divided by the factor (1+[LacR*]/Ki + 2 [LacR**]/Ki). This factor takes into account of the fact that looping of O1
with the auxiliary operator Oi is not possible if Oi is occupied itself (referred to as the “squelching” effect. We
neglected this effect here as the LacR concentration is sufficiently low in wildtype cells. [Note: the squelching
term for O1-O3 looping is completely negligible as 2[LacR] K3. O1-O2 looping is actually negligible only for
[IPTG] > KIPTG. This is indeed the regime where most of the data were taken, i.e., most of the data in Fig. 2a
(squares) are larger than KIPTG ~ 10 µM. However, the fact that the data point for [IPTG]=0 also falls on the same
curve (bottom red) suggests that [L12]/2K2 [L13]/2K3.] 4 Their values can be indirectly inferred from the experiments of Oehler et al (30) and Muller et al (37) as was done
by Vilar & Leibler (40). However the estimates from the two experiments differ by a factor of 5 or more.
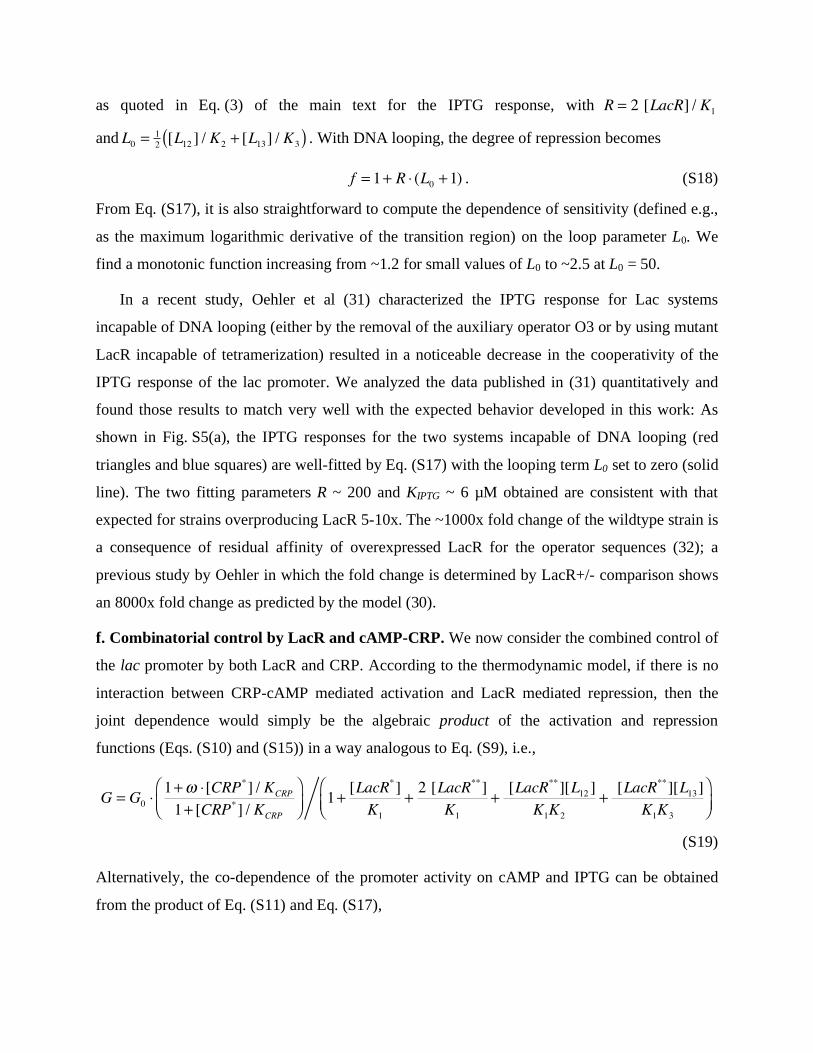
as quoted in Eq. (3) of the main text for the IPTG response, with R = 2 [LacR] / K1
and L0 =12 [L12 ] / K2 + [L13] / K3( ) . With DNA looping, the degree of repression becomes
f = 1+ R (L0 +1) . (S18)
From Eq. (S17), it is also straightforward to compute the dependence of sensitivity (defined e.g.,
as the maximum logarithmic derivative of the transition region) on the loop parameter L0. We
find a monotonic function increasing from ~1.2 for small values of L0 to ~2.5 at L0 = 50.
In a recent study, Oehler et al (31) characterized the IPTG response for Lac systems
incapable of DNA looping (either by the removal of the auxiliary operator O3 or by using mutant
LacR incapable of tetramerization) resulted in a noticeable decrease in the cooperativity of the
IPTG response of the lac promoter. We analyzed the data published in (31) quantitatively and
found those results to match very well with the expected behavior developed in this work: As
shown in Fig. S5(a), the IPTG responses for the two systems incapable of DNA looping (red
triangles and blue squares) are well-fitted by Eq. (S17) with the looping term L0 set to zero (solid
line). The two fitting parameters R ~ 200 and KIPTG ~ 6 µM obtained are consistent with that
expected for strains overproducing LacR 5-10x. The ~1000x fold change of the wildtype strain is
a consequence of residual affinity of overexpressed LacR for the operator sequences (32); a
previous study by Oehler in which the fold change is determined by LacR+/- comparison shows
an 8000x fold change as predicted by the model (30).
f. Combinatorial control by LacR and cAMP-CRP. We now consider the combined control of
the lac promoter by both LacR and CRP. According to the thermodynamic model, if there is no
interaction between CRP-cAMP mediated activation and LacR mediated repression, then the
joint dependence would simply be the algebraic product of the activation and repression
functions (Eqs. (S10) and (S15)) in a way analogous to Eq. (S9), i.e.,
G = G0
1+ [CRP*] / KCRP
1+ [CRP*] / KCRP
1+[LacR*]K1
+2 [LacR**]
K1+[LacR**][L12 ]
K1K2
+[LacR**][L13]
K1K3
(S19)
Alternatively, the co-dependence of the promoter activity on cAMP and IPTG can be obtained
from the product of Eq. (S11) and Eq. (S17),
= b01+ [cAMP] / cAMP
1+ [cAMP] / cAMP
1+R
1+ [IPTG] / KIPTG( )2 +
R L01+ [IPTG] / KIPTG( )
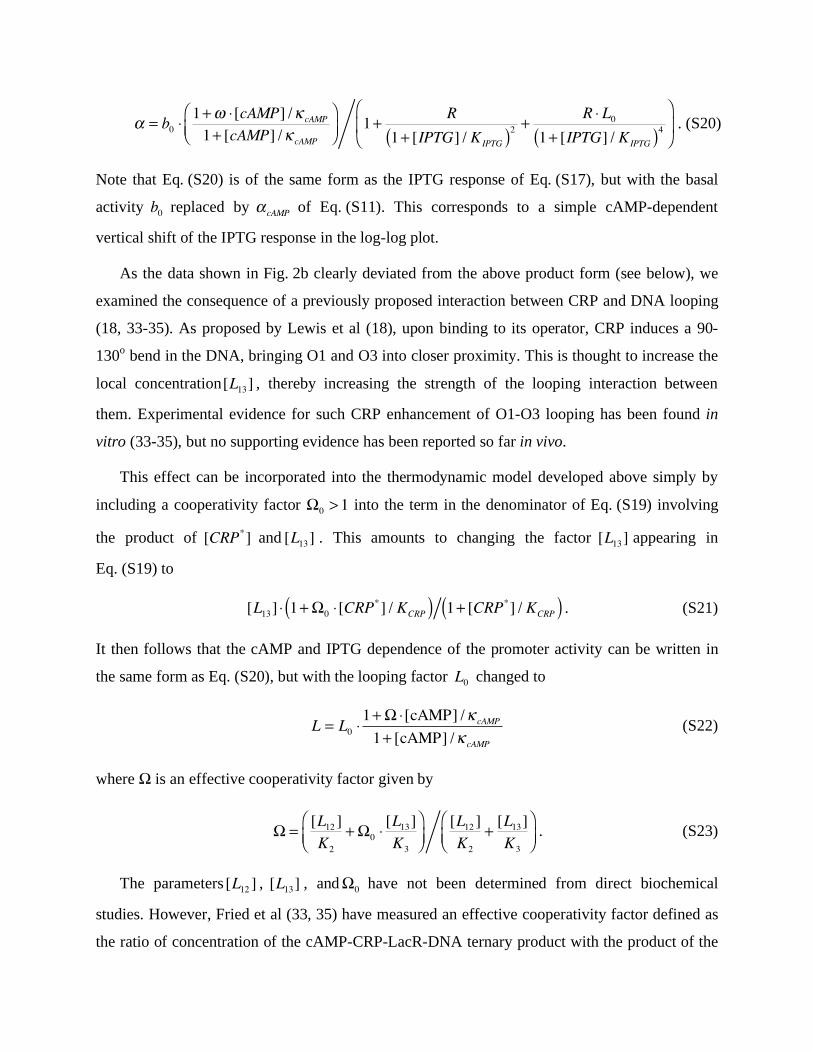
4 . (S20)
Note that Eq. (S20) is of the same form as the IPTG response of Eq. (S17), but with the basal
activity b0 replaced by cAMP of Eq. (S11). This corresponds to a simple cAMP-dependent
vertical shift of the IPTG response in the log-log plot.
As the data shown in Fig. 2b clearly deviated from the above product form (see below), we
examined the consequence of a previously proposed interaction between CRP and DNA looping
(18, 33-35). As proposed by Lewis et al (18), upon binding to its operator, CRP induces a 90-
130o bend in the DNA, bringing O1 and O3 into closer proximity. This is thought to increase the
local concentration[L13] , thereby increasing the strength of the looping interaction between
them. Experimental evidence for such CRP enhancement of O1-O3 looping has been found in
vitro (33-35), but no supporting evidence has been reported so far in vivo.
This effect can be incorporated into the thermodynamic model developed above simply by
including a cooperativity factor 0 > 1 into the term in the denominator of Eq. (S19) involving
the product of [CRP*] and [L13] . This amounts to changing the factor [L13] appearing in
Eq. (S19) to
[L13] 1+ 0 [CRP*] / KCRP( ) 1+ [CRP*] / KCRP( ) . (S21)
It then follows that the cAMP and IPTG dependence of the promoter activity can be written in
the same form as Eq. (S20), but with the looping factor L0 changed to
L = L01+ [cAMP] / cAMP
1+ [cAMP] / cAMP
(S22)
where is an effective cooperativity factor given by
=[L12 ]K2
+ 0
[L13]K3
[L12 ]K2
+[L13]K3
. (S23)
The parameters [L12 ] , [L13] , and 0 have not been determined from direct biochemical
studies. However, Fried et al (33, 35) have measured an effective cooperativity factor defined as
the ratio of concentration of the cAMP-CRP-LacR-DNA ternary product with the product of the

concentrations of cAMP-CRP-DNA and LacR-DNA binary products. In terms of the parameters
defined above, this effective cooperativity factor can be written as
1+ [CRP* ]
KCRP( ) 1+ R + R L( ) + 0 1( ) [CRP* ]KCRP
R [L13 ]2K3
1+ [CRP* ]KCRP( ) 1+ R + R L( )
. (S24)
For saturating amounts of cAMP-CRP and LacR such that [CRP*] KCRP and R 1 , the
expression in Eq. (S24) is identical to the right hand side of Eq. (S23). Hence, the effective
cooperativity factor introduced in Eq. (S22) is just the cooperativity factor of the range 4 – 12
determined experimentally by Fried et al (33, 35).
Finally, we consider the case where [CRP*] depends nonlinearly on the cAMP concentration
of the medium such that the observed cAMP response is described by the general Hill form
cAMP = b01+ [cAMP] /CcAMP( )
m
1+ [cAMP] /CcAMP( )m (S25)
with Hill coefficientm > 1. This is for example the situation for TK250 cells bearing the cpdA
gene (see blue symbols in Fig. 1b of the main text). Working backward from Eq. (S10), we have
[CRP*] = KCRP [cAMP] /CcAMP( )m
(S26)
Using Eq. (S26) instead of Eq. (S3) in the combinatorial control function (Eq. (S19) with [L13]
replaced by the expression in (S21), we obtain the following for the co-dependence of the
promoter activity:
= b0
1+ [cAMP] / CcAMP
( )m
1+ [cAMP] / CcAMP
( )m
1+R
1+ [IPTG] / KIPTG
( )2+
R L
1+ [IPTG] / KIPTG
( )4
(S27)
with the loop parameter L in Eq. (S27) being
L = L01+ [cAMP] /CcAMP( )
m
1+ [cAMP] /CcAMP( )m , (S28)
and the cooperativity factor in Eq. (S28) still given by Eq. (S23).

g. Comparison to alternative models. While our model described by Eqs. (S20) and (S22)
appears to accurately describe the data (See Fig. 2b), one might question whether conceptually
simpler models (e.g., generalized Hill functions) might explain the data equally well. Below, we
construct several such models and fit to the data surface from strain TK310 using non-linear least
squares minimization in Matlab. The points at [IPTG] = 0 are weighted to increase their
significance (to simulate the wide range (in log scale) of low IPTG concentrations (< 5 µM) over
which the baseline expression from the promoter does not significantly increase). For each model
the specified parameters are allowed to vary freely to obtain the optimum fit.
(a) A naïve 6-parameter model based on generic Hill functions and assuming no interaction
between LacR and CRP:
= b0
1+ [cAMP] / CcAMP
( )m
cAMP
1+ [cAMP] / CcAMP
( )m
cAMP
1+R
1+ [IPTG] / CIPTG
( )m
IPTG
(S29)
As can be seen from Fig. S8(a), neither the fold change nor the sensitivity to IPTG response is
properly captured by this model for the range of cAMP concentrations studied.
(b) A 7-parameter model in which the coefficient of the IPTG dependent term, i.e., R in (S29)
above, is a four-parameter cAMP-dependent Hill function,
R = R0
1+ '([cAMP] / C 'cAMP
)m
cAMP
1+ ([cAMP] / C 'cAMP
)m
cAMP
(S30)
where we assume C '
cAMP= C
cAMP, and m '
cAMP= m
cAMP, but allow R0 and ' to vary freely. From
Fig. S8(b), we see that the fold change of the IPTG response is better reproduced than model (a),
but the overall correspondence between data and model prediction is still poor, particularly for
intermediate IPTG concentrations (10-500 µM) for both the high and low cAMP levels.
(c) The same model as (b), but with. C '
cAMP, and m '
cAMPboth varying freely. From Fig. S8(c) it is
seen that the fit to the data is further improved. However the number of parameters is increased
to nine while the fit to data points at intermediate IPTG concentrations is still problematic,
especially at low cAMP levels.
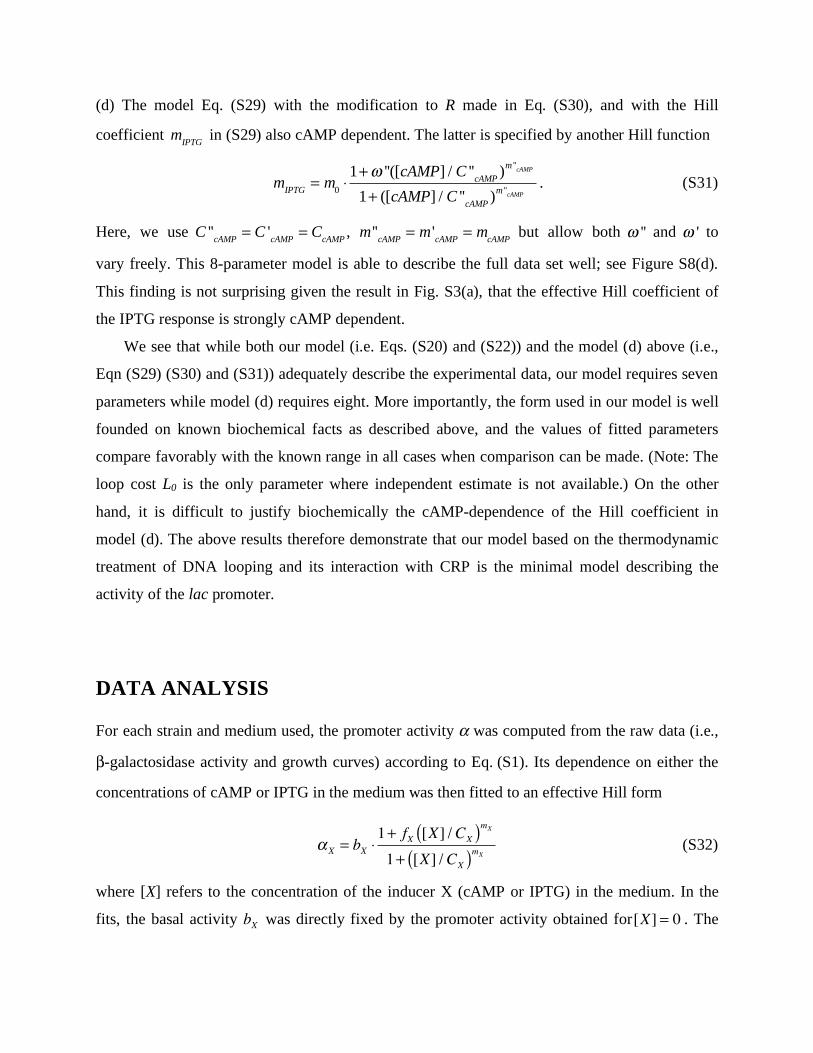
(d) The model Eq. (S29) with the modification to R made in Eq. (S30), and with the Hill
coefficient m
IPTG in (S29) also cAMP dependent. The latter is specified by another Hill function
mIPTG
= m0
1+ ''([cAMP] / C ''cAMP
)m ''
cAMP
1+ ([cAMP] / C ''cAMP
)m ''
cAMP
. (S31)
Here, we use C ''
cAMP= C '
cAMP= C
cAMP, m ''
cAMP= m '
cAMP= m
cAMP but allow both '' and ' to
vary freely. This 8-parameter model is able to describe the full data set well; see Figure S8(d).
This finding is not surprising given the result in Fig. S3(a), that the effective Hill coefficient of
the IPTG response is strongly cAMP dependent.
We see that while both our model (i.e. Eqs. (S20) and (S22)) and the model (d) above (i.e.,
Eqn (S29) (S30) and (S31)) adequately describe the experimental data, our model requires seven
parameters while model (d) requires eight. More importantly, the form used in our model is well
founded on known biochemical facts as described above, and the values of fitted parameters
compare favorably with the known range in all cases when comparison can be made. (Note: The
loop cost L0 is the only parameter where independent estimate is not available.) On the other
hand, it is difficult to justify biochemically the cAMP-dependence of the Hill coefficient in
model (d). The above results therefore demonstrate that our model based on the thermodynamic
treatment of DNA looping and its interaction with CRP is the minimal model describing the
activity of the lac promoter.
DATA ANALYSIS
For each strain and medium used, the promoter activity was computed from the raw data (i.e.,
-galactosidase activity and growth curves) according to Eq. (S1). Its dependence on either the
concentrations of cAMP or IPTG in the medium was then fitted to an effective Hill form
X = bX1+ fX [X] /CX( )
mX
1+ [X] /CX( )mX
(S32)
where [X] refers to the concentration of the inducer X (cAMP or IPTG) in the medium. In the
fits, the basal activity bX was directly fixed by the promoter activity obtained for[X] = 0 . The
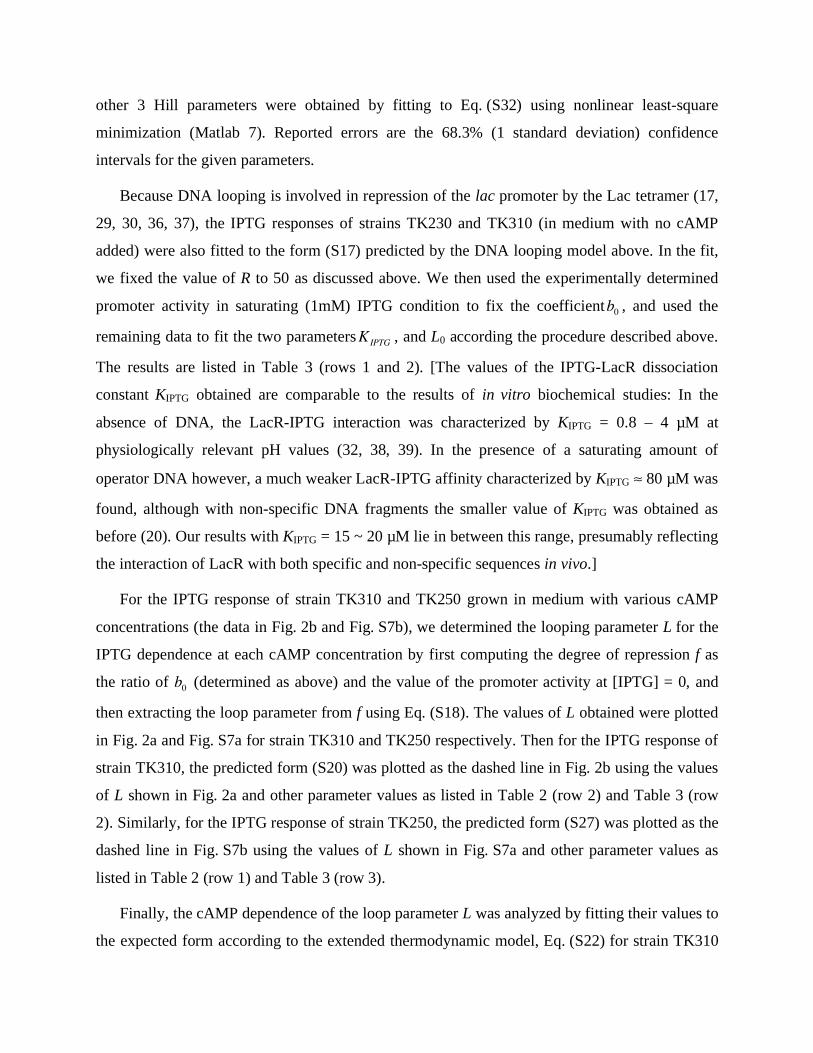
other 3 Hill parameters were obtained by fitting to Eq. (S32) using nonlinear least-square
minimization (Matlab 7). Reported errors are the 68.3% (1 standard deviation) confidence
intervals for the given parameters.
Because DNA looping is involved in repression of the lac promoter by the Lac tetramer (17,
29, 30, 36, 37), the IPTG responses of strains TK230 and TK310 (in medium with no cAMP
added) were also fitted to the form (S17) predicted by the DNA looping model above. In the fit,
we fixed the value of R to 50 as discussed above. We then used the experimentally determined
promoter activity in saturating (1mM) IPTG condition to fix the coefficientb0 , and used the
remaining data to fit the two parametersKIPTG , and L0 according the procedure described above.
The results are listed in Table 3 (rows 1 and 2). [The values of the IPTG-LacR dissociation
constant KIPTG obtained are comparable to the results of in vitro biochemical studies: In the
absence of DNA, the LacR-IPTG interaction was characterized by KIPTG = 0.8 – 4 µM at
physiologically relevant pH values (32, 38, 39). In the presence of a saturating amount of
operator DNA however, a much weaker LacR-IPTG affinity characterized by KIPTG 80 µM was
found, although with non-specific DNA fragments the smaller value of KIPTG was obtained as
before (20). Our results with KIPTG = 15 ~ 20 µM lie in between this range, presumably reflecting
the interaction of LacR with both specific and non-specific sequences in vivo.]
For the IPTG response of strain TK310 and TK250 grown in medium with various cAMP
concentrations (the data in Fig. 2b and Fig. S7b), we determined the looping parameter L for the
IPTG dependence at each cAMP concentration by first computing the degree of repression f as
the ratio of b0 (determined as above) and the value of the promoter activity at [IPTG] = 0, and
then extracting the loop parameter from f using Eq. (S18). The values of L obtained were plotted
in Fig. 2a and Fig. S7a for strain TK310 and TK250 respectively. Then for the IPTG response of
strain TK310, the predicted form (S20) was plotted as the dashed line in Fig. 2b using the values
of L shown in Fig. 2a and other parameter values as listed in Table 2 (row 2) and Table 3 (row
2). Similarly, for the IPTG response of strain TK250, the predicted form (S27) was plotted as the
dashed line in Fig. S7b using the values of L shown in Fig. S7a and other parameter values as
listed in Table 2 (row 1) and Table 3 (row 3).
Finally, the cAMP dependence of the loop parameter L was analyzed by fitting their values to
the expected form according to the extended thermodynamic model, Eq. (S22) for strain TK310
and Eq. (S28) for strain TK250. In these fits, we varied only the effective cooperativity factor ,
taking the values of the other parameters from Table 2 (row 2) and Table 3 (row 2) for strain
TK310, and Table 2 (row 1) and Table 3 (row 3) for strain TK250. Estimate of error on was
again obtained using the procedure described above.
REFERENCES
1. Datsenko, K. A. & Wanner, B. L. (2000) Proc Natl Acad Sci U S A 97, 6640-5.
2. Simons, R. W., Houman, F. & Kleckner, N. (1987) Gene 53, 85-96.
3. Miller, J. H. (1972) Experiments in Molecular Genetics (Cold Spring Harbor Laboratory
Press, Cold Spring Harbor, NY).
4. Griffith, K. L. & Wolf, R. E., Jr. (2002) Biochem Biophys Res Commun 290, 397-402.
5. Mandelstam, J. (1957) Nature 179, 1179-81.
6. Wanner, B. L., Kodaira, R. & Neidhardt, F. C. (1978) J Bacteriol 136, 947-54.
7. Wanner, B. L., Kodaira, R. & Neidhart, F. C. (1977) J Bacteriol 130, 212-22.
8. Malan, T. P., Kolb, A., Buc, H. & McClure, W. R. (1984) J Mol Biol 180, 881-909.
9. Takahashi, M., Blazy, B. & Baudras, A. (1980) Biochemistry 19, 5124-30.
10. Takahashi, M., Blazy, B., Baudras, A. & Hillen, W. (1989) J Mol Biol 207, 783-96.
11. Fried, M. G. & Crothers, D. M. (1984) J Mol Biol 172, 241-62.
12. Garner, M. M. & Revzin, A. (1982) Biochemistry 21, 6032-6.
13. Brown, A. M. & Crothers, D. M. (1989) Proc Natl Acad Sci U S A 86, 7387-91.
14. Saier, M. H., Jr., Feucht, B. U. & McCaman, M. T. (1975) J Biol Chem 250, 7593-601.
15. Goldenbaum, P. E. & Hall, G. A. (1979) J Bacteriol 140, 459-67.
16. Epstein, W., Rothman-Denes, L. B. & Hesse, J. (1975) Proc Natl Acad Sci U S A 72,
2300-4.
17. Muller-Hill, B. (1996) The lac Operon (de Gruyter, Berlin).
18. Lewis, M., Chang, G., Horton, N. C., Kercher, M. A., Pace, H. C., Schumacher, M. A.,
Brennan, R. G. & Lu, P. (1996) Science 271, 1247-54.
19. Winter, R. B., Berg, O. G. & von Hippel, P. H. (1981) Biochemistry 20, 6961-77.
20. O'Gorman, R. B., Rosenberg, J. M., Kallai, O. B., Dickerson, R. E., Itakura, K., Riggs, A.
D. & Matthews, K. S. (1980) J Biol Chem 255, 10107-14.
21. Ackers, G. K., Johnson, A. D. & Shea, M. A. (1982) Proc Natl Acad Sci U S A 79, 1129-
33.
22. Buchler, N. E., Gerland, U. & Hwa, T. (2003) Proc Natl Acad Sci U S A 100, 5136-41.
23. Bintu, L., Buchler, N. E., Garcia, H. G., Gerland, U., Hwa, T., Kondev, J., Kuhlman, T.
& Phillips, R. (2005) Curr Opin Genet Dev 15, 125-35.
24. Bintu, L., Buchler, N. E., Garcia, H. G., Gerland, U., Hwa, T., Kondev, J. & Phillips, R.
(2005) Curr Opin Genet Dev 15, 116-24.
25. Gerland, U., Moroz, J. D. & Hwa, T. (2002) Proc Natl Acad Sci U S A 99, 12015-20.
26. Cossart, P. & Gicquel-Sanzey, B. (1985) J Bacteriol 161, 454-7.
27. Schmitz, A. & Galas, D. J. (1979) Nucleic Acids Res 6, 111-37.
28. Gilbert, W., Gralla, J. D., Majors, J. & Maxam, A. (1975) in Protein-Ligand Interactions,
eds. Sund, H. & Blauer, R. (de Gruyter, Berlin-New York), pp. 193-206.
29. Oehler, S., Eismann, E. R., Kramer, H. & Muller-Hill, B. (1990) EMBO 9, 973-979.

30. Oehler, S., Amouyal, M., Kokhof, P., von Wilcken-Bergmann, B. & Muller-Hill, B.
(1994) EMBO 13, 973-979.
31. Oehler, S., Alberti, S. & Muller-Hill, B. (2006) Nucleic Acids Res 34, 606-12.
32. Gilbert, W. & Muller-Hill, B. (1970) in The Lactose Operon, eds. Beckwith, J. & Zipser,
D. (Cold Spring Harbor Press, Cold Spring Harbor NJ), pp. 93-109.
33. Fried, M. G. & Hudson, J. M. (1996) Science 274, 1930-1; author reply 1931-2.
34. Hudson, J. M. & Fried, M. G. (1990) J Mol Biol 214, 381-96.
35. Vossen, K. M., Stickle, D. F. & Fried, M. G. (1996) J Mol Biol 255, 44-54.
36. Eismann, E. R. & Muller-Hill, B. (1990) J Mol Biol 213, 763-75.
37. Muller, J., Oehler, S. & Muller-Hill, B. (1996) J Mol Biol 257, 21-9.
38. Nichols, J. C. & Matthews, K. S. (1997) J Biol Chem 272, 18550-7.
39. Jobe, A. & Bourgeois, S. (1972) J Mol Biol 69, 397-408.
40. Vilar, J. M. & Leibler, S. (2003) J Mol Biol 331, 981-9