supplementary online content - jamanetwork.com · comparisons and tests of inference . etable 3....
TRANSCRIPT
Supplementary Online Content
Seymour CW, Liu V, Iwashyna TJ, et al. Assessment of clinical criteria for sepsis: for the Third International Consensus Definitions for Sepsis and Septic Shock (Sepsis-3). JAMA. doi:10.1001/jama.2016.0288
eAppendix. Discussion of Supplementary Methods
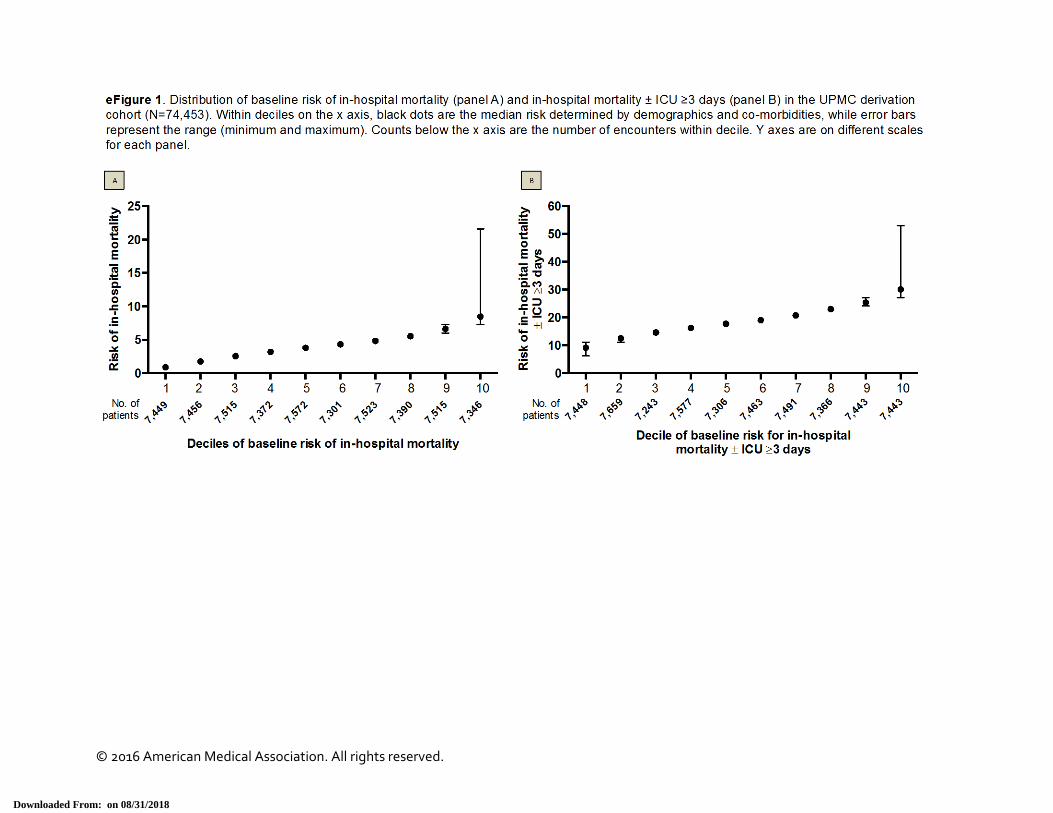
eFigure 1. Distribution of Baseline Risk of In-Hospital Mortality (± ICU Stay of ≥3 Days) Across Deciles
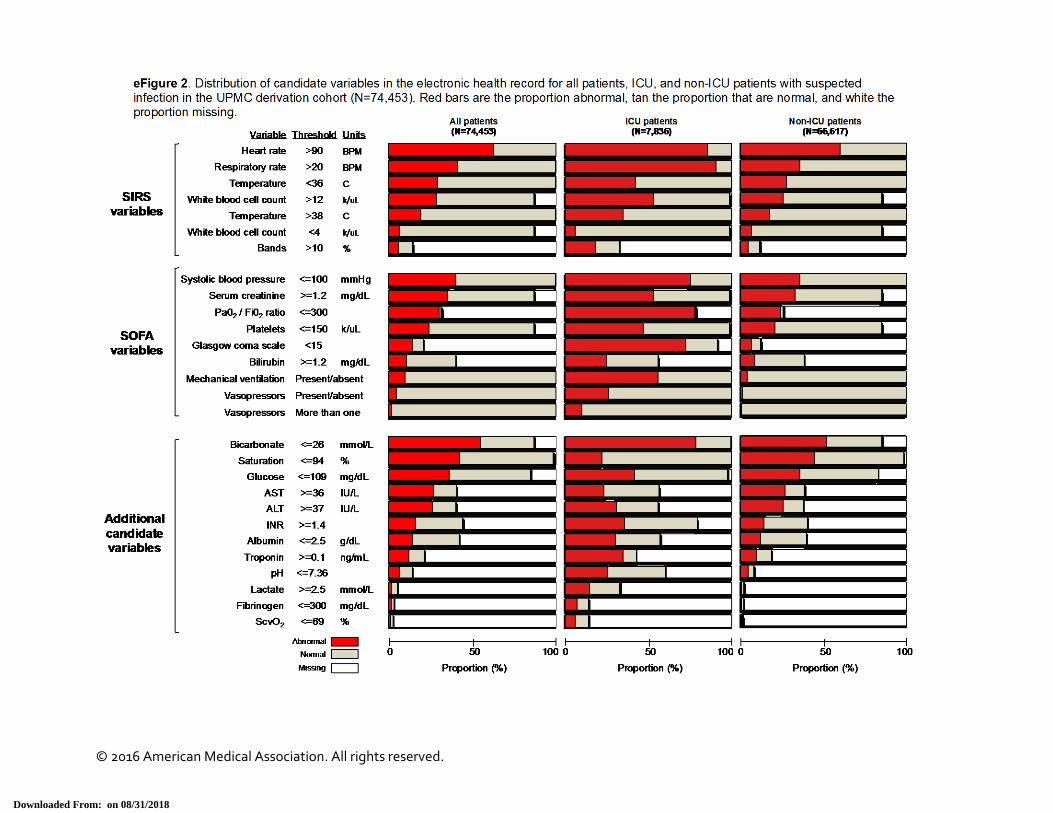
eFigure 2. Distribution of Candidate Variables in the Electronic Health Record for All Patients, ICU, and Non-ICU Patients With Suspected Infection in the UPMC Derivation Cohort (N=74,453)
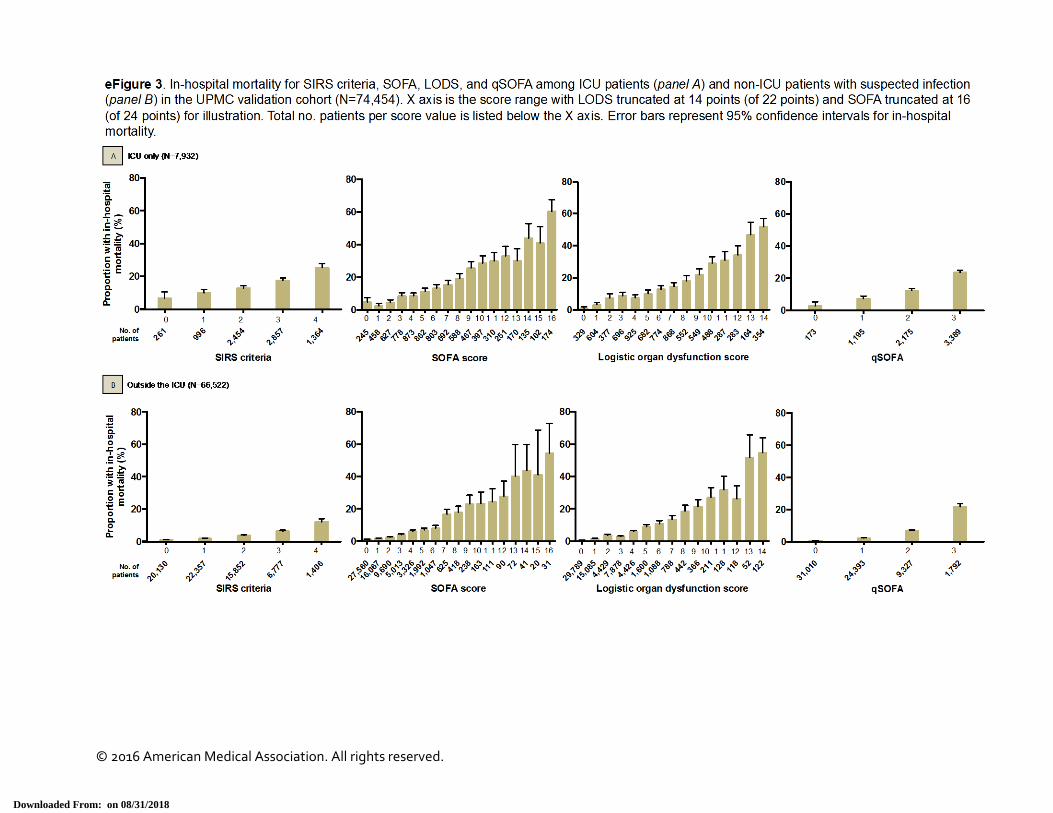
eFigure 3. Proportion of Patients With In-Hospital Mortality Across the Range of SIRS, SOFA, LODS, and qSOFA in the UPMC Validation Cohort (N=74,454)
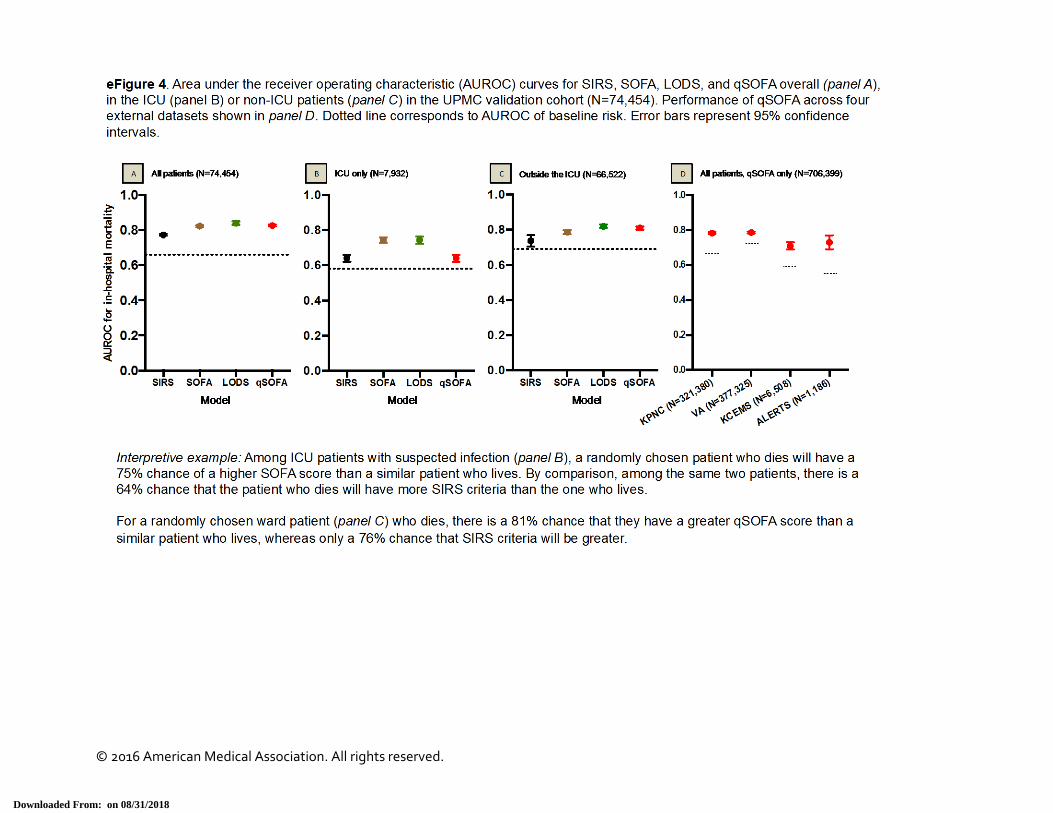
eFigure 4. AUROC for In-Hospital Mortality for SIRS, SOFA, LODS, and qSOFA in the UPMC Validation Cohort (N=74,454) and External Datasets
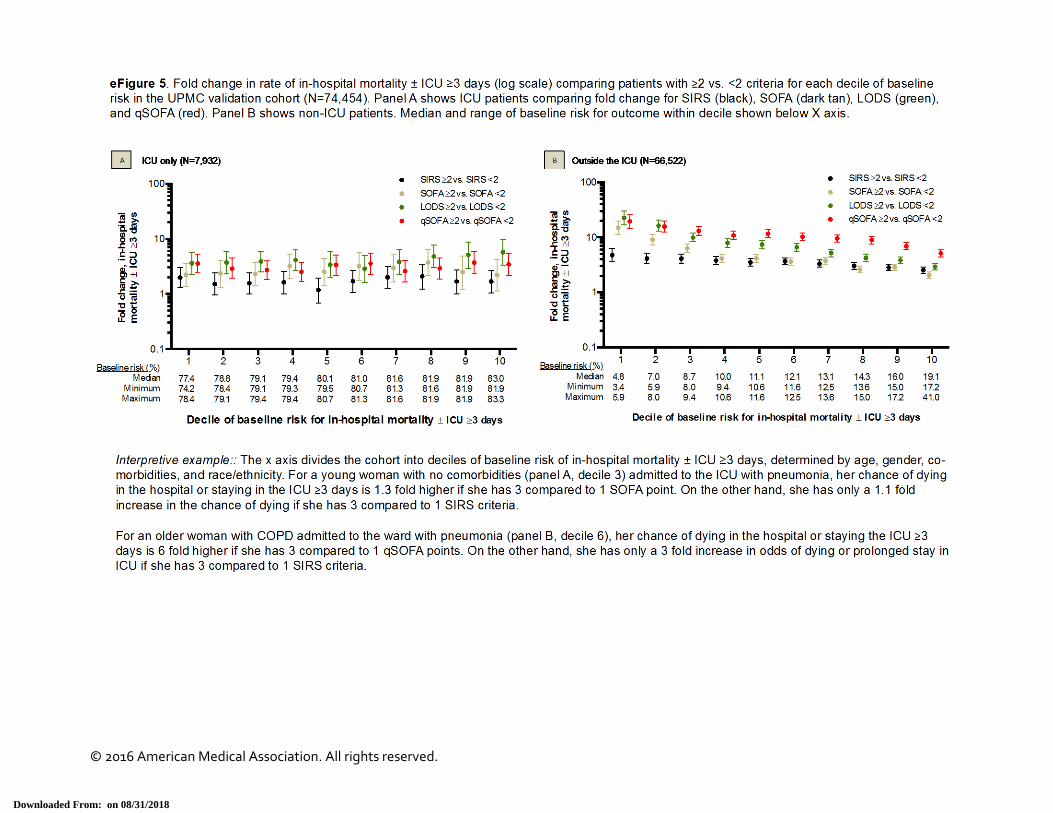
eFigure 5. Fold Change in In-Hospital Mortality (± ICU Stay of ≥3 Days) Comparing Encounters by Different Criteria in the UPMC Validation Cohort (N=74,454)
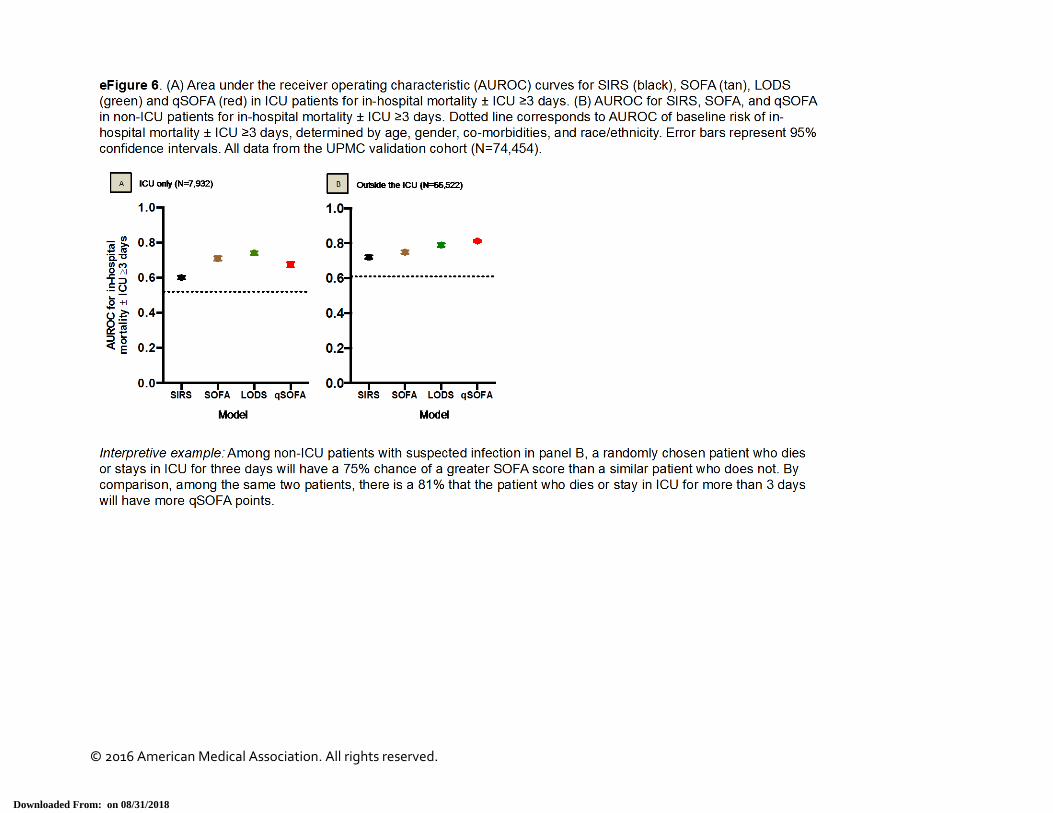
eFigure 6. AUROC for In-Hospital Mortality (± ICU Stay of ≥3 Days) for SIRS, SOFA, LODS, and qSOFA in the UPMC Validation Cohort (N=74,454)
eFigure 7. Distribution of qSOFA in External Datasets and Crude Rates of In-Hospital Mortality by qSOFA
eFigure 8. Calibration of qSOFA Score for In-Hospital Mortality (± ICU Stay of ≥3 Days)
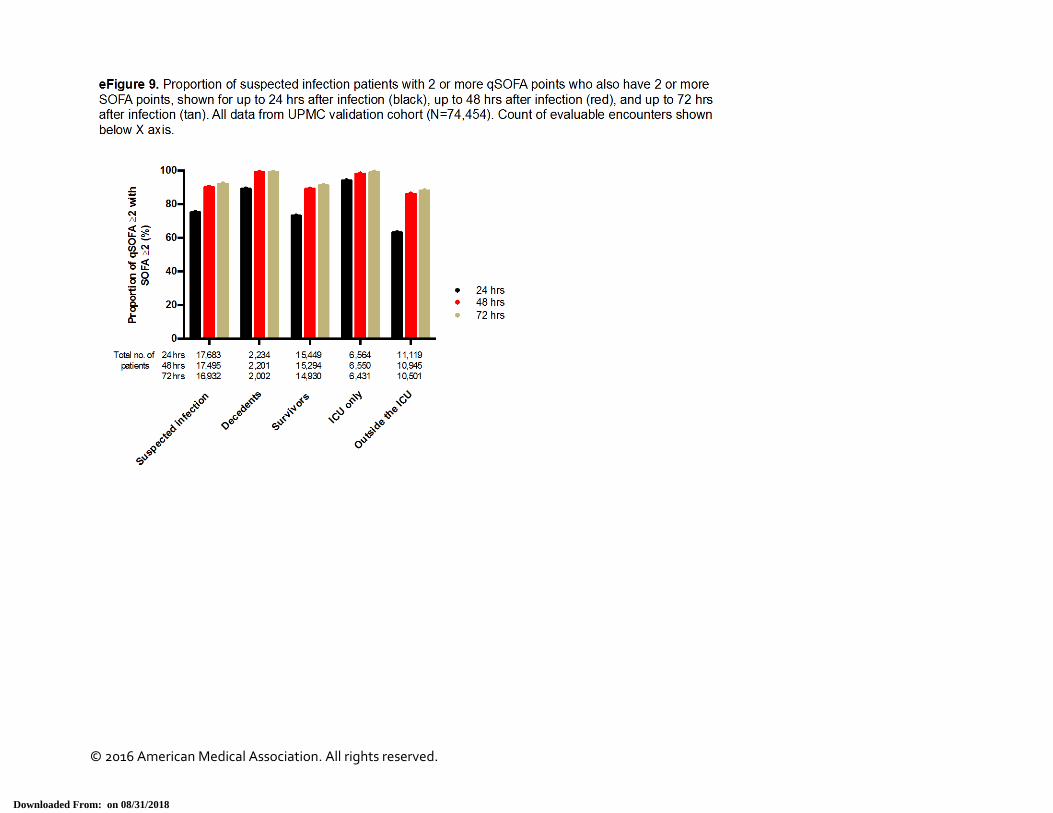
eFigure 9. Proportion of Encounters With 2 or More qSOFA Points Who Also Have 2 or More SOFA Points Over Different Time Intervals After Onset of Suspected Infection in the UPMC Validation Cohort (N=74,454), Ranging From 24 to 72 Hours
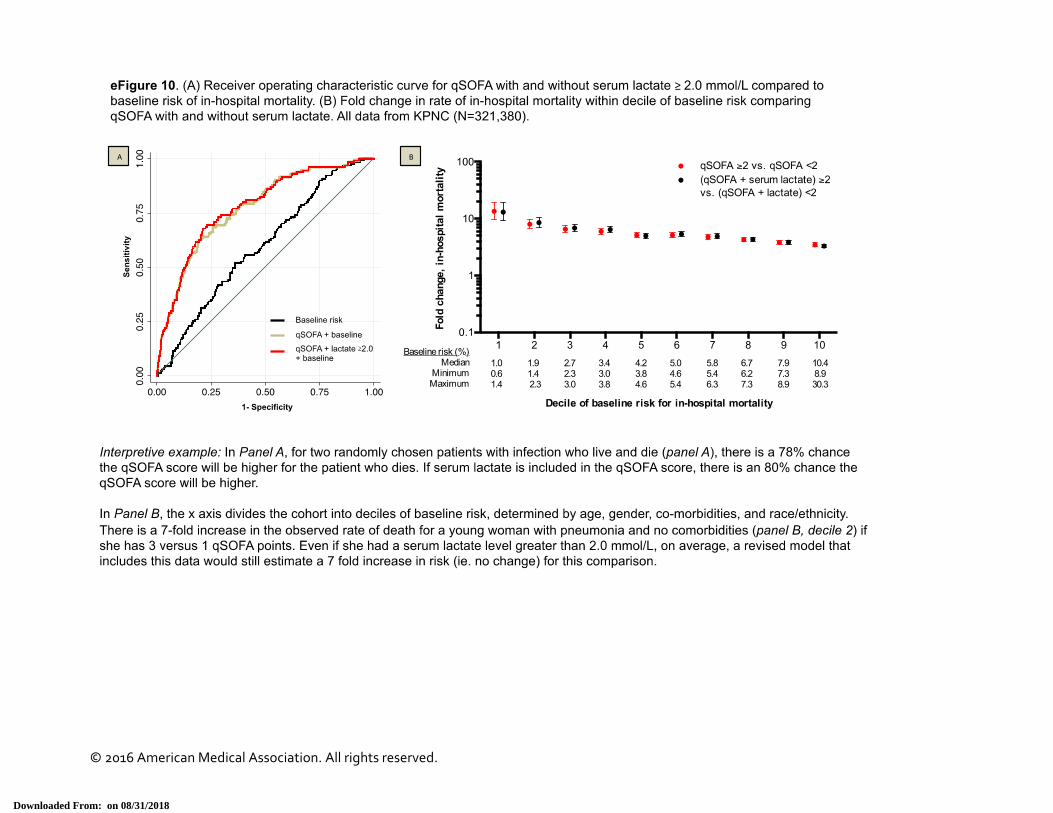
eFigure 10. AUROC for qSOFA With and Without Serum Lactate ≥2.0 mmol/L and Fold Change in In-Hospital Mortality Comparing Encounters Classified by qSOFA Model With and Without Lactate
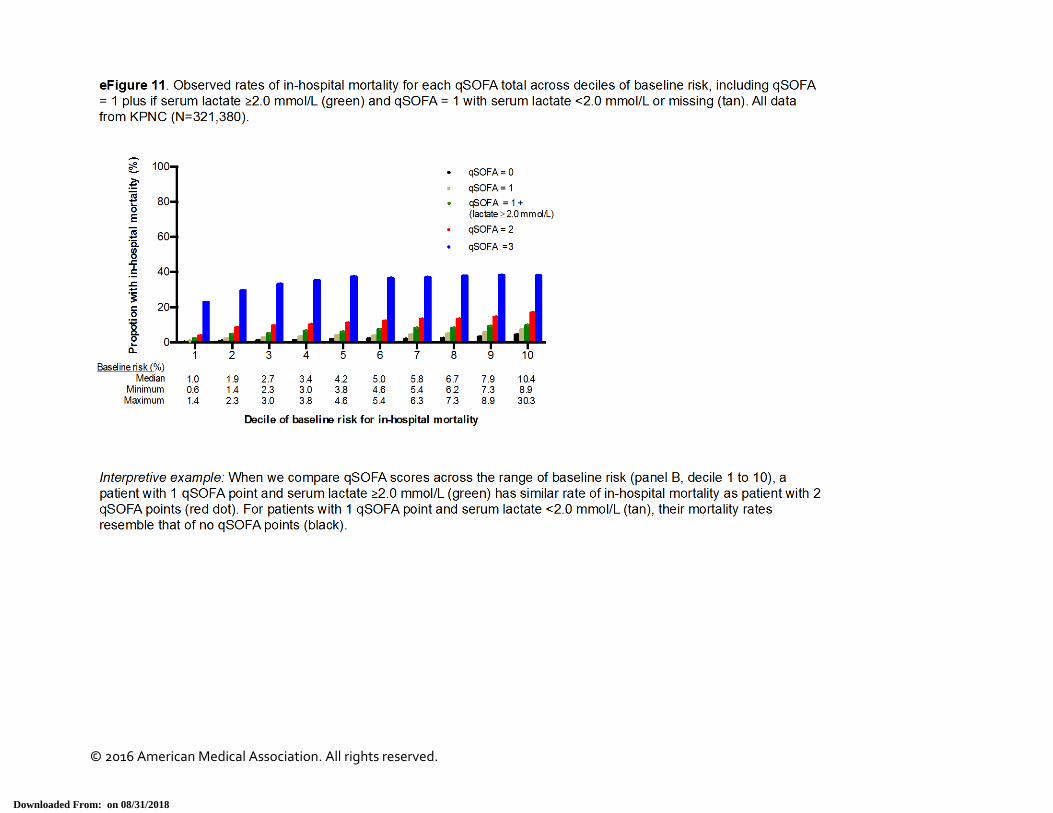
eFigure 11. Crude In-Hospital Mortality Rates for Each qSOFA Score Over the Distribution of Baseline Risk Comparing, Including Patients qSOFA=1 Who Do and Do Not Have Serum Lactate ≥2.0 mmol/L
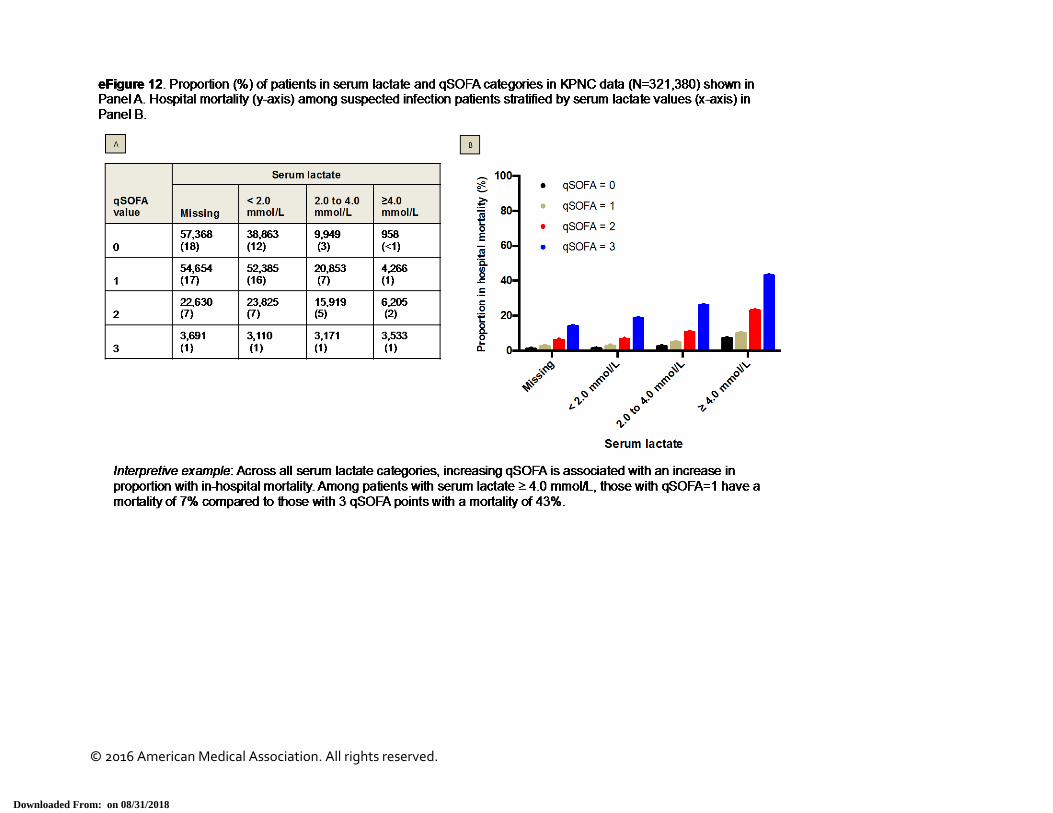
eFigure 12. Crude In-Hospital Mortality Rate Stratified by Serum Lactate and qSOFA
eTable 1. Characteristics of Patients in External Datasets
eTable 2. AUROC Values for In-Hospital Mortality for SIRS, SOFA, LODS, and qSOFA With Pairwise Comparisons and Tests of Inference
eTable 3. Classification of Decedents and Survivors With Suspected Infection by SIRS, SOFA, LODS and qSOFA
eTable 4. Sensitivity Analyses of qSOFA
This supplementary material has been provided by the authors to give readers additional information about their work.
© 2016 American Medical Association. All rights reserved.
Downloaded From: on 08/31/2018
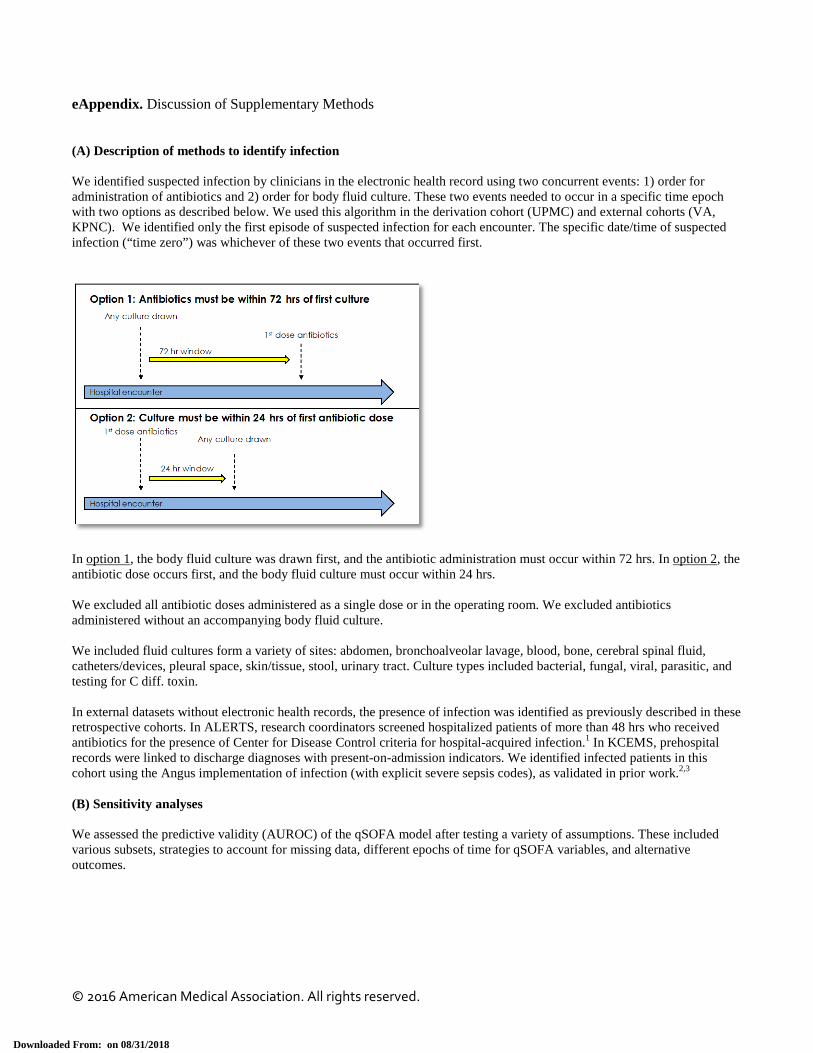
eAppendix. Discussion of Supplementary Methods (A) Description of methods to identify infection We identified suspected infection by clinicians in the electronic health record using two concurrent events: 1) order for administration of antibiotics and 2) order for body fluid culture. These two events needed to occur in a specific time epoch with two options as described below. We used this algorithm in the derivation cohort (UPMC) and external cohorts (VA, KPNC). We identified only the first episode of suspected infection for each encounter. The specific date/time of suspected infection (“time zero”) was whichever of these two events that occurred first.
In option 1, the body fluid culture was drawn first, and the antibiotic administration must occur within 72 hrs. In option 2, the antibiotic dose occurs first, and the body fluid culture must occur within 24 hrs. We excluded all antibiotic doses administered as a single dose or in the operating room. We excluded antibiotics administered without an accompanying body fluid culture. We included fluid cultures form a variety of sites: abdomen, bronchoalveolar lavage, blood, bone, cerebral spinal fluid, catheters/devices, pleural space, skin/tissue, stool, urinary tract. Culture types included bacterial, fungal, viral, parasitic, and testing for C diff. toxin. In external datasets without electronic health records, the presence of infection was identified as previously described in these retrospective cohorts. In ALERTS, research coordinators screened hospitalized patients of more than 48 hrs who received antibiotics for the presence of Center for Disease Control criteria for hospital-acquired infection.1 In KCEMS, prehospital records were linked to discharge diagnoses with present-on-admission indicators. We identified infected patients in this cohort using the Angus implementation of infection (with explicit severe sepsis codes), as validated in prior work.2,3 (B) Sensitivity analyses We assessed the predictive validity (AUROC) of the qSOFA model after testing a variety of assumptions. These included various subsets, strategies to account for missing data, different epochs of time for qSOFA variables, and alternative outcomes.
© 2016 American Medical Association. All rights reserved.
Downloaded From: on 08/31/2018
UPMC sensitivity analyses: 1) Multiple imputation. Multiple imputation procedure Missing data was common in our database (Figure 3). In our sensitivity analysis, we assumed that missing data was conditional on observed covariates, and was “missing at random.” We used a flexible multivariable imputation procedure of multiple chained regression equations (multiple imputation by chained equations, i.e. MICE) which generated values for all missing data using the observed data for all patients.4 We included the all covariates and our primary outcome in the imputation procedure. We modeled variables using logistic, multinomial, or ordinal regression as appropriate. MICE may still lead to bias in the setting of missingness > 50%, but this bias is generally less than that resulting from complete case analysis (which assumes missing completely at random).5 The imputation procedure created 11 independent datasets. For continuous, non-normal variables with upper and lower bounds (Glasgow coma scale score), we used predictive mean matching.5 Analysis after multiple imputation We assessed the AUROC for the primary outcome (hospital mortality) in the independent imputed datasets. We report the median (range) of these measures across our imputed validation sets for three reasons: 1) the normality assumption of these statistics is uncertain, 2) they are generally bounded by 0 and 1, and 3) they are unlikely to have a symmetric distribution.5 2) Altered mentation defined as GCS <15 Because GCS may not always be measured, we used any alteration in mentation (GCS<15) instead of GCS ≤13 in the qSOFA model. 3) Restricted cohorts We assessed the predictive validity among cohorts with more specificity for infection. These included patients with “presumed infection” – those suspected infection who received ≥2 doses of antibiotics within a 96 hr period. This signifies the patient received a “course” of antibiotics. If the patient was discharged or died prior to 96 hrs, they were deemed to have “presumed” infection. We also identified patients with positive blood cultures from microbiology record in the electronic health record. These were termed “confirmed bacteremia.” 4) Excluded: DNR, DNI, or CMO Because patients with code status limitations may not have clinical assessments as often as those who are full code, and thus may not have qSOFA measured, we excluded those patients with either do-not-resuscitate, do-not-intubate, or comfort-measures-only status at the time of suspected infection. 5) Added: serum lactate We explored how adding serum lactate to the qSOFA model would change the AUROC. We dichotomized infection patients whether serum lactate (arterial or venous) >=2.0 mmol/L in the time window around infection (48 hrs before, 24 hrs after). We gave 1 point for elevated serum lactate, and the qSOFA model had a range of 0 to 4 points. We chose not to use assessments of net reclassification as no validated risk threshold are used in the care of septic patients for clinical decision making.6 There are also known limitations of using the incremental discrimination improvement as a metric.7 6) Excluded: antibiotics administered ≥24 hrs after culture We defined suspected infection using a dyad of body fluid culture and antibiotic administration. If the culture came first, the median time to antibiotic dosing was 3.1 hours [IQR: 1.3, 13.1 hours]. We tested if the predictive validity of qSOFA was robust to excluding encounters in which the time after body fluid culture to antibiotics was ≥24 hrs. 7) Time window: restricting to 24 hrs after onset of infection Although debated, some clinicians may not review the electronic health record prior to suspected infection for organ dysfunction criteria. They may only look at proximate data or wait for organ dysfunction to develop in the future. To address
© 2016 American Medical Association. All rights reserved.
Downloaded From: on 08/31/2018
the concern that a 48 hour “look back” window would bias our findings, we tested the predictive validity of qSOFA using only the 24 hrs forward in time after the onset of infection. KPNC sensitivity analyses 1) Restricted cohorts We assessed two restricted cohorts at KPNC. The first tested the predictive validity of qSOFA only among patients at hospital who had >50% of GCS documented (N=88,062). This was 27% of the KPNC cohort. Second, we tested qSOFA in “presumed infection” patients using the same procedure as UPMC. 2) Altered mentation defined using LAPS2 We used an alternative method to identify altered mentation in the electronic health record. The LAPS2 is a validated method (Medical Care, 2008, Escobar et al.) that provides a measure of altered mentation using natural language processing, specifically for patients in whom GCS is missing. For this analysis, as a result, the altered mentation variable had no missingness. 3) Excluded: DNR, DNI, or CMO at the time of infection Similar to UPMC, we excluded encounters deemed to be DNR, DNI, or CMO at the time of infection. 4) Adding serum lactate level We conducted extensive sensitivity analyses when adding serum lactate to qSOFA - as described in the Methods of the main paper. Serum lactate was measured in more than 50% of suspected infection patients at KPNC as a result of a system wide quality improvement program. We tested a variety of serum lactate thresholds (2.0 mmol/L, 3.0 mmol/L, and 4.0 mmol/L), and show results for 2.0 mmol/L given use of this threshold in prior consensus statements.8 We also tested how qSOFA would improve if serum lactate modeled as a continuous variable was added to the model. Results were similar for other thresholds. 5) Time windows We used a time window of 48 hrs before to 24 hrs after for primary qSOFA analyses. We chose this window as it captures the breadth of clinical data available to the physician prescribing antibiotics/obtaining cultures who is considering criteria for sepsis. We use a lag period of 24 hrs after infection, as important lab values may not populate in the electronic health record in real time. To explore different windows, we narrowed the time window to 3 hrs before until 3 hrs after infection suspected, and 12 hours before to 12 hours after, and repeated analyses. VA sensitivity analyses 1) Restricted cohorts We used the same parameterization of “presumed infection” in the VA data and repeated analyses. 2) Outcome We used hospital mortality as one of the outcomes in our predictive validity analyses. This outcome may suffer from discharge bias.9,10 We used fixed time point mortality (30 days) and repeated analyses. 3) Serum lactate We added serum lactate to the qSOFA model using a threshold of 2.0 mmol/L. Because the VA model did not have GCS, the serum lactate–qSOFA model had a range of 0 to 3 points.
© 2016 American Medical Association. All rights reserved.
Downloaded From: on 08/31/2018
© 2016 American Medical Association. All rights reserved.
Downloaded From: on 08/31/2018
© 2016 American Medical Association. All rights reserved.
Downloaded From: on 08/31/2018
© 2016 American Medical Association. All rights reserved.
Downloaded From: on 08/31/2018
© 2016 American Medical Association. All rights reserved.
Downloaded From: on 08/31/2018
© 2016 American Medical Association. All rights reserved.
Downloaded From: on 08/31/2018
© 2016 American Medical Association. All rights reserved.
Downloaded From: on 08/31/2018

© 2016 American Medical Association. All rights reserved.
Downloaded From: on 08/31/2018

© 2016 American Medical Association. All rights reserved.
Downloaded From: on 08/31/2018
© 2016 American Medical Association. All rights reserved.
Downloaded From: on 08/31/2018
© 2016 American Medical Association. All rights reserved.
Downloaded From: on 08/31/2018
© 2016 American Medical Association. All rights reserved.
Downloaded From: on 08/31/2018
© 2016 American Medical Association. All rights reserved.
Downloaded From: on 08/31/2018
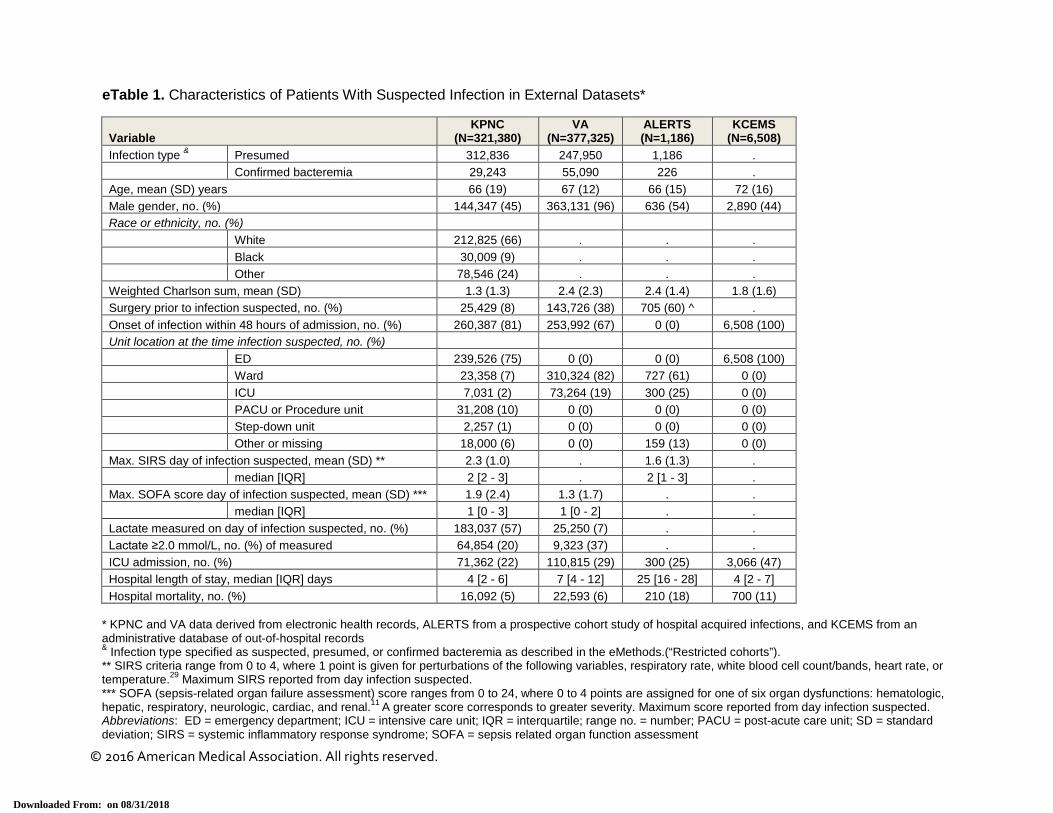
eTable 1. Characteristics of Patients With Suspected Infection in External Datasets*
Variable KPNC
(N=321,380) VA
(N=377,325) ALERTS (N=1,186)
KCEMS (N=6,508)
Infection type & Presumed 312,836 247,950 1,186 . Confirmed bacteremia 29,243 55,090 226 . Age, mean (SD) years 66 (19) 67 (12) 66 (15) 72 (16) Male gender, no. (%) 144,347 (45) 363,131 (96) 636 (54) 2,890 (44) Race or ethnicity, no. (%) White 212,825 (66) . . . Black 30,009 (9) . . . Other 78,546 (24) . . . Weighted Charlson sum, mean (SD) 1.3 (1.3) 2.4 (2.3) 2.4 (1.4) 1.8 (1.6) Surgery prior to infection suspected, no. (%) 25,429 (8) 143,726 (38) 705 (60) ^ . Onset of infection within 48 hours of admission, no. (%) 260,387 (81) 253,992 (67) 0 (0) 6,508 (100) Unit location at the time infection suspected, no. (%) ED 239,526 (75) 0 (0) 0 (0) 6,508 (100) Ward 23,358 (7) 310,324 (82) 727 (61) 0 (0) ICU 7,031 (2) 73,264 (19) 300 (25) 0 (0) PACU or Procedure unit 31,208 (10) 0 (0) 0 (0) 0 (0) Step-down unit 2,257 (1) 0 (0) 0 (0) 0 (0) Other or missing 18,000 (6) 0 (0) 159 (13) 0 (0) Max. SIRS day of infection suspected, mean (SD) ** 2.3 (1.0) . 1.6 (1.3) . median [IQR] 2 [2 - 3] . 2 [1 - 3] . Max. SOFA score day of infection suspected, mean (SD) *** 1.9 (2.4) 1.3 (1.7) . . median [IQR] 1 [0 - 3] 1 [0 - 2] . . Lactate measured on day of infection suspected, no. (%) 183,037 (57) 25,250 (7) . . Lactate ≥2.0 mmol/L, no. (%) of measured 64,854 (20) 9,323 (37) . . ICU admission, no. (%) 71,362 (22) 110,815 (29) 300 (25) 3,066 (47) Hospital length of stay, median [IQR] days 4 [2 - 6] 7 [4 - 12] 25 [16 - 28] 4 [2 - 7] Hospital mortality, no. (%) 16,092 (5) 22,593 (6) 210 (18) 700 (11)
* KPNC and VA data derived from electronic health records, ALERTS from a prospective cohort study of hospital acquired infections, and KCEMS from an administrative database of out-of-hospital records & Infection type specified as suspected, presumed, or confirmed bacteremia as described in the eMethods.(“Restricted cohorts”). ** SIRS criteria range from 0 to 4, where 1 point is given for perturbations of the following variables, respiratory rate, white blood cell count/bands, heart rate, or temperature.29 Maximum SIRS reported from day infection suspected. *** SOFA (sepsis-related organ failure assessment) score ranges from 0 to 24, where 0 to 4 points are assigned for one of six organ dysfunctions: hematologic, hepatic, respiratory, neurologic, cardiac, and renal.11 A greater score corresponds to greater severity. Maximum score reported from day infection suspected. Abbreviations: ED = emergency department; ICU = intensive care unit; IQR = interquartile; range no. = number; PACU = post-acute care unit; SD = standard deviation; SIRS = systemic inflammatory response syndrome; SOFA = sepsis related organ function assessment
© 2016 American Medical Association. All rights reserved.
Downloaded From: on 08/31/2018
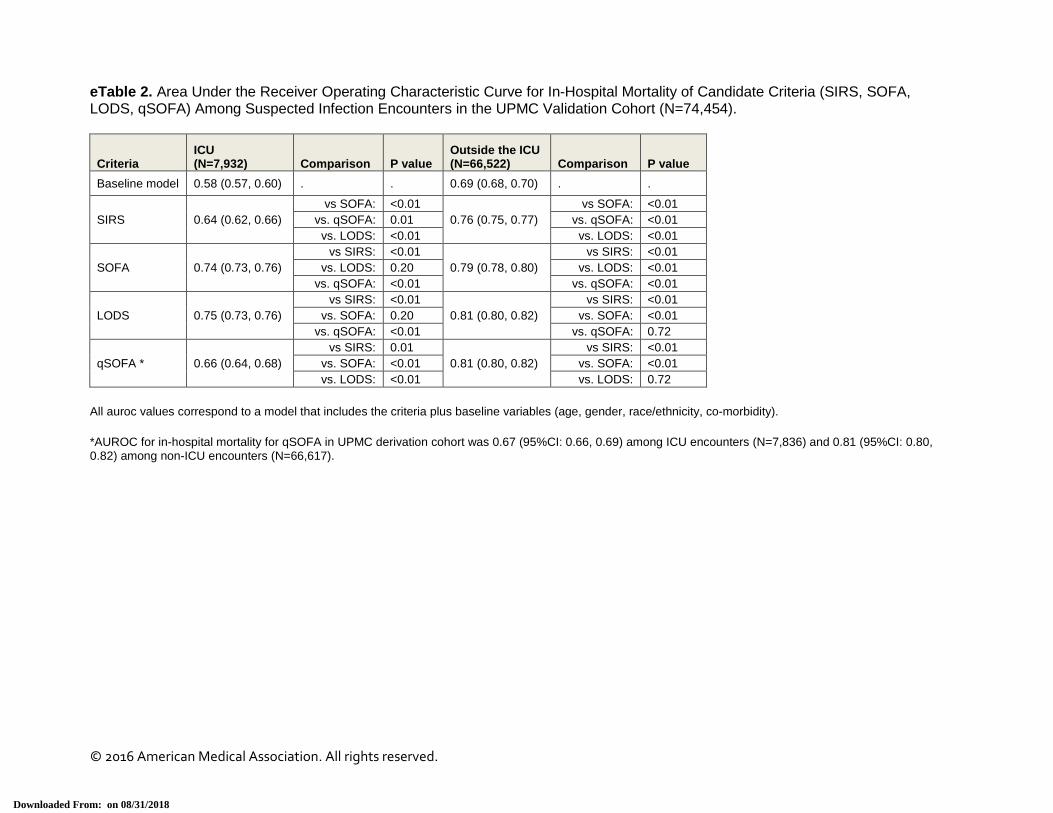
eTable 2. Area Under the Receiver Operating Characteristic Curve for In-Hospital Mortality of Candidate Criteria (SIRS, SOFA, LODS, qSOFA) Among Suspected Infection Encounters in the UPMC Validation Cohort (N=74,454).
Criteria ICU (N=7,932) Comparison P value
Outside the ICU (N=66,522) Comparison P value
Baseline model 0.58 (0.57, 0.60) . . 0.69 (0.68, 0.70) . .
SIRS 0.64 (0.62, 0.66) vs SOFA: <0.01
0.76 (0.75, 0.77) vs SOFA: <0.01
vs. qSOFA: 0.01 vs. qSOFA: <0.01 vs. LODS: <0.01 vs. LODS: <0.01
SOFA 0.74 (0.73, 0.76) vs SIRS: <0.01
0.79 (0.78, 0.80) vs SIRS: <0.01
vs. LODS: 0.20 vs. LODS: <0.01 vs. qSOFA: <0.01 vs. qSOFA: <0.01
LODS 0.75 (0.73, 0.76) vs SIRS: <0.01
0.81 (0.80, 0.82) vs SIRS: <0.01
vs. SOFA: 0.20 vs. SOFA: <0.01 vs. qSOFA: <0.01 vs. qSOFA: 0.72
qSOFA * 0.66 (0.64, 0.68) vs SIRS: 0.01
0.81 (0.80, 0.82) vs SIRS: <0.01
vs. SOFA: <0.01 vs. SOFA: <0.01 vs. LODS: <0.01 vs. LODS: 0.72
All auroc values correspond to a model that includes the criteria plus baseline variables (age, gender, race/ethnicity, co-morbidity). *AUROC for in-hospital mortality for qSOFA in UPMC derivation cohort was 0.67 (95%CI: 0.66, 0.69) among ICU encounters (N=7,836) and 0.81 (95%CI: 0.80, 0.82) among non-ICU encounters (N=66,617).
© 2016 American Medical Association. All rights reserved.
Downloaded From: on 08/31/2018
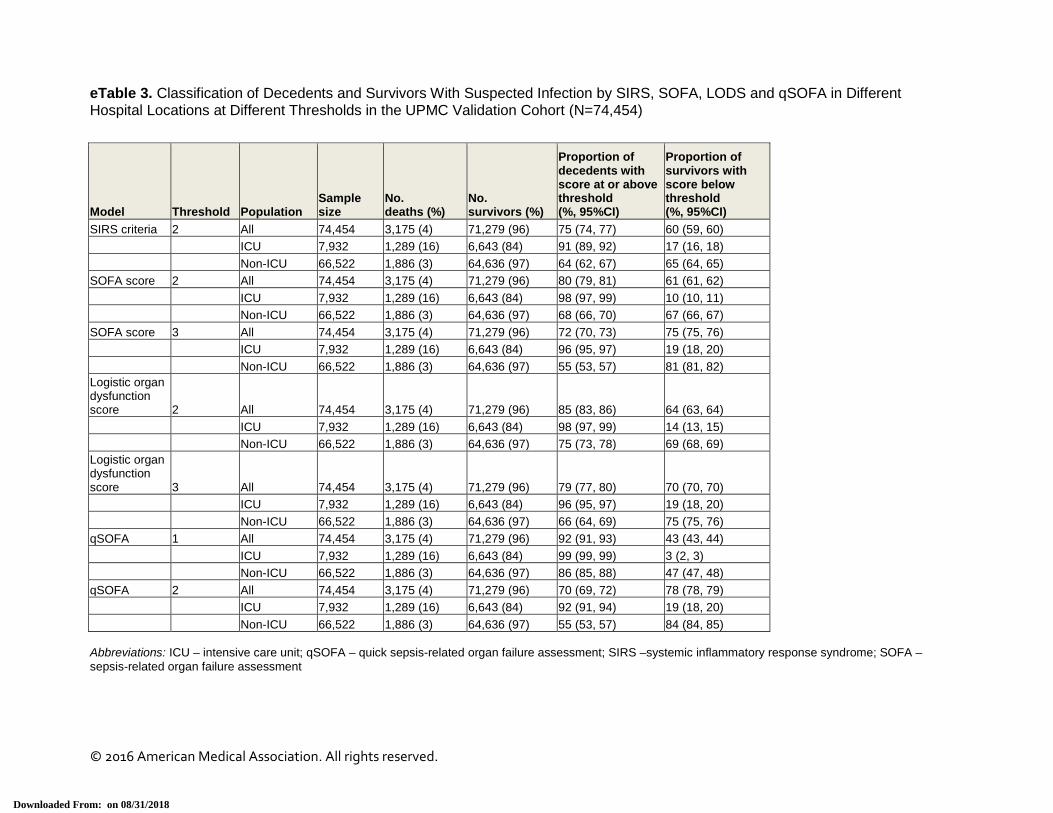
eTable 3. Classification of Decedents and Survivors With Suspected Infection by SIRS, SOFA, LODS and qSOFA in Different Hospital Locations at Different Thresholds in the UPMC Validation Cohort (N=74,454)
Model Threshold Population Sample size
No. deaths (%)
No. survivors (%)
Proportion of decedents with score at or above threshold (%, 95%CI)
Proportion of survivors with score below threshold (%, 95%CI)
SIRS criteria 2 All 74,454 3,175 (4) 71,279 (96) 75 (74, 77) 60 (59, 60) ICU 7,932 1,289 (16) 6,643 (84) 91 (89, 92) 17 (16, 18)
Non-ICU 66,522 1,886 (3) 64,636 (97) 64 (62, 67) 65 (64, 65)
SOFA score 2 All 74,454 3,175 (4) 71,279 (96) 80 (79, 81) 61 (61, 62) ICU 7,932 1,289 (16) 6,643 (84) 98 (97, 99) 10 (10, 11)
Non-ICU 66,522 1,886 (3) 64,636 (97) 68 (66, 70) 67 (66, 67)
SOFA score 3 All 74,454 3,175 (4) 71,279 (96) 72 (70, 73) 75 (75, 76) ICU 7,932 1,289 (16) 6,643 (84) 96 (95, 97) 19 (18, 20)
Non-ICU 66,522 1,886 (3) 64,636 (97) 55 (53, 57) 81 (81, 82)
Logistic organ dysfunction score 2 All 74,454 3,175 (4) 71,279 (96) 85 (83, 86) 64 (63, 64) ICU 7,932 1,289 (16) 6,643 (84) 98 (97, 99) 14 (13, 15)
Non-ICU 66,522 1,886 (3) 64,636 (97) 75 (73, 78) 69 (68, 69)
Logistic organ dysfunction score 3 All 74,454 3,175 (4) 71,279 (96) 79 (77, 80) 70 (70, 70) ICU 7,932 1,289 (16) 6,643 (84) 96 (95, 97) 19 (18, 20)
Non-ICU 66,522 1,886 (3) 64,636 (97) 66 (64, 69) 75 (75, 76)
qSOFA 1 All 74,454 3,175 (4) 71,279 (96) 92 (91, 93) 43 (43, 44)
ICU 7,932 1,289 (16) 6,643 (84) 99 (99, 99) 3 (2, 3)
Non-ICU 66,522 1,886 (3) 64,636 (97) 86 (85, 88) 47 (47, 48)
qSOFA 2 All 74,454 3,175 (4) 71,279 (96) 70 (69, 72) 78 (78, 79) ICU 7,932 1,289 (16) 6,643 (84) 92 (91, 94) 19 (18, 20)
Non-ICU 66,522 1,886 (3) 64,636 (97) 55 (53, 57) 84 (84, 85)
Abbreviations: ICU – intensive care unit; qSOFA – quick sepsis-related organ failure assessment; SIRS –systemic inflammatory response syndrome; SOFA – sepsis-related organ failure assessment
© 2016 American Medical Association. All rights reserved.
Downloaded From: on 08/31/2018

eTable 4. Sensitivity Analyses of the Predictive Validity of qSOFA After Testing Various Assumptions and A Priori Subgroups in UPMC Validation Cohort (N=74,454), KPNC (N=321,380), and VA Data (N=377,125)
Sensitivity analysis or subgroup No. patients
AUC (95% CI) for qSOFA above baseline
UPMC Validation cohort, primary model 74,454 0.83 (0.82, 0.83) Multiple imputation ^ 74,454 0.83 (0.82, 0.84) Altered mentation defined as GCS<15 74,454 0.83 (0.81, 0.84) Restricted: presumed infection 56,511 0.80 (0.79, 0.80) Restricted: confirmed bacteremia 3,449 0.76 (0.74, 0.78) Excluded: DNR/DNI/CMO at time of infection 72,819 0.83 (0.81, 0.85)
Excluded: antibiotics administered ≥24 hrs after culture 67,014 0.84 (0.83, 0.86)
Added: serum lactate ≥2.0 mmol/L 74,454 0.84 (0.83, 0.85)
Time window: 24 hrs after time of infection 74,454 0.83 (0.83, 0.84)
KPNC Full cohort, primary model 321,380 0.78 (0.78, 0.78) Restricted: hospitals with >50% GCS documentation 88,062 0.79 (0.78, 0.79)
Restricted: presumed infection 312,836 0.79 (0.78, 0.79)
Altered mentation defined using LAPS2 321,380 0.79 (0.78, 0.79) Excluded: DNR/DNI/CMO at time of infection 309,905 0.79 (0.78, 0.79) Added: serum lactate ≥2.0 mmol/L 321,380 0.80 (0.79, 0.80)
Added: serum lactate ≥3.0 mmol/L 321,380 0.80 (0.79, 0.81)
Added: serum lactate ≥4.0 mmol/L 321,380 0.80 (0.79, 0.81)
Time window: 3 hrs before to 3 hrs after 321,380 0.78 (0.77, 0.78)
Time window: 12 hrs before to 12 hrs after 321,380 0.79 (0.78, 0.79)
VA * Full cohort, primary model 377,325 0.78 (0.78, 0.79)
Restricted: presumed infection 247,950 0.79 (0.79, 0.79)
Outcome: 30 day mortality 377,325 0.78 (0.78, 0.78) Added: serum lactate ≥2.0 mmol/L 377,325 0.80 (0.80, 0.80) Abbreviations: AUC –area under the receiver operating characteristic curve, CI – confidence interval, CMO – comfort measures only, DNR – do not resuscitate, DNI – do not intubate, GCS – Glasgow coma scale score, LAPS2 - laboratory-based acute physiology score-2.0 ^ Reporting the mean AUC and range (min, max) across 11 imputed datasets * External validation cohort at VA did not have GCS values and qSOFA is a modified two variable model (systolic blood pressures and respiratory rate only), with range 0 to 2 points
© 2016 American Medical Association. All rights reserved.
Downloaded From: on 08/31/2018
eReferences 1. Hagel S, Ludewig K, Frosinski J, et al. [Effectiveness of a hospital-wide educational programme for infection control to
reduce the rate of health-care associated infections and related sepsis (ALERTS)--methods and interim results]. Dtsch Med Wochenschr. 2013;138(34-35):1717-1722.
2. Iwashyna TJ, Odden, A., Rohde, J., Bonham, C., Kuhn, L., Malani, P., Chen, L., Flanders, S. Identifying patients with severe sepsis using administrative claims: patient-level validation of the Angus implementation of the International Consensus Conference Definition of severe sepsis. Med Care. 2014; 52 (6):39-43
3. Seymour CW, Rea TD, Kahn JM, Walkey A, Yealy DM, Angus DC. Severe Sepsis in Prehospital Emergency Care: Analysis of Incidence, Care, and Outcome. Am J Resp Crit Care Med. 2012; 186 (12):1264-1271.
4. van Buuren S, Boshuizen HC, Knook DL. Multiple imputation of missing blood pressure covariates in survival analysis. Stat Med. 1999;18(6):681-694.
5. Marshall A, Altman DG, Royston P, Holder RL. Comparison of techniques for handling missing covariate data within prognostic modelling studies: a simulation study. BMC Med Res Methodol. 19;10(1):7.
6. Pencina MJ, D'Agostino RB, Sr., Steyerberg EW. Extensions of net reclassification improvement calculations to measure usefulness of new biomarkers. Stat Med. J2011;30(1):11-21.
7. Kerr KF, McClelland, R.L., Brown, E.R., Lumley T. Evaluating the incremental value of new biomarkers with integrated discrimination improvement. Am J Epidemiol. 2011;174 (3): 364-372
8. Cecconi M, De Backer D, Antonelli M, et al. Consensus on circulatory shock and hemodynamic monitoring. Task force of the European Society of Intensive Care Medicine. Intensive Care Med. 2014;40(12):1795-1815.
9. Reineck LA, Pike F, Le TQ, Cicero BD, Iwashyna TJ, Kahn JM. Hospital Factors Associated With Discharge Bias in ICU Performance Measurement. Crit Care Med. 2014; 42(5):1055-1064
10. Vasilevskis EE, Kuzniewicz MW, Dean ML, et al. Relationship between discharge practices and intensive care unit in-hospital mortality performance: evidence of a discharge bias. Med Care. 2009;47(7):803-812.
11. Vincent JL, Moreno R, Takala J, et al. The SOFA (Sepsis-related Organ Failure Assessment) score to describe organ dysfunction/failure. On behalf of the Working Group on Sepsis-Related Problems of the European Society of Intensive Care Medicine. Intensive Care Med. 1996; 22(7):707-710.
12. Le Gall JR, Klar J, Lemeshow S, et al. The Logistic Organ Dysfunction system. A new way to assess organ dysfunction in the intensive care unit. ICU Scoring Group. JAMA. 1996; 276(10):802-810
© 2016 American Medical Association. All rights reserved.
Downloaded From: on 08/31/2018