supplementary materials for -...
TRANSCRIPT

Originally posted 22 August 2014; corrected 15 September 2014 (see below)
www.sciencemag.org/content/345/6199/950/suppl/DC1
Supplementary Materials for
Early allopolyploid evolution in the post-Neolithic Brassica napus oilseed genome
Boulos Chalhoub,* France Denoeud, Shengyi Liu, Isobel A. P. Parkin, Haibao Tang, Xiyin Wang, Julien Chiquet, Harry Belcram, Chaobo Tong, Birgit Samans, Margot Corréa, Corinne Da
Silva, Jérémy Just, Cyril Falentin, Chu Shin Koh, Isabelle Le Clainche, Maria Bernard, Pascal Bento, Benjamin Noel, Karine Labadie, Adriana Alberti, Mathieu Charles, Dominique Arnaud, Hui Guo, Christian Daviaud, Salman Alamery, Kamel Jabbari, Meixia Zhao, Patrick P. Edger,
Houda Chelaifa, David Tack, Gilles Lassalle, Imen Mestiri, Nicolas Schnel, Marie-Christine Le Paslier, Guangyi Fan, Victor Renault, Philipp E. Bayer, Agnieszka A. Golicz, Sahana Manoli,
Tae-Ho Lee, Vinh Ha Dinh Thi, Smahane Chalabi, Qiong Hu, Chuchuan Fan, Reece Tollenaere, Yunhai Lu, Christophe Battail, Jinxiong Shen, Christine H. D. Sidebottom, Xinfa Wang, Aurélie
Canaguier, Aurélie Chauveau, Aurélie Bérard, Gwenaëlle Deniot, Mei Guan, Zhongsong Liu, Fengming Sun, Yong Pyo Lim, Eric Lyons, Christopher D. Town, Ian Bancroft, Xiaowu Wang, Jinling Meng, Jianxin Ma, J. Chris Pires, Graham J. King, Dominique Brunel, Régine Delourme,
Michel Renard, Jean-Marc Aury, Keith L. Adams, Jacqueline Batley, Rod J. Snowdon, Jorg Tost, David Edwards, Yongming Zhou, Wei Hua, Andrew G. Sharpe, Andrew H. Paterson,
Chunyun Guan, Patrick Wincker
*General corresponding author. E-mail: [email protected]
Published 22 August 2014, Science 345, 950 (2014) DOI: 10.1126/science.1253435
This PDF file includes:
Materials and Methods Supplementary Text Figs. S1 to S34 Tables S1 to S5, S8, S10, S11, S15 to S18, S20, S24, S25, S30, S35, S36, S39, S41, S48 References Additional Acknowledgments
Other Supporting Online Material for this manuscript includes the following: (available at www.sciencemag.org/content/345/6199/950/suppl/DC1)
Tables S6, S7, S9, S12 to S14, S19, S21 to S23, S26 to S29, S31 to S34, S37, S38, S40, S42 to S47, S49 to S51 (as single Excel file)
Correction: Author Philipp E. Bayer’s name was corrected in the author lists.

Early allopolyploid evolution in the post-neolithic Brassica napus oilseed genome Boulos Chalhoub1*†, France Denoeud2,3,4*, Shengyi Liu5*, Isobel A. P. Parkin6†, Haibao Tang7,8, Xiyin Wang9,10, Julien Chiquet11, Harry Belcram1, Chaobo Tong5, Birgit Samans12, Margot Corréa2, Corinne Da Silva2, Jérémy Just1, Cyril Falentin13, Chu Shin Koh14, Isabelle Le Clainche1, Maria Bernard2, Pascal Bento2, Benjamin Noel2, Karine Labadie2, Adriana Alberti2, Mathieu Charles15, Dominique Arnaud1, Hui Guo9, Christian Daviaud16, Salman Alamery17, Kamel Jabbari1,18, Meixia Zhao19, Patrick P. Edger20, Houda Chelaifa1, David Tack21, Gilles Lassalle13, Imen Mestiri1, Nicolas Schnel13, Marie-Christine Le Paslier15, Guangyi Fan22, Victor Renault23, Philipp E. Bayer17, Agnieszka A. Golicz17, Sahana Manoli17, Tae-Ho Lee9 , Vinh Ha Dinh Thi1, Smahane Chalabi1, Qiong Hu5, Chuchuan Fan24, Reece Tollenaere17, Yunhai Lu1, Christophe Battail2, Jinxiong Shen24, Christine H. D. Sidebottom14, Xinfa Wang5, Aurélie Canaguier1, Aurélie Chauveau15, Aurélie Bérard15, Gwenaëlle Deniot13, Mei Guan25, Zhongsong Liu25, Fengming Sun22, Yong Pyo Lim26, Eric Lyons27, Christopher D. Town7, Ian Bancroft28, Xiaowu Wang29, Jinling Meng24, Jianxin Ma19, J. Chris Pires30, Graham J. King31, Dominique Brunel15, Régine Delourme13, Michel Renard13, Jean-Marc Aury2, Keith L. Adams21, Jacqueline Batley17,32, Rod J. Snowdon12, Jorg Tost16, David Edwards17,32†, Yongming Zhou24†, Wei Hua5†, Andrew G. Sharpe14†, Andrew H. Paterson9†, Chunyun Guan25†, Patrick Wincker 2,3,4† *Co-first authors. †Corresponding authors. E-mails: [email protected], [email protected], [email protected], [email protected], [email protected], [email protected], [email protected], [email protected], [email protected] Authorship information Author contributions Participants are arranged here by working group and then are listed in alphabetical order. Major contributions (*) and author for correspondence (†) are indicated within each working group. Research Leaders: Ian Bancroft, Jacqueline Batley, Boulos Chalhoub*† ([email protected]), Régine Delourme, David Edwards, Chunyun Guan, Wei Hua, Shengyi Liu*, Isobel A. P. Parkin*, Andrew H. Paterson*, Andrew G. Sharpe, Xiyin Wang, Patrick Wincker* and Yongming Zhou. Genome sequencing and assembly: Jean-Marc Aury*† ([email protected]), Maria Bernard, Benjamin Noel, Karine Labadie. Genome annotation: Jean-Marc Aury, Harry Belcram, Christophe Battail, Pascal Bento, Aurélie Canaguier, Mathieu Charles, Isabelle Le Clainche, Margot Corréa, Vinh Ha Dinh Thi, Guanyi Fan, kamel Jabbari, Ma Jianxin, Jérémy Just*, Karine Labadie, Benjamin Noel *† ([email protected]), Fengming Sun, Meixia Zhao*. Genetic mapping: Harry Belcram, Aurélie Bérard, Dominique Brunel*, Aurélie Chauveau, Mathieu Charles, Régine Delourme*, Gwenaëlle Deniot, France Denoeud, Cyril Falentin*† ([email protected]), Qiong Hu, Jérémy Just, Chu Shin Koh, Marie-Christine Le Paslier, Yunhai Lu, Isobel A.P. Parkin*, Michel Renard, Christine H. D. Sidebottom, Andrew G. Sharpe*, Yongming Zhou. Alternative Splicing: Keith Adams*† ([email protected]), Corine Dasilva, France Denoeud*, David Tack*.
2

Methylation analysis: Harry Belcram, Christian Daviaud, Victor Renault, Jorg Tost*† ([email protected]). Comparative genomics and synteny analysis: Agnieszka A Golicz, Boulos Chalhoub*, Haibao Tang*† ([email protected]), Chaobo Tong*, Ian Bancroft, Shengyi Liu*, Eric Lyons, Xiaowu Wang, Christopher D. Town, David Edwards*. Homeologous exchanges and diversity analysis: Boulos Chalhoub*, France Denoeud*† ([email protected]), Graham King, J. Chris Pires, Birgit Samans, Rod J. Snowdon*, Mei Guan. Gene conversion and molecular dating: Philipp Bayer, Boulos Chalhoub*, David Edwards, Hui Guo, Tae-ho Lee, Xiyin Wang*† ([email protected]), Jinxiong Shen, Zhongsong Liu, Andrew H. Paterson* Homeologous gene expression: Adriana Alberti Dominique Arnaud, Pascal Bento, Smahane Chalabi, Houda Chelaifa, Corine Da Silva*, Julien Chiquet*† ([email protected]), Qiong Hu, Imen Mestiri, Xinfa Wang. Oil biosynthesis gene analysis: Patrick P. Edger, Wei Hua*, Chu Shin Koh, Jinling Meng, Isobel A. P. Parkin, Andrew G. Sharpe*† ([email protected]). Glucosinolate gene analysis: Boulos Chalhoub, France Denoeud, Gilles Lassalle*, Régine Delourme*† ([email protected]), Chunyun Guan, Nicolas Schnel. NBS-LRR gene analysis: Salman Alamery, Jacqueline Batley*† ([email protected]), Chuchuan Fan, Yong Pyo Lim, Sahana Manoli, Reece Tollenaere. Author affiliations 1Institut National de Recherche Agronomique (INRA), Unité de Recherche en Génomique Végétale (URGV), UMR1165, Organization and Evolution of Plant Genomes (OEPG), 2 rue Gaston Crémieux, 91057 Evry France. 2Commissariat à l’Energie Atomique (CEA), Institut de Génomique (IG), Genoscope, BP5706,
91057 Evry, France 3Université d’Evry Val d’Essone, UMR 8030, CP5706, Evry, France 4Centre National de Recherche Scientifique (CNRS), UMR 8030, CP5706, Evry, France 5The Key Laboratory of Biology and Genetic Improvement of Oil Crops, the Ministry of Agriculture of PRC, Oil Crops Research Institute, Chinese Academy of Agricultural Sciences, Wuhan 430062, China. 6Agriculture and Agri-Food Canada, 107 Science Place, Saskatoon, SK, S7N 0X2, Canada 7J. Craig Venter Institute, Rockville MD 20850, USA. 8Center for Genomics and Biotechnology, Fujian Agriculture and Forestry, University, Fuzhou 350002, Fujian Province, China. 9Plant Genome Mapping Laboratory, University of Georgia, Athens GA 30602, USA. 10Center of Genomics and Computational Biology, School of Life Sciences, Hebei United University, Tangshan, Hebei, 063000, China 11Laboratoire de mathématiques et modélisation d'Evry (LaMME) - UMR 8071 cnrs / université d’Evry val d Essonne - USC INRA. 12Department of Plant Breeding, IFZ Research Centre for Biosystems, Land Use and Nutrition, Justus Liebig University, Heinrich-Buff-Ring 26-32, 35392 Giessen, Germany. 13Institut National de Recherche Agronomique (INRA), Institut de génétique, Environnement et Protection des Plantes (IGEPP) UMR1349, BP35327, 35653 Le Rheu Cedex. 14National Research Council Canada, 110 Gymnasium Place, Saskatoon, SK, S7N 0W9, Canada.
3

15Institut National de Recherche Agronomique (INRA), Etude du Polymorphisme des Génomes Végétaux (EPGV), US1279, Centre National de Génotypage, CEA – Institut de Génomique, 2 rue Gaston Crémieux, 91057 Evry France. 16Laboratory for Epigenetics and Environment, Centre National de Génotypage, CEA – Institut de Génomique, 2 rue Gaston Crémieux, 91000 Evry, France. 17Australian Centre for Plant Functional Genomics, School of Agriculture and Food Sciences, University of Queensland, St Lucia, QLD 4072, Australia. 18Cologne Center for Genomics (CCG), University of Coogne, Weyertal 115b, 50931 Köln, Germany 19Department of Agronomy, Purdue University, WSLR Building B018, West Lafayette, IN 47907, USA. 20Department of Plant and Microbial Biology, University of California, Berkeley, CA, 94720 USA. 21Department of Botany, University of British Columbia, Vancouver, BC, Canada. 20Beijing Genome Institute-Shenzhen, Shenzhen 518083, China. 23Fondation Jean Dausset – CEPH, 27 rue Juliette Dodu, 75010 Paris, France 24National Key Laboratory of Crop Genetic Improvement, Huazhong Agricultural University, Wuhan 430070, China. 25College of Agronomy, Hunan Agricultural University, Changsha 410128, China. 26 Molecular Genetics and Genomics Laboratory, Department of Horticulture, Chungnam National University, Daejeon-305764, South Korea. 27School of Plant Sciences, iPlant Collaborative, University of Arizona, Tucson, AZ, USA. 28Department of Biology, University of York, Wentworth Way, Heslington, York YO10 5DD, UK. 29Institute of Vegetables and Flowers, Chinese Academy of Agricultural Sciences, Beijing, China. 30Division of Biological Sciences, University of Missouri, Columbia, MO, 65211 USA. 31Southern Cross Plant Science, Southern Cross University, Lismore, NSW 2480, Australia. 32School of Plant Biology, University of Western Australia, WA, 6009, Australia.
4

Contents: Brassica napus Genome Supplementary Online Materials Section Page Authorship Information ........................................................................................2 Materials and Methods 6 Supplementary Text
1- Strategy for sequencing the complex allopolyploid B. napus genome 22
2- Genetic maps and pseudomolecules 23
3- Transposable elements (TEs) 24
4- Alternative splicing 27
5- Fine conservation, homeology relationships and gene loss 27
6- Homeologous exchanges (HEs) 30
7- Homeologous gene expression 33
8- Genome-wide cytosine methylation 35
9- Comparative analysis of oil biosynthesis genes in Brassica spp. 36
10- Glucosinolate genes 37
11- Disease resistance genes 38
12- Analysis of FLOWERING LOCUS C adaptation 41
13- The contribution of HEs to phentopic innovation 42
Supplementary Figures 43 Supplementary Tables 87 Additional Acknowledgements .........................................................................................111 Supplementary References 111
Supplementary Large tables (separate Excel file)
5

Materials and Methods Brassica napus genotype used for reference genome sequencing The Brassica napus French homozygous winter line ‘Darmor-bzh’, used as a parent in the development of public reference segregating populations and genetic maps (21), was chosen as the reference for genome sequencing. This homozygous double haploid line was maintained by selfing and its pedigree shows that it has not been bred or backcrossed with parental diploid species or other Brassica species. ‘Darmor’ is a French winter double low oilseed rape cultivar lacking detectable erucic acid in the seed oil, and with low seed glucosinolate content. The low erucic content trait was derived from the spring German fodder cultivar ‘Liho’ and the low seed glucosinolate content was derived from the spring Polish cultivar ‘Bronowski’ (24). ‘Darmor’ was derived from two cycles of backcross and pedigree breeding with first the French double high winter cultivar 'Gaspard' to produce the single low cultivar 'Jetneuf,' which then was used as the recurrent line to produce the double low cultivar 'Darmor'. ‘‘Darmor-bzh’ is a dwarf near-isogenic line resulting from the introduction of the dwarf bzh gene in ‘Darmor’ (25). Preparation of high molecular weight DNA for reference genome sequencing High molecular weight (HMW) DNA was prepared after extraction of nuclei. Nuclei were isolated from young fresh leaves as previously described (26). When the nuclei were pelleted, we proceeded to HMW DNA extraction as follows. The nuclear pellet was gently resuspended in SEB buffer (0.01 M Tris base, 0.1 M KCl, 0.01 M EDTA, pH 9.4-9.5, 500 mM sucrose, 4 mM spermidine, 1 mM spermine tetrahydrochloride, 0.1% w/v ascorbic acid, 2.0% w/v PVP (MW 40,000), and 0.13% w/v sodium diethyldithiocarbamate). Ten ml of lysis buffer (TRIS 1M (100mM), NaCl 5M (100mM), EDTA 0.5M (50mM), SDS 10% (2%)) was added together with 100 µl of Proteinase K and incubated for one hour at 65°C. Ten ml of phenol/chloroform (24-1) was then added to each tube, mixed gently by inversion and centrifuged at 2000 rpm in a bench top centrifuge to separate the phases (20 minutes). The phenol/chloroform extraction was repeated twice. HMW DNA was then precipitated by adding 0.6 volumes (approx 6 ml) of isopropanol, centrifuged for 20 min at 2000 rpm and the DNA pellet rinsed 2-3x with 70% ethanol and air dried briefly on a hook. The DNA pellet was dissolved in 5 ml of 1x TE, 10 μl of RNAse stock was added and the DNA was incubated at 37°C for 1 h. This was then extracted with phenol/chloroform twice, as described above. The DNA was precipitated again by adding 1/10 volume of 3 M sodium acetate (to give a final concentration of 0.3 M), mixed, 2 volumes of cold 95% ethanol were added, centrifuged and the DNA pellet rinsed with 70% ethanol, placed in a sterile 2 ml screw cap tube, with excess 70% ethanol drained off after a quick centrifugation. Finally, 1.8 - 2 mls of 1X TE was added to dissolve the DNA. Reference genome sequencing and assembly In total, we generated 68,405,795 reads, which equated to a 21.2x fold coverage of the estimated (27) 1,130 Mb genome of B. napus, from GS FLX Titanium sequencing (reads of 450 bp average size, including 20% long 800 bp reads generated with the improved FLX+ protocol), 0.1x Sanger BES and 53.9x Illumina HiSeq sequencing (reads of 100 bp), as detailed in Table S1 and below. Sanger BES of an available BAC library of 139 kb average insert size (26) allowed 141,076 reads of 650 bp average size to be generated (64,702 pairs), representing a coverage of 7.8X. For GS FLX Titanium 454 sequencing, we constructed different libraries, including random fragmented DNA, 8 kb-recircularized nebulized fragments to allow linking of the contigs into scaffolds and 20 kb-recircularized fragments that allow scaffolding at longer distances.
6
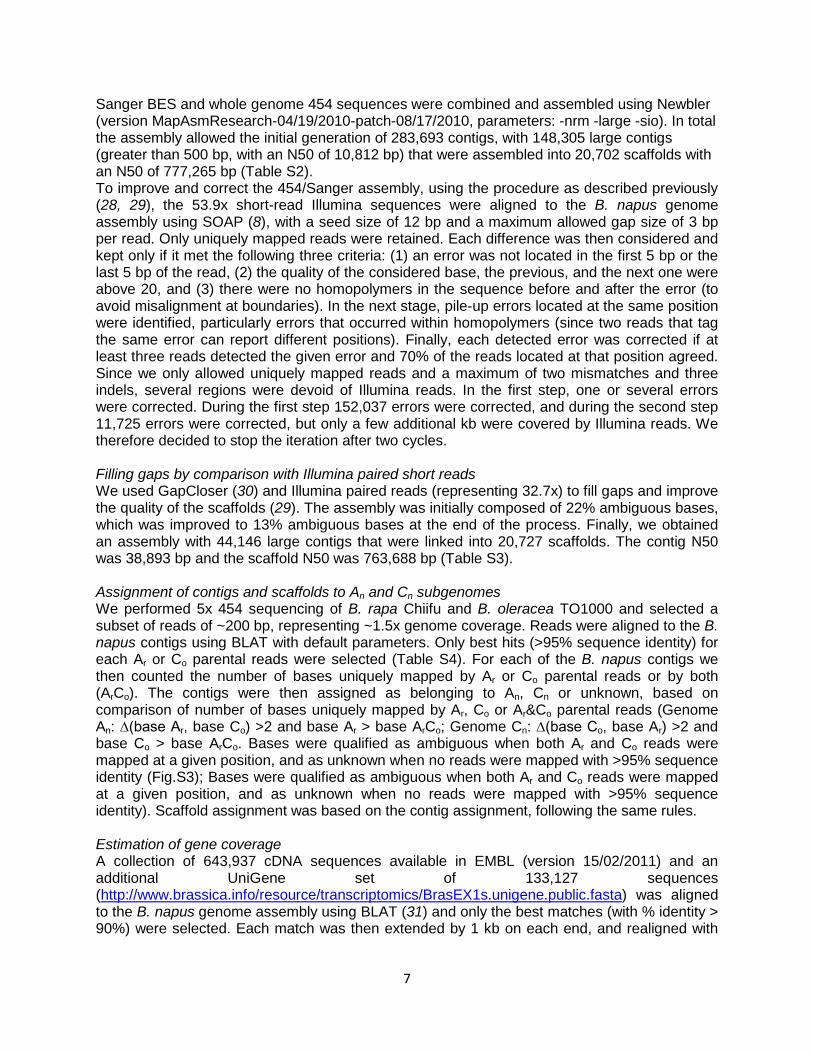
Sanger BES and whole genome 454 sequences were combined and assembled using Newbler (version MapAsmResearch-04/19/2010-patch-08/17/2010, parameters: -nrm -large -sio). In total the assembly allowed the initial generation of 283,693 contigs, with 148,305 large contigs (greater than 500 bp, with an N50 of 10,812 bp) that were assembled into 20,702 scaffolds with an N50 of 777,265 bp (Table S2). To improve and correct the 454/Sanger assembly, using the procedure as described previously (28, 29), the 53.9x short-read Illumina sequences were aligned to the B. napus genome assembly using SOAP (8), with a seed size of 12 bp and a maximum allowed gap size of 3 bp per read. Only uniquely mapped reads were retained. Each difference was then considered and kept only if it met the following three criteria: (1) an error was not located in the first 5 bp or the last 5 bp of the read, (2) the quality of the considered base, the previous, and the next one were above 20, and (3) there were no homopolymers in the sequence before and after the error (to avoid misalignment at boundaries). In the next stage, pile-up errors located at the same position were identified, particularly errors that occurred within homopolymers (since two reads that tag the same error can report different positions). Finally, each detected error was corrected if at least three reads detected the given error and 70% of the reads located at that position agreed. Since we only allowed uniquely mapped reads and a maximum of two mismatches and three indels, several regions were devoid of Illumina reads. In the first step, one or several errors were corrected. During the first step 152,037 errors were corrected, and during the second step 11,725 errors were corrected, but only a few additional kb were covered by Illumina reads. We therefore decided to stop the iteration after two cycles. Filling gaps by comparison with Illumina paired short reads We used GapCloser (30) and Illumina paired reads (representing 32.7x) to fill gaps and improve the quality of the scaffolds (29). The assembly was initially composed of 22% ambiguous bases, which was improved to 13% ambiguous bases at the end of the process. Finally, we obtained an assembly with 44,146 large contigs that were linked into 20,727 scaffolds. The contig N50 was 38,893 bp and the scaffold N50 was 763,688 bp (Table S3). Assignment of contigs and scaffolds to An and Cn subgenomes We performed 5x 454 sequencing of B. rapa Chiifu and B. oleracea TO1000 and selected a subset of reads of ~200 bp, representing ~1.5x genome coverage. Reads were aligned to the B. napus contigs using BLAT with default parameters. Only best hits (>95% sequence identity) for each Ar or Co parental reads were selected (Table S4). For each of the B. napus contigs we then counted the number of bases uniquely mapped by Ar or Co parental reads or by both (ArCo). The contigs were then assigned as belonging to An, Cn or unknown, based on comparison of number of bases uniquely mapped by Ar, Co or Ar&Co parental reads (Genome An: ∆(base Ar, base Co) >2 and base Ar > base ArCo; Genome Cn: ∆(base Co, base Ar) >2 and base Co > base ArCo. Bases were qualified as ambiguous when both Ar and Co reads were mapped at a given position, and as unknown when no reads were mapped with >95% sequence identity (Fig.S3); Bases were qualified as ambiguous when both Ar and Co reads were mapped at a given position, and as unknown when no reads were mapped with >95% sequence identity). Scaffold assignment was based on the contig assignment, following the same rules. Estimation of gene coverage A collection of 643,937 cDNA sequences available in EMBL (version 15/02/2011) and an additional UniGene set of 133,127 sequences (http://www.brassica.info/resource/transcriptomics/BrasEX1s.unigene.public.fasta) was aligned to the B. napus genome assembly using BLAT (31) and only the best matches (with % identity > 90%) were selected. Each match was then extended by 1 kb on each end, and realigned with
7

the sequence using Est2genome software (32). About 95.6% of B. napus public cDNAs were mapped, with an average percent identity of 98.6%. Resequencing of a subset of genotypes from B. napus, B. rapa and B. oleracea We sequenced the B. napus oilseed cultivars, ‘Yudal’, ‘Bristol’‘‘Bristol’’, ‘Avisol’ and ‘Aburamasari’, as well as the Siberian kale, Gruener Schnittkohl (accession DEUIPKBRA177/87, IPK Genebank, Gatersleben, Germany), the rutabaga/swede Sensation NZ (B. napus ssp napobrassica accession HRIGRU005836, Horticulture Research International Genetic Resources Unit, Warwick, UK) and the resynthesized B. napus ‘H165' (Table S6). All genotypes are inbred derived by single-seed descent. B. napus ‘H165' was generated at Georg August University, Göttingen, Germany by embryo rescue and chromosome doubling of an interspecific haploid from the cross between B. oleracea ssp capitata var. sabauda and B. rapa ssp. chinensis (33). We also sequenced B. oleracea accessions representing a range of morphotypes; TO1000 (Chinese Kale, rapid cycling; 11), Early Big (Broccoli), Gower (AC498; Brussel Sprout), and also B. rapa accessions Candle (ssp. oleifera, oilseed), Reward (ssp. oleifera oilseed) and Maleksberger (spring turnip rape), B3, and R500 (Table S6). All lines were sequenced using 100 bp paired-end Illumina reads using sheared DNA libraries of 300 bp to 500 bp size (representing more than 15x genome coverage). Construction of dense genetic maps and scaffold anchoring In order to achieve the accurate anchoring of assembled scaffolds to genetic maps and perform pseudochromosome assembly, we used three different segregating populations and developed and mapped a large number of SNP-based markers. Segregating populations and DNA preparation for genotyping The three B. napus segregating populations are: 1) BnaDYDH (‘DY’): an established population consisting of 356 doubled haploid (DH) individuals derived from a cross between ‘Darmor-bzh’ and the cultivar ‘Yudal’, originating from South-Asia (21, 34). 2) BnaDBF2 (‘DB’): a new population consisting of 290 F2 individuals developed from a cross between the European winter cultivars ‘Darmor’ and ‘Bristol’‘‘Bristol’’. 3) BnaAADH (‘AA’): an established population of 190 F2-derived doubled haploid lines developed from a cross between the European winter cultivar ‘Avisol’ and the cultivar ‘Aburamasari’, originating from South-Asia, kindly provided by the company Biogemma (21). DNA from all 836 segregating individuals and parental genotypes (12 replicates for ‘Darmor-bzh’ and 2 replicates for ‘Yudal’) was extracted using the Nucleospin 96 Plant II Core kit (Macherey-Nagel, Duren, Germany). DNA from each individual was checked for quality and then diluted to a concentration recommended for the purpose of SNP mapping by hybridization to an Infinium 20K iSelect BeadChip (Illumina), specially designed for anchoring of scaffolds of the reference genome (see below). All three populations were therefore genotyped with the 20K bead SNP Infinium BeadChip array (Illumina), developed within this project and called here after SeqPolyNap 20K Illumina BeadChip array. The DY population was further genotyped with dense Restriction site Associated DNA (RAD) SNP markers (see below). Existing maps and markers The B. napus DY population is a public reference population for which several genetic maps have previously been constructed (21, 35-37). For scaffold anchoring, we used available mapping data of markers for which sequences were available. These consisted of 825 SSR,
8

PCR-based, ACGM and PFM markers (37) and a set of 2,536 SNP markers (prefixed “BS”), developed previously through gene capture technology (21). They were mapped to the assembly scaffolds using BLASTN search with high stringent parameters (evalue 1e-6, word size 7, reward 1, penalty -3, gapopen 1, gapextend 2, dust yes). For all the SNP markers and most of the PCR based markers, mapping data were available for 278 segregating DH lines that constituted a subset of the 356 DH lines used here. These 3,361 markers clustered into 1,702 genetic bins (one bin corresponded to all markers having the same genotype scoring data). A genetic map of the B. napus ‘AA’ population was also previously constructed with 3,408 “BS” SNPs (21), using genotypes from 96 F2-derived DH lines. The SNP markers were clustered into 1,634 genetic bins. Mapping data of these two populations were combined with those obtained within this project to construct an integrated genetic map (see below). Anchoring to scaffold sequences was done using BLASTN search with high stringency parameters (Evalue 1E-6, word size 7, reward 1, penalty -3, gapopen 1, gapextend 2, dust yes) Development of the SeqPolyNap 20K Illumina BeadChip array (13K SNPs) The Illumina Infinium array technology (http://www.illumina.com) was used to develop a high density SNP array dedicated to the purpose of anchoring the reference B. napus scaffold sequences. The B. napus cultivars ‘Bristol’‘‘Bristol’’, ‘Yudal’, ‘Avisol’, ‘Aburamasari’ that are parents of the three segregating populations were re-sequenced using Illumina technology, with relatively deep genome coverage (~17x) (Table S6) and were used to develop SNP markers. After redundancy filtering and trimming by base quality score, sequence reads (from different sequenced lines) were aligned (BWA_version 0.5.9) (SAMTOOLS Version 0.1.17) to the assembled reference genome sequence of ‘Darmor-bzh’ and analyzed to identify polymorphisms (table S7). The subsequent selection of a set of SNPs took into account different criteria:
(i) The Infinium technology itself, where the selected SNPs should be flanked by at least 50 bp of conserved sequence on both sides.
(ii) The choice of SNP, which ensured one bead per SNP in order to maximize the number of SNP loci that could be arrayed (with a limit of 20,000 beads).
(iii) The recent allotetraploid nature of the B. napus genome, where we targeted SNPs detected in ‘unique’ non-duplicated sequences.
(iv) SNPs that were polymorphic between the parents and could be mapped in more than one segregating population were favored.
A total of 54,608 SNPs were obtained through this pipeline (Fig. S4, black numbers). The final selection optimized the distribution of SNPs on the scaffold sequences with the objective of anchoring the majority of the 20,702 constructed scaffolds. This resulted in the design of a 20K Infinium genotyping chip corresponding to 17,607 different SNPs, which are distributed over the three segregating populations (Fig. S4, numbers in green). The list of the SNPs, polymorphic and mapped markers and their flanking sequence context is available in Table S7. The SNPs theoretically anchor the 3,914 biggest scaffolds out of the 20,702 of the reference B. napus genome, representing 88% of the genome assembly length, with nearly equivalent representation of the A and C subgenomes (Table S8). Genotyping with the SeqPolyNap 20K Infinium BeadChip DNA from individuals of the three populations as well as parental cultivars was hybridized to the SeqPolyNap20K Infinium Illumina beads array using the Infinium HD Assay Ultra Protocol (http://www.illumina.com/). All DNA samples were checked for quality and concentration by
9

fluorometric measurement with Quant-iT™ PicoGreen®(Invitrogen); samples were normalized at 50 ng/µl in 96-well plates. Data were analysed using the Genotyping Module v1.9.4 of Illumina’s Genome Studio® software 2011.1 (http://support.illumina.com/array/array_software/genomestudio.ilmn). After genotyping and automatic clustering, SNP allele calls were manually inspected and edited to generate a Cluster File. It is expected that the parental alleles of each SNP (designated here as a and b) will segregate in a 1:1 (aa:bb) ratio in the two doubled haploid populations (DY and AA) and in a 1:2:1 (aa:ab:bb) ratio in the DB F2 population. Of the initial 17,607 SNPs designed, 15,932 (90%) were encoded by Illumina on the final array. From these, 13,267 SNPs (representing 83% of the final BeadChip or 75% of the original SNP design) could be used for genotyping (Fig. S4, red numbers). Development of Restriction site Associated DNA (RAD) genetic markers and genotyping of the ‘Darmor-bzh’ x ‘Yudal’ (DY) population Restriction site Associated DNA (RAD) genetic markers (38) were also developed and used for genotyping the same DY population in order to increase the density of markers and the potential of anchoring the maximum number of assembled scaffolds. One µg DNA from each of 122 DH lines was used for RAD library construction using the method described in Baird et al. (38) for EcoRI digested DNA, together with modifications to enable pair-end Illumina sequencing (https://www.wiki.ed.ac.uk/display/RADSequencing/Home). EcoRI was selected based upon the estimated number of cleavage sites within a genome of this size, the depth of Illumina sequencing required to provide good coverage of these sites, and its successful use for RAD analysis in a B. oleracea DH population (11). Sixteen RAD libraries, each carrying a unique 6 bp index and each representing an individual DH, were pooled and sequenced together using established 100 bp pair-end methodologies (v3 chemistry) on an Illumina HiSeq 2000 (http://www.illumina.com). Following sequencing and Illumina data processing (Casava 1.8) to identify valid read-pairs, the data for each lane was partitioned using FASTX-ToolKit (http://hannonlab.cshl.edu/fastx_toolkit/) to identify reads associated with individual DH lines. Read pairs for each line were then mapped against the ‘Darmor-bzh’ genome assembly using Bowtie2 (39) to identify paired reads that aligned with high stringency to predicted EcoRI sites within the assembly. SAMtools (40) was used to identify ‘Yudal’ derived SNPs at individual RAD tag sites in each DH line. A filtered set of 31,331 SNPs and 2,996 InDels (min. 2 reads, 0.25 <ALT frequency >0.75, max 75 % missing data) were identified for linkage analysis. No wholesale imputation of missing data was carried out but some data was inferred by examining the allele calls flanking the missing data for a given line within a scaffold. If flanking calls were identical, we assumed that no recombination had occurred in that region. In order to utilize this data set for effective linkage analysis a round of data compression was undertaken using Perl scripts to collapse identical segregation patterns for polymorphic RAD tags that were physically adjacent on assembled scaffolds. This process yielded a total of 6,447 unique segregation patterns across 3,221 genome scaffolds that collectively comprise 711 Mb (84%) of the genome assembly. This set of recombination events / ‘bins’ in the population was then combined with existing SSR data for linkage analysis using MSTmap (41). This analysis revealed 19 major large linkage groups and 35 smaller linkage groups that upon further manual interrogation allowed the designation of 2,676 anchored scaffolds and contigs to discrete linkage groups. Construction of genetic maps Genetic maps were constructed using CarthaGene 1.2.2 software (42). First, the “annealing” command was used to integrate the 20K derived SNPs with the previously developed “BS”
10

SNPs, and second, the 825 SSR, PCR-based, ACGM and PFM markers were added to the genetic map using “buildfw” command. The DY map was used as a reference and was subsequently integrated with the DB map. For this, we projected the DB map onto the DY reference map using BioMercator V4.2 program (43). Scaffold anchoring and constitution of pseudomolecules A final set of 37,199 markers mapping into 16,319 genetic bins were used to anchor 3,849 scaffolds by allele sequence matching (Tables S9, S10). When two markers or more were available for one scaffold, their order was used to orient the scaffolds. Otherwise, synteny with parental genomes (B. rapa Chiifu and B. oleracea TO1000) was used, when available, to infer the most likely orientation. The pseudomolecules were constructed from the goldenpath (AGP file) and the fasta file of the scaffolds using an in-house perl script. Annotation of transposable elements (TEs) To annotate TEs, we first identified TEs in B. napus genome assembly by a combined strategy of structural and similarity-based approaches followed by manual curation, based on criteria defined in Wicker et al. (2007) (44). We then merged this B. napus TE database with the database of TEs that had been previously constructed, using a similar procedure, from analysis of the B. rapa and B. oleracea parental genomes (9, 10, 45), and annotated the genome assembly by sequence similarity against the merged TE database. TEs have been classified into two classes (class I or retrotransposons and class II or DNA transposons) by their transposition intermediate, each of which could be classified into subclasses, superfamilies and families (44). In the present study, we first identified intact TE exemplars from the B. napus genome sequence using a combination of approaches. This involved analysis of the assembled genome and de novo identification of ‘complete’ TE sequences based on their structural properties. We complemented the de novo identified TE sequences with those that could be identified by TBLASTN of TE sequences from repbase (http://www.girinst.org/repbase/, (46), TREP (http://wheat.pw.usda.gov/ITMI/Repeats/index.shtml) (47) and the TIGR plant repeat database, version 2.0.0, from which we used only the 775 Brassicaceae-related sequences (http://plantrepeats.plantbiology.msu.edu/), to the whole B. napus assembled genome. This was followed by manual inspection and validation of the TE sequences, classification into families and the selection of exemplars representing each of the families. The classification into one of the major TE families (LTR, LINE, CACTA, SINE, Mutator, Tc1-Mariner, Pong, hAT, PIF/Harbinger, Helitron) was done according to the criteria recommended previously (44) where elements of more than 80 bp sharing more than 80% sequence identity over more than 80% of their length were considered as belonging to the same family. Briefly, LTR (long terminal repeat) retrotransposons (LTR-RTs) were initially identified by LTRFinder (48); (http://tlife.fudan.edu.cn/ltr_finder/), and then manually annotated and checked based on structural characteristics and classified based on sequence homology (44). All the LTR-RTs with clear boundaries and insertion sites were classified into superfamilies (Copia-like, Gypsy-like and Unclassified) and families, relying on the internal protein sequences, 5’ and 3’ LTRs, primer-binding site (PBS) and polypurine tract (PPT). These refined complete elements were then used to identify other missed intact elements and Solo LTRs (49). The 5’ LTR sequences (and solo LTRs) were pairwise compared, and a preset threshold was applied to classify the LTR-RTs into families as described (44). This resulted in 136 Copia families (178 elements) and 78 Gypsy families (179 elements).
11

Non-LTR retrotransposons (LINE and SINE) and DNA transposons (Tc1-Mariner, hAT, Mutator, Pong, PIF-Harbinger, CACTA and MITE) were identified following the strategy previously described (50), using conserved protein domains as queries to TBLASTN the whole assembled genome. The terminal inverted repeats (TIR, where they existed) and target site duplication (TSD, where they existed) were identified by searching within the upstream and downstream regions of the conserved coding domain. Those elements with consensus TIR but highly divergent flanking sequences were considered as DNA transposons. Helitron elements were identified by the HelSearch 1.0 program (51) and manually inspected. As a whole, this combination of structure-based TE detection and manual curation with comparisons to reference sequences resulted in the identification of 667 different TE families, including 531 retrotransposons families (1,076 elements) and 136 DNA transposon families (545 elements) (Table S11). We merged our B. napus TE database with a second database of TEs that had been previously constructed from analysis of B. rapa and B. oleracea parental genomes, that used a similar procedure (10, 45). The merged TE database was used for comparative repeatmasking ((52), RepeatMasker: http://www.repeatmasker.org) of all four Brassica genomes. The merging of both TE databases allowed an exhaustive annotation of all three species, limiting any bias or over- and under-representation problems that would result from using only TEs from B. napus or its parental genomes. Gene Annotation Genes were annotated iteratively using a variety of homology-based and de novo prediction algorithms. Initial gene models were curated, and refined models were used to train ab initio prediction programs. Protein mapping The Arabidopsis thaliana (TAIR 10, 2011/01/03 release), B. rapa (9), B. oleracea (10) and Oryza sativa (plantGDB, release 186) proteomes were used to detect conserved proteins in the B. napus genome. As Genewise (53) is time greedy, the proteomes were first aligned with the B. napus genome assembly using BLAT (31). Subsequently, we extracted genomic regions in which no protein hit had been found by BLAT and realigned proteins with more permissive parameters. Each significant match was then refined using Genewise in order to identify exon/intron boundaries. We obtained a correlation coefficient of 0.974 (Pearson’s Rho), which confirms that the gene models are of good quality Geneid and SNAP Geneid (54) and SNAP (55) ab inito gene prediction software were trained using A. thaliana and run to predict gene models in B. napus. Brassica napus cDNAs and Brassica Unigene A collection of 643,937 B. napus cDNAs sequences were available in EMBL (version 15/02/2011). Roche 454 cDNA reads were assembled using Newbler, generating 41,165 contigs. A Brassica unigene set was downloaded from http://www.brassica.info/resource/transcriptomics/BrasEX1s.unigene.public.fasta. All cDNAs and Unigenes were first aligned with BLAT to the assembly and only the best matches (with % identity > 90%) for each cDNA were selected. Then each match was extended
12

by 1 kb at each end, and realigned with the cDNA using Est2genome software. About 95.6% of B. napus cDNAs were mapped, with an average percent identity of 98.6%. RNA-Seq and Gmorse RNA-Seq reads (single-end, 101 bp) were obtained by sequencing cDNA with the Illumina technology from major tissue and developmental stages for ‘Darmor-bzh’ (Table S15). The usable reads (after removing duplicates and low complexity reads) were mapped to the B. napus genome using SOAP2 (56) with default parameters. Using the SOAP2 mapped and unmapped reads, we launched the Gmorse software (57). We obtained 930,181 transcript models with a plausible coding sequence (CDS greater than 50 amino acids), clustered in 162,177 loci. Integration of resources using GAZE All resources described here were used to automatically build B. napus gene models using GAZE (58). Individual predictions from each of the programs (Geneid, SNAP, Genewise, Est2genome, Gmorse) were broken down into segments (coding, intron, intergenic) and signals (start codon, stop codon, splice acceptor, splice donor, transcript start, transcript stop). Exons predicted by ab initio software, Genewise, Est2genome and Gmorse, were used as coding segments. Introns predicted by Genewise, Est2genome and Gmorse were used as intron segments. Intergenic segments were created from the span of each mRNA, with a negative score (coercing GAZE not to split genes). Predicted repeats were used as introns and intergenic segments, to avoid prediction of genes encoding proteins in such regions. In addition, transcript stop signals were extracted from the ends of mRNAs (polyA tail positions). Each segment extracted from a software output that predicts exon boundaries (like Genewise, Est2genome or ab initio predictors) was used by GAZE, only if GAZE chose the same boundaries. Each segment or signal from a given program was given a value reflecting our confidence in the data, and these values were used as scores for the arcs of the GAZE automation. All signals were given a fixed score, but segment scores were context sensitive: coding segment scores were linked to the percentage identity (%ID) of the alignment; intronic segment scores were linked to the %ID of the flanking exons. A weight was assigned to each resource to further reflect its reliability and accuracy in predicting gene models. This weight acts as a multiplier for the score of each information source, before processing by GAZE. Finally, gene predictions created by GAZE were filtered according to their scores and lengths. When applied to the entire assembled sequence, GAZE predicted 101,040 gene models. Among those, 91,167 are highly confident predictions, confirmed by matches with the B. rapa and/or B. oleracea proteomes. The remaining models were tagged as less confident gene models. Overall characteristics of predicted 101,040 gene models are detailed in Table S16. InterProScan (59) was run on the gene models to provide a list of INTERPRO domains and GO terms for each B. napus gene. We generated functional annotations for lost and homeologously exchanged genes, by combining the GO terms provided by InterProScan with the functional annotation of A. thaliana and B. oleracea TO1000 in order to predict the most probable function of the genes. The functional annotations of specific gene families were also curated manually (oil biosynthesis genes, glucosinolate genes, R genes). Analysis of alternative splicing To identify alternative splicing events, Illumina reads (Table S15) were trimmed and mapped with GSNAP (60). The unmapped reads were removed before a custom Python script was used to assign reads to the predicted genes. Reads were called as exon, exon-exon (junction or skipping), intron retention, alternative donor, alternative acceptor, or alternative position. To be
13

counted as intron retention, at least 8 bp of the read had to be within an intron. For alternative donors and acceptors, the read had to span the intron with different junction boundaries. Exon skipping events had to join two non-contiguous exons. Ten reads were required to accept an intron retention event whereas two reads were required to assess all other event types. Alternative events were not accepted without read-support for the predicted constitutive form at that junction. To access our criteria for calling an intron retention event, we performed a coverage analysis to compare with coverage-based methods, including Gan et al. (61) with 75% and Marquez et al. (62) with 100%. All data were combined using the SAMtools merge command, then depth at each base pair was attained by calling SAMtools depth. The resulting coverage was calculated for the introns from the GFF file using a custom Python script. These statistics were compared with the 56,372 intron retention events called by our criteria. Additionally, intron coverage was plotted against intron length (Fig. S11A), revealing a bias, with introns up to about 75 bp in length requiring only a few reads allowing for complete intron coverage, whereas introns larger than about 75 bp showed a varied distribution of coverage, with a downward trend as length increased. For homeolog comparisons, all predicted exons in the genome were internally compared against themselves using BLAST, revealing ‘homeologous junctions’ within homeolog pairs where no changes in gene structure (deletion, exon fission/fusion, etc.) had taken place. Only events at those junctions were compared and tabulated. All resulting gene and transposon predictions have been placed in appropriate databases accessible through the B. napus Genome Database (https://www.genoscope.cns.fr/sadc/projet_AST/cgi-bin/gbrowse/colza/) and GeneBank (accession number: CCCW000000000). Synteny Analyses For synteny comparisons within, and between B. napus and its diploid progenitors as well as with A. thaliana and other eudicot species, we used tools available in the online CoGe portal (http://genomevolution.org/CoGe/). To compare the diploid progenitors (B. rapa and B. oleracea) to the An and Cn subgenomes of B. napus, we first performed a synteny search. To call synteny blocks, we performed all-against-all LAST (63) and chained the LAST hits with a distance cutoff of 20 genes, also requiring at least 4 gene pairs per synteny block. The “1:1 synteny screen” from QUOTA-ALIGN (64) identifies the best scoring set of blocks, while subject to the constraints that no block should overlap another block either vertically or horizontally on the dot plot. After the 1:1 screening, a region from a diploid (Ar or Co) genome is expected to match at most one region from a B. napus subgenome (An or Cn) (Fig. S12). We then implemented an automated pipeline that searches the orthologs as well as homeologs for each of the Brassica genes. The pipeline has two components – synteny search and reciprocal best blast hit (RBH) which increased sensitivity as well as accuracy of the pipeline. Synteny search identifies the homologs that retain the same relative genomic neighborhood, sometimes called “positional orthology” (65), which was then complemented by the RBH approach (66) for regions of perturbed synteny involving ‘random’ scaffolds that failed to be incorporated into the chromosomes. The pipeline’s inputs are the gene sequences and locations for a pair of genomes. The goal is to find the direct ortholog (or homeolog) depending on the nature of the two genomes in the comparison. The computational pipeline is driven by a Python script: https://github.com/tanghaibao/jcvi/blob/master/algorithms/catalog.py.
14
The synteny search yields gene pairs that are mostly accurate, yet misses homologs on small scaffolds as well as small translocations due to the size cutoff (for example, scaffolds with less than 4 genes will be excluded due to the minimum synteny block size set). Therefore, we also added evidence from RBH to infer extra gene pairs on small ‘random’ scaffolds where a synteny signal was lacking. In total, we performed four pairwise comparisons – An to Ar (orthologs), Cn to Co (orthologs), Ar to Co (orthologs), and An to Cn (homeologs) – collecting a set of syntenic and RBH matches as evidence to screen for orthology and homeology. To enforce transitive and reciprocal orthology relationships among the quartet (Ar:Co:An:Cn) homeologs, we used a graph theoretical approach (OMG) to remove redundant and weak mappings (67). Briefly, we started from a list of synteny and RBH matches as ‘edges’ to build a homology graph. For each gene family (defined as a connected component within the homology graph), our goal is to keep at most 1 gene from each species to ensure reciprocity by removing bad edges. Edges with low scores were removed first within each component. Inferring gene losses in the reference cultivar ‘Darmor-bzh’ A total of 27,360 full quartets Ar-Co-An-Cn were identified (Table S19) according to the Synteny Pipeline described above. All other instances of a missing gene in one of the four genomes and subgenomes represent “potential gene losses”. The fact that the three species were sequenced and annotated using different methods necessitated an exhaustive search and classification pipeline where all genes missing at the protein level are checked at the DNA sequence level in order to confirm their loss, avoiding confusion with mis-assembly and/or mis-annotation problems (Tables S19, S20). Therefore, inference of gene deletion in B. napus or its parental genomes was done through three essential steps:
(i) Search using BLASTN for DNA sequences of “missing syntenic genes” across the entire genome assembly.
(ii) Confirmation by analysis of sequence read coverage through mapping (uniquely) of ~20x raw sequence Illumina reads from ‘Darmor-bzh’ to the genome assembly of progenitor genomes concatenated together.
(iii) PCR validation of a test set. (i) Search using BLASTN for DNA sequences of “missing” syntenic genes We started with every gene annotated in the diploid ancestors (89,901 in total, combining Ar and Co), and then broke this number down into various categories, e.g. NB, B, S, NS, NF (Fig. S15). We first focused on gene sets that were located within the identified syntenic blocks between the diploids and tetraploid. For each gene within the syntenic blocks, we then asked if we could find an annotated gene ([B]). If we could not find an annotated gene, then we further validated whether the gene was indeed lost by searching the gene CDS sequence against the entire B. napus genome using BLASTN (E-value cutoff 0.01, identity cutoff 90%). We sorted the BLASTN hits according to whether they fell in syntenic location ([S]) or non-syntenic location ([NS]). We tried to distinguish cases of gene transposition from cases of true gene loss. We first identified where the two diploid genes match the same region in B. napus genome, which suggested that one of the two homeolog copies was missing in B. napus (Fig. S15). This strategy naturally controlled for the difficulty of setting the sequence similarity cutoff when calling a gene loss. We further studied cases where syntenic sequence matches were found but there were no annotations (category [S]). These cases were identified through syntenic BLASTN match, which may be a partial match since we used coding sequences (CDS) as the query. We used a more appropriate splice-aware aligner GMAP to align the diploid coding sequences in the syntenic region and checked if the aligned progenitor gene model retained a complete open reading
15

frame in the tetraploid. The genes were eventually labeled as ‘partial loss’ if the mapped gene model lacked a start or stop codon, or ‘pseudogenes’ if there were internal stop codons. Subsequently, “missing syntenic genes’” for which we found BLASTN DNA sequence matches at orthologous positions with no annotation, and where we found that a gene could be predicted if the same annotation method is used, and those that are at orthologous positions but not retained by our initial synteny search, were considered as not lost (Table S20). To be more stringent, all other “missing syntenic genes”, for which we found the BLASTN DNA sequence matches non-anchored scaffolds (random), or in non-syntenic positions, were also considered as not lost as these could not be confirmed (Supplementary Table 19). The procedure used allowed confident filtering of candidate lost genes, where one B. napus homeologous gene copy or one parental gene copy was missing at the DNA sequence level from genome assemblies (Table S20). In these cases, the other orthologs and homeologs were present in the three other genomes (Fig. S13, cases 5, 6, 7 and 8), and moreover; the best BLASTN DNA sequence match, found elsewhere in the genome, was the corresponding homeolog (if in B. napus genome) or ortholog (if in B. rapa or B. oleracea genomes) (Fig. S15). Following this stringent analysis, we found an initial set of 663 candidate lost genes (where the DNA sequence was missing) in the B. napus assembly as compared to the corresponding parental genome, including 270 cases where the An-copy was absent and 393 cases where the Cn-copy was absent (Tables S20 and S21). (ii) Confirmation by analysis of read coverage on the parental genomes We mapped (uniquely) ~17x raw Illumina reads from B. napus ‘Darmor-bzh’ to the progenitor genome assemblies concatenated together. Similarly for diploid B. rapa and B. oleracea parental species, we mapped raw Illumina reads to the B. napus genome assembly. All B. napus, B. rapa and B. oleracea missing genes (no DNA sequence found) identified in (i) were carefully checked for confirmation based on raw sequence read coverage. For the B. napus missing genes, we calculated the ratio: (average depth on An)/(average depth on An + average depth on Cn) and inferred a threshold below 0.35 to validate the loss of the An gene and above 0.65 to validate the loss of the Cn gene. For B. rapa Chiifu and B. oleracea TO1000 missing genes, the ‘horizontal’ coverage across all exons of the gene was calculated. Horizontal coverage was defined as the proportion of the exon regions of a gene covered by mapped sequence reads. A gene was considered to be confirmed deleted when the horizontal coverage was below 5%. (iii) PCR validation of a subset We selected a subset of 23 inferred deleted genes to be validated using PCR (Table S23). For the test set, we developed PCR primers that specifically and differentially amplified Ar and Co copies. Status of ‘Darmor-bzh’ deleted genes in a set of other B. napus genotypes For the genes confirmed as deleted in B. napus ‘Darmor-bzh’, we checked their deletion status in a diverse set of genotypes from B. napus, B. rapa and B. oleracea (Table S6) for which raw Illumina resequencing data, but not a genome assembly, were available. Illumina sequence reads from these different genotypes were mapped to B. rapa (Chiifu v1.2) and B. oleracea (TO1000 v1) genes which are deleted from B. napus ‘Darmor-bzh’. All mapping was performed using BWA v0.6.2 (as below), but with the number of permitted mismatches controlled by the parameter –n set to 5% of the read length rounded to the nearest integer. For each gene, the average coverage across all exons was calculated and the ratio Acov/(Acov+Ccov) was calculated as decribed above. Assessment of the deletion status of these genes in B. rapa and B. oleracea genotypes was done as described above by calculating ‘horizontal’ coverage and inferring deletion when the coverage was below 5%.
16

Analysis of Homeologous Exchanges We used assessment of read coverage to detect homeologous exchanges (HE) between An and Cn subgenomes, where regions with double read coverage were considered duplicated and regions with low or no coverage were considered deleted. For assessment of homeologous exchanges (HEs) in ‘Darmor-bzh’, we mapped Illumina paired-end reads (Table S30) to B. oleracea TO1000 and B. rapa Chiifu concatenated together. We used BWA (68) with default parameters (Version: 0.6.1-r104, seed 35, gap penality 11) to map the reads uniquely to the parental genome assembly. This ensures a B. napus read can map only once on Ar or Co genomes. For cases where significant numbers of reads map to a given segment of a parental genome, indicating its duplication, but not to the orthologous one, indicating its loss, we can infer HEs. The distribution of depth of coverage of ‘Darmor-bzh’ reads on its genome assembly, as well as on the two parental genomes, is displayed in Fig. S18. We chose a threshold of 18 to identify regions of the parental genomes that display double coverage. The average depth was calculated on 10 kb windows, adjacent windows with depth greater than the threshold and that were at most 5 windows distant were linked together. Only regions spanning more than 8 windows (80 kb) were retained. To detect HEs smaller than 80 kb and at the single gene level (or gene conversion), we relied on analysis of read coverage depth on individual gene sequences, with the same procedure as for validation of gene losses. For all 2,802 Ar, Co, An and 1,923 Ar, Co, Cn triplets. This procedure allowed us to extend one already identified segment (1DAn1+/1DCn1- : Table S31) and to identify other An to Cn and An to Cn converted genes whose sequences were collapsed together (detailed in section 6.2). Partially converted genes whose sequences were resolved in the assembly were detected by a procedure based on inferring conversions at the single nucleotide level using different strategies: two at the whole genome level, using the A or C progenitors as reference genomes and mapping onto them either (i) the assembled B. napus genome, partitioned into chromosomal segments (each 240 bp) (Table S35), or (ii) the non-assembled Illumina raw reads; and the third (iii) at the gene level, by aligning synteny-supported homologous gene quartets from the An, Cn, Ar and Co genomes (Table S36). We used genome assemblies of B. rapa (Ar genome Chiifu), B. oleracea (Co genome, TO1000), and B. napus (AnCn genome) to infer possible gene conversions. Two different approaches were adopted. The first approach at the whole genome level used Ar and Co as reference genomes and involved bidirectional searches using MegaBlast with partitioned An and Cn genomic DNA segments of 240 bp as queries against the other genomes. The best hit regions with >97% identity and match length >190 bps were recorded. With the existence of many duplicated genes due to rounds of polyploidy, and single-gene duplications, to ensure orthology, only bidirectional best hit regions between the reference genome and all other genomes were used in further inferences. By analyzing the Megablast output files between (sub)genomes, we obtained single nucleotide variants (SNVs) between possibly orthologous regions, comparing these among all genomes to find likely converted sites between the two B. napus subgenomes (An and Cn). The second approach involved studying homologous gene quartets which were identified as described in ‘synteny analyses’ above. In colinear regions within and between genomes, colinear genes were determined by running MCSCAN (69), and by checking chromosomal similarity, orthologous genes were separated from paralogous ones arising from earlier rounds of polyploidy. The orthologous chromosomes are much more similar than paralogous ones in both DNA identity and chromosomal structure. A homologous quartet includes orthologous genes in each of the Ar, Co, An and Cn subgenomes. In total, we analyzed 23,452 quartets. The genes forming each quartet were aligned and compared to find SNVs.
17

To determine the degree of conversion between An/Cn, we adopted the formula AntoCn + CntoAn)/(AntoCn + CntoAn + (Ar/An mutation)/2 + (Co/Cn mutation)/2 + Other mutation/2 and calculated an An/Cn conversion rate of 94.4% (Table S36). Numbers of "Ar/An" or "Co/Cn" mutations each contained half the possible mutations in Ar or Co and were removed from the above calculation of An/Cn conversion rate. Other mutations are mutations that may have occurred in Ar/Co/An/Cn, and similarly half of the mutations may have occurred in An/Cn. Co-localization of Homeologous Exchanges and gene losses We tested whether gene losses tended to be co-localized with homeologous exchanges. Each parental genome (B. rapa and B. oleracea) was divided into bins of 150 genes each and we compared the occurrence of gene losses in those bins with their distances to HEs. Deletion of segments of adjacent genes were counted only once. Bins of different gene sizes produced similar results. Dating of Divergence Time between Genomes and Subgenomes With genome-scale characterization of the divergence of orthologous genes, we managed to date the divergence between Ar/An and Co/Cn genomes, and between Brassica and Arabidopsis. We removed from the analysis genes from large gene families (copy number >= 10), tandem clusters, and potentially converted genes, since recombination between them and/or reduced selective pressure may affect their evolution (70). We calculated synonymous substitution rates by using the Nei-Gojobori approach (71) implemented in PAML (72). Molecular divergence between low-copy number syntenic genes of A. thaliana, B. rapa, B. oleracea, and B. napus An and Cn subgenomes was measured using the calculated Ks (Fig. S14), and a previously reported calibration of ~12-17 MY divergence between A. thaliana and Brassica (9, 10) (73). All statistical analysis were performed using R environment (74). Divergence time was that estimated from using the BEAST method. Analysis of Homeologous Gene Expression We used the Illumina paired-end mRNA-Seq reads to measure transcript abundance in leaf and root tissue of ‘Darmor-bzh’, using three biological replicates with an average of ~206 million paired-end reads (counting both ends) per replicate (Table S40). Mapping and counting of mRNA sequence reads The measurement and discrimination of expression was rendered possible through unique mapping of mRNA-Seq reads based on sequence differences between An and Cn homeologous gene pairs. mRNA-Seq reads were mapped using BWA (68) with default parameters (Version: 0.6.1-r104, seed 35, gap penalty 11). Mapped RNA-Seq reads were then filtered using SAMtools (Version: 0.1.12a) and only the best unique matches were considered. mRNA-Seq reads were count-filtered as follows (Table S40): ## mapping best unique BWA match -> one single best hit ## mapping read1 and read2 on the same gene with coherent orientations -> count 1 ## mapping of read1 and read2 on adjacent genes -> count 1 for each gene ## mapping of one single end on a gene -> count 1 Other cases such as when both ends map on non-adjacent genes were not considered. Data and read count normalization Since we aimed to compare expression levels between each homeologous gene pair, normalization was needed both in terms of the library read depth and the homeolog length. A straightforward choice would be the use of RPKM (Reads Per Kilobase per Million mapped reads (75)). Nevertheless this normalization technique has many drawbacks, as supported by
18

the biostatistics literature: by coupling changes in expression levels among all genes, expression changes in highly expressed genes tend to skew the counts of lowly expressed genes (76). Moreover read counts normalized through RPKM are not appropriate for count-based methods for differential expression analysis (77). The resulting values do not have the statistical features of count data, which are assumed to have a Poisson-like distribution, thus using RPKM normalization with a count-based differential analysis method can lead to erroneous results (78) and reduce the power of the test (79). Thus, in order to keep a read count table which remains adapted to count-based methods, we performed the following two-step normalization: i) We first normalized each biological replicate by a lane specific factor reflecting its library size. This factor was computed with the method proposed in the DESeq package (80). The underlying idea of this method is that non-DE transcripts should have similar read counts across samples, leading to a ratio of 1. More details can be found in (80). ii) The read counts associated with a pair of homeologs were normalized according to a size factor related to the interrogated length of the homeologs, that is the length that is covered by RNA-Seq reads (the parts of the genes with no polymorphism between A and C have no uniquely mapped RNA-Seq reads and are not interrogated). For instance, when comparing two homeologs An and Cn with respective sizes of 100 and 150, the counts associated with homeolog An are scaled by a factor 1.5. Note that, most of the time, the sizes of the two homeologs are close to each other (more than 50% of the size factors are less than 1.1, meaning homeologs have very comparable lengths). Statistical analysis After the normalization step, a principal component analysis (PCA) was applied to quickly summarize the data and look for spurious technical effects. Fig. S25 shows the projection of the 12 samples on the first two PC-axes in the sample space, showing satisfactory reproducibility between biological replicates, with those two axes explaining almost 75% of the variance. The normalized read count table was then analyzed using R (74) to assess differences in expression between each of 30,949 pairs of homeologs using the negative binomial model of DESeq and its capability for multi-factor analyses relying on the generalized linear model (GLM) formulation. Consider for instance the pair of homeologs related to a given gene and denoted by Nij the count number of parent j with j ∈ {An, Cn} in experiment i with i ∈ {root1; root2; root3; leaf1; leaf2; leaf3}. We assumed that Nij ~ NB(µij ; δij) and used the following log linear model to describe the mean count, given in a schematic form: log µij = µ + tissuei + parentj + tissuei*parentj ; Where tissuei = roots if i ∈ {root1; root2; root3} and tissuei = leaves if i ∈ {leaf1; leaf2; leaf3}. This GLM is the NB-analog of the classical two-way ANOVA with interactions in the usual Gaussian case. Concerning the inference of the variance term δij, we used the DESeq capabilities to model and estimate the over-dispersion of the count data: more technically, we used the Cox-Reid adjusted profile likelihood method to estimate the empirical dispersion of each gene. Quoting the DEseq documentation “this method is the more reliable when using multiple-factor design and is also known to reduce bias in variance estimation”. Then, a parametric fit with Gamma-family GLM was used to share the information between transcripts and thus provide a final robust estimate of the dispersion. Finally, we assessed for the statistical significance of the effects of each term by means of χ2
tests (analog of the ANOVA tests in the classical Gaussian case). We started by testing for significance of the interaction term, then for effects of the subgenome and the tissue. The associated p-values were adjusted with the Benjamini and Hochberg correction and effects were declared significant when those p-values were less than 1%.
19

Genome-wide cytosine methylation analysis Genome-wide bisulfite sequencing was performed using an in-house protocol compatible with Illumina’s TruSeq chemistry. Three µg of genomic DNA from two replicates of leaf and root tissue of B. napus ‘Darmor-bzh’ were fragmented using a Covaris E210 instrument to obtain fragments of at least 250 bp and purified with Agencourt AMPure XP beads (Beckman Coulter, Pasadena, CA) to obtain an insert size greater than 200 bp to avoid potential overlapping sequencing reads. The quality and quantity of the purification was controlled on a BioAnalyzer using High Sensitivity DNA Chips (Agilent Technologies, Santa Clara, CA). One µg of fragmented DNA was ligated to adapters compatible with the Illumina Chemistry using an in-house developed protocol including 1) end repair, 2) 3’ adenylation and 3) ligation of adaptors, followed by a purification step using Agencourt AMPure XP beads. Ligated samples were then bisulfite converted using the EZ DNA Methylation Kit (Zymo Research, Irvine, CA) following the manufacturer’s instructions. After conversion, the DNA was amplified by PCR (12 cycles) using HiFi HotStart Uracil polymerase (KAPA Biosytems, Wilmington, DL). Samples were purified using a QIAquick PCR Purification Kit (Qiagen Venlo, Netherlands) and quality controlled on a BioAnalyzer using DNA1000 Chips. The libraries were size selected on an agarose gel (300 bp to 400 bp) and purified using a QIAquick Gel Extraction kit (Qiagen). A final control of quality and quantity of libraries was performed on a BioAnalyzer using DNA1000 Chips before 101 bp paired-end sequencing on a HiSeq2000 (Illumina, San Diego, CA). One library preparation was performed for each of the four samples (two for roots and two for leaves) and each library was sequenced on a single lane. The four data sets were analyzed following the following steps: FastQC v0.10.1 was executed on all read files in order to assess basic quality control metrics (base quality distribution, GC content, relative abundance of each base at each read position). Each paired-end sequence file was trimmed using an in-house Perl script that set a minimum quality threshold of Q30 and retained only reads with more than 90% of bases left after trimming. Three FastQ files resulted from this trimming: two files for reads that remained paired after trimming and one file for unpaired reads. These two new sets of sequences (one paired-end and one single end) were aligned using Bismark v0.9.0 (81) with the Bowtie2 option turned on and with one mismatch allowed in a seed alignment. The 2 SAM files resulting from this alignment were then merged and coordinate-sorted to create a single SAM file, which was then fed into methylKit v0.5.7 (82). Methylation calls were generated using methylKit and bases with too low (< 10x) or too high coverage (bases that had more than the 99.9th percentile of coverage in each sample) were discarded. The coverage of the four data sets was subsequently normalized using the median as a scaling factor across the four data sets. Differentially methylated regions (DMRs) were calculated conservatively using a minimum q-value of 0.01 and methylation difference of 25%. Targeted Gene Family Analyses We examined the evolution of B. napus lipid biosynthesis genes, glucosinolate (GSL) biosynthesis and breakdown genes, and nucleotide binding site leucine-rich repeat (NBS-LRR) resistance genes, compared with the progenitor genomes and A. thaliana. We further investigated the influence of HE on homologous loci of FLOWERING LOCUS C (FLC), a key adaptation gene controlling vernalization and photoperiod responses (83). For lipid biosynthesis genes, we used data from an extensive analysis of A. thaliana that identified more than 120 different enzymatic reactions and over 600 genes involved in acyl lipid metabolism (84). For glucosinolates, we used 101 and 105 GSL biosynthetic genes identified in B. rapa and B. oleracea, respectively (10) as well as 22 GSL breakdown genes. We used the coding sequence of A. thaliana FLC (At5g10140) to identify FLC orthologues in B. rapa and B. oleracea along with their closest corresponding homologues in B. napus.
20

For all the types of gene families described above, homologs were identified using tBLASTn and BLASTp (maximum E- value 1E-5) (85) performed using the original or consensus sequences against the three Brassica species studied here, together with using the orthology and homeology results obtained from the the general synteny approach (Table S19). In addition, for NBS-LRR resistance genes, analysis was performed using the MAST/MEME (Motif Alignment Search Tool/Multiple Em for Motif Elicitation) suite of software to identify predicted genes that contain motif homology to known disease resistance genes (86). NBS-LRR “positive” and non NBS-LRR “negative” sequence training sets (consensus of 20 amino acid motifs derived from MEME analysis) (87) were used as queries in a MAST search against the predicted genes of B. napus genome. Predicted genes were considered to be candidate CC (CNL) or TIR (TNL) NBS-LRRs if the reported MAST E values were less than E-24. To further validate the results from the MAST output, consensus sequences of CNL and TNL from plants (88, 89) were attained from a previous study by Ameline-Torregrosa et al. (90). Candidate NBS-LRR proteins were provisionally assigned to either the CNL or TNL groups on the basis of similarity. Only annotated genes were investigated and therefore pseudogenes and truncated NBS-LRR genes were not studied.
21

Supplementary Text
Polyploidy is a recurring evolutionary process of central importance to eukaryotic diversification, speciation, survival and adaptation, with plants providing models of singular importance (91-94). Genome sequences of several relatively ancient or recent polyploids have been recently reported (12, 95-98). The most recent report of an allopolyploid genome is the draft sequence of tobacco; however, no comparison with diploid progenitors was provided (96); and it was also estimated to be ~10 older than B. napus. Deciphering the genome of B. napus has provided unique insights into the earliest stages of post-polyploidy evolution and its relationship with domestication. Subtle interactions between constituent subgenomes are shown here to have taken place soon after allopolyploid formation. 1. Strategy for sequencing the complex allopolyploid B. napus genome The highly duplicated genomes of B. rapa and B. oleracea were successfully sequenced through whole genome sequencing approaches (9, 10), demonstrating that it is possible to resolve homologous sequences that are duplicated by recurrent but relatively-ancient polyploidy, including those triplicated as a result of whole genome triplication or mesoploidy. Nevertheless, the sequencing of the B. napus genome was expected to present difficulties in resolving and differentiating the An and Cn homeologous subgenomes, as these have been reunited much more recently. In order to design an adequate strategy for sequencing and resolving the combined An and Cn subgenomes of B. napus, we performed sequence analysis of publicly-available genomic regions of the A and C genomes from different Brassica species. Earlier studies, using comparative sequencing of PCR products from orthologous genes, had estimated that the Brassica A and C genomes, as represented in B. rapa and B. oleracea, diverged ca. 3.7 Mya (99) with 3-4% average SNP polymorphism. A more recent comparative study of orthologous and/or homeologous A and C genomic regions, represented by whole BAC clone sequences (100), revealed extensive sequence-level divergence between homeologous genome segments of B. napus as well as between corresponding orthologous segments of B. napus and its progenitor species B. rapa and B. oleracea. As exemplified for one previously studied region (100) that we reanalyzed (Fig. S1), more than 50% of the syntenic genomic regions, shared by the A and C genomes, exhibit differences in sequences caused by different transposon-related and/or non-coding sequences. Moreover, analysis of SNP and Indel polymorphism across the remaining conserved regions confirmed the level of 3-5% SNPs between the A and C orthologous genes or non-coding conserved sequences (NCS) (Fig. S1). These differences between the A and C genomes were confirmed a posteriori across the whole genome, when the parental Ar genome of B. rapa (9) and later that of the Co genome of B. oleracea (10) became available. Based on these arguments and analyses, the strategy that was adopted for sequencing the combined An and Cn subgenomes of B. napus consisted of a combination of Sanger BAC end-sequencing (BES), GS FLX Titanium 454 sequencing that included long reads of 700 bases, as well as the Illumina SBS technology. Analysis of the distribution of coverage by individual 454 reads from 21x genome coverage of B. napus (according to an estimated genome size of 1,130 Mb) showed a peak at ~21x (Fig. S2), confirming the resolution of the An and Cn homeologous subgenomes. A final assembly of 849.7 Mb was obtained with Newbler (Roche) and SOAP (8) was used for. correction and gap filling using 79 Gb of Illumina HiSeq sequence with 89% non-gapped sequence (Tables S1 - S3).
22

To check the robustness of the sequencing and the assembly strategy in differentiating the An and Cn subgenomes of B. napus, we mapped the constructed contig and scaffold sequences with random reads generated from the genomes of the parental species. For this a subset of reads (~200 bp), representing ~1.5x genome coverage was selected from 5x 454 sequencing of B. rapa Chiifu and B. oleracea TO1000. Analysis of parental genome read mapping showed that out of 283,693 initial contigs, 190,892 (67%) were identified (mapped) with at least one Ar or one Co parental read. Out of these, 155,742 (or 55% of initial contig number) were unambiguously assigned as belonging to An or Cn genomes with 80,593 and 85,270 contigs, respectively (Fig. S3, Tables S4 and S5). From the 20,702 scaffolds, 20,382 (98%) contained at least one contig that was assigned to the A or C genome and out of these 18,278 (88%) were assigned as either belonging to the An (8,294 scaffolds, representing 36.8% of the cumulative size) or Cn (9,984 scaffolds, representing 60% of the cumulative size) subgenomes. The remaining 2,424 scaffolds mapped to both An and Cn genomes (Table S5). The majority of these were later assigned after gene annotation by genetic mapping or based on orthology comparison with progenitor genomes, leaving only 319 unidentified scaffolds. These mostly correspond to scaffolds with predominantly unassigned nucleotides, not mapped by Ar nor Co reads with our stringent criteria: this frequently occurs in repetitive regions/transposable elements. However, we did identify cases of chimerism: for example during the anchoring procedure, we discovered 25 chimeric scaffolds that were subsequently split. At a smaller scale, apparent “chimerism” is frequent because of gene conversion, but it usually does not impede the contig assignment to the An or Cn subgenomes, and indeed reflects the actual B napus sequence. These comparisons and analysis thus validated the sequencing strategy and contributed to the resolution and assignment of the majority of the scaffolds to the An and Cn subgenomes of B. napus. 2. Genetic maps and pseudomolecules We constructed and integrated genetic maps with the genotyping data from all available and developed markers. 2.1. Genetic map from the ‘Darmor-bzh’ x ‘Yudal’ (DY) population Of the 7,785 polymorphic SNPs obtained using the Infinium 20K BeadChip (Illumina), 7,706 (99%) were mapped in the segregating DY population of 356 individuals, defining 2,068 different genetic bins. A SNP genetic map was constructed using CarthaGene 1.2.2 software (42). This provided a total of 11,025 markers, defining 3,613 different genetic bins. From an initial examination of the genotyping data and scaffold anchoring, 5,441 (corresponding to 25,416 RAD loci) of the 6,447 unique segregation RAD patterns, could be successfully integrated on the DY genetic map using the “buildfw” command (84.4%). The final DY dense genetic map integrating all types of markers covered 2,807 cM and consisted of 36,441 different loci, mapped into 5,738 genetic bins, that are distributed nearly equally on the An (16,844) and Cn (19,597) chromosomes (Fig. S5). 2.2. Genetic map from ‘Darmor’ x ‘Bristol’‘‘Bristol’’ (DB) population Out of the 4,811 polymorphic SNPs obtained using the Infinium 20K BeadChip (Illumina) array, 4,750 (98.7%) were successfully mapped using the “annealing” command, defining 2,350 different genetic bins, which are distributed across the genome as shown in Fig. S6. A very low number of SNPs were mapped on chromosomes An2 and An10, which were each split into two
23

linkage groups, highlighting the low polymorphism for these chromosomes between the two cultivars (Fig. S6). The DB map covered 1,959 cM. 2.3. Genetic map from ‘Avisol’ x ‘Aburamasari’ (AA) population Out of the 7,409 polymorphic SNPs obtained using the Infinium 20K BeadChip (Illumina) array, 7,407 (99.9%) were successfully genotyped on 190 segregating F2-derived recombinant inbred lines. These were integrated with the 3,414 SNPs previously genotyped on 96 highly-recombinant DH individuals, and a genetic map of 10,821 SNPs was constructed, covering 4,048 cM (as a result of the mating scheme used to produce the population), and defining 2,692 different genetic bins. The distribution of SNPs between the A and C genomes and the individual chromosomes are presented in Fig. S7. 2.4. Consensus maps integrating all three population maps The final ‘Darmor-bzh’ x ‘Yudal’ (DY) map (36,441 loci mapped into 5,738 genetic bins) was used as a reference and was subsequently integrated with the DB map. For this, we projected the DB map onto the DY reference map using BioMercator V4.2 program (43). This resulted in a consensus map, named DYDB, that integrated 39,093 markers, mapped into 6,613 genetic bins and covered 2,842 cM (Fig. S8). We then projected the Aviso x ‘Aburamasari’ (AA) map onto the DYDB map, resulting in the consensus DYDBAA map that integrated 41,001 markers mapped into 7,287 genetic bins and covered 2,881 cM (Fig. S8). Comparison of marker distribution between the DY reference map and the consensus DYDBAA map, sorted by genomes, is presented in Fig. S8. 2.5. Scaffold anchoring and constitution of pseudomolecules For the purpose of anchoring we generally relied on the consensus DYDBAA map. In case of non-concordance, such as small inversions, only the DY and DB maps were used for validating scaffold anchoring and orientation, since they were obtained from populations derived from the reference genotype Darmor. A final set of 37,199 markers mapped into 16,319 genetic bins were used to anchor 3,849 scaffolds by allele sequence matching (Tables S9, S10). Among the 190 larger anchored scaffolds (>1 Mb), 186 (97.9%) were oriented. The anchored scaffolds contain 100,507 (99.5%) of the 101,040 total annotated genes of B. napus. The 3,849 anchored scaffolds were joined to generate 19 pseudochromosomes that were named according to the linkage group nomenclature: “An1” to “An10” for chromosomes of the An subgenome and “Cn1” to “Cn9” for those of the Cn subgenome (termed chrA01 to chrC09 in the EBI submission). Each scaffold join was denoted with 100 N base pairs. The mapped scaffolds with unknown orientation were named “chrA01_random” to “chrC09_random” in the pseudochromosomes, where they were ordered accordingly to the genetic map. The scaffolds that were unmapped genetically but could be assigned to the An or Cn subgenomes based on the mapping of the reads or gene orthology with parental genomes were included on “chrAnn_random” and “chrCnn_random” pseudochromosomes. Finally, the scaffolds that were not mapped or assigned to “An” or “Cn” were on “chrUnn_random” pseudochromosome. 3. Transposable elements (TEs) Transposable elements (TEs) are ubiquitous to all eukaryotes (101). Although the two genomes of B. oleracea and B. rapa, representatives of diploid progenitors of B. napus, share the same ploidy level and are largely collinear, it has been shown that they differ remarkably in TE composition, dynamics, content and organization (9-11).
24

We performed a comprehensive analysis and comparison of TE representations between all four genomes in the whole assembled fraction of their genomes, raw reads representing both assembled and non-assembled genome fractions as well as in comparable syntenic blocks. Genome sequences from two B. oleracea cultivars were available and used in the present study (9, 10). 3.2.1. Estimated TE content in the assembled genomes Overall a slightly higher proportion of TEs were annotated in B. rapa and B. oleracea compared to the previous annotations based solely on the TE database from the diploid genomes without the TE sequences from B. napus identified in the present study (9, 10). These TEs make up about 40.87% (instead of previously estimated 39%) of the B. oleracea and 22.91% (instead of 21.47%) of the B. rapa assembled genomes (Table S12). Nevertheless, the relative representation of the different categories and families of TEs were similar to those previously reported (9, 10). As previously reported (9-11), we confirmed a much higher representation of both retro- and DNA- transposons in B. oleracea (23.79% and 15.17% respectively) than in B. rapa (10.33% and 11.79% respectively). We identified 594,478 TEs with a total length of 257 Mb, accounting for 34.81% of the assembled B. napus genome (Supplementary Table12). Comparison between B. rapa Ar- and B. oleracea Co- genomes (9, 10) revealed differential representation of TEs is strikingly maintained between the An and Cn assembled subgenomes of B. napus, indicating that the majority of the differences in TE composition have accumulated since the divergence of A and C genomes and prior to the recent allotetraploidy that formed B. napus (Table S12). Most of these TEs occupy a genome space in An and Cn subgenomes of B. napus that are comparable to those calculated in the parental genomes (Table S12). The fact that An and Cn subgenomes of B. napus were assembled together in this study using the same methodology indicates that the differences are not due to variation in assembly methodologies. Corroborating previous analyses, comparison of syntenic blocks indicated TEs are most likely dispersed in euchromatic regions of the C genomes when compared to the A genomes (10), suggesting that TEs are more concentrated towards heterochromatic regions in A genomes which were not well covered in the current assembly. This also indicates that only a small amount of TE proliferation has occurred in B. napus subgenomes in comparison to the respective parental genomes (Table S12). 3.2. Estimated TE content in the unassembled genome of B. napus To exclude effects of assembly coverage of the B. napus genomes (56% and 85% theoretically assembled for An and Cn subgenomes), we estimated TE content in ~3x coverage of randomly sampled short reads. The sampled reads were masked by the same combined TE dataset. The TE proportion in unassembled whole genome reads cannot be estimated independently for the An and Cn subgenomes of B. napus. While TE superfamily representation were similar, we observed that the global TE proportion is higher in the non assembled portion of the B. napus genome than that estimated from the assembled genome (~40% vs ~35% respectively) (Table S12), suggesting that a substantial fraction of the unassembled genome is composed of repetitive sequences. 3.3. TE content and dynamics within syntenic intergenic regions separating adjacent genes (with no N gaps) To further increase the accuracy and precision for comparison of TEs between the different genomes, we analyzed a subset of syntenic regions selected as having non-gapped intergenic spaces separating adjacent pairs of Cn-Co or An-Ar orthologous genes. This allowed the identification of 12,952 Cn-Co and 20,079 An-Ar non-gapped syntenic intergenic regions, respectively (Table S13). Of these 50.5% (6,536 for C and 10,133 for A genomes) do not
25

contain TEs and show a similar size distribution between the Cn and An genomes of B. napus and those of its diploid parents (Table S13, Figs. S9A and S10A).
C genome comparison Comparisons showed that 5,127 Cn-Co non-gapped syntenic regions contain TEs in both genomes, the majority of which are likely shared insertions, with nearly equal overall size and TE space in both genomes (Table S14 and Fig. S9B). This shared TE space represents 96% and 92% of total TEs annotated in non-gapped syntenic integenic regions in the Cn subgenome of B. napus and the Co genome of B. oleracea, respectively. Moreover, we counted 713 intergenic regions with uniquely identified TEs in the Co diploid genome of B. oleracea spp. capitata but not in their corresponding Cn syntenic region of B. napus. The global intergenic size in these Co diploid regions is twice (2x) that of the syntenic ones in the Cn subgenome, where the TE space (0.67 Mb) explains 65% of the size difference (Fig. S9C, Table S14). Inversely, we identified 576 regions where the Co parental regions have no TEs, whereas the B. napus Cn subgenome syntenic regions have differentially annotated TEs, totaling 0.32 Mb and representing 51% of the 1.7x (0.32 Mb) Cn size increase. (Fig. S9D, Table S14) Thus, the TE fraction that differentially proliferated since the Cn-Co genome divergence was two times higher in the Co diploid genome (0.67 Mb) than in the Cn tetraploid one (0.32 Mb) (Tables S13 and S14). A genome comparison Detailed comparisons showed that 7,042 An-Ar non-gapped syntenic regions contain TEs in both A genomes (Table S13), the majority of which likely represent shared insertions (Table S14 and Fig. S10B). This shared TE space represented 88.1% and 85.6% of total TEs annotated in these syntenic regions of the An subgenome and the Ar genome, respectively (Table S14). We counted 1,569 intergenic regions where a TE was identified in the Ar diploid genome but not in the An syntenic region of B. napus. The global intergenic size in these Ar diploid regions was 87% larger than that of the syntenic regions of the An subgenome, where differential TEs space (1.26 Mb) explains 56% of the 2.26 Mb increased size of the former over the latter (Supplementary Tables S13 and S14, Fig. S10C). This difference was partially balanced by the identification of 1,335 other non-gapped syntenic regions with TEs specifically identified in An regions of B. napus but not in the Ar diploid syntenic one, leading to 63% (1.53 Mb) increased size, with TE space (0.87 Mb) explaining 63% of the size difference (Table S13 and S14, Fig. S10D). Comparison between these two types of regions indicated that the TE fraction that differentially proliferated since the An-Ar genome divergence was 45% larger in the Ar diploid genome (1.26 Mb) than in the Cn tetraploid one (0.87 Mb) (Tables S13 and S14). The high conservation of TE space at syntenic positions between An-Ar (88.12%-85.6%) and Cn-Co (96%-92%) genomes, and the similar global proportions of contributing families (Table S14), confirmed that the majority of TE proliferation occurred before the An-Ar and Cn-Co genomes split and therefore before allotetraploidy of B. napus. The small remaining fraction of TEs uniquely detected in An or Cn genomes of B. napus as well as in Ar and Co genomes of B. rapa and B. oleracea, illustrates continuous TE insertion/deletion dynamics in all three species, although it is also possible that some TEs were detected in one genome but not the other because of the sensitivity of the database. However the balance between insertion and proliferation appeared to indicate a lower proliferation in the B. napus genomes than in its diploid parental species (Table S14).
26

4. Alternative splicing The RNA-Seq data enabled an initial genome-wide examination of alternative splicing (AS) patterns in B. napus. Events were designated as intron retention, alternative donor, alternative acceptor, alternative position, or skipped exons. The number of events of each type is listed in Table S17. Intron retention was the most frequently observed type of event (Fig. S11B), with exon skipping being the least common (3% of AS events), which is consistent with results of previous studies in other plants. The number of events of each type was relatively similar between the An and Cn genomes, although the C-genome had slightly more of each event type (Table S18). Overall, one or more AS events were found in 48% of the genes analyzed (Table S17). This is consistent with recent RNA-seq studies in rice (48% of all genes in (102)) and A. thaliana (61% of intron containing genes in (62)). Comparison of alternative splicing patterns between pairs of homeologs revealed relatively low levels of conservation of AS events between homeologs; 33-36% overall in the data set analyzed (Table S18). Intron retention events were more highly conserved (43% conserved) than other types of AS events.
5. Synteny conservation, homeology relationships and gene loss The availability of the B. napus genome sequence and of those of its progenitors provides a unique opportunity to study in fine details the evolutionary fate of duplicated genes in a recently formed neo-polyploid. 5.1 High conservation of synteny between B. napus and its diploid progenitors The result of the synteny search and 1:1 block screening (See methods) was further verified by the B. napus – diploid progenitor dot plot (Fig. S12). The B. napus An and Cn subgenomes are largely colinear with the two progenitor diploid genomes of B. rapa (Ar) and B. oleracea (Co), respectively. With the exception of a few small regions that failed to be incorporated into the pseudomolecules and several regions that appear translocated (blocks off the diagonal). Gene contents and order on B. napus chromosomes are generally very similar to those on the corresponding chromosomes of the diploid progenitors. Most of the diploid progenitor gene space (93% of the total annotated genes) were contained within orthologous synteny blocks to the tetraploid B. napus (Fig. S12). We compiled a list of 47,080 orthologous families that collectively contain a total of 156,754 genes (36,792 Ar, 41,968 Co, 36,794 An, 41,200 Cn) using the automated pipeline that we have implemented based on synteny plus RBH evidence for genes on the “random” scaffolds (Table S19). Each family has at most one gene from each of B. rapa, B. oleracea and the two sub-genomes in B. napus, named as ‘quartets’ in our presentation for convenience. Genes missing from the list may be local duplicates as they compete for the same ortholog and likely ignored by our orthology-homeology pipeline, or they may be mis-annotated genes. This curated quartet list allows us to count all possible 9 cases of orthology and homeology between Ar, Co, An and Cn (Fig. S13). A total of 27,360 full quartets Ar-Co-An-Cn were identified, while all other instances represented potential gene loss. However, we must preclude a large number of artifacts from genome assembly and annotation before calling “gene losses”, detailed below. The majority of quartets represented full retention in the four compared genomes (27,360 of 47,080 quartets). The comparison of the 39,127 genes annotated in B. rapa with the 42,320 genes annotated in the An subgenome of B. napus allowed the identification of 34,255 Ar-An syntenic orthologs (Fig. S13), indicating high conservation. Similarly, the comparison of the 46,645 genes annotated in
27

B. oleracea with the 48,847 ones annotated in the Cn subgenome of B. napus allowed identification of 38,554 Co-Cn highly conserved syntenic orthologs (Fig. S13). Synteny to A. thaliana (Table S19) confirmed the triplicated structure or mesoploidy of the diploid Brassica genomes (9, 10), making B. napus the most duplicated eudicot genome sequenced to date; through gamma triplication, beta duplication, alpha duplication, Brassica triplication and recent allotetraploidy (Fig. 1). 5.2. Estimation of divergence of B. napus from B. rapa and B. oleracea Independent evidence for the date of the allopolyploidy event(s) that formed B. napus is not well defined. With genome-scale characterization of the divergence of orthologous genes, we calculated divergence between Ar-An and Co-Cn genomes, and between Brassica and A. thaliana (Fig. S14). Using a calibration of ~12-17 MY divergence between A. thaliana and Brassica we confirmed an average of ~4 MY divergence between B. rapa and B. oleracea genomes (Fig. S14A) as previously reported (9-11). Based on this calibration the divergence between An and Cn subgenomes of B. napus and the corresponding genomes of B. rapa and B. oleracea was estimated to be ~ 7,500-12,500 ya and therefore B. napus formed after this date (Fig. S14B). This estimation should be considered an upper bound, since following the tetraploidization event, the genome could have been unstable and mutations could have accumulated faster than without the event. 5.3. Gene deletion in reference B. napus ‘Darmor-bzh’ We counted 32,699 orthologous gene pairs between B. rapa and B. oleracea, the majority of which (27,360) were conserved as pairs of homeologous genes in B. napus. For the remaining 5,339 pairs of parental orthologs, one or both homeologous gene(s) was (were) missing (not annotated) in B. napus (Fig. S13, cases 3, 5, 7). This also left 4,166 pairs of homeologous gene pairs in B. napus (from a total of 31,526) where one or both orthologous gene was (were) missing in the parental genomes (Fig. S13, cases 4, 6, 8). This observed biased distribution with an overall 32,699 pairs of orthologous genes between parental genomes which was higher than the 31,526 pairs of homeologous genes in B. napus may suggest potential gene losses in B. napus (Fig. S13). However, the fact that the three genomes were sequenced, assembled and annotated using different methodologies necessitated a more exhaustive search and classification pipeline for tagging gene losses at the DNA sequence level with confidence. There are artifacts from genome assembly and annotation that could be potentially recognized as false “gene loss”. For example, genes present in the diploid ancestor that do not have a matching gene in B. napus may be due to the different annotation strategies employed in the parents and B. napus (either over-prediction in the parents, or under-prediction in B. napus). Therefore, inference of gene deletion in B. napus or its parental genomes was done through three essential steps (See Methods): (i) Analysis of DNA sequences of “missing syntenic genes” DNA sequences of “missing syntenic genes” were searched across the entire genome assembly in order to confirm whether changes occurred at the DNA sequence level. All “missing syntenic genes’” for which we find BLASTN DNA sequence matches at orthologous positions with no annotation, and where we found that a gene could be predicted if the same annotation method is used, and those that are at orthologous positions but not retained by our initial synteny search, were considered as not lost (Table S20). To be more stringent, all other “missing syntenic genes”, for which we found the BLASTN DNA sequence matches on non-anchored scaffolds (random), or in non-syntenic positions, were also considered as not lost as these could not be confirmed (Supplementary Table 19). Following this stringent analysis, we identified an initial set of 663 candidate lost genes (where the DNA sequence was missing) in the B. napus assembly as compared to the
28

corresponding parental genome, including 270 cases where An-copy was absent and 393 cases where Cn-copy was absent (Table S20 and S21). (ii) Confirmation by analysis of sequence read coverage on the parental genomes We mapped (uniquely) ~17x raw Illumina reads from ‘Darmor-bzh’ to the progenitor genome assemblies concatenated together (Methods). Each of the B. napus “missing syntenic genes” was confirmed as: (a) deleted, based on no or low sequence read coverage on its progenitor ortholog or; (b) not deleted where normal sequence read coverage similar to the average of the genome was observed. All the above identified 663 B. napus missing genes (no DNA sequence found) were carefully checked for confirmation based on raw sequence read coverage (Fig. S16, Table S21). This confirmed the deletion of 371 genes, among these 195 deleted genes corresponded to HEs where the deleted gene from one genome was found to be replaced by a duplicated copy of the other corresponding homeolog (Tables S21 - S23). These were detected because the average depth after mapping ‘Darmor-bzh’ raw sequence was higher than expected (20x threshold, all these events are described in Section 6). Only 176 could be confirmed as deleted, with no replacement by a duplicate of the corresponding homeolog (Tables S21, and Figs. S16, S17), 71 of which (~35%) consitute segments of two to four adjacent deleted genes. When counting all of the genes present on the deleted segments we end up with a total of 203 deleted genes, 112 from An and 91 from Cn subgenomes (Tables S21 to S26). (iii) PCR validation of a subset of missing syntenic genes. PCR validation of a subset inferred deleted genes confirmed the non-amplification in B. napus of 22 out of 23 tested genes, whereas they were amplified in the corresponding parents B. rapa and B. oleracea. This confirmed their deletion from B. napus (Tables S23, S24). As a control, 43 out of 45 non-deleted genes amplified both B. napus homeologous copies (Tables S23, S24). 5.4. Gene deletion in progenitor genomes Quantification of the number of genes present in both B. napus An and Cn subgenomes as pairs of homeologs, but absent in one of the parental genomes, showed that only 51 and 53 genes were absent from B. rapa and B. oleracea genome assembly, respectively (Table S27). This is proportionally ~6.4x lower than in allopolyploid B. napus. Maping of raw Illumina sequence reads from these parental genotypes to the B. napus genome assembly and assessment of coverage, confirmed deletion of 41 and 37 B. rapa and B. oleracea genes respectively (Table S28), a proportion that is~2.6x significantly lower (Χ2, P=5.3-14) than that of gene losses in B. napus (Tables S26, S27). Analysis of functional categories (GO) of B. napus ‘Darmor-bzh’ deleted genes showed no particular enriched terms (cutoff P<10-3) using GORILLA (http://cbl-gorilla.cs.technion.ac.il/) (Table S26). 5.5. Gene losses in a diversity set of B. napus, resequenced genotypes We checked the status of the genes confirmed as deleted in B. napus ‘Darmor-bzh’ in a diverse set of B. napus genotypes, together with a collection of B. rapa and B. oleracea genotypes, by analysis of their raw sequence read coverage (Table S6). Note that a genome wide survey of gene deletion could not be done as for ‘Darmor-bzh’, since the genomes of these genotypes were not available. Data showed that out of the 112 An genes confirmed deleted in B. napus ‘Darmor-bzh’, 59 were not deleted in any the progenitor B. rapa genotypes analyzed (Table S28). Among these, 27% to 54% were also deleted in the analyzed B. napus genotypes (Table S28).
29

Similarly, of the 91 Co genes confirmed deleted in B. napus ‘Darmor-bzh’, 63 were not deleted in any the progenitor B. oleracea genotypes analyzed (Table S29). Among these, 35% to 54% are also deleted in the analyzed B. napus genotypes (Table S29). 5.5. Truncation and pseudogenization of genes Using the same pipeline, we revealed 126 Cn, 121 An cases of partial gene sequence losses, where important fragments of the genes were truncated, and 37 Cn and 40 An cases of pseudogenes (premature stop codons) (Table S20). In both instances, sequence changes resulted in disruption of open reading frames and therefore the corresponding gene model was considered “lost”, but remnants of the genes still retain some sequence similarities to the progenitor genes. The observed gene truncation and pseudogenization in B. napus was not significantly higher than that occurring in the parental genomes, where 115 Co and 123 Ar truncated genes and 45 CO and 75 Ar pseudogenes were identified (Table S20). This reverse search suggested that the inferred gene truncation and pseudogenization was not favored in the allotetraploid B. napus, in striking contrast to full gene deletion. 5.6. Analysis of genes where either both parental copies or both homeologous copies are missing Analysis of the 612 (Fig. S13, Case 3) parental orthologous gene pairs, for which both homeologous pairs were not annotated in B. napus, showed DNA sequence matches in B. napus for the majority (Table S25). Therefore these could not be confirmed lost, except for 7 B. rapa and 9 B. oleracea copies, from different homeologous pairs, for which no sequence matches were found in the whole B. napus genome assembly (Table S25). Similarly, the analysis of the 1,019 (Fig. S13, Case 4) B. napus homoelogous gene pairs for which both parental orthologous copies were not annotated, showed sequence matches in the parental genome assemblies, with the exception of 6 An and 4 Cn genes for which no sequence matches were found in B. rapa and B. oleracea genomes, respectively (Table S25). 6. Homeologous exchanges (HEs)
Defined as the transfer of genetic information between homeologous sequences (70, 103-105), various types of HEs were shown to be frequent in the B. napus genome. HEs could be classified either as large segmental chromosomal rearrangements, covering two or more genes, or as small single gene exchanges or even SNP exchanges among homeologs. These patterns could be the result of numerous processes including crossovers (CO) and non-crossovers (NCO or gene conversions), both are initiated by double-strand breaks (DSBs) and which can be difficult to differentiate, because similar products of recombination can be observed (70, 103-105).
6.1 Large segmental HEs At the chromosome segment level, these were characterized by the loss of a large chromosomal region that was replaced by a duplicate copy of the corresponding homeologous region; such exchanges have previously been called homeologous non-reciprocal translocations (HNRT) or transpositions (106, 107). The raw sequence read mapping procedure (See Methods) allowed the initial identification of 23 regions of double coverage on one of the parents. Among these, we confirmed a total of 17
30

where the orthologous region could be found in the other parental genome and displayed a depth lower than 10. These suggest HEs where the first region (double depth) replaced the second (low depth). In 14 cases, the Cn segment was found to be replaced by the An homeologous segment (Table S31). For each of these, there was double coverage of the ‘Darmor-bzh’ raw sequence reads on the Ar genome (compared to adjacent regions), and little or no read coverage on the Co genome (Fig. 3B and 3C, Table S31). The internal sequences of duplicated regions are collapsed in the ‘Darmor-bzh’ assembly due to lack of polymorphism, whereas their terminal sequences were often separately assembled with adjacent flanking sequences. In particular, the region on chromosomes An1-Cn1 has been collapsed in the B. napus assembly, with some parts being anchored on An1 and other parts on Cn1. In cases where the orthologous regions could be found in B. napus the average depth of coverage over 10 kb windows was double for one B. napus homoeoallele and very low for the other. This is evidence that we collapsed the two alleles during the assembly process. For three cases, however, the duplicated regions identified as HEs seem to have been assembled separately in B. napus (Table S31). We tested whether the gene losses in B. napus ‘Darmor-bzh’ were co-localized with HE regions (Methods): Distribution of gene losses in bins of 150 genes each surrounding the 17 large HEs detected in ‘Darmor-bzh’ is presented in Fig. S21. A Chi-square test showed that there is no significant correlations between the occurrence of gene loss across the bins and their distances to HEs (P=0.107). However, since HE regions are prone to be collapsed during the assembly, they were often filtered out by the stringent criteria that were used to call gene losses. HEs found in a representative set of seven resequenced B. napus genotypes (Table S30) are displayed in Fig. S19. Regions with high coverage, indicating a putative duplication, are indicated in red, while homeologous regions with low coverage (putative loss) are displayed in green. The identified regions are described in detail in Table S32. A HE affecting glucosinolate loci is compared between cultivar ‘Darmor-bzh’ where it occurs and cultivar ‘Yudal’ where it does not occur (Fig S20). The analysis revealed frequent HEs throughout the species, contributing to the diversification of winter, spring and Asian types of oilseed rape, rutabaga/swede and kale vegetables (Fig. 3A and 3C, Fig S19). These chromosome rearrangements in different B. napus genotypes involve different homeologous chromosome pairs, are of varying size, and were more frequent between chromosomes An1-Cn1, An2-Cn2 and An9-Cn9 (Table S32, Fig S19A). The synthetic B. napus accession H165 showed the most substantial segmental exchanges, with An1-Cn1 and An2-Cn2 being affected over almost the entire chromosome lengths (Fig. 3, Fig. S19.A). A very large HE has replaced nearly 9Mb at the top of An1 with its larger (~13 Mb) homeologous segment from Cn1, affecting more than one third of both chromosomes. The rest of these two chromosomes exhibit two other extensive HEs in the opposite direction that have replaced almost the entire remainder of Cn1 with two corresponding segments of An1. Similarly, An2 and Cn2 in H165 are also affected by bidirectional exchanges over almost the whole chromosome lengths, with one large (~5Mb) and two smaller Cn2 to An2 exchanges along with two An2 to Cn2 exchanges, one of which accounts for almost one quarter of the entire chromosome. A further, small duplication on An2 is not reciprocated by a corresponding deletion on Cn2. The extent of these chromosome rearrangements in the synthetic B. napus H165 clearly demonstrates the potential for generation of genome-scale variation during de novo allopolyploidy in B. napus. Examples given below show that this variation can also result in phenotypic variation for traits under natural and artificial selection, leading to retention of HEs containing beneficial gene variants in different cultivated B. napus forms (Table S33).
31

6.2 Short HEs We also analyzed small HEs, defined as gene conversion (12, 108) at the single gene and single nucleotide level. We identified 37 Cn to An and 56 An to Cn converted genes where duplicated gene sequences were collapsed together in the assembly, only two of which were adjacent (Table S34). Partially converted genes whose sequences were resolved in the assembly were detected by a whole genome procedure, based on inferring conversions at the single nucleotide level using different strategies (See Methods). At the whole genome level, non-reciprocal exchanges between subgenomes account for ~86% of the mutations differentiating B. napus from its progenitors. All approaches displayed a higher “genome conversion” trend from An to Cn, i.e. creating four copies of the Cn allele and leaving no copies of the An, than the reciprocal (Table S35). The availability of the B. napus genome sequence and representatives of its diploid progenitor species represents a fantastic opportunity to analyze gene conversion using colinearity-supported homologous gene quartets, i.e. present and colinear between all four genomes Ar, Co, An and Cn (Table S19). Based on homologous gene quartets (confined to coding regions, but requiring less stringent statistical thresholds to mitigate false positives than genome-wide searches), 64% of single-nucleotide polymorphisms between A and C alleles remain unchanged in tetraploid B. napus. Among the remainder, differentiating An and Cn B. napus subgenomes from their corresponding parental ones, 53% now have only the Cn allele and 36% have only the An allele (Table S36). The probability of observing a converted mutation at random is ~33%, significantly lower than the observed ~94% of mutated An/Cn sites that appear to be converted. Out of the 23,452 B. napus homeologous gene pairs, 16,938 An genes and 13,429 Cn genes (with 10,258 from each genome constituting homeologous pairs) show at least two conversion sites, with a distribution and an average presented in Fig. S22 and Table S37. To avoid errors that would result from independent ‘convergent mutations’ in any of the four genomes since their divergence and before allopolyploidy, we performed a stringent analysis to identify the genes which experienced at least 60% (up to 90%) site conversion, versus general averages of 18.6% and 12.9% for An to Cn and Cn to An conversion, respectively. Out of 23,452 homologous quartets, 1,027 have experienced conversion at 60% or more informative nucleotides for An to Cn and 878 of these have less than 10% Cn to An conversion, with 842 of the latter having 3 or more conversion sites). Similarly, 754 genes experienced conversion at 60% or more informative nucleotides for Cn to An conversion and 598 of these have less than 10% An to Cn conversion sites, with 579 of the latter having 3 or more conversion sites (Table S37). Finally, validation of gene conversion was completed for a subset of 42 highly-converted genes (38 with conversion representing more than 60% of informative sites, and 4 detected as converted and collapsed in the B. napus assembly), among which 86% were confirmed by PCR. Briefly, the strategy was based on development of pairs of PCR primers that were specific to the Ar or Co gene copies, respectively. PCR amplification in B. napus showed that 12 out of 15 An to Cn converted genes and 24 out of 27 Cn to An converted genes did not amplify in B. napus confirming their absence, most likely because of their conversion in B. napus (Table S38). Comparatively, 40/42 An and Cn non-converted homeologous gene pairs amplified both copies in B. napus. As an additional validation, we calculated the average depth at converted genes after mapping B. napus reads on parental Ar and Co genomes (Methods). For genes converted from An to Cn (on more than 60% of informative sites), the depth at B. oleracea genes tends to be higher than B. rapa genes, confirming that An alleles are less represented than Cn alleles in B. napus reads (and the reverse is observed for genes converted from Cn to An) (Fig. S23).
32

We identified 64 An to Cn and 52 Cn to An highly converted genes that define 32 and 26 regions of two adjacent converted genes, respectively. We analyzed the intergenic space between these adjacent genes and confirmed that except in two instances, the intergenic regions were not converted, implying that these types of conversion are not segmental and affected only the gene sequences. Analysis of the chromosomal location of genes with 60% or more conversion sites within the B. napus genome identified regions with two or more genes within a bin of 100 kb that have been converted, suggesting the presence of conversion hotspots (Fig. S24). Similar to cotton (12) where conversion predominantly involved transfer of alleles from the larger repeat-rich genome to the smaller subgenome, B. napus shows ~1.3x more conversions from the smaller (An) to the larger (Cn) genome (Tables S35, S36). Functional enrichment of converted genes For genes with more than 60% converted sites, functional groups showing significant enrichment of overall converted genes included ribosome genes and genes functioning in extracellular space (P-value < 0.02) (Table S39). For biological process and molecular function, signal-transduction genes and structural genes were significantly enriched in the converted gene groups (P-value < 0.02) (Table S39). To investigate if there was a bias of functional enrichment between An to Cn and Cn to An converted genes, we tested the two groups separately. Genes for cellular components show significantly more An to Cn conversions (more than 2x) for mitochondria genes while ribosome genes are enriched in both conversion types. Genes related to energy production more closely resemble the genes from the ancestral C genome. For the four enriched functional groups, three show biased enrichment in either Cn to An or An to Cn conversion types while ribosome genes again were enriched in both conversion directions. There was no significant difference in frequencies of the two types of conversion in the molecular functions ‘cell component’ and ‘biological process’.
Three other functional groups are enriched in either one of the two types of conversion. Note that ‘extracellular’ has a similar number for the two types of conversion (36 vs 37) although they have different p-values. This is because the test also depends on the number of Cn to An or An to Cn converted genes. (Table S39). 7. Homeologous gene expression The availability of B. napus An and Cn homeologous genes offers the opportunity to study and compare their expression and contribution at the whole genome level. Out of the 30,949 homeologous gene pairs, 29,736 (96%) showed at least one expressed homeolog in at least one of the two tissues; genes were considered to be expressed if there was one or more mapped reads. Only 1,213 homeologous gene pairs (4%) showed no expression (no mapped reads) for both An and Cn copies in both analyzed tissues and could not be compared in this study. For a large number of homeologs, statistical analyses show significant effects in at least one subgenome, tissue, or subgenome-tissue interaction. Comparison of expression of both An and Cn homeologs in the two tissues allowed 45 expression patterns to be identified (Fig. S26) that were grouped into nine major patterns according to tissue or subgenome comparison (Fig. S27, Table S41).
33

The comparison of expression shows that for 17,326 gene pairs (58.3%), An and Cn homeologs contribute equally to gene expression in both contrasting tissues (P>0.01) (Fig. S27). Biased contribution to gene expression was shown, where the homeolog An contributed more than the homeolog Cn for 4,664 gene pairs (15.7%) in both tissues (P<0.01) (Fig. S27), with 4,600 showing at least a two-fold difference (Fig. S28) and 337 and 276 cases where the Cn homeolog was silenced (no mapped reads found) (Fig. S28) in leaves and roots, respectively. Similarly, the homeolog Cn contributed more than the homoelog An for 5,437 (17.3%) gene pairs (P<0.01) (Fig. S27) in both tissues, with 3,490 showing at least two fold differences (Fig. S28) and 391 and 329 cases where the An homeolog was silenced (no reads found) (Fig. S27) in leaves and roots, respectively. These comparisons illustrate that biased contribution to gene expression is largely established (~33% of gene pairs) in the recent allotetraploid B. napus and is stable in both tissues. No evidence for pronounced genome dominance was revealed, although there were 473 more gene pairs where the Cn homeolog was more highly expressed in both tissues than the An homeolog. Interestingly, for 1,062 gene pairs (3.7%), the homeolog An contributed more than the homeolog Cn in leaves (Fig. S27), with 659 showing at least a two-fold difference (Fig. S29), and 79 cases where the Cn homeolog was silenced (no reads found). The expression of this same set of homeologous gene pairs was inversed in roots where the homeolog Cn was more highly expressed than homeolog An (Fig. S27) with 29 An-silenced homeologs. Interestingly, the 79 Cn homeologs silenced in leaves and the 29 An-silenced homeologs in roots were expressed in the other tissue, suggesting that silencing is caused by tissue-specific mRNA transcription regulation. Similarly, for 966 gene pairs (3.3%), the An homeologs contributed less than the Cn homeologs in leaves (with 71 An silenced homeologs) whereas the situation was inversed in roots, including the expression of the 71 An homeologs that were silenced in leaves, and the silencing of 22 Cn homeologs that were expressed in leaves. Finally, for 115 and 129 gene pairs, homeolog An and homeolog Cn, respectively, were more highly expressed in roots whereas they were equally expressed in leaves (Table S41). Similarly, for 24 and 14 gene pairs, homeolog An and homeolog Cn, respectively, were more highly expressed, in leaves whereas they were equally expressed in roots (Table S41). The generalization of partitioning of expression between duplicated homeologous genes in B. napus, may favor the long-term preservation of duplicated genes (23). Functional classification shows biased representation of gene ontology categories Gene Ontology (GO) enrichment analysis was performed on the homeologous gene expression data. When comparing homeologous genes with differential expression levels (in both tissues) with the homeologs that have the same expression level, 128 GO categories were enriched in the former including many enzymes and other metabolic genes (Table S42). In contrast, 100 GO categories were enriched in genes that have the same expression level including many binding categories (DNA binding, RNA binding, etc.). When comparing homeologous genes with reciprocal tissue-specific expression biases (i.e. one homeolog more expressed in roots and the other more expressed in leaves and vice versa) vs. other genes, 22 GO categories for a variety of functions were enriched, and 41 GO categories were enriched in other genes, including many binding activity categories. The finding that genes involved in binding, especially those involved in DNA binding and potentially involved in regulatory networks, are more prone to be expressed at the same level in both homeologs suggests that they are more subject to dosage balance (109, 110).
34

8. Genome-wide cytosine methylation Of the 260 million trimmed sequences from leaves, 58.3% were uniquely aligned to the genome, while of the 302 million reads from roots, 61.1% were uniquely aligned to the genome, providing an average read depth of 39.05 and 34.57, respectively. The level of DNA methylation was globally higher in roots compared to leaves, in the context of CpGs (55% vs. 53%), CHG (26% vs. 22%) and CHH (8% vs. 7%). This higher methylation in roots is consistent in all sequence types and all cytosine contexts (CG, CHG, CHH) (Table S43). The CG methylation showed the expected bimodal distribution, while CHG and CHH showed a majority of unmethylated cytosines (Fig. S30). Sequencing data from replicates of the same tissue were highly correlated than when comparing data from the different tissues. This was particularly pronounced for the CHG context, while correlation between replicates of the same or different tissues remained very high for CG methylation (0.99 vs. 0.98 respectively) (Fig. S30). Repetitive elements were highly methylated with a mean methylation degree for CGs of 87.7% and 89.9% for leaves and roots respectively and the methylation was detectable at nearly 97% of CGs sites (Table S43). All abundant transposon families identified in the B. napus genome were highly methylated with little differences between the two genomes and the two tissues. Promoters (UTRs) were the least methylated sequence types (11% of CpGs) and CDS and gene body sequences had intermediate levels of methylation (Table S43). Using a conservative approach for the identification of differentially methylated cytosines, 58,442 CpGs were strongly differentially methylated (q-value <0.01, delta > 25 %) between the roots and leaves tissues analyzed (Fig. S31A). 14% of these were in the context of promoters indicating potential gene regulatory effects (Fig. S31A). More than 200,000 cytosines were differentially methylated in the context of CHG and CHH, respectively (Fig. S31B, S31C). In all sequence contexts, most (77-81%) of the differentially methylated positions were in intergenic regions (Fig. S31). The Cn subgenome was found to be more methylated than the An subgenome in all sequence types, with roots remaining more methylated than leaves for the two subgenomes (Table S43). The increased CpG methylation in the Cn subgenome averaged ~4 % for UTRs, and 8% for gene body coding regions for both the DNA methylation level as well as the DNA methylation frequency. Differences were smaller for CHG and CHH sequence contexts. A total of 3,356 An-Cn homeologous gene pairs were found differentially methylated for CpG in leaves, while a nearly identical number (3,470) of pairs was found in roots. A majority of these (3,095, 92%) were common to both tissues, (Table S44). A small majority (~ 60%) of these were more methylated in the Cn genome. When focusing on the UTRs of these gene sets, 443 UTR regions were found differentially methylated with ~60% more methylated in the Cn genome. Similar proportions were found for the CHG sequence context with the number in roots (total: 1177; UTR 213) slightly elevated than in leaves (907 regions; 173 UTRs). 88% of differentially methylated An-Cn homeologous gene pairs in the CHG context were conserved between the two tissues (Table S44). Differentially methylated An-Cn homeologous gene pairs in the CHH context were rare, but still had predominance for hypermethylation of the C genome. The similarity of the patterns of differentially methylated regions demonstrates that this effect is tissue-independent and probably governed by genome structure. When looking for tissue-specific differentially methylated cytosines separately for the An and Cn subgenomes, differential methylation in all sequence contexts was more gene centered on the
35

An genome compared to the Cn genome which might be due to the higher content of highly methylated repetitive elements in the Cn genome. Correlation between DNA methylation and gene expression Correlating genome-wide expression to the CpG and CHG methylation showed overall the expected inverse correlation between DNA methylation and expression both at the gene as well as the UTR level in both tissues in the CpG as well as in the CHG context (Table S43). Correlating the differentially methylated An-Cn homeologous gene pairs to the gene expression patterns (Table S45), we found that about half of the differentially methylated homeologous gene pairs had similar expression patterns in the two subgenomes. Nonetheless, lower expression was much more frequently observed for the more methylated homeolog than the reverse, in both tissues. When considering differentially methylated UTRs, the correlation between low gene expression and high DNA methylation was found to be more significant (Table S45, Fig. S32). The observed correlation of differential methylation patterns with differential expression, observed suggests that epigenetic mechanisms may play a role in the functional diversification. 9. Comparative analysis of oil biosynthesis genes in Brassica spp. Brassica napus is primarily grown as an oilseed crop and recent breeding has focused on the selection of lines with optimized lipid composition and content within the seed (111). Thus a genomic characterization of the families of genes involved in lipid biosynthesis was undertaken in the B. napus genome assembly to assess the potential impact of this selective breeding on gene content and function. This analysis used the reference B. napus ‘Darmor-bzh’ genome sequence together with the reference genomes of the progenitor diploid Brassicas; B. rapa (Ar genome; (9)) and B. oleracea (Co genome; (10)). An extensive analysis of the model crucifer species Arabidopsis thaliana identified more than 120 different enzymatic reactions and over 600 genes that played a role in acyl lipid metabolism in this close relative of B. napus (84, 112). This collection of genes was used to identify orthologous and paralogous sequences within the reference B. napus, B. oleracea and B. rapa genomes (Table S46). An assessment of conserved syntenic putative acyl metabolism genes between all three Brassica species could suggest selective pressures on specific pathways or gene families in response to the breeding strategies applied in the development of low erucic acid, high oil content B. napus, as compared to its two diploid progenitors. Conserved syntenic positions within each genome will identify the most likely functional ortholog in the Brassica species (Table S46). For the 606 A. thaliana genes, we identified a total of 986 and 1,030 homologs within the Ar and Co genomes, respectively, and an almost identical number of 985 and 1,025 homologs within the amphidiploid An and Cn genomes, respectively (Table S46, S47). Compared to soybean (113) and oil palm (114) this represents the highest number of acyl lipid metabolism genes annotated in an oilseed plant species genome to date, with a 3.3 fold expansion over A. thaliana. There appeared to be little bias in the acyl pathways affected, although genes from the fatty acid synthesis pathway showed the greatest difference, with a 3.7 fold increase compared to A. thaliana, but this increase was equivalent across all genomes. In comparison to the diploids there appeared to be no targeted loss of gene copies in the tetraploid genomes. For the 18 acyl
36
orthologs no longer found in the B. napus, only five appeared to be completely absent, three in the An genome and two in the Cn subgenomes. All other (13) missing orthologs had been replaced either through large or short HEs (Table S47). As observed for most regions of the genome there was a bias in conversion, with the Cn genome copies being preferentially replaced by An genome copies; nine Cn genes and four An genes, were replaced through larger homeologous recombination events (Table S47). One Cn gene and one An gene were replaced by An and Cn homeologs, respectively, through individual gene conversion (Table S47). There did not appear to be any targeted classes of lost genes; the two classes with the largest number of duplicated genes (Fatty Acid Elongation & Wax Biosynthesis and Phospholipid Signaling) also represented the classes with the highest number of lost genes; five and three, respectively (Table S47). Details of all “converted genes” and the nature of HEs are presented in Table S48. The expansion of the acyl lipid metabolism genes could have an impact on the versatility of the trait in B. napus, yet the phenotypic differences between the non-oilseed diploids and the oilseed B. napus would appear to be largely the result of allelic variation (115). We confirmed that the B. napus orthologs of FATTY ACID ELONGASE 1 (FAE1) from B. rapa (Bra034635) and B. oleracea (Bo7g116890) exhibit the respective SNP (C to T) and two-base deletion (AA) alleles associated with low levels of erucic acid in the seeds (115). This is a key trait that has been selected for human nutrition (116). Future detailed analyses will deduce the exact nature of function versus non-function for individual members of this important group of genes in B. napus. Alternatively, the observed phenotypic variation in B. napus oil profiles may result from biased gene expression levels, which will be resolved in additional studies. 10. Glucosinolate genes Glucosinolates (GSLs) are sulfur-rich secondary metabolites, which have been shown to play essential roles in plant defense and human health (19, 117). Several studies have suggested that GSLs and their breakdown products have a variety of anticarcinogenic properties (118-120). Other studies have demonstrated that GSLs, mainly through their degradation products, exhibit toxicity, growth inhibition, or feeding deterrence to a wide range of potential plant pests, including mammals, birds, insects, mollusks, aquatic invertebrates, nematodes, bacteria, and fungi. Conversely, they can also attract adapted herbivores (121). In crops such as B. napus, GSLs are undesirable in the seed because of the toxicological effects of their breakdown products, which severely hinder the use of the seedcake in animal feed (20). Due to these anti-nutritional effects selection of B. napus varieties with low GSL content (<15 μmol/g) commenced more than four decades ago, resulting in the commercialization of varieties with 10–15 μmol GSL/g seed instead of 60–100 μmol/g seed found in old varieties (122). Liu et al (10) used 58 GSL biosynthesis and 13 breakdown genes identified in A. thaliana and identified 101 and 105 GSL biosynthetic genes in B. rapa and B. oleracea respectively, and 22 GSL breakdown genes in both species. Here we used these sequences and added 2 newly-identified GSL biosynthetic A. thaliana genes and studied their organization and evolution in B. napus as compared to its parental species Results showed that out of the 102 GSL biosynthesis genes identified in B. rapa, 97 have syntenic orthologs in B. oleracea. When these 97 pairs of parental GSL biosynthesis orthologous genes were compared in B. napus, we found one pair where the An homeolog was deleted (on chromosome An9) and one pair that was subject to an HEs replacing the Cn4 copy by the An4. We also identified one additional pair where both homeologs were found absent that
37

corresponded to an HEs where a segment from An2 replaced a Cn2 segment (Figure 4) (Table S49). Quantitative trait loci (QTL) controlling glucosinolate content were identified in several studies (for review see (123)) among which a recent study used the low glucosinolate cultivar (‘Darmor-bzh’) sequenced here as a parent of derived QTL mapping populations (21). Interestingly, we find that four QTL, explaining more than 50% of total aliphatic glucosinolate content variation co-locate with two pairs of parental orthologous GSL genes whose corresponding homeologous gene sequences have been affected in B. napus. Two of these, a Cn-deleted gene (corresponding to putative ortholog of B. oleracea Bo2g161590 gene on chromosome Co2) and its partial An homeolog (not annotated) on An2 (putative ortholog to Bra029311 on Ar2), co-locate with positions of two QTLs explaining 14% and 10% of the variation for total aliphatic glucosinolate content in B. napus (21). For these two deleted genes, a large segmental HEs has occurred deleting the Cn2 spanning segment that was replaced by a duplicate of An2 homoelogous segment, resulting in two An2 copies of these glucosinolate genes. Interestingly the high glucosinolate B. napus strains ‘Yudal’ and ‘Aburamasari’ did not contain this HEs (Figs 3, S20). The positions of two additional QTL, explaining 18% and 15% of total aliphatic glucosinolate content (21) co-locate with the deletion of the B. rapa Bra035929 ortholog on An9, and its non-deleted homeolog on Cn9 (BnaC09g05300D), respectively (Fig. S17). A QTL explaining 3% of aliphatic glucosinolate content, identified in the same study (21) was comapped with the glucosinolate biosynthesis gene missing from chromosome Cn3, orthologous to B. oleracea Bo3g175530. No obvious QTL could be mapped with the gene deleted from chromosome Cn8, orthologous to B. oleracea Bo8g010700 that correspond to a single gene deletion. Deletion of two of these genes was also independently reported to correlate with low glucosinolate content (124). The deletion and conversions of GSL genes found here is indicative of the selection of GSL gene deletions and variations through breeding efforts for low GSL in seeds. A mixture of genomic rearrangements and nucleotide variation associated with the control of the trait should not be surprising when considering the unique and diverse origin of the germplasm used to introduce the low glucosinolate phenotype (24, 125). Among the 17 GSL breakdown genes identified in B. rapa, 15 have an identified ortholog in B. oleracea, all of which were found in B. napus (Table S49). Finally, it has been recently reported that two members of the nitrate/peptide transporter family, GTR1 (AT3G47960) and GTR2 (AT5G62680) control accumulation of glucosinolates in seeds of A. thaliana (126). We searched for orthologs of these genes in all three Brassica species. For GTR1 (AT3G47960) three pairs of orthologs and for GTR2 (AT5G62680) two other pairs of orthologs were identified in parental species. We didn’t identify sequence changes in their corresponding orthologs in B. napus. 11. Disease resistance genes Disease resistance genes (R genes) are important components of the genetic resistance defense mechanisms in plants. R genes conferring resistance to a wide spectrum of plant pathogens, including bacteria, fungi, oomycetes, viruses and nematodes, have been cloned from many different plant species (127). R genes are involved in direct or indirect interaction with avirulence (Avr) genes in order to trigger a defense response. Understanding the molecular
38

structure and function of R genes has been crucial for plant resistance research. The largest class of R genes includes proteins with putative nucleotide binding site (NBS) and leucine-rich repeats (LRR). The NBS-LRR resistance genes appear to code for intracellular receptors that are composed of a variable N terminal domain followed by the NBS and LRR domains. The LRRs may be the main determinant in recognition specificity of the avirulence gene product (128), whereas, the NBS region is thought to be important for ATP binding activity. NBS sequence analyses revealed that NBS domains share a high degree of homology and have a number of conserved motifs (127). NBS-LRR genes can be subdivided into two distinct types based on the structure of their N-terminal domain: either a coiled-coil (CC) motif or a Drosophila Toll/ mammalian Interleukin-1 Receptor (TIR) domain (129). Previous studies showed that the NBS-LRR class of genes is abundant and widely distributed throughout the genome of plant species with approximately 0.6–1.8% of genes encoding NBS-LRRs at a density of 0.3–1.6 genes per megabase. Moreover, genetic and genomics studies show that the majority of NBS-LRR genes are present in gene clusters in plant genomes (130) for instance, in Arabidopsis and rice (131, 132). The clustered arrangement of these genes may be a critical attribute allowing the generation of novel resistance specificities via recombination or gene conversion (129). In the B. rapa genome almost 50% of NBS family members were detected as tandem arrays within homogenous clusters suggesting tandem duplication in combination with polyploidy played an important role in the expansion of NBS-LRR encoding genes in the Brassica genome (133, 134). The availability of the genome sequence of the B. napus recent polyploid and that of its parental species B. rapa and B. oleracea provides an excellent opportunity to study R gene organization and evolution on a relatively short evolutionary time period, in relation to breeding efforts. Comparison of NBS-LRR genes in B. napus and its related diploid species B. rapa and B. oleracea The initial identification of NBS-LRR genes based on gene prediction indicates that there are 181 NBS-LRR encoding genes on the An and 245 on the Cn subgenomes of B. napus, lower than the 211 genes and 274 genes found in B. rapa and B. oleracea, respectively (Table S50). We confirmed at the DNA level that the majority of differences in NBS-LRR gene numbers between B. napus and the sum of its progenitors could be attributed to mis-assembly and/or annotation differences (See Section 5). For those genes, present at syntenic positions in both parental genomes and missing in one or two of the B. napus subgenomes or the reverse, we confirmed the deletion at the DNA level of 5 An genes, 3 Cn genes, 3 Ar B. rapa genes and 0 Co B. oleracea genes. Overall, these comparisons do not show a massive deletion of NBS-LRR in B. napus as compared to its parents, (Section 5). A high number of NBS-LRR genes present in only one of the four Brassica genomes (15 An, 17 Cn, 26 B. rapa and 33 B. oleracea) was observed. In addition to technical reasons such as annotation differences, the lower orthology and homeology relationships for NBS-LRR genes than for other gene families (Sections 9 and 10), could be attributed to different breeding and introgression programs for disease resistance in each species as well as the typical cluster organization of NBS-LRR genes, which often differ in copy numbers. The distribution of NBS-LRR genes in the An genome of B. napus and Ar genome of B. rapa is consistent across the chromosomes with only slight differences. A similar pattern is also found in the Cn genome of B. napus and Co genome of B. oleracea. Comparison of the total number of NBS-LRRs and whether they were classified as TNL or CNL showed that the proportion of CC-NBS-LRRs and TIR-NBS-LRRs was consistent across the three species, with about 70% of R genes comprising TIR-NBS-LRRs. This represents a ratio of 1:2 CNL and TNL, which is consistent with findings in Arabidopsis (129).
39

The proportion of all genes encoding NBS-LRR in B.napus, B. rapa and B.oleracea are 0.58%, 0.60% and 0.75%, respectively, which is in line with estimates for other plant species that range between 0.6- 1.8% (90, 129, 135-137). Thus, there does not seem to be a correlation between genome size and the number of NBS-LRR genes. As has been previously suggested, the relationship between total gene number and total NBS gene number is likely to be non-linear and not proportional to genome size (138). Genomic organization of NBS-LRR encoding genes in the B. napus genome Based on their physical position in the genome the NBS-LRR genes were distributed randomly and unevenly across the genome. This uneven distribution of NBS encoding genes on chromosomes appears to be common in plants (129, 135, 137, 139). The highest number of genes on the An genome of B. napus are located on chromosome An9, while An4 and An10 contain the lowest number of NBS-LRR genes (Fig. S33). A cluster of genes on An7 corresponds with a cluster of mapped genetic resistance genes to Leptosphaeria maculans, the most devastating fungal pathogen of B. napus (36, 140, 141). In the Cn genome, Cn9 has the highest number of NBS-LRR genes (Fig. S33). The TNLs and CNLs are present on all 19 chromosomes in B. napus. However, TNL genes are more widely distributed across the B. napus chromosomes except for chromosomes An4 and An5 (Fig. S33). Most NBS-LRRs are physically clustered in the genome (Fig. S34). About 44% of NBS-LRR encoding genes reside in clusters of five genes or more. This compares to 61% of all NBS genes in Arabidopsis and 50% in M. truncatula (90, 129). The highest number of clusters was found on An9. The chromosomes An10 and Cn4 were not found to have any NBS-LRR clusters. There is an NBS-LRR cluster present on An1, but absent in B. rapa. Likewise, two clusters of NBS-LRR are absent from Cn2 and Cn3 compared to B. oleracea. In total 13% and 10% of the NBS-LRR clusters are lost from the An and Cn genomes compared to the diploid parents. There are also clusters specific to genomes, for example present on Co9-Cn9, Co7-Cn7 and Co6-Cn6, but not present in the homeologous Ar-An genomes. With respect to TNL and CNL clustering, there were more TNL clusters (11 clusters across the An genomes and 15 clusters on the Cn genome) than CNL clusters (4 clusters on the An genome and 4 clusters on the Cn genome). Synteny of NBS-LRR genes in B. napus and its diploid progenitors B. rapa and B. oleracea Orthologous NBS-LRR genes between the four genomes were identified through the general synteny based method (see Supplementary Information Section 5), which was somewhat impaired by the organization of NBS-LRR into clusters. NBS-LRR gene conservation was evident among the Brassica species, with 153 of the 181 An NBS-LRR and 224 of the 245 Cn genes having orthologs in B. rapa and B. oleracea, respectively (Table S50). It should be noted that our approach counts only once if a gene is duplicated in tandem in one genome and not duplicated in the other, a situation that is frequent for gene clusters. B. napus, B. rapa, and B. oleracea, have all undergone extensive R gene breeding and introgression to common or different diseases, as well as genome rearrangement and duplication. These events are thought to contribute to the genome wide expansion and rearrangement of NBS-LRR gene loci. Gene conservation between Brassica species but also species specific ones suggest these genes are under strong evolutionary constraints to develop novel resistance specificity.
40

12. Analysis of FLOWERING LOCUS C adaptation
Different B. napus crop forms show broad ecophysiological adaption to different climatic zones and latitudes, the result of diversifying selection for key adaptation traits like winter hardiness, vernalization requirement and photoperiod-responsive flowering. Among oilseed types these phenotypic variants include annual, spring-sown, rapid-flowering canola forms grown in northerly latitudes in Canada and Scandinavia, semi-winter oilseed forms with only moderate winter hardiness and vernalisation requirement that are predominantly grown in sub-tropical areas of Asia and in southern and western Australia, and winter-hardy, vernalization-dependent biennial types sown in the autumn in Europe (6, 142, 143). In addition to morphotypes grown for oil, B. napus includes the hypocotyl vegetable known as rutabaga or swede (ssp. napobrassica) and leafy forms (fodder rape and kale) grown for animal grazing and human consumption, respectively (4). Spring-sown and semi-winter forms require little to no vernalisation, but their flowering behaviour differs considerably with respect to day-length dependency, whereas winter forms generally require moderate to strong vernalisation and flowering is mainly temperature-dependent rather than day-length dependent. Swedes/rutabagas tend to have much lower winter hardiness than other winter B. napus forms, but nevertheless require prolonged vernalisation and generally flower considerably later, under long-day conditions. Numerous QTL for flowering time, vernalization and day-length dependency have been located in crosses among and between various B. napus morphotypes, and most important QTL have been shown to colocalize with important flowering-time regulatory genes known from A. thaliana. One major adaptation gene, known to be associated with key QTL involved in vernalisation response and day-length dependent flowering in crosses between different Brassica morphotypes (22), is FLOWERING LOCUS C (FLC) (83). FLC is a major repressor of the main flowering signal encoded by FLOWERING LOCUS T (FT). FLC is constitutively expressed prior to vernalization by activation of FRIGIDA (FRI), part of of a complex network of transcriptional activators and enhancers for FLC activity. To initiate the transition to flowering, FLC is subsequently silenced in response to prolonged cold, by up-regulation of cold-responsive vernalisation genes, making FT accessible for activation by the photoperiod pathway. Although present in only a single copy in Arabidopsis, FLC has four copies each in B. rapa and B. oleracea. All these loci are preserved in B. napus ‘Darmor-bzh’ as three homologous pairs on homeologous chromosomes An2/Cn2, An3/Cn3 and An10/Cn9, respectively, and a further locus on Cn9 that has no corresponding An-genome homolog in B. napus or B. rapa (Table S51). The loci on An2/Cn2, An3/Cn3 and An10/Cn9 all correspond to positions of QTL for flowering time in crosses between different B. napus morphotypes (22). We found HEs to be associated with loss or retention of different FLC paralogs in the divergent B. napus morphotypes we sequenced. A Cn2 to An2 HE (Fig. 3, Table S51) has caused duplication of the FLC locus BnaA02g00370D of An2 and corresponding deletion of its homolog BnaC02g00490D from Cn2 in the Asian semi-winter oilseed cultivars ‘Yudal’ and ‘Aburamasari’ (Fig. 3). On the other hand, in the very late-flowering swede/rutabaga Sensation NZ, we found a small Cn9 to An10 HE (Fig. S19) that duplicates the FLC locus BnaA10g22080D of An10 and deletes its homolog BnaC09g46500D of Cn9. The small number of genotypes sequenced here makes it difficult to correlate gene loss or gains to specific phenotypes. Nevertheless, given that all the detected homologs are expressed it might be expected that variations in FLC allele content and expression patterns caused by HE could have been influentual in climatic and geographic adaptation of B. napus after allopolyploidisation.
41

13. The contribution of HEs to phentopic innovation An intriguing hypothesis regards the role and selective advantage of both large and small HEs in the generation of phenotypic variation for diversifying selection. The young B. napus polyploid, a result of hybridizations between two domesticated progenitor species, is an example of non-intentional human selection, termed ‘unconscious selection’ by Darwin (5; for review see (144)), as a corollary to natural selection in the wild. Diversification and plasticity of the young B. napus genome was observed among different morphotypes including winter, spring and Asian oilseed types, rutabaga and kale vegetables. Human cultivation and breeding of B. napus morphotypes may have selected favorable HEs, causing sub-genome restructuring and epigenetic crosstalk of regions containing genes controlling valuable agronomic traits. Previous studies found that HEs altered gene expression and phenotype (145). Here we observe that highly valuable agronomic trait variation, such as the reduction of glucosinolate content in seeds and flowering time (Fig. 3) correlated with the occurrence of HEs. This corborate with recent observation that similar exchanges may have contributed to phenotypic innovation in allopolyploid cotton suggests that they are more prevalent than previously thought and potentially drive adaptation of polyploids (12, 108).
42

Supplementary Figures:
Figure S1. Comparison of two orthologous BAC sequences from Brassica oleracea
(AC183497, 335,918 bp, only the first 170 kb of BAC AC183497 are drawn) and B. rapa (AC232568, 117,558 bp). Gray blocks: genes, black smaller blocks: transposable elements, light green blocks: sequence contig boundaries). Orthologous sequences (Blast high scoring pairs (BLASTN, E-value <= 1E-9, gap open=-1, gap extend=-3, mismatch=-2, softmasking) are shown by connecting red lines. The black curve plots (inside red lines) the percent identity between the orthologous sequences, along a 200 bp sliding window.
43
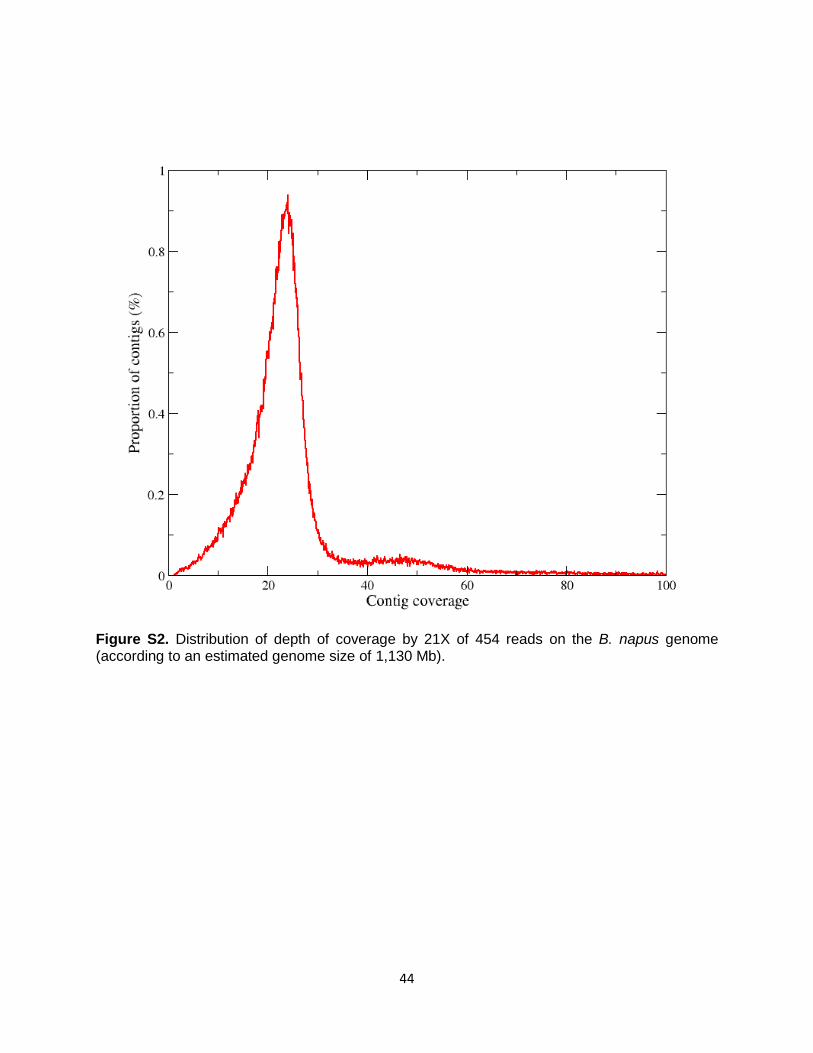
Figure S2. Distribution of depth of coverage by 21X of 454 reads on the B. napus genome (according to an estimated genome size of 1,130 Mb).
44

Figure S3. Classification of B. napus contigs based on the relative proportions of uniquely mapped nucleotides by reads from Ar or Co parental genomes. Each dot represents a contig, and the colors encode their “A”, “C” or “AC” assignation based on the proportion of nucleotides Out of the 283,693 initial contigs, 190,892 (67%) were uniquely identified (mapped) with at least one Ar or one Co
parental reads. Out of these, 168,863 (or 59% of initial contig number) were unambiguously assigned as belonging to An or Co genomes.
45

Figure S4. SeqPolyNap20K Infinium array: distribution of single nucleotide polymorphic (SNP) marker selection between parents of three segregating populations. For each population, the number of SNPs retained by the bioinformatic pipeline are indicated in black; the number of SNPs for the BeadChip design is in green, the number of SNPs successful designed on the BeadChip is in blue and the number of high quality SNPs is in red.
46

(a)
(b)
(c)
Figure S5. Distribution of loci mapped on the ‘Darmor-bzh’ x ‘Yudal’ DH segregating population of B. napus based (a) on marker type, mapping An and Cn subgenomes as well as by (b and c) individual chromosomes.
47

(a) Distribution of loci between An and Cn genomes based on DB map
(b)
(c)
Figure S6. Distribution of SNPs developed from the SeqPolyNap20K Infinium Illumina array (13K SNP) and mapped on the ‘Darmor’ x ‘Bristol’ (DB) F2 segregating population of B. napus, sorted by An and Cn subgenomes (a) as well as by individual chromosomes (b and c).
48

(a)
(b)
(c)
Figure S7. Distribution of SNPs developed from the SeqPolyNap20K Infinium Illumina array (13K SNP) as well as of existing SNPs (“BS” FSRSO) and mapped on the ‘Avisol’ x ‘Aburamasari’ F2-derived recombinant inbred line segregating population of B. napus, sorted by An and Cn subgenomes (a) as well as by individual chromosomes (b and c).
49

(a)
(b)
(c)
Figure S8. Comparison of marker distribution between the ‘Darmor-bzh’ x ‘’ (DY) map and the consensus DYDB and DYDBAA maps, sorted by individual An and Cn chromosomes (a, b) as well as for the whole genome (c).
50

Figure S9. Size comparison of syntenic intergenic regions with no N-gapped sequences, separating adjacent genes, between the Cn genome of B. napus (X axis) and the Co genome of B. oleracea (Y axis). (A) regions with no TEs detected; (B) regions with TEs detected in both genomes; (C) regions with TEs detected in only B. oleracea Co genome; (D) regions with TEs detected in only B. napus Cn genome.
51

Figure S10. Size comparison of syntenic intergenic regions with no N-gapped sequences, separating adjacent genes, between the An genome of B. napus (X axis) and the Ar genome of B. rapa (Y axis). (A) regions with no TEs detected; (B) regions with TEs detected in both genomes; (C) regions with TEs detected only in B. rapa Ar genome; (D) regions with TEs detected in only B. napus An genome.
52

Figure S11. Alternative splicing characteristics. (A) Intron length compared to coverage and intron coverage ratios. Of the 56,372 intron retentions inferred using our criteria, 48,974 had complete read coverage. Using less stringent coverage requirements does not significantly increase the amount of retained introns called under a coverage threshold. The overwhelming majority of retained introns called using our criteria had high coverage. The stronger blue line shows the trend of intron coverage decreasing as length increases. (B) Proportions of different types of alternative splicing events found in B. napus. Intron retention is the most common type of alternative splicing in B. napus. The numbers of each type of alternative splicing events are listed in Table S17.
53

A
B
54

Figure S12. Genomic dotplots after 1:1 synteny screen. A) Between B. napus (x-axis) and two diploid progenitor genomes (y-axis) with dots depicting only the genes within the 1:1 screened syntenic blocks. B) Between the two diploid progenitors B. rapa (x-axis) and B. oleracea (y-axis) with dots depicting only the genes within the 1:1 screened syntenic blocks. Axes are scaled by gene numbers.
55

Figure S13. All 9 possible gene retention cases (blue lines) of the quartet genes between B. rapa (Ar genome), B. oleracea (Co genome), and B. napus (An and Cn subgenomes).
56

Figure S14. Estimate of molecular divergence between different Brassica species and A. thaliana genomes (see Methods) (A) and a zoom in on divergence of B. napus An and Cn subgenomes and their corresponding parental Ar and Co genomes of B. rapa and B. oleracea (B). Molecular divergence was calculated between low-copy syntenic genes, based on Ks estimations with a calibration of ~12-20 MY divergence between A. thaliana and Brassica. As previously reported we confirmed an average ~4 MY divergence between B. rapa and B. oleracea genomes and we estimated ~ 7,500-12,500 ya for the divergence time between the An and Cn subgenomes of B. napus and the corresponding genomes of B. rapa and B. oleracea.
57

Figure S15. Schematic of scenarios where the homeologs are lost in the tetraploid versus the diploid genomes. When either the A or C homeolog is lost, then both diploid genes are expected to match to the same region in the tetraploid. Code [B] is syntenic orthologs, [NS] is a non-syntenic sequence match, see the methods to infer the codes between genes.
58

Figure S16. Unique mapping of 17x Illumina raw sequence reads of B. napus ‘‘Darmor-bzh’ on genome assemblies of B. rapa and B. oleracea concatenated together. B. rapa and B. oleracea genes orthologous to An (green) or Cn (red) deleted genes, show very low sequence read coverage, confirming their deletion from B. napus ‘Darmor-bzh’. In comparison, B. rapa and B. oleracea genes, orthologous to An and/or Cn non-deleted genes, show a high sequence read coverage. Orange: coverage on B. rapa genes with orthologs not lost from An subgenome of B. napus, brown: coverage on B. oleracea genes with orthologs not lost from Cn subgenome of B. napus, black and blue: coverage on B. oleracea and B. rapa genes respectively, with both orthologs not lost from B. napus Cn and An subgenomes.
59

Figure S17: Example of a deleted segment of six genes on An9, containing a glucosinolate gene (BnaC09g05300D, orthologous to Bra035929 and Bo9g014610). Interestingly, the deletion point corresponds to the extremity of a Helitron element.
60

Figure S18: Distribution of depth at each nucleotide position after unique mapping of ~17x of Illumina B. napus ‘Darmor-bzh’ reads on its genome assembly and on the concatenated parental genomes
61

Figure S19A (continued): chromosomes Cn1 and Cn2
62

Figure S19A (continued): chromosomes Cn3 and Cn4
63

Figure S19A (continued): chromosomes Cn5 and Cn6
64
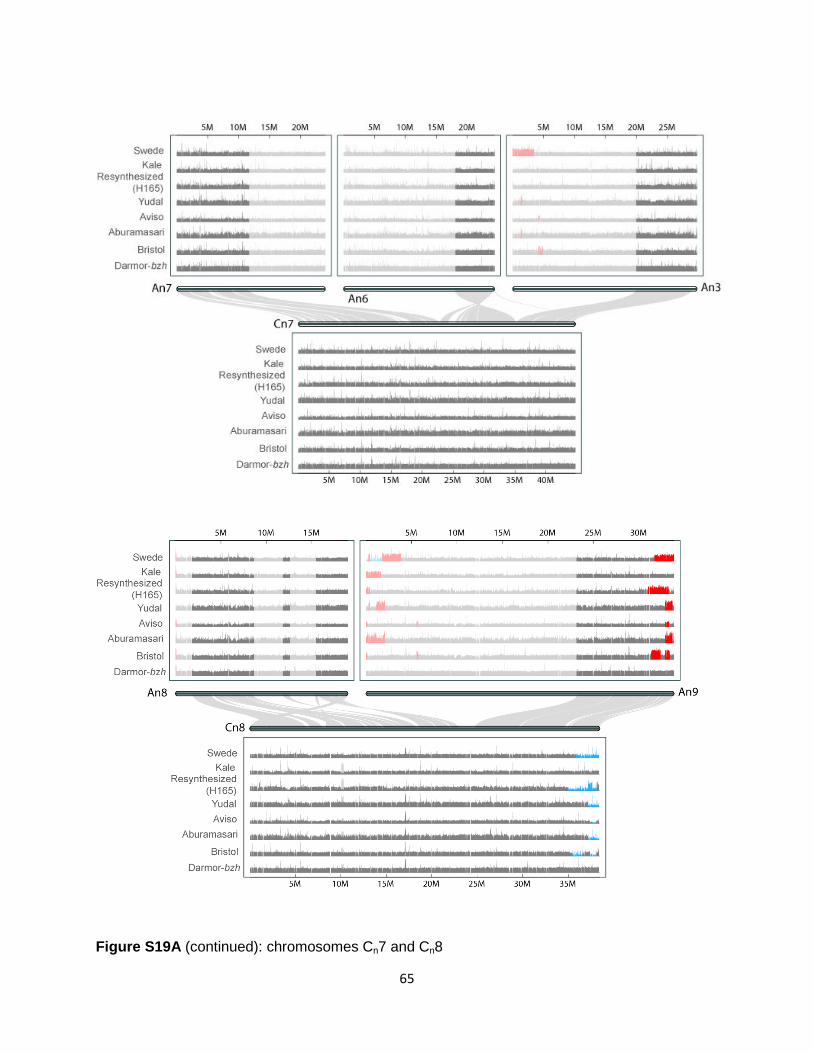
Figure S19A (continued): chromosomes Cn7 and Cn8
65

Figure S19A (continued): chromosome Cn9
66

B
Figure S19. Various homeologous exchanges (HEs) observed in a representative set of B. napus genotypes as compared to the Brassica napus ‘Darmor-bzh’ reference genotype assembly. (A) Depth of coverage along B. napus ‘Darmor-bzh’ chromosomes after unique mapping of Illumina reads from various B. napus genotypes. Regions with high coverage are displayed in red, and orthologous regions with low coverage are displayed in blue (See Table S31 for details about the different HE events). Cn chromosomes are used as the reference (bottom) and are linked by homoelogous relationships to An chromosomes (or segments of chromosomes) (top) (B) A summary view of the various HEs illustrating shared HE regions.
Darm
or- b
zh
Brist
ol
Abur
amas
ari
Aviso
Yuda
lre
synt
hetis
ed
H165
Kale
Swed
e
(Cn1->)An1
(Cn2->)An2
(Cn3->)An3
(Cn4->)An4
(Cn4->)An5(Cn5->)An5
(Cn9->)An9
(Cn8->)An9
(Cn9->)An10(An1->)Cn1
(An2->)Cn2
(An4->)Cn4(An5->)Cn5(An7->)Cn6(An9->)Cn9(An10->)Cn9
67

Figure S20. Alignment of genomic segments of a Brassica glucosinolate synthesis gene. The An glucosinolate orthologous gene is missing (red cross). Boxes A and B correspond to ‘Darmor-bzh’ (low glucosinolate line) and ‘Yudal’ (high glucosinoate line) aligned on the parental Ar and Co genomes. The An segment is duplicated in ‘Darmor-bzh’ but not in ‘Yudal’ (Box A) whereas the Cn segment is deleted from ‘Darmor-bzh’ and not from ‘Yudal’ (Box B).
68
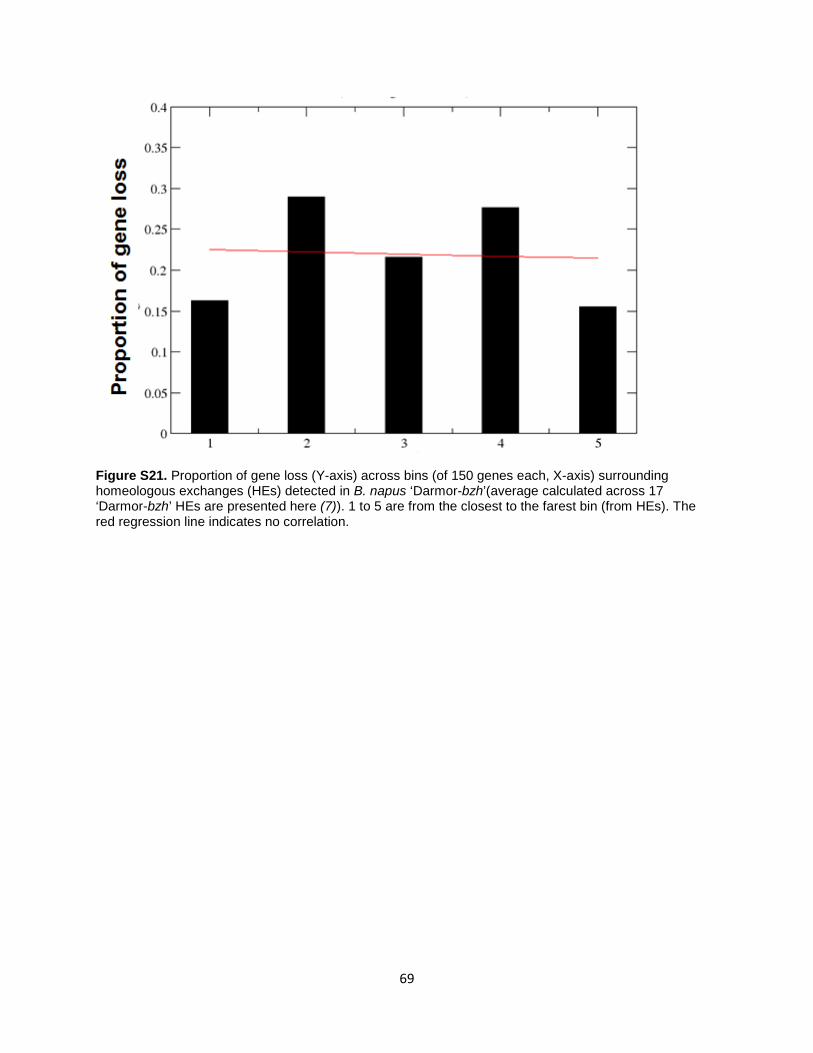
Figure S21. Proportion of gene loss (Y-axis) across bins (of 150 genes each, X-axis) surrounding homeologous exchanges (HEs) detected in B. napus ‘Darmor-bzh’(average calculated across 17 ‘Darmor-bzh’ HEs are presented here (7)). 1 to 5 are from the closest to the farest bin (from HEs). The red regression line indicates no correlation.
69

Figure S22. Distribution of genes (Y axis) in relation to their conversion ratio (X axis) from either An to Cn (red) and from Cn to An (blue). The first two bins correspond to genes with a conversion ratio equal to 0.
70

Figure S23: Distribution of the average depth of genes that were converted (An to Cn or Cn to An) in B. napus, after unique mapping of B. napus Illumina reads on the B. rapa and B. oleracea genomes concatenated together.
71

Figure S24. Gene conversion between An and Cn subgenomes of B. napus. In the figure, we show converted regions (curves) and genes (dots) distributed along the chromosomes. Two curves show inferred converted sites using B. oleracea as the reference with window size of 1 Mb and step size of 100 Kb. Dots show converted genes with ratios of converted sites > 0.6, inferred by checking homologous gene quartets within a window size of 100 Kb and step size of 100 Kb. Neighboring dots often form horizontal lines, which may stack over one another. Red curves and dots show conversion from An to Cn, and blue ones from Cn to An. Bins with more than five An to Cn converted genes are highlighted with yellow, likewise, Cn to An converted genes are highlighted with green. The distance between continuous converted genes are ≤ 300 Kb.
72

Figure S25. Principal component analysis (PCA) applied to summarize the expression data and identify spurious technical effects. The projection of the 12 samples on the first two PC-axes in the sample space shows a satisfactory reproducibility between biological replicates, with those two axes explaining almost 75% of the variance.
73

Figure S26. Forty-five expression patterns of An and Cn homeologous gene pairs of B. napus ‘Darmor-bzh’, grouped according to tissue and/or subgenome comparison.
74

Figure S27. Comparison of expression patterns of An and Cn homeologous gene pairs of B. napus ‘Darmor-bzh’ in roots (X axis) and leaves showing the proportion of those having similar or different expression patterns between the two homeologs in both tissues (according to color legend).
75

Figure S28. Partition of gene expression fold changes for B. napus ‘Darmor-bzh’ homeologous gene pairs showing similar biased expression of An and Cn homeologs in both root and leaf tissues.
76
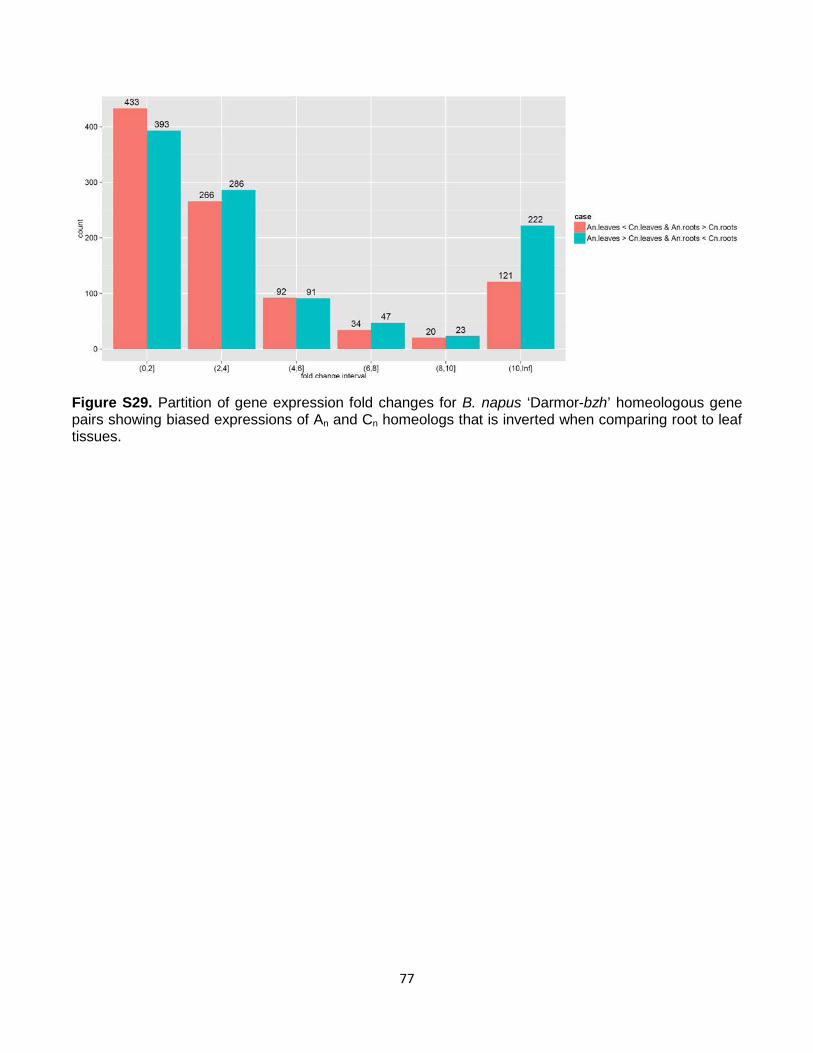
Figure S29. Partition of gene expression fold changes for B. napus ‘Darmor-bzh’ homeologous gene pairs showing biased expressions of An and Cn homeologs that is inverted when comparing root to leaf tissues.
77

Figure S30. Summary of results from the genome-wide bisulfite sequencing data from roots and leaves of B. napus ‘Darmor-bzh’. Histograms show the overall distribution of DNA methylation levels in CpG (a), CHG (b) and CHH (c) sequence context in the two replicates from leaves (L1 and L2) and two replicates from roots (L3 and L4). Correlation coefficients (Pearson) between all four replicates and density plots are shown.
(a) CpG
(b) CHG
(c) CHH
78

Figure S31. Pie charts visualizing distributions of differential CpG (A), CHG (B) and CHH (C) methylation between the leaves and roots of B. napus ‘Darmor-bzh’, in different sequence classes for either both subgenomes together or the An and Cn subgenomes separately in the three cytosine sequence contexts.
(a) CpG
(b) CHG
(c) CHH
Whole genomeAn subgenome Cn subgenome
Whole genomeAn subgenome Cn subgenome
Whole genomeAn subgenome Cn subgenome
79

Figure S32 continued
CpG
met
hyla
tion
Leaves RootsC
HG
met
hyla
tion
A. (Genes)
80

Figure S32. Correlation of gene expression in roots and leaves of B. napus An and Cn genes with CpG and CHG methylation in gene body (A) and UTRs (B). For each comparison, scatterplots show the overall inverse relation between DNA methylation and expression levels (RPKM) plotted against methylation levels; box plots represent different methylation levels in genes or UTR (along x-axis) with expression levels (LogRPKM) plotted on the y-axis.
CpG
met
hyla
tion
CH
G m
ethy
latio
nRootsLeavesB. (UTR)
81

Figure S33. The proportion of NBS-LRR compared between the An subgenome of B. napus and Ar genome of B. rapa (a) and; Cn genome of B. napus and Co genome of B. oleracea (b).
0
10
20
30
40
50
60
A1 A2 A3 A4 A5 A6 A7 A8 A9 A10
Num
ber o
f Gen
es
Chromosomes
B. napus
B.rapa
0
10
20
30
40
50
60
70
80
90
C1 C2 C3 C4 C5 C6 C7 C8 C9
Num
ber o
f Gen
es
Chromosomes
B. napus
B. oleracea
82

Figure S34 continued
83

Figure S34 continued
84

Figure S34 continued
85
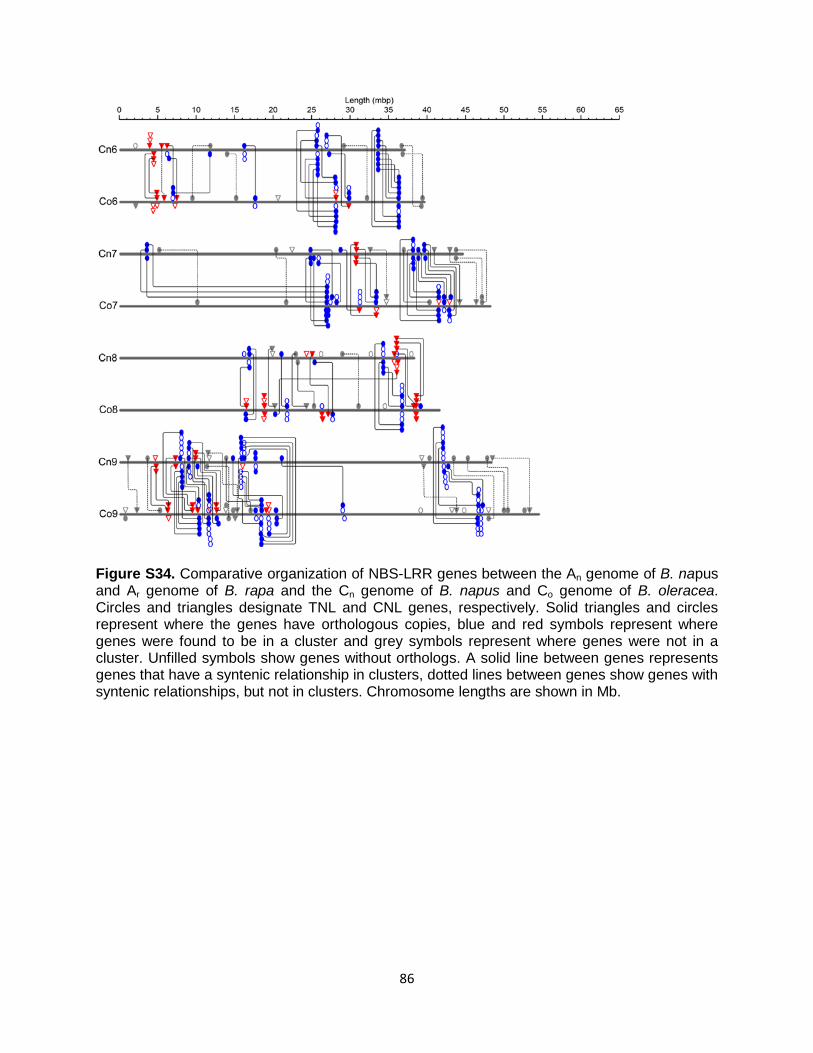
Figure S34. Comparative organization of NBS-LRR genes between the An genome of B. napus and Ar genome of B. rapa and the Cn genome of B. napus and Co genome of B. oleracea. Circles and triangles designate TNL and CNL genes, respectively. Solid triangles and circles represent where the genes have orthologous copies, blue and red symbols represent where genes were found to be in a cluster and grey symbols represent where genes were not in a cluster. Unfilled symbols show genes without orthologs. A solid line between genes represents genes that have a syntenic relationship in clusters, dotted lines between genes show genes with syntenic relationships, but not in clusters. Chromosome lengths are shown in Mb.
86

Supplementary Tables Table S1. Statistics for different sequencing technologies performed for Brassica napus ‘Darmor-bzh’ genome sequencing. Technology and type
Number of reads
Read average length (bp)
Fragment size
Genome coverage (x)
Sanger BAC end sequencing
141, 076 650 139 kb 0.1 (clone coverage of paired BES: 7.83X)
Titanium GSFLX 454 Single Paired Paired Total
55,107,437 4,506,239 3,813,355 68,405,795
376 294 339 368
800 bp 8 kb 20 kb 800 bp
18.8 1.2 1.2 21.2
Illumina Hi-Seq Single Paired Total
192,151,954 183,711,563 375,863,517
36, 76 and 150 76 and 108 36, 76, 108 and 150
300-600 bp 300-600 bp 300-600 bp
21.2 32.7 53.9
87

Table S2. Initial contigs and scaffolds statistics obtained from Newbler assembly of the Brassica napus ‘Darmor-bzh’ genome sequence.
Nb Cumulative size (bp) Average size (bp)
N50 size (bp) Max size (bp)
All Contigs 283,693 759,917,817 (69% genome) 2,679 10,221 91,747
Large Contigs
(>500bp) 148,305 726,738,052 (66%
genome) 4,900 10,812 91,747
Scaffolds 20,702 849,667,731 (77% genome) 41,042 777,265 7,721,466
88

Table S3. Final contigs and scaffolds statistics, after polishing the 454 draft using Illumina paired reads (using the procedure described by Aury et al. ((29)) and GapCloser).
Nb Accumulated size (bp) Average size (bp)
N50 size (bp) and number
N80 size (bp) and number
N90 size (bp) and number
Max size (bp)
Contigs 44,146 738,357,862 (67% genome) 16,725 38,893
#5,319 13,999
#14,562 6,338
#22,223 349,037
Scaffolds 20,702 848,760,698 (77% genome) 40,949 763,688
#299 109,022 #1,043
29,731 #2,586 5,197,798
89

Table S4. BLAT alignment of 454 reads from Ar and Co parental genomes to the contigs of B. napus (Identity >90%). Reads from B. rapa
(Ar genome) Reads from B. oleracea (Co genome)
Mapped 3,825,027 (98%) 4,146,002 (98%) Best Match (> 95% sequence identity)
3,776,190 (97%) 4,101,814 (97%)
Unique Best match 3,302,251 (85%) 3,621,309 (86%) Alignment Score 189.60 (30-200) 187.26 (30-200) Identity % 98 (95-100) 98 (95-100)
90

Table S5. Assignment of B. napus contigs and scaffolds to An and Cn genomes based on mapping of reads from parental genomes. Total
number Identified by Ar or Co reads
Assigned to An genome
Assigned to Cn genome
Unassigned (An / Cn)
Unidentified
Contig Nb 283,693 190,892 80,593 85,270 (48%)
22,029
Cumulative size (bp)
296,640,343 361,452,015 101,825,469
% of genome size
27 33 9
% of Cumulative length
39 48 13
Scaffold Nb 20,702 20,382 8,294 9,984 2,104 320 Cumulative size (bp)
312,274,328 507,261,694 29,223,103 908,606
% of genome size
28.39 47.11 2.66 0.08
% of Cumulative length
36.75 59.70 3.44 0.11
91

Table S6. Different genotypes of B. napus, B. rapa and B. oleracea sequenced using the Illumina GAIIx or HiSeq2000 platforms with obtained read length and yield of sequencing data (See large tables file). Table S7. List of polymorphic and mapped SNPs developed within the SeqPolyNap20K Infinium array with flanking sequence context and characteristics (See large tables file)
92

Table S8. Anchoring by allele matching of SNPs on the reference genome assembly of B. napus and theoretical coverage of the assembly length (‘Darmor-bzh’)
Number of scaffolds
Size of assembly
Number of "anchorable"
scaffolds Size (bp) % of total assembly
Whole Genome 20,702 849,610,005 3,914 737,022,491 87% Subgenome An 8,294 309,408,882 1,771 273,196,047 88%
Subgenome Cn 9,984 507,263,414 1,842 444,306,689 88% Subgenome An and Subgenome Cn: those scaffolds assigned on the An or Cn subgenomes. Table S9. Detailed description of 37,199 genetic markers used to anchor 3,849 scaffolds of Brassica napus ‘Darmor-bzh’ by allele sequence matching (See large tables file).
93

Table S10. Status of scaffold anchoring and chromosome assembly of the B. napus ‘Darmor-bzh’ Chromosome number Number of anchored
scaffolds Cumulative size
(bp)
An1 173 25,937,741 An2 146 26,402,634 An3 182 35,764,302 An4 125 20,620,624 An5 156 26,069,479 An6 183 26,664,766 An7 153 26,060,834 An8 126 21,070,187 An9 238 37,975,812 An10 135 19,663,029 Subtotal anchored An subgenome 1,617 266,229,408 Non-anchored An subgenome 6,654 47,992,926 Cn1 261 43,240,737 Cn2 267 51,342,600 Cn3 321 67,051,011 Cn4 280 53,336,842 Cn5 221 46,891,302 Cn6 222 40,569,959 Cn7 176 47,701,829 Cn8 245 42,971,415 Cn9 239 52,922,102 Subtotal anchored Cn subgenome 2,232 446,027,797 Non-anchored Cn subgenome 8,682 79,803,674 Unassigned 1,714 8,146,498 Total anchored 3849 712257205
94

Table S11. Number of transposon examplars, de novo identified from analysis of the Brassica napus genome, constituting the B. napus transposon database Transposon categories
Number of families
Number of examplars
Retrotransposons LTR/Copia 136
178
LTR/Gypsy 78
179 LTR/Unclassified 39
55
SINE
81
453 LINE
197
211
Subtotal
531
1,076
DNA-transposons hAT 77
111
CACTA
15
153 PIF/Harbinger 5
18
Tc1/Mariner 10
11 MITE/Tourist 10
14
DNA-Unknown
2
2 Helitron
11
12
Subtotal
130
321
Total
661
1,397
Table S12. Estimation of transposon content in assembled genomes of B. rapa, B. oleracea and B. napus as well as in ~3x raw reads of B. napus (See large tables file). Table S13. Size and estimated transposon space in orthologous non-gapped intergenic regions between An and Cn genomes of B. napus and their corresponding progenitor Ar and Co genomes of B. rapa and B. oleracea respectively (See large tables file). Table S14. Comparison of transposon content and dynamics within syntenic intergenic regions separating adjacent genes (and having no N gaps), between An and Cn genomes of B. napus and their corresponding Ar and Co genomes of B. rapa and B. oleracea respectively (See large tables file).
95
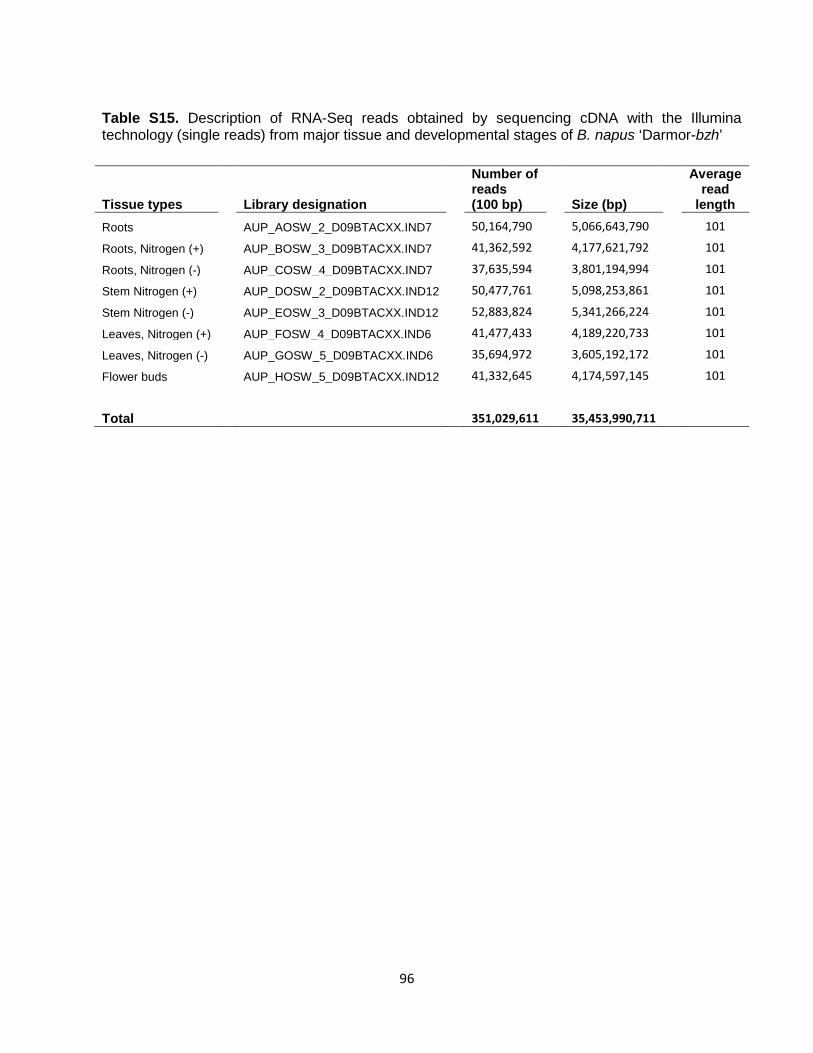
Table S15. Description of RNA-Seq reads obtained by sequencing cDNA with the Illumina technology (single reads) from major tissue and developmental stages of B. napus ‘Darmor-bzh’
Tissue types Library designation
Number of reads (100 bp) Size (bp)
Average read
length Roots
AUP_AOSW_2_D09BTACXX.IND7
50,164,790
5,066,643,790
101
Roots, Nitrogen (+)
AUP_BOSW_3_D09BTACXX.IND7
41,362,592
4,177,621,792
101
Roots, Nitrogen (-)
AUP_COSW_4_D09BTACXX.IND7
37,635,594
3,801,194,994
101
Stem Nitrogen (+)
AUP_DOSW_2_D09BTACXX.IND12
50,477,761
5,098,253,861
101
Stem Nitrogen (-)
AUP_EOSW_3_D09BTACXX.IND12
52,883,824
5,341,266,224
101
Leaves, Nitrogen (+)
AUP_FOSW_4_D09BTACXX.IND6
41,477,433
4,189,220,733
101
Leaves, Nitrogen (-)
AUP_GOSW_5_D09BTACXX.IND6
35,694,972
3,605,192,172
101
Flower buds
AUP_HOSW_5_D09BTACXX.IND12
41,332,645
4,174,597,145
101
Total 351,029,611 35,453,990,711
96

Table S16. General characteristics of the 101,040 predicted gene models. Annotation metrics Count Number of genes 101,040 Number of intronless genes 18,673 Gene size (mean : median) 1,953 : 1,560 Number of exons / gene (mean : median) 4.9 : 3 CDS size (mean: median) 1,001 : 810 Coding nucleotides 101,157,402 (11.9%) Number of introns 394,679 Intron size (mean : median) 195 : 94 % contigs with >=1 gene (% of nt in those contigs) 38% (93.5%)
97
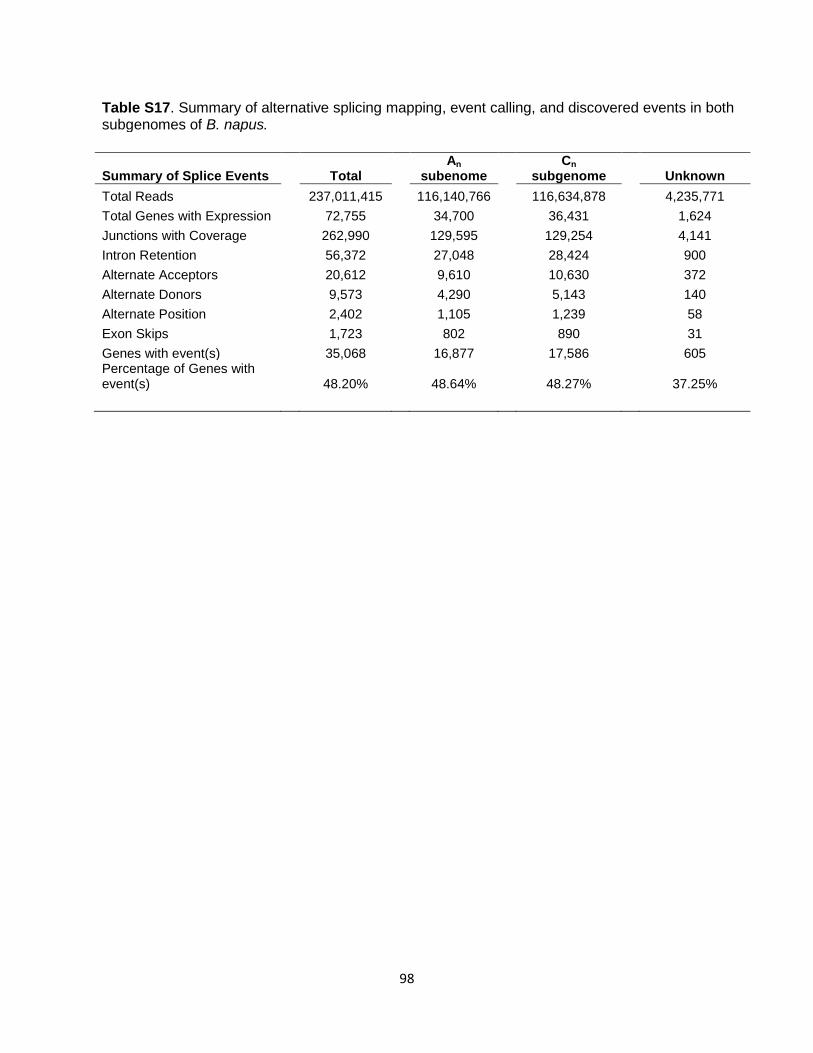
Table S17. Summary of alternative splicing mapping, event calling, and discovered events in both subgenomes of B. napus.
Summary of Splice Events Total
An subenome
Cn subgenome Unknown
Total Reads
237,011,415
116,140,766
116,634,878
4,235,771 Total Genes with Expression
72,755
34,700
36,431
1,624
Junctions with Coverage
262,990
129,595
129,254
4,141 Intron Retention
56,372
27,048
28,424
900
Alternate Acceptors
20,612
9,610
10,630
372 Alternate Donors
9,573
4,290
5,143
140
Alternate Position
2,402
1,105
1,239
58 Exon Skips
1,723
802
890
31
Genes with event(s)
35,068
16,877
17,586
605 Percentage of Genes with event(s)
48.20%
48.64%
48.27%
37.25%
98

Table S18. Comparison of alternative splicing patterns observed between pairs of homeologs in the An and Cn subgenomes of B. napus
Homeolog Event Conservation
Both Homeologs
Homeolog Specific Percent Shared
Requiring exactly the same event Intron Retention
9,435
12,585
42.85%
Alternate Donors
634
3,286
16.17% Alternate Acceptors
1,848
6,772
21.44%
Alternative Position
69
909
7.06% Exon Skips
70
587
10.65%
Subtotal
12,056
24,139
33.31%
Requiring only the same type of event at the equivalent junction Intron Retention
9,435
12,585
42.85%
Alternate Donors
727
2,854
20.30% Alternate Acceptors
2,073
5,482
27.44%
Alternative Position
134
686
16.34% Exon Skips
70
587
10.65%
Subtotal
12,439
22,194
35.92%
Table S19. Protein quartet table listing the homologous gene sets among Ar (B. rapa), Co (B. oleracea), An and Cn subgenomes of B. napus and their putative orthologs in A. thaliana. A dot (.) is placed where no homolog is identified in the respective genome due to several possible causes (different annotation methods, gene loss, truncation, pseudogenization, matching random scaffolds, transposed). These changes are tracked in the next four columns labeled BR-status, BO-status, AN-status and CN-status followed by a column that categorize the quartet into one of the nine cases listed in Fig. S13. The final column indicates orthologs in A. thaliana (See large tables file).
99

Table S20. Detailed analysis of cases of missing syntenic orthologs in one of the compared Brassica genomes and categories explaining its status.
Cases of missing orthologous CDS protein genes
Case 5: Case 6: Case 7: Case 8: Categories An-Ar- Co An-Ar-Cn Ar- Co -Cn An-Cn- Co (i) Sequence matches on random, non-anchored scaffolds
1102 110 650 33
(ii) Sequence matches outside synteny blocks
501 144 311 211
(iii) Synteny-excluded by OMG
349 288 274 475
(iv) Syntenic sequence match: a gene is predictable
146 788 167 455
v) Transposed: corresponding gene found not in syntenic position
148 84 90 96
(vi) Whole genes missing DNA sequences
393 53 270 51
(vii) Truncated genes: partial gene sequence loss
126 115 121 123
(viii) Pseudogenes: incorporation of stopcodons and frameshift mutations
37 45 40 75
Total 2802 1627 1923 1519
(i) Missing syntenic genes that show sequence matches on random, non-anchored scaffolds. (ii) Missing syntenic orthologs with DNA sequence matches outside synteny blocks (iii) Missing syntenic orthologs with syntenic DNA sequence matches but not retained by OMG. Here DNA sequence comparison shows that they are most likely syntenic. However they escaped the OMG synteny and BRH filtering that enforced ‘one-to-one’ rule (see Methods). (iv) Missing syntenic orthologs with syntenic DNA sequence matches and no annotation. We checked that a gene could be predicted if the same annotation method is used, which difference between B. napus and its parents is reflecting the “over-annotation” of the former than the latter. (v) Missing syntenic orthologs that transposed elsewhere in the genome. Here the corresponding gene was found (using BLAST) but not in syntenic position, which could be considered as having been moved or transposed. (vi) Whole gene DNA sequence loss. Here, the single missing B. napus homeologous or parental gene is considered deleted as DNA search against the whole genome identifies as best hit BLASTN DNA match, its corresponding homeolog (if in B. napus genome) or ortholog (if in B. rapa or B. oleracea genomes) gene (Supplementary Figure 23). (vii) Truncated genes: partial gene sequence loss. Here a partial gene sequence is available and fragments of the gene are truncated, as the start codon and stop codons are missing so the gene model cannot be reliably predicted. (viii) Pseudogenes: incorporation of stop codons and frame-shift mutations. These result in disruption of open reading frames and therefore the gene model cannot be reliably predicted.
100

Table S21. Status of syntenic genes where one homoeolog of An or Cn subgenome of B. napus is not found whereas the other homeolog and the two corresponding parental orthologs are found. Various validations were done through Illumina sequence read mapping on B. rapa and B. oleracea parental genomes and B. napus genome assemblies as well as through PCR of a subset of genes (See large tables file). Table S22. Confirmation of gene deletion observed in An and Cn homeologous subgenomes of B. napus as compared to their corresponding parental genomes (See large tables file). Table S23. Deletions and homeologous exchanges (HEs) of B. napus homeologous segments of two or more genes. Missing segments are characterized by the number and ids of missing genes as well as size estimated as the number of parental bases missing in B. napus (See large tables file).
101
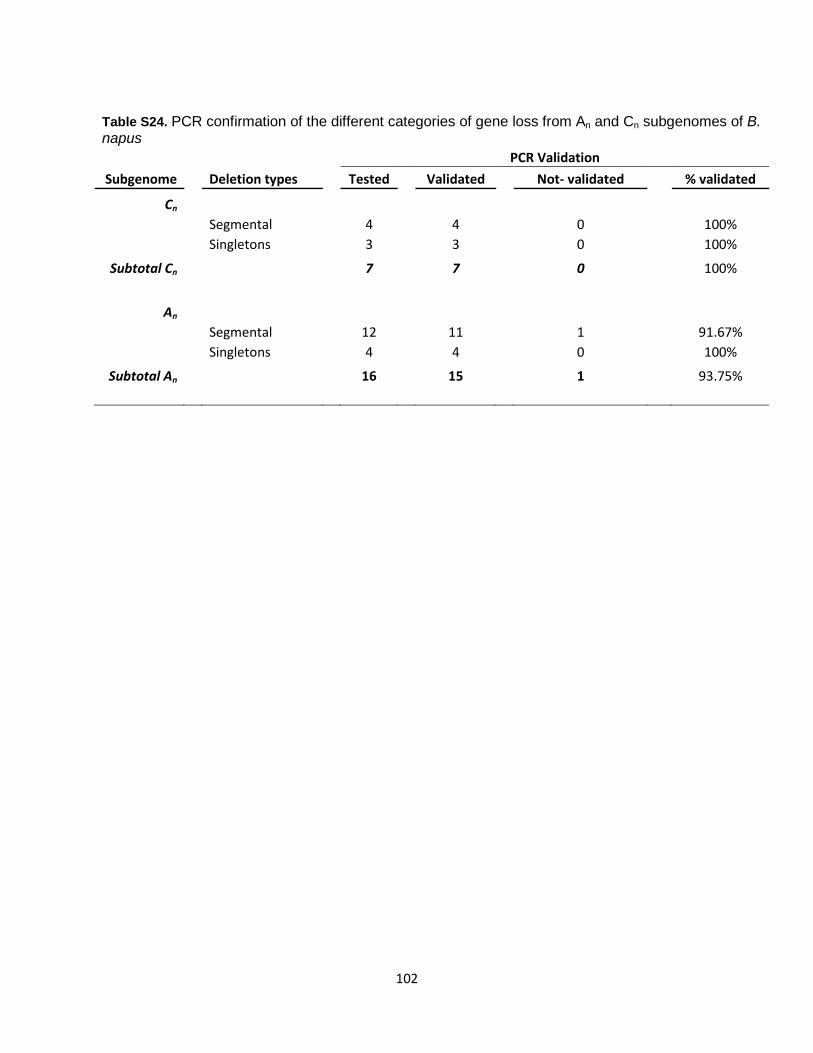
Table S24. PCR confirmation of the different categories of gene loss from An and Cn subgenomes of B. napus
PCR Validation
Subgenome
Deletion types
Tested
Validated
Not- validated
% validated
Cn
Segmental
4
4
0
100%
Singletons
3
3
0
100%
Subtotal Cn
7
7
0
100%
An
Segmental
12
11
1
91.67%
Singletons
4
4
0
100%
Subtotal An
16
15
1
93.75%
102

Table S25. Best BLAST N hit status of genes where both B. napus homeologs (Case 3) or both parental orthologs (Case 4) were not annotated. Cases of missing orthologous CDS protein gene
Case 3: AR-CO Case 4: An-Cn Categories Status of An Status of Cn Status of AR Status of CO
(i) Sequence matches on random, non-anchored scaffolds
198 224 13 25
(ii) Sequence matches outside synteny blocks
117 99 317 290
(iii) Synteny-excluded by OMG 117 106 351 364
(iv) Syntenic sequence match: a gene is predictable
41 23 152 162
(v) Transposed: corresponding gene not found in syntenic position
57 79 67 75
(vi) Whole gene DNA sequence loss 2 4 4 4
(vii) Truncated genes: partial gene sequence loss
60 55 80 71
(viii) Pseudogenes: incorporation of stopcodons and frameshift mutations
10 9 25 20
(ix) Not found-no matches 7 9 6 4
(x) Gmap-fail 2 3 - -
Total 611 611 1,015 1,015
Category i) to viii) are exactly the same as in Table S20. Two additional categories: (ix) No sequence match on the whole corresponding genome assembly.
(x) Gmap fail: Here BLAST suggested sequence similarities but did not pass Gmap threshold for calling a valid genic match.
103

Table S26. Overall list of B. napus ‘Darmor-bzh’ deleted genes with their putative function (See large tables file). Table S27. Confirmation of deletion (LOST) of the genes missing in reference assembly of B. rapa Chiifu and B. oleracea TO1000 (through mapping of Illumina read sequence on B. napus reference assembly) (See large tables file). Table S28. Genes confirmed deleted in B. napus ‘Darmor-bzh’ An genome and survey of their status in a diverse set of B. napus and B. rapa genotypes (See large tables file). Table S29. Genes confirmed deleted in B. napus ‘Darmor-bzh’ Cn genome and survey of their status in a diverse set of B. napus and B. oleracea genotypes (See large tables file). Table S30. Detailed description of Illumina sequence reads used to infer homeologous exchanges in various B. napus morphotypes.
Strain
Nbr of paired-end reads (size of the
reads)
Mapping on B napus ‘Darmor-bzh’
Depth threshold
Nbr of reads mapped
Nbr of reads mapped uniquely
Avg depth (10 kb
windows)
Median depth (10 kb
windows) ‘Darmor-bzh’ 94.2M (101nt) 176.5M 123.0M 13.44 12.97 19 ‘Aburamasari’ 68.8M (101nt) 114.7M 83.8M 12.57 12.10 18 ‘Avisol’ 43.0M (101nt) 74.7M 55.7M 8.25 7.89 11 ‘Bristol’ 63.7M (101nt) 112.2M 83.0M 11.75 11.37 17 ‘Yudal’ 80.6M (101nt) 133.1M 89.5M 12.94 12.45 18 resynthesized-h165 84.2M (100nt) 147.8M 72.8M 11.32 10.40 15 kale 71.1M (100nt) 128.1M 67.2M 9.86 9.12 13 swede 78.2M (100nt) 142.5M 70.7M 10.22 9.76 14
Table S31. Description of various homeologous exchanges (HEs) detected by mapping of raw genome assemblies (See large tables file).
104

Table S32. Position of homeologous exchanges (HEs) events observed in a representative set of B. napus genotypes as compared to the ‘Darmor-bzh’ reference genotype assembly. Each event is represented by a group of 4 lines, with positions on An, Cn, Ar and Co respectively, for events with double coverage on An, and with positions on Cn, An, Co and Ar respectively, for events with double coverage on Cn. All events are also summarized in Figure S19.B (See large tables file.). Table S33. List of parental (Brassica rapa or B. oleracea) genes involved in homeologous exchanges in B. napus ‘Darmor-bzh’ (as listed in Table S31), with their putative function (See large tables file.). Table S34. Description of HE events detected at the single gene scale, by comparing average depth of coverage of B. napus ‘Darmor-bzh’ reads on parental genes in triplets (one Brassica napus gene missing from annotation), the other with double coverage, i.e. collapsed in the B. napus assembly) (See large tables file). Table S35. Conversion sites inferred at the whole genome level. Approach Co as referencea Ar as referencea Numbers Percentages Numbers Percentages An2Cn 17508 0.60 14669 0.54 Cn2An 11657 0.40 12514 0.46
a Note that the genome-wide search approach requires high stringency statistical thresholds to mitigate false positives.
105

Table S36. Possible mutations in homologous genes. Mutation typea Number Percentage An2Cn 221,384 0.53 Cn2An 151,395 0.36
Ar/An mutation 14,848 0.04 Co/Cn mutation 11,602 0.03 Other mutation 17,355 0.04
a. “Other mutation” refers to any mutation that may have occurred in any gene of a studied homologous quartet but cannot be classified into the other listed types, such as An-Cn different sites. Ar/An mutations correspond to cases where Ar and An have different sites, but Co and Cn have the same sites, but different from those of Ar or An. Same definition for Co/Cn mutations. Table S37. List of duplicated genes showing evidence of gene conversion. In the table, we included homeologous duplicated genes of B. napus. A pair of duplicated genes includes one from the An subgenome, and the other from the Cn subgenome. The number of mutated sites, especially those likely converted sites from An to Cn, and from Cn to An, and converted ratios are listed. See Methods for details of conversion inference (See large tables file). Table S38. List of An to Cn and Cn to An converted genes that were confirmed by PCR (NC: not confirmed) (See large tables file).
106

Table S39. GO-slim terms enrichment of B. napus converted genes using Arabidopsis GO-slim. GO-slim terms
An to Cn Cn to An Total Number P-value Number P-value Number P-value
Mitochondria 44 0.0211 21 0.709 65 0.123 Ribosome 13 0.00921 12 0.00207 25 0.000197 Extracellular 36 0.125 37 0.00175 73 0.00293 Signal transduction 40 0.0221 25 0.192 65 0.0213
Structural molecule 15 0.0023 8 0.109 23 0.00232
Table S40. Description of RNA-Seq reads obtained by sequencing cDNA with the Illumina technology (paired ends reads) from major tissue and developmental stages of B. napus ‘Darmor-bzh’ (See large tables file).
107
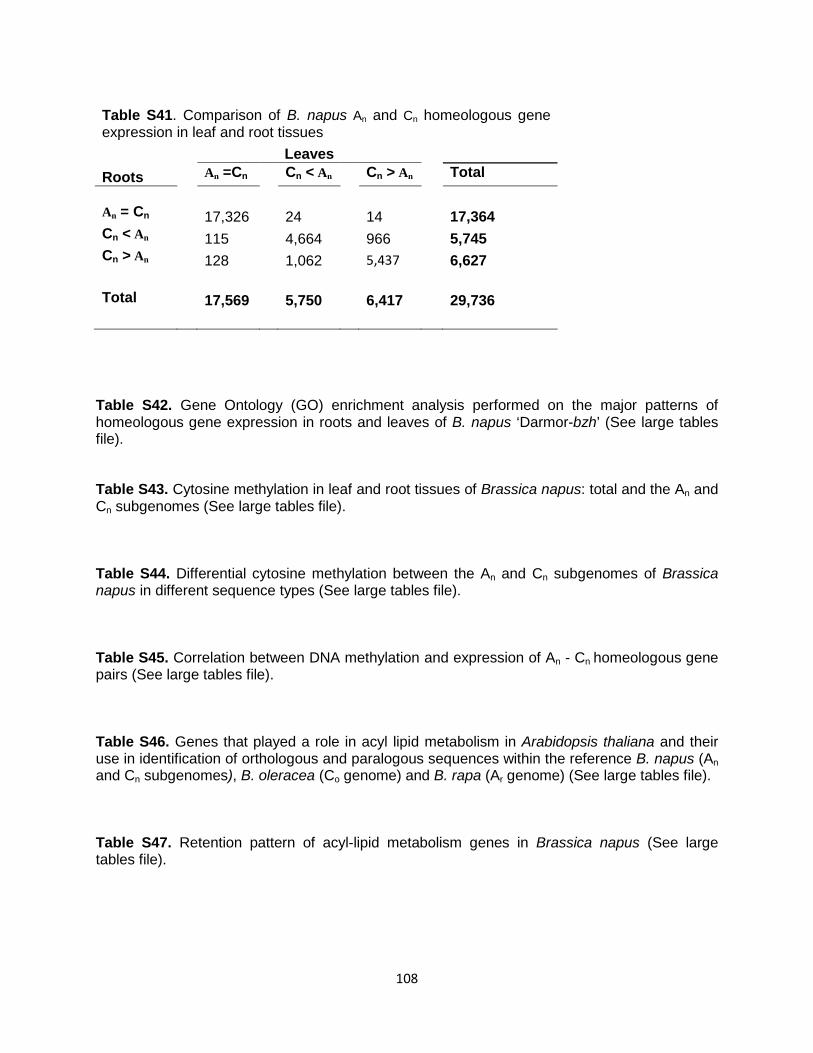
Table S41. Comparison of B. napus An and Cn homeologous gene expression in leaf and root tissues Leaves
Roots An =Cn Cn < An Cn > An Total An = Cn 17,326 24 14
17,364
Cn < An 115 4,664 966
5,745 Cn > An 128 1,062 5,437 6,627
Total 17,569 5,750 6,417 29,736
Table S42. Gene Ontology (GO) enrichment analysis performed on the major patterns of homeologous gene expression in roots and leaves of B. napus ‘Darmor-bzh’ (See large tables file). Table S43. Cytosine methylation in leaf and root tissues of Brassica napus: total and the An and Cn subgenomes (See large tables file). Table S44. Differential cytosine methylation between the An and Cn subgenomes of Brassica napus in different sequence types (See large tables file). Table S45. Correlation between DNA methylation and expression of An - Cn homeologous gene pairs (See large tables file). Table S46. Genes that played a role in acyl lipid metabolism in Arabidopsis thaliana and their use in identification of orthologous and paralogous sequences within the reference B. napus (An and Cn subgenomes), B. oleracea (Co genome) and B. rapa (Ar genome) (See large tables file). Table S47. Retention pattern of acyl-lipid metabolism genes in Brassica napus (See large tables file).
108

Table S48. Acyl lipid metabolism genes replaced through homeologous exchange
Mechanism of homeologous exchange Ar copy Co copy An copy Cn copy A. thaliana Acyl metabolic pathway Homeologous segment Bra040299 Bo1g147640
BnaAnng40880D (GSBRNA2G00028180001)
AT3G06960 Lipid Trafficking
Homeologous segment Bra040049 Bo1g145030
BnaC01g39480D (GSBRNA2G00018551001) AT3G08510 Phospholipid Signaling
Homeologous segment Bra040296 Bo1g147670
BnaA01g32550D (GSBRNA2G00057499001)
AT3G06860 Triacylglycerol & Fatty Acid Degradation
Homeologous segment Bra029258 Bo2g164160
BnaA02g33410D (GSBRNA2G00046065001)
AT5G62470 Fatty Acid Elongation and Wax Biosynthesis
Homeologous segment Bra034073 Bo1g144420
BnaA01g32210D (GSBRNA2G00072843001)
AT3G09560 Triacylglycerol Biosynthesis
Homeologous segment Bra032642 Bo8g117940
BnaCnng08760D (GSBRNA2G00065073001) AT1G01600 Cutin Synthesis & Transport 1
Homeologous segment Bra032670 Bo8g118320
BnaCnng09200D (GSBRNA2G00065129001) AT1G02205 Fatty Acid Elongation & Wax Biosynthesis
Homeologous segment Bra032643 Bo8g117950
BnaCnng08770D (GSBRNA2G00065074001) AT1G01610 Suberin Synthesis & Transport 1
Homeologous segment Bra034126 Bo1g143770
BnaA01g31580D (GSBRNA2G00072922001)
AT3G10550 Phospholipid Signaling
Homeologous segment Bra036722 Bo9g027650
BnaAnng30990D (GSBRNA2G00089227001)
AT2G19450 Triacylglycerol Biosynthesis
Homeologous segment Bra020082 Bo2g018590
BnaA02g04670D (GSBRNA2G00081393001)
AT5G20060 Phospholipid Signaling
Single gene exchange Bra002915 Bo9g120370
BnaA10g09530D (GSBRNA2G00095413001)
AT5G55340 Fatty Acid Elongation & Wax Biosynthesis
Single gene exchange Bra008472 Bo2g095970
BnaA02g19720D (GSBRNA2G00064232001)
AT1G80460 Eukaryotic Phospholipid Synthesis & Editing
109

Table S49. Comparative analysis of glucosinolate (GSL) biosynthesis and breakdown genes identified in B. napus (An and Cn subgenomes), B. oleracea (Co genome) and B. rapa (Ar genome) (See large tables file). Table S50. Comparative detection of NBS-LRR genes in the Ar and Co genomes of B. rapa, and B. oleracea and An, Cn of B. napus. Analysis was performed using MAST/MEME (Motif Alignment Search Tool/Multiple Em for Motif Elicitation) to identify predicted genes that contain motif homology to known disease resistance genes (148). Predicted genes were considered to be candidate CC or TNL NBS-LRRs if the reported MAST E values were less than 1E-24. Further disease resistance gene identification was performed using tBLASTn and BLASTp (maximum E- value 1E-5) using consensus sequences of CNL and TNL from plants (150, 151) attained from a previous study by Ameline-Torregrosa et al. (152) against the B. napus ‘Darmor-bzh’ genome. Candidate NBS-LRR proteins were provisionally assigned to either the CNL or TNL groups on the basis of similarity (See large tables file). Table S51. Comparative analysis of FLOWERING LOCUS C (FLC) paralogs identified in B. napus (An and Cn subgenomes), B. oleracea (Co genome) and B. rapa (Ar genome) and associations with homeologous exchanges in the 8 B. napus genotypes of the sequencing panel (See large tables file).
110

Additional Acknowledgments: This work was funded by the French ANR (Agence Nationale de la Recherche) 2009 (ANR-09-GENM-021) to B.C., P.W., D.B. and R.D., with additional funding from Sofi-Proteol in bioinformatic analysis (3-years salary of J.J), the National Basic Research Program of China (2011CB109300), the China Agriculture Research System (CARS-13) and the Special Fund for Agro-scientific Research in the Public Interest (201103016). Swede, kale and synthetic B. napus (H165) were sequenced by Syngenta, France within the German Federal Ministry of Education and Research (BMBF) project PreBreed-Yield 0319564. D. A. was funded by a Genopole (www.genopole.fr) (Evry, France) postdoctoral fellowship, D.T. and K.A. were funded by Natural Science and Engineering Research Council of Canada. We thank the company Biogemma, France, for supplying the segregating population ‘Avisol’ x ‘Aburamasari’ for genetic mapping (Sebastien Faure) and for valuable advice (Jorge Duarte); the company Euralis (Philippe Blanchard), France for advice in genetic mapping, Dr. C. Du and Dr.J. Caronna (Montclair State University, USA) for assistance in transposable elements annotation.
References and Notes 1. I. Al-Shehbaz, A generic and tribal synopsis of the Brassicaceae (Cruciferae). Taxon
61, 931 (2012).
2. U. Nagaharu, Genome analysis in Brassica with special reference to the experimental formation of B. napus and peculiar mode of fertilization. Jpn. J. Bot. 7, 389 (1935).
3. S. Prakash, “Cruciferous oilseeds in India,” in Brassica Crops and Wild Allies: Biology and Breeding, S. Tsunoda, K. Hinata, C. Gomez-Campo, Eds. (Japan Scientific Society Press, Tokyo, 1980), pp. 151–163.
4. C. J. Allender, G. J. King, Origins of the amphiploid species Brassica napus L. investigated by chloroplast and nuclear molecular markers. BMC Plant Biol. 10, 54 (2010). Medline doi:10.1186/1471-2229-10-54
5. C. Darwin, The Variation of Animals and Plants Under Domestication (Murray, London, 1905), vol. 2, pp. 398–403.
6. H. L. Liu, Rapeseed Genetics and Breeding (China Agricultural University, Beijing, 2000), pp. 1–81.
7. Supplementary materials for this article are available on Science Online.
8. R. Li, Y. Li, K. Kristiansen, J. Wang, SOAP: Short oligonucleotide alignment program. Bioinformatics 24, 713–714 (2008). Medline doi:10.1093/bioinformatics/btn025
9. X. Wang, H. Wang, J. Wang, R. Sun, J. Wu, S. Liu, Y. Bai, J. H. Mun, I. Bancroft, F. Cheng, S. Huang, X. Li, W. Hua, J. Wang, X. Wang, M. Freeling, J. C. Pires, A. H. Paterson, B. Chalhoub, B. Wang, A. Hayward, A. G. Sharpe, B. S. Park, B. Weisshaar, B. Liu, B. Li, B. Liu, C. Tong, C. Song, C. Duran, C. Peng, C. Geng, C. Koh, C. Lin, D. Edwards, D. Mu, D. Shen, E. Soumpourou, F. Li, F. Fraser, G. Conant, G. Lassalle, G. J. King, G. Bonnema, H. Tang, H. Wang, H. Belcram, H. Zhou, H. Hirakawa, H. Abe, H. Guo, H. Wang, H. Jin, I. A. Parkin, J. Batley, J. S.
111

Kim, J. Just, J. Li, J. Xu, J. Deng, J. A. Kim, J. Li, J. Yu, J. Meng, J. Wang, J. Min, J. Poulain, J. Wang, K. Hatakeyama, K. Wu, L. Wang, L. Fang, M. Trick, M. G. Links, M. Zhao, M. Jin, N. Ramchiary, N. Drou, P. J. Berkman, Q. Cai, Q. Huang, R. Li, S. Tabata, S. Cheng, S. Zhang, S. Zhang, S. Huang, S. Sato, S. Sun, S. J. Kwon, S. R. Choi, T. H. Lee, W. Fan, X. Zhao, X. Tan, X. Xu, Y. Wang, Y. Qiu, Y. Yin, Y. Li, Y. Du, Y. Liao, Y. Lim, Y. Narusaka, Y. Wang, Z. Wang, Z. Li, Z. Wang, Z. Xiong, Z. Zhang, The genome of the mesopolyploid crop species Brassica rapa. Nat. Genet. 43, 1035–1039 (2011). Medline doi:10.1038/ng.919
10. S. Liu, Y. Liu, X. Yang, C. Tong, D. Edwards, I. A. Parkin, M. Zhao, J. Ma, J. Yu, S. Huang, X. Wang, J. Wang, K. Lu, Z. Fang, I. Bancroft, T. J. Yang, Q. Hu, X. Wang, Z. Yue, H. Li, L. Yang, J. Wu, Q. Zhou, W. Wang, G. J. King, J. C. Pires, C. Lu, Z. Wu, P. Sampath, Z. Wang, H. Guo, S. Pan, L. Yang, J. Min, D. Zhang, D. Jin, W. Li, H. Belcram, J. Tu, M. Guan, C. Qi, D. Du, J. Li, L. Jiang, J. Batley, A. G. Sharpe, B. S. Park, P. Ruperao, F. Cheng, N. E. Waminal, Y. Huang, C. Dong, L. Wang, J. Li, Z. Hu, M. Zhuang, Y. Huang, J. Huang, J. Shi, D. Mei, J. Liu, T. H. Lee, J. Wang, H. Jin, Z. Li, X. Li, J. Zhang, L. Xiao, Y. Zhou, Z. Liu, X. Liu, R. Qin, X. Tang, W. Liu, Y. Wang, Y. Zhang, J. Lee, H. H. Kim, F. Denoeud, X. Xu, X. Liang, W. Hua, X. Wang, J. Wang, B. Chalhoub, A. H. Paterson, The Brassica oleracea genome reveals the asymmetrical evolution of polyploid genomes. Nat. Commun. 5, 3930 (2014). Medline doi:10.1038/ncomms4930
11. I. A. Parkin, C. Koh, H. Tang, S. J. Robinson, S. Kagale, W. E. Clarke, C. D. Town, J. Nixon, V. Krishnakumar, S. L. Bidwell, F. Denoeud, H. Belcram, M. G. Links, J. Just, C. Clarke, T. Bender, T. Huebert, A. S. Mason, C. J. Pires, G. Barker, J. Moore, P. G. Walley, S. Manoli, J. Batley, D. Edwards, M. N. Nelson, X. Wang, A. H. Paterson, G. King, I. Bancroft, B. Chalhoub, A. G. Sharpe, Transcriptome and methylome profiling reveals relics of genome dominance in the mesopolyploid Brassica oleracea. Genome Biol. 15, R77 (2014). Medline doi:10.1186/gb-2014-15-6-r77
12. A. H. Paterson, J. F. Wendel, H. Gundlach, H. Guo, J. Jenkins, D. Jin, D. Llewellyn, K. C. Showmaker, S. Shu, J. Udall, M. J. Yoo, R. Byers, W. Chen, A. Doron-Faigenboim, M. V. Duke, L. Gong, J. Grimwood, C. Grover, K. Grupp, G. Hu, T. H. Lee, J. Li, L. Lin, T. Liu, B. S. Marler, J. T. Page, A. W. Roberts, E. Romanel, W. S. Sanders, E. Szadkowski, X. Tan, H. Tang, C. Xu, J. Wang, Z. Wang, D. Zhang, L. Zhang, H. Ashrafi, F. Bedon, J. E. Bowers, C. L. Brubaker, P. W. Chee, S. Das, A. R. Gingle, C. H. Haigler, D. Harker, L. V. Hoffmann, R. Hovav, D. C. Jones, C. Lemke, S. Mansoor, M. ur Rahman, L. N. Rainville, A. Rambani, U. K. Reddy, J. K. Rong, Y. Saranga, B. E. Scheffler, J. A. Scheffler, D. M. Stelly, B. A. Triplett, A. Van Deynze, M. F. Vaslin, V. N. Waghmare, S. A. Walford, R. J. Wright, E. A. Zaki, T. Zhang, E. S. Dennis, K. F. Mayer, D. G. Peterson, D. S. Rokhsar, X. Wang, J. Schmutz, Repeated polyploidization of Gossypium genomes and the evolution of spinnable cotton fibres. Nature 492, 423–427 (2012). Medline doi:10.1038/nature11798
112

13. J. C. Schnable, N. M. Springer, M. Freeling, Differentiation of the maize subgenomes by genome dominance and both ancient and ongoing gene loss. Proc. Natl. Acad. Sci. U.S.A. 108, 4069–4074 (2011). Medline doi:10.1073/pnas.1101368108
14. H. Tang, M. R. Woodhouse, F. Cheng, J. C. Schnable, B. S. Pedersen, G. Conant, X. Wang, M. Freeling, J. C. Pires, Altered patterns of fractionation and exon deletions in Brassica rapa support a two-step model of paleohexaploidy. Genetics 190, 1563–1574 (2012). Medline doi:10.1534/genetics.111.137349
15. M. J. Yoo, E. Szadkowski, J. F. Wendel, Homoeolog expression bias and expression level dominance in allopolyploid cotton. Heredity 110, 171–180 (2013). Medline doi:10.1038/hdy.2012.94
16. D. C. Ilut, J. E. Coate, A. K. Luciano, T. G. Owens, G. D. May, A. Farmer, J. J. Doyle, A comparative transcriptomic study of an allotetraploid and its diploid progenitors illustrates the unique advantages and challenges of RNA-seq in plant species. Am. J. Bot. 99, 383–396 (2012). Medline doi:10.3732/ajb.1100312
17. R. J. Buggs, L. Zhang, N. Miles, J. A. Tate, L. Gao, W. Wei, P. S. Schnable, W. B. Barbazuk, P. S. Soltis, D. E. Soltis, Transcriptomic shock generates evolutionary novelty in a newly formed, natural allopolyploid plant. Curr. Biol. 21, 551–556 (2011). Medline doi:10.1016/j.cub.2011.02.016
18. O. Garsmeur, J. C. Schnable, A. Almeida, C. Jourda, A. D’Hont, M. Freeling, Two evolutionarily distinct classes of paleopolyploidy. Mol. Biol. Evol. 31, 448–454 (2014). Medline doi:10.1093/molbev/mst230
19. I. E. Sønderby, F. Geu-Flores, B. A. Halkier, Biosynthesis of glucosinolates—gene discovery and beyond. Trends Plant Sci. 15, 283–290 (2010). Medline doi:10.1016/j.tplants.2010.02.005
20. B. Wittkop, R. J. Snowdon, W. Friedt, Status and perspectives of breeding for en-hanced yield and quality of oilseed crops for Europe. Euphytica 170, 131–140 (2009). doi:10.1007/s10681-009-9940-5
21. R. Delourme, C. Falentin, B. F. Fomeju, M. Boillot, G. Lassalle, I. André, J. Duarte, V. Gauthier, N. Lucante, A. Marty, M. Pauchon, J. P. Pichon, N. Ribière, G. Trotoux, P. Blanchard, N. Rivière, J. P. Martinant, J. Pauquet, High-density SNP-based genetic map development and linkage disequilibrium assessment in Brassica napus L. BMC Genomics 14, 120 (2013). Medline doi:10.1186/1471-2164-14-120
22. X. Zou, I. Suppanz, H. Raman, J. Hou, J. Wang, Y. Long, C. Jung, J. Meng, Comparative analysis of FLC homologues in Brassicaceae provides insight into their role in the evolution of oilseed rape. PLOS ONE 7, e45751 (2012). Medline doi:10.1371/journal.pone.0045751
23. M. Lynch, A. Force, The probability of duplicate gene preservation by subfunctionalization. Genetics 154, 459–473 (2000). Medline
24. A. G. Sharpe, D. J. Lydiate, Mapping the mosaic of ancestral genotypes in a cultivar of oilseed rape (Brassica napus) selected via pedigree breeding. Genome 46, 461–468 (2003). Medline doi:10.1139/g03-031
113

25. N. Foisset, R. Delourme, P. Barret, M. Renard, Molecular tagging of the dwarf BREIZH (Bzh) gene in Brassica napus. Theor. Appl. Genet. 91, 756–761 (1995). Medline doi:10.1007/BF00220955
26. B. Chalhoub, H. Belcram, M. Caboche, Efficient cloning of plant genomes into bacterial artificial chromosome (BAC) libraries with larger and more uniform insert size. Plant Biotechnol. J. 2, 181–188 (2004). Medline doi:10.1111/j.1467-7652.2004.00065.x
27. J. S. Johnston, A. E. Pepper, A. E. Hall, Z. J. Chen, G. Hodnett, J. Drabek, R. Lopez, H. J. Price, Evolution of genome size in Brassicaceae. Ann. Bot. 95, 229–235 (2005). Medline doi:10.1093/aob/mci016
28. O. Jaillon, J. M. Aury, B. Noel, A. Policriti, C. Clepet, A. Casagrande, N. Choisne, S. Aubourg, N. Vitulo, C. Jubin, A. Vezzi, F. Legeai, P. Hugueney, C. Dasilva, D. Horner, E. Mica, D. Jublot, J. Poulain, C. Bruyère, A. Billault, B. Segurens, M. Gouyvenoux, E. Ugarte, F. Cattonaro, V. Anthouard, V. Vico, C. Del Fabbro, M. Alaux, G. Di Gaspero, V. Dumas, N. Felice, S. Paillard, I. Juman, M. Moroldo, S. Scalabrin, A. Canaguier, I. Le Clainche, G. Malacrida, E. Durand, G. Pesole, V. Laucou, P. Chatelet, D. Merdinoglu, M. Delledonne, M. Pezzotti, A. Lecharny, C. Scarpelli, F. Artiguenave, M. E. Pè, G. Valle, M. Morgante, M. Caboche, A. F. Adam-Blondon, J. Weissenbach, F. Quétier, P. Wincker, The grapevine genome sequence suggests ancestral hexaploidization in major angiosperm phyla. Nature 449, 463–467 (2007). Medline doi:10.1038/nature06148
29. J. M. Aury, C. Cruaud, V. Barbe, O. Rogier, S. Mangenot, G. Samson, J. Poulain, V. Anthouard, C. Scarpelli, F. Artiguenave, P. Wincker, High quality draft sequences for prokaryotic genomes using a mix of new sequencing technologies. BMC Genomics 9, 603 (2008). Medline doi:10.1186/1471-2164-9-603
30. R. Luo, B. Liu, Y. Xie, Z. Li, W. Huang, J. Yuan, G. He, Y. Chen, Q. Pan, Y. Liu, J. Tang, G. Wu, H. Zhang, Y. Shi, Y. Liu, C. Yu, B. Wang, Y. Lu, C. Han, D. W. Cheung, S. M. Yiu, S. Peng, Z. Xiaoqian, G. Liu, X. Liao, Y. Li, H. Yang, J. Wang, T. W. Lam, J. Wang, SOAPdenovo2: An empirically improved memory-efficient short-read de novo assembler. Gigascience 1, 18 (2012). Medline doi:10.1186/2047-217X-1-18
31. W. J. Kent, BLAT—the BLAST-like alignment tool. Genome Res. 12, 656–664 (2002). Medline doi:10.1101/gr.229202. Article published online before March 2002
32. R. Mott, EST_GENOME: A program to align spliced DNA sequences to unspliced genomic DNA. Comput. Appl. Biosci. 13, 477–478 (1997). Medline
33. T. Jesske, B. Olberg, A. Schierholt, H. C. Becker, Resynthesized lines from domesticated and wild Brassica taxa and their hybrids with B. napus L.: Genetic diversity and hybrid yield. Theor. Appl. Genet. 126, 1053–1065 (2013). Medline doi:10.1007/s00122-012-2036-y
34. N. Foisset, R. Delourme, P. Barret, N. Hubert, B. S. Landry, M. Renard, Molecular-mapping analysis in Brassica napus using isozyme, RAPD and RFLP markers on
114

a doubled-haploid progeny. Theor. Appl. Genet. 93, 1017–1025 (1996). Medline doi:10.1007/BF00230119
35. V. Lombard, R. Delourme, A consensus linkage map for rapeseed (Brassica napus L.): Construction and integration of three individual maps from DH populations. Theor. Appl. Genet. 103, 491–507 (2001). doi:10.1007/s001220100560
36. R. Delourme, C. Falentin, V. Huteau, V. Clouet, R. Horvais, B. Gandon, S. Specel, L. Hanneton, J. E. Dheu, M. Deschamps, E. Margale, P. Vincourt, M. Renard, Genetic control of oil content in oilseed rape (Brassica napus L.). Theor. Appl. Genet. 113, 1331–1345 (2006). Medline doi:10.1007/s00122-006-0386-z
37. J. Wang, D. J. Lydiate, I. A. Parkin, C. Falentin, R. Delourme, P. W. Carion, G. J. King, Integration of linkage maps for the Amphidiploid Brassica napus and comparative mapping with Arabidopsis and Brassica rapa. BMC Genomics 12, 101 (2011). Medline doi:10.1186/1471-2164-12-101
38. N. A. Baird, P. D. Etter, T. S. Atwood, M. C. Currey, A. L. Shiver, Z. A. Lewis, E. U. Selker, W. A. Cresko, E. A. Johnson, Rapid SNP discovery and genetic mapping using sequenced RAD markers. PLOS ONE 3, e3376 (2008). Medline doi:10.1371/journal.pone.0003376
39. B. Langmead, C. Trapnell, M. Pop, S. L. Salzberg, Ultrafast and memory-efficient alignment of short DNA sequences to the human genome. Genome Biol. 10, R25 (2009). Medline doi:10.1186/gb-2009-10-3-r25
40. H. Li, B. Handsaker, A. Wysoker, T. Fennell, J. Ruan, N. Homer, G. Marth, G. Abecasis, R. Durbin, 1000 Genome Project Data Processing Subgroup, The Sequence Alignment/Map format and SAMtools. Bioinformatics 25, 2078–2079 (2009). Medline doi:10.1093/bioinformatics/btp352
41. Y. Wu, P. R. Bhat, T. J. Close, S. Lonardi, Efficient and accurate construction of genetic linkage maps from the minimum spanning tree of a graph. PLOS Genet. 4, e1000212 (2008). Medline doi:10.1371/journal.pgen.1000212
42. S. de Givry, M. Bouchez, P. Chabrier, D. Milan, T. Schiex, CARHTA GENE: Multipopulation integrated genetic and radiation hybrid mapping. Bioinformatics 21, 1703–1704 (2005). Medline doi:10.1093/bioinformatics/bti222
43. A. Arcade, A. Labourdette, M. Falque, B. Mangin, F. Chardon, A. Charcosset, J. Joets, BioMercator: Integrating genetic maps and QTL towards discovery of candidate genes. Bioinformatics 20, 2324–2326 (2004). Medline doi:10.1093/bioinformatics/bth230
44. T. Wicker, F. Sabot, A. Hua-Van, J. L. Bennetzen, P. Capy, B. Chalhoub, A. Flavell, P. Leroy, M. Morgante, O. Panaud, E. Paux, P. SanMiguel, A. H. Schulman, A unified classification system for eukaryotic transposable elements. Nat. Rev. Genet. 8, 973–982 (2007). Medline doi:10.1038/nrg2165
45. M. Zhao, J. Du, F. Lin, C. Tong, J. Yu, S. Huang, X. Wang, S. Liu, J. Ma, Shifts in the evolutionary rate and intensity of purifying selection between two Brassica genomes revealed by analyses of orthologous transposons and relics of a whole genome triplication. Plant J. 76, 211–222 (2013). Medline
115

46. J. Jurka, V. V. Kapitonov, A. Pavlicek, P. Klonowski, O. Kohany, J. Walichiewicz, Repbase Update, a database of eukaryotic repetitive elements. Cytogenet. Genome Res. 110, 462–467 (2005). Medline doi:10.1159/000084979
47. T. Wicker, D. E. Matthews, B. Keller, TREP, a database for Triticeae repetitive elements. Trends Plant Sci. 7, 561–562 (2002). doi:10.1016/S1360-1385(02)02372-5
48. Z. Xu, H. Wang, LTR_FINDER: An efficient tool for the prediction of full-length LTR retrotransposons. Nucleic Acids Res. 35, W265–W268 (2007). Medline doi:10.1093/nar/gkm286
49. J. Ma, K. M. Devos, J. L. Bennetzen, Analyses of LTR-retrotransposon structures reveal recent and rapid genomic DNA loss in rice. Genome Res. 14, 860–869 (2004). Medline doi:10.1101/gr.1466204
50. D. Holligan, X. Zhang, N. Jiang, E. J. Pritham, S. R. Wessler, The transposable element landscape of the model legume Lotus japonicus. Genetics 174, 2215–2228 (2006). Medline doi:10.1534/genetics.106.062752
51. L. Yang, J. L. Bennetzen, Structure-based discovery and description of plant and animal Helitrons. Proc. Natl. Acad. Sci. U.S.A. 106, 12832–12837 (2009). Medline doi:10.1073/pnas.0905563106
52. A. F. A. Smit, R. Hubley, P. Green, RepeatMasker Open-3.0 (2010); www.repeatmasker.org.
53. E. Birney, M. Clamp, R. Durbin, GeneWise and Genomewise. Genome Res. 14, 988–995 (2004). Medline doi:10.1101/gr.1865504
54. G. Parra, E. Blanco, R. Guigó, GeneID in Drosophila. Genome Res. 10, 511–515 (2000). Medline doi:10.1101/gr.10.4.511
55. I. Korf, Gene finding in novel genomes. BMC Bioinformatics 5, 59 (2004). Medline doi:10.1186/1471-2105-5-59
56. R. Li, C. Yu, Y. Li, T. W. Lam, S. M. Yiu, K. Kristiansen, J. Wang, SOAP2: An improved ultrafast tool for short read alignment. Bioinformatics 25, 1966–1967 (2009). Medline doi:10.1093/bioinformatics/btp336
57. F. Denoeud, J. M. Aury, C. Da Silva, B. Noel, O. Rogier, M. Delledonne, M. Morgante, G. Valle, P. Wincker, C. Scarpelli, O. Jaillon, F. Artiguenave, Annotating genomes with massive-scale RNA sequencing. Genome Biol. 9, R175 (2008). Medline doi:10.1186/gb-2008-9-12-r175
58. K. L. Howe, T. Chothia, R. Durbin, GAZE: A generic framework for the integration of gene-prediction data by dynamic programming. Genome Res. 12, 1418–1427 (2002). Medline doi:10.1101/gr.149502
59. S. Hunter, P. Jones, A. Mitchell, R. Apweiler, T. K. Attwood, A. Bateman, T. Bernard, D. Binns, P. Bork, S. Burge, E. de Castro, P. Coggill, M. Corbett, U. Das, L. Daugherty, L. Duquenne, R. D. Finn, M. Fraser, J. Gough, D. Haft, N. Hulo, D. Kahn, E. Kelly, I. Letunic, D. Lonsdale, R. Lopez, M. Madera, J. Maslen, C. McAnulla, J. McDowall, C. McMenamin, H. Mi, P. Mutowo-
116

Muellenet, N. Mulder, D. Natale, C. Orengo, S. Pesseat, M. Punta, A. F. Quinn, C. Rivoire, A. Sangrador-Vegas, J. D. Selengut, C. J. Sigrist, M. Scheremetjew, J. Tate, M. Thimmajanarthanan, P. D. Thomas, C. H. Wu, C. Yeats, S. Y. Yong, InterPro in 2011: New developments in the family and domain prediction database. Nucleic Acids Res. 40, D306–D312 (2012). Medline doi:10.1093/nar/gkr948
60. T. D. Wu, S. Nacu, Fast and SNP-tolerant detection of complex variants and splicing in short reads. Bioinformatics 26, 873–881 (2010). Medline doi:10.1093/bioinformatics/btq057
61. X. Gan, O. Stegle, J. Behr, J. G. Steffen, P. Drewe, K. L. Hildebrand, R. Lyngsoe, S. J. Schultheiss, E. J. Osborne, V. T. Sreedharan, A. Kahles, R. Bohnert, G. Jean, P. Derwent, P. Kersey, E. J. Belfield, N. P. Harberd, E. Kemen, C. Toomajian, P. X. Kover, R. M. Clark, G. Rätsch, R. Mott, Multiple reference genomes and transcriptomes for Arabidopsis thaliana. Nature 477, 419–423 (2011). Medline doi:10.1038/nature10414
62. Y. Marquez, J. W. Brown, C. Simpson, A. Barta, M. Kalyna, Transcriptome survey reveals increased complexity of the alternative splicing landscape in Arabidopsis. Genome Res. 22, 1184–1195 (2012). Medline doi:10.1101/gr.134106.111
63. S. M. Kiełbasa, R. Wan, K. Sato, P. Horton, M. C. Frith, Adaptive seeds tame genomic sequence comparison. Genome Res. 21, 487–493 (2011). Medline doi:10.1101/gr.113985.110
64. H. Tang, E. Lyons, B. Pedersen, J. C. Schnable, A. H. Paterson, M. Freeling, Screening synteny blocks in pairwise genome comparisons through integer programming. BMC Bioinformatics 12, 102 (2011). Medline doi:10.1186/1471-2105-12-102
65. C. N. Dewey, Positional orthology: Putting genomic evolutionary relationships into context. Brief. Bioinform. 12, 401–412 (2011). Medline doi:10.1093/bib/bbr040
66. N. H. Putnam, M. Srivastava, U. Hellsten, B. Dirks, J. Chapman, A. Salamov, A. Terry, H. Shapiro, E. Lindquist, V. V. Kapitonov, J. Jurka, G. Genikhovich, I. V. Grigoriev, S. M. Lucas, R. E. Steele, J. R. Finnerty, U. Technau, M. Q. Martindale, D. S. Rokhsar, Sea anemone genome reveals ancestral eumetazoan gene repertoire and genomic organization. Science 317, 86–94 (2007). Medline doi:10.1126/science.1139158
67. C. Zheng, K. Swenson, E. Lyons, D. Sankoff, in Algorithms in Bioinformatics, T. Przytycka, M.-F. Sagot, Eds. (Springer-Verlag, Berlin, 2011), vol. 6833, pp. 364–375.
68. H. Li, R. Durbin, Fast and accurate long-read alignment with Burrows-Wheeler transform. Bioinformatics 26, 589–595 (2010). Medline doi:10.1093/bioinformatics/btp698
69. H. Tang, X. Wang, J. E. Bowers, R. Ming, M. Alam, A. H. Paterson, Unraveling ancient hexaploidy through multiply-aligned angiosperm gene maps. Genome Res. 18, 1944–1954 (2008). Medline doi:10.1101/gr.080978.108
117

70. X. Y. Wang, A. H. Paterson, Gene conversion in angiosperm genomes with an emphasis on genes duplicated by polyploidization. Genes 2, 1–20 (2011). Medline doi:10.3390/genes2010001
71. M. Nei, T. Gojobori, Simple methods for estimating the numbers of synonymous and nonsynonymous nucleotide substitutions. Mol. Biol. Evol. 3, 418–426 (1986). Medline
72. Z. Yang, PAML 4: Phylogenetic analysis by maximum likelihood. Mol. Biol. Evol. 24, 1586–1591 (2007). Medline doi:10.1093/molbev/msm088
73. J. Wang, Y. Long, B. Wu, J. Liu, C. Jiang, L. Shi, J. Zhao, G. J. King, J. Meng, The evolution of Brassica napus FLOWERING LOCUST paralogues in the context of inverted chromosomal duplication blocks. BMC Evol. Biol. 9, 271 (2009). Medline doi:10.1186/1471-2148-9-271
74. R Core Team, R: A language and environment for statistical computing (R Foundation for Statistical Computing, Vienna, 2014); www.R-project.org.
75. A. Mortazavi, B. A. Williams, K. McCue, L. Schaeffer, B. Wold, Mapping and quantifying mammalian transcriptomes by RNA-Seq. Nat. Methods 5, 621–628 (2008). Medline doi:10.1038/nmeth.1226
76. F. Rapaport, R. Khanin, Y. Liang, M. Pirun, A. Krek, P. Zumbo, C. E. Mason, N. D. Socci, D. Betel, Comprehensive evaluation of differential gene expression analysis methods for RNA-seq data. Genome Biol. 14, R95 (2013). Medline doi:10.1186/gb-2013-14-9-r95
77. C. Soneson, M. Delorenzi, A comparison of methods for differential expression analysis of RNA-seq data. BMC Bioinformatics 14, 91 (2013). Medline doi:10.1186/1471-2105-14-91
78. J. H. Bullard, E. Purdom, K. D. Hansen, S. Dudoit, Evaluation of statistical methods for normalization and differential expression in mRNA-Seq experiments. BMC Bioinformatics 11, 94 (2010). Medline doi:10.1186/1471-2105-11-94
79. M. A. Dillies, A. Rau, J. Aubert, C. Hennequet-Antier, M. Jeanmougin, N. Servant, C. Keime, G. Marot, D. Castel, J. Estelle, G. Guernec, B. Jagla, L. Jouneau, D. Laloë, C. Le Gall, B. Schaëffer, S. Le Crom, M. Guedj, F. Jaffrézic, A comprehensive evaluation of normalization methods for Illumina high-throughput RNA sequencing data analysis. Brief. Bioinform. 14, 671–683 (2013). Medline doi:10.1093/bib/bbs046
80. S. Anders, W. Huber, Differential expression analysis for sequence count data. Genome Biol. 11, R106 (2010). Medline doi:10.1186/gb-2010-11-10-r106
81. F. Krueger, S. R. Andrews, Bismark: A flexible aligner and methylation caller for Bisulfite-Seq applications. Bioinformatics 27, 1571–1572 (2011). Medline doi:10.1093/bioinformatics/btr167
82. A. Akalin, M. Kormaksson, S. Li, F. E. Garrett-Bakelman, M. E. Figueroa, A. Melnick, C. E. Mason, methylKit: A comprehensive R package for the analysis of
118
genome-wide DNA methylation profiles. Genome Biol. 13, R87 (2012). Medline doi:10.1186/gb-2012-13-10-r87
83. S. D. Michaels, R. M. Amasino, FLOWERING LOCUS C encodes a novel MADS domain protein that acts as a repressor of flowering. Plant Cell 11, 949–956 (1999). Medline doi:10.1105/tpc.11.5.949
84. Y. Li-Beisson, B. Shorrosh, F. Beisson, M. X. Andersson, V. Arondel, P. D. Bates, S. Baud, D. Bird, A. DeBono, T. P. Durrett, R. B. Franke, I. A. Graham, K. Katayama, A. A. Kelly, T. Larson, J. E. Markham, M. Miquel, I. Molina, I. Nishida, O. Rowland, L. Samuels, K. M. Schmid, H.Wada, R. Welti, C. Xu, R. Zallot, J. Ohlrogge, Acyl-lipid metabolism. The Arabidopsis Book 8, e0133 (2010); 10.1199/tab.0133.
85. S. F. Altschul, T. L. Madden, A. A. Schäffer, J. Zhang, Z. Zhang, W. Miller, D. J. Lipman, Gapped BLAST and PSI-BLAST: A new generation of protein database search programs. Nucleic Acids Res. 25, 3389–3402 (1997). Medline doi:10.1093/nar/25.17.3389
86. T. L. Bailey, M. Boden, F. A. Buske, M. Frith, C. E. Grant, L. Clementi, J. Ren, W. W. Li, W. S. Noble, MEME SUITE: Tools for motif discovery and searching. Nucleic Acids Res. 37, W202–W208 (2009). Medline doi:10.1093/nar/gkp335
87. F. Jupe, L. Pritchard, G. J. Etherington, K. Mackenzie, P. J. Cock, F. Wright, S. K. Sharma, D. Bolser, G. J. Bryan, J. D. Jones, I. Hein, Identification and localisation of the NB-LRR gene family within the potato genome. BMC Genomics 13, 75 (2012). Medline doi:10.1186/1471-2164-13-75
88. S. B. Cannon, A. Mitra, A. Baumgarten, N. D. Young, G. May, The roles of segmental and tandem gene duplication in the evolution of large gene families in Arabidopsis thaliana. BMC Plant Biol. 4, 10 (2004). Medline doi:10.1186/1471-2229-4-10
89. S. B. Cannon, H. Zhu, A. M. Baumgarten, R. Spangler, G. May, D. R. Cook, N. D. Young, Diversity, distribution, and ancient taxonomic relationships within the TIR and non-TIR NBS-LRR resistance gene subfamilies. J. Mol. Evol. 54, 548–562 (2002). Medline doi:10.1007/s00239-001-0057-2
90. C. Ameline-Torregrosa, B. B. Wang, M. S. O’Bleness, S. Deshpande, H. Zhu, B. Roe, N. D. Young, S. B. Cannon, Identification and characterization of nucleotide-binding site-leucine-rich repeat genes in the model plant Medicago truncatula. Plant Physiol. 146, 5–21 (2008). Medline doi:10.1104/pp.107.104588
91. L. H. Rieseberg, J. H. Willis, Plant speciation. Science 317, 910–914 (2007). Medline doi:10.1126/science.1137729
92. J. J. Doyle, L. E. Flagel, A. H. Paterson, R. A. Rapp, D. E. Soltis, P. S. Soltis, J. F. Wendel, Evolutionary genetics of genome merger and doubling in plants. Annu. Rev. Genet. 42, 443–461 (2008). Medline doi:10.1146/annurev.genet.42.110807.091524
93. A. R. Leitch, I. J. Leitch, Genomic plasticity and the diversity of polyploid plants. Science 320, 481–483 (2008). Medline doi:10.1126/science.1153585
119

94. D. E. Soltis, V. A. Albert, J. Leebens-Mack, C. D. Bell, A. H. Paterson, C. Zheng, D. Sankoff, C. W. Depamphilis, P. K. Wall, P. S. Soltis, Polyploidy and angiosperm diversification. Am. J. Bot. 96, 336–348 (2009). Medline doi:10.3732/ajb.0800079
95. A. Bombarely, H. G. Rosli, J. Vrebalov, P. Moffett, L. A. Mueller, G. B. Martin, A draft genome sequence of Nicotiana benthamiana to enhance molecular plant-microbe biology research. Mol. Plant Microbe Interact. 25, 1523–1530 (2012). Medline doi:10.1094/MPMI-06-12-0148-TA
96. N. Sierro, J. N. Battey, S. Ouadi, N. Bakaher, L. Bovet, A. Willig, S. Goepfert, M. C. Peitsch, N. V. Ivanov, The tobacco genome sequence and its comparison with those of tomato and potato. Nat. Commun. 5, 3833 (2014). Medline doi:10.1038/ncomms4833
97. F. Li, G. Fan, K. Wang, F. Sun, Y. Yuan, G. Song, Q. Li, Z. Ma, C. Lu, C. Zou, W. Chen, X. Liang, H. Shang, W. Liu, C. Shi, G. Xiao, C. Gou, W. Ye, X. Xu, X. Zhang, H. Wei, Z. Li, G. Zhang, J. Wang, K. Liu, R. J. Kohel, R. G. Percy, J. Z. Yu, Y. X. Zhu, J. Wang, S. Yu, Genome sequence of the cultivated cotton Gossypium arboreum. Nat. Genet. 46, 567–572 (2014). Medline doi:10.1038/ng.2987
98. H. Hirakawa, K. Shirasawa, S. Kosugi, K. Tashiro, S. Nakayama, M. Yamada, M. Kohara, A. Watanabe, Y. Kishida, T. Fujishiro, H. Tsuruoka, C. Minami, S. Sasamoto, M. Kato, K. Nanri, A. Komaki, T. Yanagi, Q. Guoxin, F. Maeda, M. Ishikawa, S. Kuhara, S. Sato, S. Tabata, S. N. Isobe, Dissection of the octoploid strawberry genome by deep sequencing of the genomes of Fragaria species. DNA Res. 21, 169–181 (2014). Medline doi:10.1093/dnares/dst049
99. R. Inaba, T. Nishio, Phylogenetic analysis of Brassiceae based on the nucleotide sequences of the S-locus related gene, SLR1. Theor. Appl. Genet. 105, 1159–1165 (2002). Medline doi:10.1007/s00122-002-0968-3
100. F. Cheung, M. Trick, N. Drou, Y. P. Lim, J. Y. Park, S. J. Kwon, J. A. Kim, R. Scott, J. C. Pires, A. H. Paterson, C. Town, I. Bancroft, Comparative analysis between homoeologous genome segments of Brassica napus and its progenitor species reveals extensive sequence-level divergence. Plant Cell 21, 1912–1928 (2009). Medline doi:10.1105/tpc.108.060376
101. C. Feschotte, S. R. Wessler, Mariner-like transposases are widespread and diverse in flowering plants. Proc. Natl. Acad. Sci. U.S.A. 99, 280–285 (2002). Medline doi:10.1073/pnas.022626699
102. T. Lu, G. Lu, D. Fan, C. Zhu, W. Li, Q. Zhao, Q. Feng, Y. Zhao, Y. Guo, W. Li, X. Huang, B. Han, Function annotation of the rice transcriptome at single-nucleotide resolution by RNA-seq. Genome Res. 20, 1238–1249 (2010). Medline doi:10.1101/gr.106120.110
103. J. M. Chen, D. N. Cooper, N. Chuzhanova, C. Férec, G. P. Patrinos, Gene conversion: Mechanisms, evolution and human disease. Nat. Rev. Genet. 8, 762–775 (2007). Medline doi:10.1038/nrg2193
120

104. C. H. Hsu, Y. Zhang, R. C. Hardison, NISC Comparative Sequencing Program, E. D. Green, W. Miller, An effective method for detecting gene conversion events in whole genomes. J. Comput. Biol. 17, 1281–1297 (2010). Medline doi:10.1089/cmb.2010.0103
105. J. Jacquemin, C. Chaparro, M. Laudié, A. Berger, F. Gavory, J. L. Goicoechea, R. A. Wing, R. Cooke, Long-range and targeted ectopic recombination between the two homeologous chromosomes 11 and 12 in Oryza species. Mol. Biol. Evol. 28, 3139–3150 (2011). Medline doi:10.1093/molbev/msr144
106. J. A. Udall, P. A. Quijada, T. C. Osborn, Detection of chromosomal rearrangements derived from homologous recombination in four mapping populations of Brassica napus L. Genetics 169, 967–979 (2005). Medline doi:10.1534/genetics.104.033209
107. A. G. Sharpe, I. A. Parkin, D. J. Keith, D. J. Lydiate, Frequent nonreciprocal translocations in the amphidiploid genome of oilseed rape (Brassica napus). Genome 38, 1112–1121 (1995). Medline doi:10.1139/g95-148
108. J. T. Page, M. D. Huynh, Z. S. Liechty, K. Grupp, D. Stelly, A. M. Hulse, H. Ashrafi, A. Van Deynze, J. F. Wendel, J. A. Udall, Insights into the evolution of cotton diploids and polyploids from whole-genome re-sequencing. G3 Genes, Genomes, Genetics 3, 1809–1818 (2013). Medline doi:10.1534/g3.113.007229
109. J. A. Birchler, R. A. Veitia, The gene balance hypothesis: Implications for gene regulation, quantitative traits and evolution. New Phytol. 186, 54–62 (2010). Medline doi:10.1111/j.1469-8137.2009.03087.x
110. J. A. Birchler, Insights from paleogenomic and population studies into the consequences of dosage sensitive gene expression in plants. Curr. Opin. Plant Biol. 15, 544–548 (2012). Medline doi:10.1016/j.pbi.2012.08.005
111. L. A. Sakhno, [Fatty acid composition variability of rapeseed oil: Classical selection and biotechnology]. Tsitol. Genet. 44, 70–80 (2010). Medline
112. Y. Li-Beisson, B. Shorrosh, F. Beisson, M. X. Andersson, V. Arondel, P. D. Bates, S. Baud, D. Bird, A. DeBono, T. P. Durrett, R. B. Franke, I. A. Graham, K. Katayama, A. A. Kelly, T. Larson, J. E. Markham, M. Miquel, I. Molina, I. Nishida, O. Rowland, L. Samuels, K. M. Schmid, H.Wada, R. Welti, C. Xu, R. Zallot, J. Ohlrogge, Acyl-lipid metabolism. The Arabidopsis Book 11, e0161 (2013); 10.1199/tab.0161.
113. J. Schmutz, S. B. Cannon, J. Schlueter, J. Ma, T. Mitros, W. Nelson, D. L. Hyten, Q. Song, J. J. Thelen, J. Cheng, D. Xu, U. Hellsten, G. D. May, Y. Yu, T. Sakurai, T. Umezawa, M. K. Bhattacharyya, D. Sandhu, B. Valliyodan, E. Lindquist, M. Peto, D. Grant, S. Shu, D. Goodstein, K. Barry, M. Futrell-Griggs, B. Abernathy, J. Du, Z. Tian, L. Zhu, N. Gill, T. Joshi, M. Libault, A. Sethuraman, X. C. Zhang, K. Shinozaki, H. T. Nguyen, R. A. Wing, P. Cregan, J. Specht, J. Grimwood, D. Rokhsar, G. Stacey, R. C. Shoemaker, S. A. Jackson, Genome sequence of the palaeopolyploid soybean. Nature 463, 178–183 (2010). Medline doi:10.1038/nature08670
121

114. R. Singh, M. Ong-Abdullah, E. T. Low, M. A. Manaf, R. Rosli, R. Nookiah, L. C. Ooi, S. E. Ooi, K. L. Chan, M. A. Halim, N. Azizi, J. Nagappan, B. Bacher, N. Lakey, S. W. Smith, D. He, M. Hogan, M. A. Budiman, E. K. Lee, R. DeSalle, D. Kudrna, J. L. Goicoechea, R. A. Wing, R. K. Wilson, R. S. Fulton, J. M. Ordway, R. A. Martienssen, R. Sambanthamurthi, Oil palm genome sequence reveals divergence of interfertile species in Old and New worlds. Nature 500, 335–339 (2013). Medline doi:10.1038/nature12309
115. N. Wang, L. Shi, F. Tian, H. Ning, X. Wu, Y. Long, J. Meng, Assessment of FAE1 polymorphisms in three Brassica species using EcoTILLING and their association with differences in seed erucic acid contents. BMC Plant Biol. 10, 137 (2010). Medline doi:10.1186/1471-2229-10-137
116. R. O. Vles, G. M. Bijster, W. G. Timmer, Nutritional evaluation of low-erucic-acid rapeseed oils. Arch. Toxicol. Suppl. 1, 23–32 (1978). Medline doi:10.1007/978-3-642-66896-8_3
117. D. J. Kliebenstein, Secondary metabolites and plant/environment interactions: A view through Arabidopsis thaliana tinged glasses. Plant Cell Environ. 27, 675–684 (2004). doi:10.1111/j.1365-3040.2004.01180.x
118. G. Shen, T. O. Khor, R. Hu, S. Yu, S. Nair, C. T. Ho, B. S. Reddy, M. T. Huang, H. L. Newmark, A. N. Kong, Chemoprevention of familial adenomatous polyposis by natural dietary compounds sulforaphane and dibenzoylmethane alone and in combination in ApcMin/+ mouse. Cancer Res. 67, 9937–9944 (2007). Medline doi:10.1158/0008-5472.CAN-07-1112
119. X. Qian, T. Melkamu, P. Upadhyaya, F. Kassie, Indole-3-carbinol inhibited tobacco smoke carcinogen-induced lung adenocarcinoma in A/J mice when administered during the post-initiation or progression phase of lung tumorigenesis. Cancer Lett. 311, 57–65 (2011). Medline doi:10.1016/j.canlet.2011.06.023
120. N. Bellostas, P. Kachlickib, J. C. Sørensena, H. Sørensen, Glucosinolate profiling of seeds and sprouts of B. oleracea varieties used for food. Sci. Hortic. (Amsterdam) 114, 234–242 (2007). doi:10.1016/j.scienta.2007.06.015
121. B. A. Halkier, J. Gershenzon, Biology and biochemistry of glucosinolates. Annu. Rev. Plant Biol. 57, 303–333 (2006). Medline doi:10.1146/annurev.arplant.57.032905.105228
122. N. Nesi, R. Delourme, M. Brégeon, C. Falentin, M. Renard, Genetic and molecular approaches to improve nutritional value of Brassica napus L. seed. C. R. Biol. 331, 763–771 (2008). Medline doi:10.1016/j.crvi.2008.07.018
123. J. Feng, Y. Long, L. Shi, J. Shi, G. Barker, J. Meng, Characterization of metabolite quantitative trait loci and metabolic networks that control glucosinolate concentration in the seeds and leaves of Brassica napus. New Phytol. 193, 96–108 (2012). Medline doi:10.1111/j.1469-8137.2011.03890.x
124. A. L. Harper, M. Trick, J. Higgins, F. Fraser, L. Clissold, R. Wells, C. Hattori, P. Werner, I. Bancroft, Associative transcriptomics of traits in the polyploid crop
122

species Brassica napus. Nat. Biotechnol. 30, 798–802 (2012). Medline doi:10.1038/nbt.2302
125. J. D. Palmer, C. R. Shields, D. B. Cohen, T. J. Orton, Chloroplast DNA evolution and the origin of amphidiploid Brassica species. Theor. Appl. Genet. 65, 181–189 (1983). Medline doi:10.1007/BF00308062
126. H. H. Nour-Eldin, T. G. Andersen, M. Burow, S. R. Madsen, M. E. Jørgensen, C. E. Olsen, I. Dreyer, R. Hedrich, D. Geiger, B. A. Halkier, NRT/PTR transporters are essential for translocation of glucosinolate defence compounds to seeds. Nature 488, 531–534 (2012). Medline doi:10.1038/nature11285
127. H. Wan, W. Yuan, Q. Ye, R. Wang, M. Ruan, Z. Li, G. Zhou, Z. Yao, J. Zhao, S. Liu, Y. Yang, Analysis of TIR- and non-TIR-NBS-LRR disease resistance gene analogous in pepper: Characterization, genetic variation, functional divergence and expression patterns. BMC Genomics 13, 502 (2012). Medline doi:10.1186/1471-2164-13-502
128. J. Ellis, P. Dodds, T. Pryor, Structure, function and evolution of plant disease resistance genes. Curr. Opin. Plant Biol. 3, 278–284 (2000). Medline doi:10.1016/S1369-5266(00)00080-7
129. B. C. Meyers, A. Kozik, A. Griego, H. Kuang, R. W. Michelmore, Genome-wide analysis of NBS-LRR-encoding genes in Arabidopsis. Plant Cell 15, 809–834 (2003). Medline doi:10.1105/tpc.009308
130. S. H. Hulbert, C. A. Webb, S. M. Smith, Q. Sun, Resistance gene complexes: Evolution and utilization. Annu. Rev. Phytopathol. 39, 285–312 (2001). Medline doi:10.1146/annurev.phyto.39.1.285
131. J. Bai, L. A. Pennill, J. Ning, S. W. Lee, J. Ramalingam, C. A. Webb, B. Zhao, Q. Sun, J. C. Nelson, J. E. Leach, S. H. Hulbert, Diversity in nucleotide binding site-leucine-rich repeat genes in cereals. Genome Res. 12, 1871–1884 (2002). Medline doi:10.1101/gr.454902
132. E. Richly, J. Kurth, D. Leister, Mode of amplification and reorganization of resistance genes during recent Arabidopsis thaliana evolution. Mol. Biol. Evol. 19, 76–84 (2002). Medline doi:10.1093/oxfordjournals.molbev.a003984
133. J. H. Mun, H. J. Yu, S. Park, B. S. Park, Genome-wide identification of NBS-encoding resistance genes in Brassica rapa. Mol. Genet. Genomics 282, 617–631 (2009). Medline doi:10.1007/s00438-009-0492-0
134. J. G. Vicente, G. J. King, Characterisation of disease resistance gene-like sequences in Brassica oleracea L. Theor. Appl. Genet. 102, 555–563 (2001). doi:10.1007/s001220051682
135. A. Kohler, C. Rinaldi, S. Duplessis, M. Baucher, D. Geelen, F. Duchaussoy, B. C. Meyers, W. Boerjan, F. Martin, Genome-wide identification of NBS resistance genes in Populus trichocarpa. Plant Mol. Biol. 66, 619–636 (2008). Medline doi:10.1007/s11103-008-9293-9
123

136. B. Monosi, R. J. Wisser, L. Pennill, S. H. Hulbert, Full-genome analysis of resistance gene homologues in rice. Theor. Appl. Genet. 109, 1434–1447 (2004). Medline doi:10.1007/s00122-004-1758-x
137. S. Yang, X. Zhang, J. X. Yue, D. Tian, J. Q. Chen, Recent duplications dominate NBS-encoding gene expansion in two woody species. Mol. Genet. Genomics 280, 187–198 (2008). Medline doi:10.1007/s00438-008-0355-0
138. B. W. Porter, M. Paidi, R. Ming, M. Alam, W. T. Nishijima, Y. J. Zhu, Genome-wide analysis of Carica papaya reveals a small NBS resistance gene family. Mol. Genet. Genomics 281, 609–626 (2009). Medline doi:10.1007/s00438-009-0434-x
139. T. Zhou, Y. Wang, J.-Q. Chen, H. Araki, Z. Jing, K. Jiang, J. Shen, D. Tian, Genome-wide identification of NBS genes in japonica rice reveals significant expansion of divergent non-TIR NBS-LRR genes. Mol. Genet. Genomics 271, 402–415 (2004). Medline doi:10.1007/s00438-004-0990-z
140. S. R. Rimmer, Resistance genes to Leptosphaeria maculans in Brassica napus. Can. J. Plant Pathol. 28 (suppl. 1), S288 (2006). doi:10.1080/07060660609507386
141. R. Tollenaere, A. Hayward, J. Dalton-Morgan, E. Campbell, J. R. Lee, M. T. Lorenc, S. Manoli, J. Stiller, R. Raman, H. Raman, D. Edwards, J. Batley, Identification and characterization of candidate Rlm4 blackleg resistance genes in Brassica napus using next-generation sequencing. Plant Biotechnol. J. 10, 709–715 (2012). Medline doi:10.1111/j.1467-7652.2012.00716.x
142. H. Liu, Origin and evolution of rapeseeds. Acta Agron. Sin. 10, 9 (1984).
143. V. G. Sun, The evolution of taxonomic characters cultivated Brassica with a key to species and varieties. Bull. Torrey Bot. Club 73, 244 (1946). doi:10.2307/2481668
144. C. Heiser, Aspects of unconscious selection and the evolution of domesticated plants. Euphytica 37, 77–81 (1988). doi:10.1007/BF00037227
145. R. T. Gaeta, J. C. Pires, F. Iniguez-Luy, E. Leon, T. C. Osborn, Genomic changes in resynthesized Brassica napus and their effect on gene expression and phenotype. Plant Cell 19, 3403–3417 (2007). Medline doi:10.1105/tpc.107.054346
124