supplementary materials for - echopraxia · supplementary materials for . ... laura lapham, marcus...
TRANSCRIPT

www.sciencemag.org/cgi/content/full/339/6125/1305/DC1
Supplementary Materials for
Evidence for Microbial Carbon and Sulfur Cycling in Deeply Buried Ridge Flank Basalt
Mark A. Lever,* Olivier Rouxel, Jeffrey C. Alt, Nobumichi Shimizu, Shuhei Ono, Rosalind M. Coggon, Wayne C. Shanks, III, Laura Lapham, Marcus Elvert, Xavier Prieto-Mollar, Kai-Uwe Hinrichs, Fumio Inagaki, Andreas Teske*
*To whom correspondence should be addressed. E-mail: [email protected] (M.A.L.); [email protected] (A.T.)
Published 15 March 2013, Science 339, 1305 (2013) DOI: 10.1126/science.1229240
This PDF file includes:
Materials and Methods Figs. S1 to S9 Tables S1 to S13 References

2
Materials and Methods Sample collection. Basalt cores from borehole U1301B were sampled using a
Rotary Core Barrel (RCB) (9). Freshly recovered, intact whole-round basalt cores were decontaminated, cracked aseptically, and subsampled to measure drilling fluid contamination (31). For DNA extractions, only rock samples were used in which drilling fluid contamination was minimal (<2 contaminant cells g-1 basalt) (31). This limited analyses to rocks with small, smectite-dominated cross-cutting veins, which – unlike carbonate-dominated major veins - remained intact during drilling, and could be cracked open and aseptically sampled shipboard after core recovery. All processed samples were stored at -80°C prior to extraction of DNA in the home laboratory.
DNA Extraction. Using sterile spatulas, 2-4 cm2 (0.3-0.5 g) of inner vein surfaces were scraped off and DNA extracted following the same protocol as previously for RNA (32) except that the sodium phosphate (NaH2PO4) concentration of the extraction buffer was raised to 120 µM, the pH of the extraction buffer and phenol increased to 8.0, and bead-beating reduced to 15 s at a speed of 4.0. Negative controls containing no basalt samples were run in parallel to check for contamination of extraction reagents. Samples and controls were purified with the PowerClean DNA Clean-Up Kit (MOBIO laboratories, Carlsbad, CA).
Primer Selection and PCR Amplification. mcrA was PCR-amplified using the mcrIRD and ANME-1-mcrI primer pairs. These primer pairs target all known and several novel mcrA gene clusters when used complementarily, as shown in extensive tests with marine sediment samples (33). dsrB was PCR-amplified by nested PCR with published external primers (DSR1F/4R) (14), and a newly designed primer mixture used internally (dsrB F1a-h/4RSI1a-f), after tests with published primers had produced negative results (Tables S12 and S13). The PCR protocol consisted of (1) 1×2 min denaturation (98°C), (2) 40× (a) 30s denaturation (95°C), (b) 30s annealing (mcrIRD: 55°C; ANME-1-mcrI: 63°C; DSR1F/4R: 54°C, dsrB F1a-h/4RSI1a-f: 56°C), (c) 1 min extension (72°C), and (3) 1×5 min extension (72°C). In each PCR assay, negative controls for contamination of extraction and PCR reagents were run and found to be negative.
Cloning, sequencing, and phylogenetic analyses. PCR fragments were purified in a 2% low-melting point agarose gel and agarose removed with a S.N.A.P. MiniPrep Kit. Purified DNA was cloned and inserted into electrocompetent E. coli using the TOPO TA Kit (both kits by Invitrogen, Carlsbad, USA). All trees were constructed with nucleotides in ARB Neighbour Joining using Jukes-Cantor correction (34).
Nucleotide sequence accession numbers. The GenBank nucleotide accession numbers are GU182109-GU182110, and JX465656-JX465658.
Solid-phase S Analyses. Contents and δ34S-compositions of bulk S pools (AVS, CRS, SO4-S) were analyzed on rock powders using published protocols (5, 23).
The δ34S of pyrite grains was measured on polished rock thin-sections by SIMS using the mono-collection Cameca IMS 1280 (35), and by LA-MC-ICPMS (Laser Ablation Multiple Collector Inductively Coupled Plasma Mass Spectrometry) using the NewWave UP213 laser coupled to the Neptune (Thermo) MC-ICP-MS (36). For both techniques, the minimum grain diameter for δ34S-determination was 10µm. In certain samples (e.g. 14R-1, 17R-1, 19R-1), pyrite grains were measured with SIMS and LA-

3
MC-ICPMS and showed agreement within analytical uncertainties. Details of both techniques are outlined in the following paragraphs.
For the SIMS technique, a beam of 133Cs+ ions was used for sputter-ionizing S as negatively charged secondary ions from pyrite grains. A mass resolving power (MRP) of ~5000 was used with a primary Cs+ beam current switched to a spot of ~2 mm diameter with a current of ~6 pA. Peak calibration and pre-sputtering was made for each spot analysis and the intensity data was then processed by an off-line time-interpolation correction protocol to minimize the effect of variations of the primary beam intensity on measured isotope ratios. Pyrite standards used were: Ruttan (+1.2 ‰ VCDT), MVE04-14-4 (-13.15‰), and Balmat (+15.1‰). For each session, at least two of each were measured repeatedly to ascertain that the instrumental mass fractionation factor (a) was statistically identical for all standards. a varied from session to session and day to day, but was constant during a day. No efforts were made to modify instrument optical parameters on a day-to-day basis to control a.
The LA-MC-ICPMS technique followed a published method (36), in which single-spot analyses were made using a 30 µm diameter beam size with an energy density of ~9–10 J cm-2. Standard-sample bracketing was used to correct for the instrumental mass bias of unknown pyrite samples using standard-solutions calibrated against in-house pyrite standards of known composition (GAV-18=10.4‰; ALV-4053=2.5‰).
Solid-phase C Analyses. TOC content was determined by element analyzer (EA). Traces of carbonate C were removed by reaction with dilute (3N) HCl, followed by washing in distilled H2O (37). δ13C-TOC was determined with a Costech EA coupled to a Thermo Scientific Delta V plus isotope ratio MS (IRMS), using IAEA 600 Caffeine (δ13C = -27.77‰ VPDB) and IAEA-CH-6 Sucrose (-10.45‰) as calibration standards. Rock powders were degassed at 100˚C and stored under vacuum to minimize adsorption of atmospheric CO2. Replicate analyses of low-C content samples (<500 ppm) were within ± 70 ppm and ± 0.5‰ δ13C. C blanks are less than 6% of reported C contents. δ13C-carbonate was analyzed as described previously (10). Since the carbonate content of rocks used for bulk geochemical analyses and smectite-dominated veins used for genetic analyses was too low for δ13C-analyses, carbonate-dominated major veins were used.
Basalt enrichments. Methanogen Medium 141 (Deutsche Sammlung von Mikroorganismen und Zellkulturen) was prepared with minor modifications (Table S8). The initial inoculum consisted of fresh basalt shards from rock interiors in which drilling fluid contamination was near or below the detection limit (<0.1 contaminant cells g-1 basalt; 1R-1-79, 14R-1-11, 23R-2-21) (31). For transfers, a few incubated basalt pieces were added to fresh medium containing triple-autoclaved basalt pieces and no sulfate. Headspace methane and dissolved species (sulfate, sulfide, DIC) were measured via standard protocols. δ13C-methane was determined using a Trace GC coupled via GC combustion III interface to a Delta plus XP plus IRMS (all Thermo Finnigan) following a previously published protocol (38). The absence of color changes due to oxidation of resazurin indicated that media remained fully anoxic throughout incubations.

1
Figure S1. (A) Map of study area. (B) General direction of subsurface flow from Grizzly Bare outcrop to the Baby Bare Spring area and U1301 (6, 11). (C) Cross section through basalt core from U1301B, showing the alteration halos that surround basalt veins or fractures (adapted from (9)).

2
Figure S2. Phylogenetic tree of the Uncultivated Methanosarcinales Cluster (congruent with the Unidentified Rice Field Soil mcrA (15) and Zoige cluster I (ZC-I); 16) based on mcrA nucleic acid sequences. The uncultivated Methanosarcinales group e is used as an outgroup. All phylotypes detected in this study in bold type face, with the one displayed in Fig. 1a in magenta. Clone numbers sequenced for each phylotype are shown in parentheses. The closely related methanogenic phylotype that was enriched in wetland sediment is in orange (16), the closest relative of an mcrA gene detected in Juan de Fuca Ridge seafloor basalt by microarray analysis appears in blue (18), and the closest relative from Juan de Fuca Ridge hydrothermal vent chimneys in green (17). The phylogeny was inferred using ARB Neighbour Joining, with Jukes-Cantor correction. Bootstrap support (in %, 1,000 replications) is indicated at each branching point.

3
Figure S3. Phylogenetic tree of ANME-1 based on mcrA nucleic acid sequences. All phylotypes from subseafloor basalt of the Juan de Fuca Ridge Flank in bold type face, with ones included in Fig. 1A in magenta. Clone numbers sequenced for each phylotype are shown in parentheses. Highlighted in cyan is the only other deep subseafloor ANME-1 sequence in Genbank, from sediments of the Northwest Pacific off Shimokita Peninsula (Nunoura et al., unpubl.). Highly divergent ANME-1 sequences from the Lost City Hydrothermal Field (LCM1133-4) and gas hydrate sediment (AN07BC1-15-33) form a distinct cluster of their own, and are used as an outgroup. The phylogeny was inferred using ARB Neighbour Joining, with Jukes-Cantor correction. Bootstrap support (in %, 1,000 replications) is indicated at each branching point.

4
Figure S4. Phylogenetic tree of Cluster IV and related dsrB clusters, based on nucleic acid sequences. Phylotypes from Juan de Fuca Ridge Flank basalt appear in bold type face, with ones shown in Fig. 1B in magenta. Clone numbers sequenced for each phylotype are shown in parentheses. Sequences detected in subsurface sediment of the Peru Margin are shown in blue (21). Cluster IV falls into at least 3 distinct subclusters (a-c) that each have high bootstrap support (>85%). All JdFSRG fall into subcluster a. The phylogeny was inferred using ARB Neighbour Joining with Jukes-Cantor correction. Sequences of Desulfobacteraceae (Desulfosarcina variabilis) and Firmicutes (Desulfotomaculum alkaliphilum) used as outgroups. Bootstrap support (in %, 1,000 replicates) shown at each branching point.

5
Figure S5. (A) Relative weight contributions of AVS, CRS, and SO4-S to total S; (B) Cumulative weight contributions of AVS, CRS, and SO4-S to total basalt sample. Sample IDs are shown in the middle. Rock samples in which DNA extracts were tested for dsrB presence are indicated on the far left. All data is listed in Table S2. B = black alteration halo; G = grey host rock; P = pyrite front, a narrow zone (typically <0.1mm) of concentrated disseminated pyrite along the boundary between an alteration halo and the adjacent host rock, located at interface of black alteration halo and grey host rock; M = mixed lithology.

6
Figure S6. Depth-related trends in δ34S of CRS, AVS, and SO4-S at IODP Site U1301. The more reduced intermediate depth interval falls between the dashed lines. All δ34S-values are expressed in ‰ vs. VCDT.

7
Figure S7. Compiled data from Table S6 on δ13C-fractionations associated with aerobic and anaerobic C-fixation pathways. Abbreviations: PP = pentose phosphate (Calvin-Benson-Bassham) cycle, 3-H = 3-hydroxypropionate cycle, rTCA = reverse tricarboxylic acid cycle, rAP = reductive acetyl CoA pathway. Note that the PP pathway also occurs in some anoxygenic phototrophs (Chromatium, Thiocapsa, Rhodospirillum; Table S6).

8
Figure S8. Concept sketch of microbial methane and S-cycling in reduced veins of Juan de Fuca subsurface basalt (e.g. core 17R-1-70). Potential methanogenic substrates include H2/CO2, acetate, and methylated organic substrates. Methanogens, methanotrophs and sulfate reducers may coexist (as shown) or inhabit separate chemical microenvironments.
9
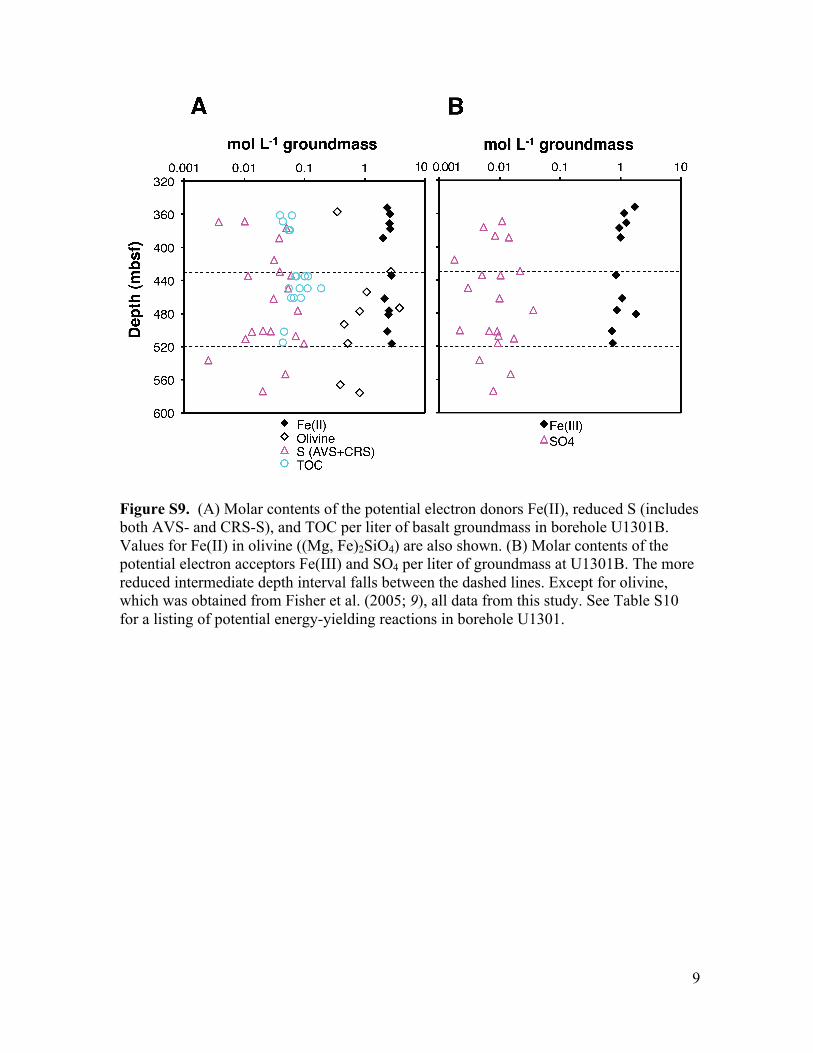
Figure S9. (A) Molar contents of the potential electron donors Fe(II), reduced S (includes both AVS- and CRS-S), and TOC per liter of basalt groundmass in borehole U1301B. Values for Fe(II) in olivine ((Mg, Fe)2SiO4) are also shown. (B) Molar contents of the potential electron acceptors Fe(III) and SO4 per liter of groundmass at U1301B. The more reduced intermediate depth interval falls between the dashed lines. Except for olivine, which was obtained from Fisher et al. (2005; 9), all data from this study. See Table S10 for a listing of potential energy-yielding reactions in borehole U1301.

10
Table S1. Sample identity, depth, lithology, total S and TOC content in host rock and halos (n=sample size), Fe(II) fraction of total Fe (FeT), δ34S-pyrite, δ34S-CRS and -AVS of host rock1 and halos1 (halos in parentheses), δ13C-TOC, mcrA and dsrB clone library composition with number of clones obtained for each phylotype in parentheses. [wt% = % of sample weight, bd = below detection; nd = not determined; δ13C-values in ‰ vs. Vienna Pee Dee Belemnite (VPDB), δ34S in ‰ vs. Vienna-Canyon Diablo Troilite (VCDT)].
1 host rock = main basalt type; exhibits a pervasive dark gray background alteration manifest by secondary saponite; halo = distinctly colored band of rock (typically 1-15mm wide) flanking a vein; color imparted by differing secondary minerals (black halos contain celadonite, brown halos contain iron oxy-hydroxide) 2 Sample designation as follows: 1R-1-79 = core 1, sampled by Rotary Core Barrel (R), section 1, 79 cm from section top
3 from (9)
4 total S determined by elemental analyzer 5 Fe2+ determined by titration, total Fe (FeT) by Inductively Coupled Plasma Atomic Emission Spectroscopy (ICP-AES), Fe3+ calculated from difference. 6 only samples with detectable CRS or AVS were analyzed
7 values from within the same core, but not from the same rock used for genetic analyses (Table S3)
Table S1. Sample identity, depth, lithology, total S and TOC content in host rock and halos (n=sample size), Fe(II) fraction of total Fe
(FeT), !34
S-pyrite, !34
S-CRS and -AVS of host rock1 and halos
1 (halos in parentheses), !
13C-TOC, mcrA and dsrB clone library
composition with number of clones obtained for each phylotype in parentheses. [wt% = % of sample weight, bd = below detection; nd
= not determined; !13
C-values in ‰ vs. Vienna Pee Dee Belemnite (VPDB), !34
S in ‰ vs. Vienna-Canyon Diablo Troilite (VCDT).]
!"#$%&"'$()"*"+,-."/,%,0&"&1234"exhibits a pervasive dark gray background alteration manifest by secondary saponite; halo = distinctly colored band of rock (typically
1-15mm wide) flanking a vein; color imparted by differing secondary minerals (black halos contain celadonite, brown halos contain iron oxy-hydroxide) 5"6,+203"73%-8.,&-$.",%"9$00$:%;"!<=!=>?"*"($'3"!@"%,+2037"/1"<$&,'1"A$'3"B,''30"C<D@"%3(&-$."!@">?"(+"9'$+"%3(&-$."&$2"
E"9'$+"C!D"
F"&$&,0"6"73&3'+-.37"/1"303+3.&,0",.,01G3'"H"I35J"73&3'+-.37"/1"&-&',&-$.@"&$&,0"I3"CI3KD"/1"L.7M(&-N301"A$M2037"O0,%+,"P&$+-("Q+-%%-$."623(&'$%($21"CLAO=PQ6D@"I3EJ"(,0(M0,&37"9'$+"7-993'3.(3R""S"$.01"%,+203%":-&#"73&3(&,/03"A<6"$'"PT6":3'3",.,01G37"
!"N,0M3%"9'$+":-&#-.""%,+3"($'3@"/M&".$&"9'$+""%,+3"'$()"M%37"9$'"83.3&-(",.,01%3%"C,0%$"%33"K,/03"6ED"
#$%&"'()"6,+203"LU5"
U32&#"C+/%9D"
V-&#$0$81E" K$&,0"6"C:&WDF"
KXA"C:&WD" I3EJYI3KH"
21'-&3"CZD"
A<6""CZDS"
PT6""CZDS"
[!EA=KXA"CZD"
"#$%&"(0M%&3'""C\"$9"(0$.3%D"
'(%)"
(0M%&3'"C\"$9"(0$.3%D"
!<=!=>?" EH5R]" 5]W"/'3((-,",.7"2-00$:"/,%,0&"CE]W"/0,()"#,0$D":-&#"%+,00"7-%%3+-.,&37"%M09-73"8',-.%"
]R]F" .7" ]RF5" /7" =HR!" .7" .7" ^7I_ "̀CF>D@"Pa_Q=!"CFFD"
.7"
5<=5=?b" EH?RS" 2-00$:"/,%,0&@"/'$:.Y/0,()"#,0$%"Cb]WD" ]R]S" ]R]!>=]R]5>"C.*EDS"
]RE]" /7" =!Rb" .7" =5!RS"&$"=5SRS"C.*ED>"
^7I_ "̀CFHD" .7"
F<=F=>" E>!R5" 2-00$:"/,%,0&@"/'$:."#,0$"CI3"$c-73%D" ]R]H" ]R]!?""C#,0$"]R]5HDS"
]RE5" /7" !" .7" =EFRS"C#,0$"=EFR]D>"
/7" .7"
H<=!=55" E>>RH" 2-00$:"/,%,0&@"(0$%3"&$"2-00$:"'-+" ]R]?" ]R]5F=]R]5H"C.*FDS"
]R5S" /7" ]R5" =5R!" =E5R]"&$"=E5Rb"C.*FD>"
/7" /7"
S<=5=!5?"EbbRb" 2-00$:"/,%,0&":-&#"/0,()"#,0$" ]R]>""C#,0$"]R]ED"
.7" ]REE""C#,0$"]RF>D""
/7" =5R>" .7" .7" ^7I_ "̀CFFD" .7"
!F<=!=!!"FEFR!" +,%%-N3"/,%,0&":-&#"/0,()"#,0$"C21'-&3"7-%%3+-.,&37"-."8'$M.7+,%%D"
]R!5""C#,0$"]R!]D"
]R]E!=]R]H]"C.*FD"
]R5E""C#,0$"]REbD"
=F"&$"=F>" =HR>""C=!ER>D"
C=?RED" =5!R?"&$"=5SRH"C.*FD"
Pa_Q=!"CE>D" `'$M2"LT"C>D"
!><=!=>]"FS5R!" 2-00$:"/,%,0&":-&#"/0,()"#,0$@"21'-&3"-."8'$M.7+,%%",.7",0$.8"N3-.%"
]R!]""C#,0$"]R]FD"
]R]5S=]R]Eb"C.*ED"
]REE""C#,0$"]RF!D"
=EH"&$"=>5"
.7" =5R>" =5SR]"&$"=5>RS"C.*ED"
^7I_ "̀CFSD@"Pa_Q=!"CFbD"
`'$M2"LT"C!5D"
5]<=!=H>"Fb!R5" 2-00$:"/,%,0&":-&#"$c-7-G37"8'$M.7+,%%"C.$"21'-&3D"
]R]E" .7" ]RF5" /7" .7" =]R?" .7" /7" `'$M2"LT"C!D"
5E<=5=5!"H]!RS" 2-00$:"/,%,0&":-&#"/0,()"#,0$@"$.01","%-.803"21'-&3"('1%&,0"9$M.74"/'$:."#,0$"
]R]H""C#,0$"]R]>D"
]R]5]" ]R5E""C#,0$"]R5FD"
=5"&$"=E" =5R!" ]R]""C]R]D"
=EERH" /7" `'$M2"LT"CbD"
5S<=!=>S"H!SRE" 2-00$:"/,%,0&":-&#"/0,()"#,0$@".$"21'-&3"9$M.7"
]R!E""C#,0$"]R]bD"
]R]!?" ]R5!""C#,0$"]R5bD"
/7" =]R?" =!R55" =EER?" /7" /7"

11
Table S2. Solid-phase S weight % (wt %) of basalt (wt %), relative contributions of different S pools to total S (%), and δ34S of these same S pools. Bold font indicates samples also used for DNA extractions [bd = below detection; - = not determined; δ34S in ‰ vs. VCDT.] Depth S pools (wt %) % contributions δ34S
mbsf AVS CRS SO4-S Total AVS CRS SO4-S AVS CRS SO4-S 1R-1-79M 352.0 0.00 0.05 0.01 0.05 0 84 16 bd -5.1 - 2R-2-98M 359.6 0.00 0.04 0.01 0.05 2 87 12 bd -1.8 - 4R2-45B 368.5 0.00 0.03 0.01 0.04 2 77 21 bd -1.6 -1.9 4R2-45G 368.5 0.00 0.01 0.00 0.01 6 86 8 bd -0.6 -1.7 4R-2-122B 369.3 0.00 0.04 0.01 0.04 1 83 17 bd -0.1 - 4R-2-122G 369.3 0.00 0.01 0.01 0.02 0 37 63 bd -0.1 - 4R-2-122P 369.3 0.00 0.00 0.01 0.02 1 25 74 bd bd - 4R-4-7M 371.2 0.00 0.00 0.01 0.01 0 5 95 bd 1.0 - 5R-1-22G 376.5 0.02 0.05 0.01 0.07 25 66 10 -2.1 0.2 - 6R-1-72B 386.7 0.00 0.00 0.00 0.01 0 21 79 bd bd - 6R-1-72G 386.7 0.00 0.00 0.01 0.01 0 0 100 bd bd - 6R-2-129B 388.8 0.00 0.00 0.01 0.01 0 15 85 bd bd - 6R-2-129G 388.8 0.00 0.05 0.02 0.06 0 73 27 bd -2.7 - 10R1-65B 415.5 0.00 0.00 0.00 0.00 0 89 11 bd -0.7 bd 10R1-65G 415.5 0.00 0.04 0.00 0.04 0 95 5 bd bd 1.1 12R-1-28G 429.2 0.00 0.05 0.03 0.07 0 64 36 bd -0.8 - 14R-1-11B 434.1 0.02 0.00 0.01 0.03 67 12 21 -9.3 -13.7 - 14R-1-11G 434.1 0.00 0.07 0.01 0.08 0 92 8 bd -5.7 - 14R-1-65B 434.7 0.00 0.03 0.01 0.05 0 75 25 bd -9.9 - 14R-1-65G 434.7 0.00 0.01 0.01 0.03 0 53 47 bd -0.9 - 14R-1-65P 434.7 0.04 0.38 0.01 0.44 10 87 3 -4.1 -1.7 - 15R4-142B 449.5 0.00 0.00 0.01 0.01 0 37 63 bd -0.9 -4.2 15R4-142G 449.5 0.00 0.07 0.00 0.07 0 95 5 bd -8.4 -4.3 15R4-142P 449.5 0.00 0.37 0.00 0.37 0 99 1 bd -1.9 -4.6 17R-1-70G 462.1 0.04 0.00 0.01 0.05 71 5 24 -2.7 bd - 19R-1-41B 476.5 0.01 0.01 0.01 0.02 26 30 44 -0.5 -4.4 - 19R-1-41G 476.5 0.02 0.08 0.04 0.14 11 57 32 -3.5 -2.9 - 20R-1-57M 481.2 0.01 0.00 0.01 0.02 57 3 39 -0.9 bd - 23R1-66B 500.6 0.00 0.01 0.01 0.02 0 42 58 bd -0.5 -3.9 23R1-66G 500.6 0.00 0.03 0.00 0.03 0 90 10 bd -1.3 -6.5 23R-2-21G 501.6 0.02 0.01 0.01 0.04 52 29 20 bd -2.1 - 23R-2-66B 502.0 0.00 0.00 0.00 0.01 21 49 31 bd -0.8 - 23R-2-66G 502.0 0.01 0.01 0.01 0.03 26 33 40 -0.7 -5.1 - 23R-2-66P 502.0 0.00 0.03 0.01 0.04 6 61 33 bd -9.6 - 24R1-117G 507.1 0.00 0.09 0.01 0.10 2 86 12 -0.2 -0.5 -5.2 25R-1-123B 510.7 0.00 0.01 0.00 0.01 14 48 38 bd -1.5 - 25R-1-123G 510.7 0.00 0.01 0.02 0.03 10 27 62 bd -5.2 - 25R-1-123P 510.7 0.00 0.02 0.01 0.03 12 61 27 bd -3.4 -

12
26R-1-76G 516.3 0.05 0.07 0.01 0.13 41 50 9 -1.2 -0.9 - 30R1-119G 536.4 0.00 0.00 0.01 0.01 0 35 21 bd 0.3 1.2 30R1-119B 536.4 0.00 0.00 0.00 0.00 0 42 8 bd -0.1 -0.1 32R-3-50B 553.4 0.00 0.01 0.01 0.01 1 54 45 bd -4.2 - 32R-3-50G 553.4 0.03 0.03 0.02 0.08 34 42 24 -1.6 -1.4 - 34R2-82B 562.9 0.00 0.00 0.00 0.00 0 0 21 bd bd 0.6 34R2-82G 562.9 0.00 0.00 0.00 0.00 0 0 8 bd bd 0.0 36R-1-53B 573.7 0.00 0.01 0.00 0.01 0 68 32 bd -1.7 - 36R-1-53G 573.7 0.01 0.02 0.01 0.03 21 51 28 -1.5 0.1 -

13
Table S3. Listing of individual δ34S measurements by SIMS and laser ablation. In cases where only one measurement was made per granule, the δ34S-pyrite and mean δ34S per pyrite granule are identical. All δ34S are in ‰ versus VCDT. Samples in bold were also used for DNA extractions.
Analysis
Type Core ID Depth
(mbsf) Granule
ID
Granule Subsample
ID δ34S Standard
deviation Mean δ34S
laser 13R-1 430.8 13 a -46.4 0.2 -46.4 laser 13R-1 430.8 1 a -40.5 0.3 -45.3 laser 13R-1 430.8 1 b -51.3 0.2 laser 13R-1 430.8 1 c -45.3 0.2 laser 13R-1 430.8 1 d -32.2 0.2 laser 13R-1 430.8 1 e -50.6 0.3 laser 13R-1 430.8 1 f -51.0 0.3 laser 13R-1 430.8 1 g -46.0 0.3 laser 13R-1 430.8 1 h -45.3 0.2 laser 13R-1 430.8 2 a -2.4 0.2 -2.4 laser 13R-1 430.8 3 a -3.9 0.2 -3.9 laser 13R-1 430.8 4 a -3.4 0.2 -3.4 laser 13R-1 430.8 5 a -3.4 0.2 -3.3 laser 13R-1 430.8 5 b -3.4 0.3 laser 13R-1 430.8 5 c -3.1 0.2 laser 13R-1 430.8 6 a -3.4 0.2 -3.3 laser 13R-1 430.8 6 b -3.2 0.2 laser 13R-1 430.8 7 a -3.5 0.2 -3.8 laser 13R-1 430.8 7 b -4.2 0.2 laser 13R-1 430.8 8 a -3.9 0.2 -3.9 laser 13R-1 430.8 9 a -3.7 0.2 -3.7 laser 13R-1 430.8 10 a -4.6 0.2 -4.6 laser 13R-1 430.8 11 a -5.6 0.2 -5.6 laser 13R-1 430.8 12 a -5.9 0.2 -5.4 laser 13R-1 430.8 12 b -5.2 0.2 laser 13R-1 430.8 12 c -5.1 0.2 laser 14R-1-11 434.7 1 a -23.5 0.3 -25.8 laser 14R-1-11 434.7 1 b -28.1 0.2 laser 14R-1-11 434.7 2 a -22.9 0.2 -21.7 laser 14R-1-11 434.7 2 b -20.4 0.2 laser 14R-1-11 434.7 3 a 0.4 0.2 0.3 laser 14R-1-11 434.7 3 b 0.8 0.2 laser 14R-1-11 434.7 3 c -0.2 0.2 laser 14R-1-11 434.7 4 a 0.3 0.2 0.5 laser 14R-1-11 434.7 4 b 0.7 0.2 laser 14R-1-11 434.7 5 a -0.2 0.2 -0.2 laser 14R-1-11 434.7 6 a -29.9 0.4 -32.2 laser 14R-1-11 434.7 6 b -34.4 0.3

14
laser 14R-1-11 434.7 7 a -33.8 0.2 -35.2 laser 14R-1-11 434.7 7 b -36.5 0.3 laser 14R-1-11 434.7 8 a 0.4 0.2 0.7 laser 14R-1-11 434.7 8 b 1.1 0.2 laser 14R-1-11 434.7 9 a -46.6 0.2 -29.8 laser 14R-1-11 434.7 9 b -13.0 0.2 laser 14R-1-11 434.7 10 a -7.7 0.2 -7.7 laser 14R-1-11 434.7 11 a -4.9 0.2 -4.9 laser 14R-1-11 434.7 12 a -8.7 0.3 -8.7 laser 14R-1-11 434.7 13 a -9.0 0.3 -9.0 sims 14R-1-11 434.7 14 a -10.4 0.5 -10.4 sims 14R-1-11 434.7 15 a -3.3 0.7 -3.3 sims 14R-1-11 434.7 16 a -19.4 0.6 -19.4 laser 15R-2 445.9 1 a -7.4 0.2 -7.2 laser 15R-2 445.9 1 b -10.0 0.2 laser 15R-2 445.9 1 c -10.0 0.2 laser 15R-2 445.9 1 d -1.2 0.2 laser 15R-2 445.9 2 a -0.9 0.2 -0.9 laser 15R-2 445.9 3 a -1.1 0.2 -1.1 laser 15R-2 445.9 4 a -1.7 0.2 -1.7 laser 15R-2 445.9 5 a -8.2 0.2 -8.2 laser 15R-2 445.9 6 a -19.3 0.2 -19.3 laser 15R-2 445.9 7 a -3.8 0.2 -8.6 laser 15R-2 445.9 7 b -8.2 0.2 laser 15R-2 445.9 7 c -6.0 0.4 laser 15R-2 445.9 7 d -16.3 0.2 laser 15R-2 445.9 8 a -2.4 0.2 -2.4 laser 15R-2 445.9 9 a -3.2 0.2 -3.2 laser 15R-2 445.9 10 a -4.2 0.2 -4.2 laser 15R-2 445.9 11 a -13.8 0.2 -13.8 laser 15R-2 445.9 12 a -1.9 0.2 -1.9 laser 15R-2 445.9 13 a -1.6 0.2 -1.6 laser 15R-2 445.9 14 a -9.7 0.2 -9.7 sims 15R-2 445.9 1 a -0.3 0.3 -0.3 sims 15R-2 445.9 2 a -2.9 0.3 -2.9 sims 15R-2 445.9 3 a -25.9 0.3 -25.9 sims 15R-2 445.9 4 a -22.6 0.3 -22.6 sims 15R-2 445.9 5 a -1.6 0.4 -1.6 sims 15R-2 445.9 6 a -11.7 0.5 -11.7 sims 15R-2 445.9 7 a -17.5 0.4 -17.5 sims 15R-2 445.9 8 a -7.9 0.5 -7.9 sims 15R-2 445.9 9 a -2.7 0.5 -2.7 sims 15R-2 445.9 10 a -1.9 0.5 -1.9 sims 15R-2 445.9 11 a -5.7 0.5 -5.7 laser 15R-4 449.5 1 a -1.8 0.2 -1.8 laser 15R-4 449.5 1 b -1.7 0.2

15
laser 15R-4 449.5 2 a -1.3 0.2 -1.3 laser 15R-4 449.5 3 a -1.4 0.2 -1.5 laser 15R-4 449.5 3 b -1.6 0.2 laser 17R-1-70 461.8 1 a -65.1 0.2 -65.1 laser 17R-1-70 461.8 2 a -69.0 0.2 -69.4 laser 17R-1-70 461.8 2 b -70.1 0.2 laser 17R-1-70 461.8 2 c -69.4 0.2 laser 17R-1-70 461.8 2 d -69.0 0.2 laser 17R-1-70 461.8 4 a -63.4 0.3 -63.4 laser 17R-1-70 461.8 5 a -68.5 0.2 -68.5 laser 17R-1-70 461.8 6 a -35.2 0.2 -35.2 sims 17R-1-70 461.8 7 a -70.4 0.4 -70.4 sims 17R-1-70 461.8 8 a -72.4 0.4 -72.4 sims 17R-1-70 461.8 9 a -71.2 0.5 -71.2 sims 17R-1-70 461.8 10 a -71.5 0.3 -71.5 sims 17R-1-70 461.8 11 a -58.6 0.4 -58.6 laser 18R-2 473.1 1 a -31.0 0.2 -30.1 laser 18R-2 473.1 1 b -29.1 0.3 laser 18R-2 473.1 2 a -14.0 0.3 -9.9 laser 18R-2 473.1 2 b -5.9 0.3 laser 18R-2 473.1 3 a -0.2 0.2 -13.1 laser 18R-2 473.1 3 b -25.5 0.3 laser 18R-2 473.1 3 c -0.9 0.2 laser 18R-2 473.1 3 d -18.0 0.7 laser 18R-2 473.1 3 e -20.9 0.3 laser 18R-2 473.1 4 a -1.4 0.2 -4.9 laser 18R-2 473.1 4 b -8.4 0.2 laser 18R-2 473.1 5 a -7.7 0.4 -3.5 laser 18R-2 473.1 5 b 0.8 0.2 laser 18R-2 473.1 6 a -15.9 0.2 -13.8 laser 18R-2 473.1 6 b -11.8 0.2 laser 18R-2 473.1 7 a 1.2 0.3 0.7 laser 18R-2 473.1 7 b 0.2 0.2 laser 19R-1 476.5 2 a -47.0 0.2 -47.8 laser 19R-1 476.5 2 b -51.2 0.2 laser 19R-1 476.5 2 c -45.2 0.2 laser 19R-1 476.5 3 a -61.7 0.2 -62.5 laser 19R-1 476.5 3 b -63.3 0.2 laser 19R-1 476.5 4 a -62.1 0.4 -62.1 laser 19R-1 476.5 5 a -64.3 0.2 -64.3 laser 19R-1 476.5 6 a -47.2 0.2 -47.2 sims 19R-1 476.5 7 a -62.8 0.3 -62.8 sims 19R-1 476.5 8 a -65.7 0.5 -65.7 sims 19R-1 476.5 9 a -66.8 0.4 -66.8 sims 19R-1 476.5 10 a -66.7 0.6 -66.7 sims 19R-1 476.5 11 a -47.0 0.9 -47.0

16
sims 19R-1 476.5 12 a -61.9 0.5 -61.9 sims 19R-1 476.5 13 a -42.5 0.4 -42.5 laser 23R-2-21 501.4 1 a -2.7 0.2 -2.2 laser 23R-2-21 501.4 1 b -1.6 0.2
17
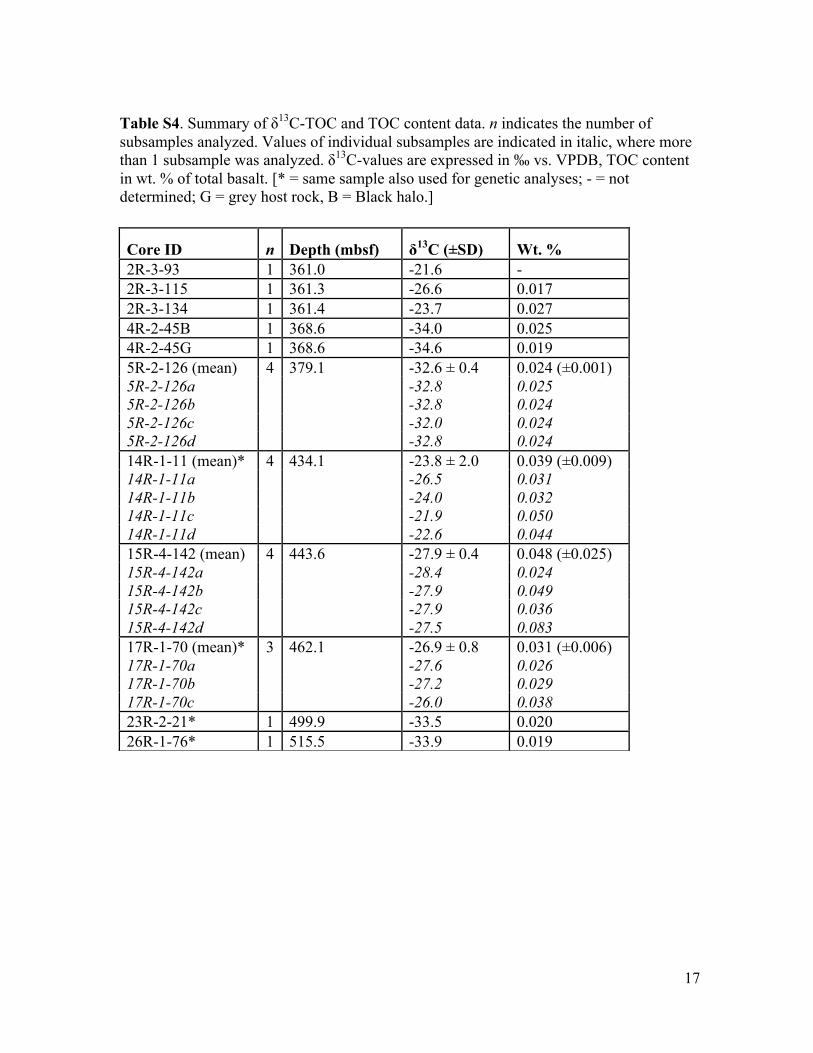
Table S4. Summary of δ13C-TOC and TOC content data. n indicates the number of subsamples analyzed. Values of individual subsamples are indicated in italic, where more than 1 subsample was analyzed. δ13C-values are expressed in ‰ vs. VPDB, TOC content in wt. % of total basalt. [* = same sample also used for genetic analyses; - = not determined; G = grey host rock, B = Black halo.]
Core ID n Depth (mbsf) δ13C (±SD) Wt. % 2R-3-93 1 361.0 -21.6 - 2R-3-115 1 361.3 -26.6 0.017 2R-3-134 1 361.4 -23.7 0.027 4R-2-45B 1 368.6 -34.0 0.025 4R-2-45G 1 368.6 -34.6 0.019 5R-2-126 (mean) 4 379.1 -32.6 ± 0.4 0.024 (±0.001) 5R-2-126a -32.8 0.025 5R-2-126b -32.8 0.024 5R-2-126c -32.0 0.024 5R-2-126d -32.8 0.024 14R-1-11 (mean)* 4 434.1 -23.8 ± 2.0 0.039 (±0.009) 14R-1-11a -26.5 0.031 14R-1-11b -24.0 0.032 14R-1-11c -21.9 0.050 14R-1-11d -22.6 0.044 15R-4-142 (mean) 4 443.6 -27.9 ± 0.4 0.048 (±0.025) 15R-4-142a -28.4 0.024 15R-4-142b -27.9 0.049 15R-4-142c -27.9 0.036 15R-4-142d -27.5 0.083 17R-1-70 (mean)* 3 462.1 -26.9 ± 0.8 0.031 (±0.006) 17R-1-70a -27.6 0.026 17R-1-70b -27.2 0.029 17R-1-70c -26.0 0.038 23R-2-21* 1 499.9 -33.5 0.020 26R-1-76* 1 515.5 -33.9 0.019

18
Table S5. Overview of δ13C-carbonate values. All measurements expressed in ‰ vs. VPDB.
Sample Depth (mbsf) δ13C 5R-3-47 379.8 0.06 12R-1-28 429.2 -1.78 18R-2-27 472.6 -5.07 18R-2-34 472.6 -4.68 18R-2-55 472.9 -4.06 18R-3-16 473.7 -3.87 18R-3-49 474.1 -2.80 18R-3-88 474.4 -3.36 18R-3-106 474.6 -3.49 18R-3-118 474.7 -1.74 18R-4-0 474.9 -2.97 18R-4-9 475.0 -3.94 35R-2-49 565.6 -1.78
19
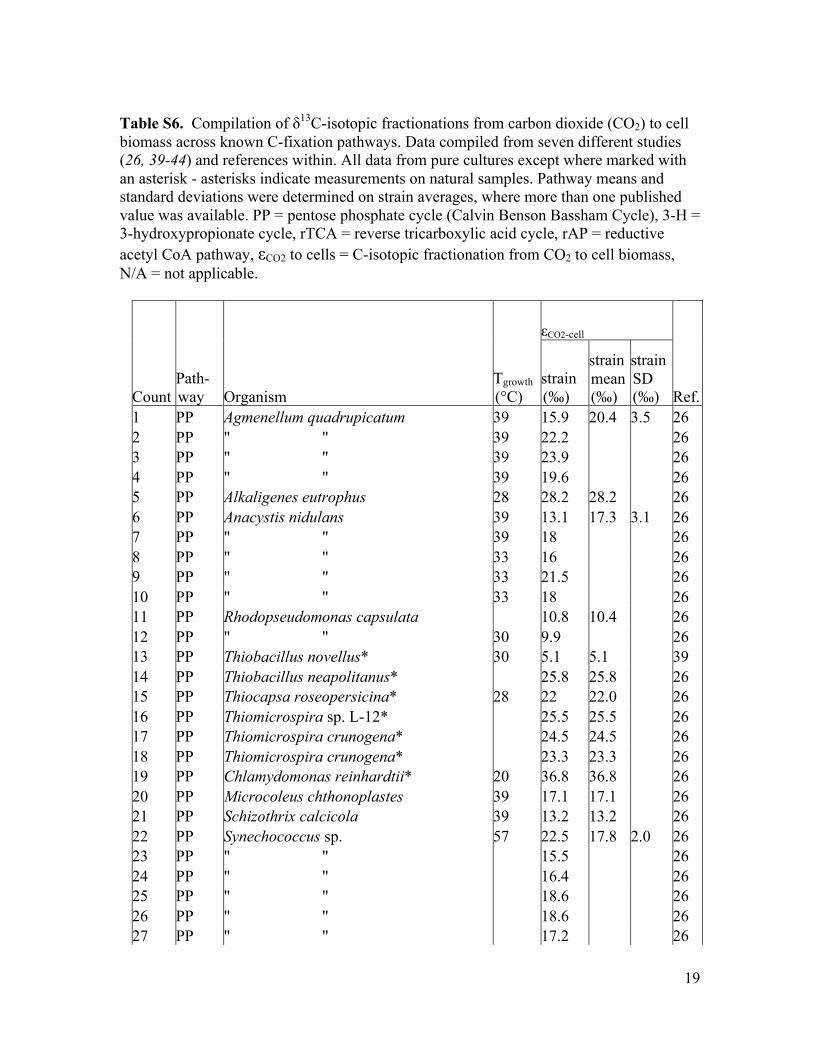
Table S6. Compilation of δ13C-isotopic fractionations from carbon dioxide (CO2) to cell biomass across known C-fixation pathways. Data compiled from seven different studies (26, 39-44) and references within. All data from pure cultures except where marked with an asterisk - asterisks indicate measurements on natural samples. Pathway means and standard deviations were determined on strain averages, where more than one published value was available. PP = pentose phosphate cycle (Calvin Benson Bassham Cycle), 3-H = 3-hydroxypropionate cycle, rTCA = reverse tricarboxylic acid cycle, rAP = reductive acetyl CoA pathway, εCO2 to cells = C-isotopic fractionation from CO2 to cell biomass, N/A = not applicable.
εCO2-cell
Count Path-way Organism
Tgrowth (°C)
strain (‰)
strain mean (‰)
strain SD (‰) Ref.
1 PP Agmenellum quadrupicatum 39 15.9 20.4 3.5 26 2 PP " " 39 22.2 26 3 PP " " 39 23.9 26 4 PP " " 39 19.6 26 5 PP Alkaligenes eutrophus 28 28.2 28.2 26 6 PP Anacystis nidulans 39 13.1 17.3 3.1 26 7 PP " " 39 18 26 8 PP " " 33 16 26 9 PP " " 33 21.5 26 10 PP " " 33 18 26 11 PP Rhodopseudomonas capsulata 10.8 10.4 26 12 PP " " 30 9.9 26 13 PP Thiobacillus novellus* 30 5.1 5.1 39 14 PP Thiobacillus neapolitanus* 25.8 25.8 26 15 PP Thiocapsa roseopersicina* 28 22 22.0 26 16 PP Thiomicrospira sp. L-12* 25.5 25.5 26 17 PP Thiomicrospira crunogena* 24.5 24.5 26 18 PP Thiomicrospira crunogena* 23.3 23.3 26 19 PP Chlamydomonas reinhardtii* 20 36.8 36.8 26 20 PP Microcoleus chthonoplastes 39 17.1 17.1 26 21 PP Schizothrix calcicola 39 13.2 13.2 26 22 PP Synechococcus sp. 57 22.5 17.8 2.0 26 23 PP " " 15.5 26 24 PP " " 16.4 26 25 PP " " 18.6 26 26 PP " " 18.6 26 27 PP " " 17.2 26

20
28 PP " " 17.1 26 29 PP " " 15.6 26 30 PP " " 16.9 26 31 PP " " 18.9 26 32 PP " " 18.1 26 33 PP Synechococcus lividus 47 12.8 12.0 26 34 PP " " 70 11.1 26 35 PP Chlorella sorokiniana 39 22.6 22.6 26 36 PP Chromatium tepidum 50 20.5 20.5 26 37 PP Chromatium strain D* 20 31 31.9 26 38 PP " " * 20 32.7 26 39 PP Chromatium vinosum* 20 27.3 27.3 26 40 PP Coccochloris elebens 39 12.3 14.2 26 41 PP " " 39 16 26 42 PP Nitrosomonas europaea* 13.8 15.7 3.8 26 43 PP " " * 13.2 26 44 PP " " 20 40 45 PP Oscillatoria williamsii 39 5 11.2 26 46 PP " " 39 17.3 26 47 PP Oscillochloris trichoides* 28 20.1 20.1 26 48 PP Rhodospirillum rubrum 20 21.1 16.9 26 49 PP " " 20 12.7 26 50 3-H Acidianus brierleyi 65 3.6 3.6 39 51 3-H Metallosphaera sedula 65 3.1 0.7 3.3 39 52 3-H " " 65 -3 26 53 3-H " " * 65 2 26 54 3-H Nitrosopumilus maritimus 20 20.0 41 55 3-H Sulfolobus solfataricus 85 0.2 0.2 39 56 rTCA Aquifex aeolicus 85 5.4 5.4 39 57 rTCA Chlorobium limicola 30 9.5 9.5 26 58 rTCA Chlorobium phaeovibrioides* 30 10.4 10.0 26 59 rTCA " " * 30 9.5 39 60 rTCA Chlorobium thiosulfatophilum* 20 20.1 20.1 26 61 rTCA Chlorobium vibrioforme* 30 12.2 11.3 0.7 26 62 rTCA " " 30 10.8 39 63 rTCA " " 30 10.7 26 64 rTCA " " 28 11.4 26 65 rTCA Chloroflexus aurantiacus 55 7.6 11.9 2.9 39 66 rTCA " " * 55 13.7 39 67 rTCA " " 55 12.7 26 68 rTCA " " 55 13.6 26 69 rTCA Desulfobacter hydrogenophilus 28 10 12.5 3.0 39 70 rTCA " " 28 8.9 39

21
71 rTCA " " 28 14.2 39 72 rTCA " " 28 13.7 42 73 rTCA " " 30 15.9 43 74 rTCA Hydrogenobacter thermophilus 70 5.5 5.5 39 75 rTCA Pyrobaculum aerophilum 100 2.9 2.9 39 76 rTCA Thermocrinis ruber 85 3.3 3.3 26 77 rTCA Thermoproteus neutrophilus 85 2 5.4 39 78 rTCA " " 8.7 26 79 rTCA Pyrodictium occultum 102 2.3 2.3 39 80 rTCA Pyrolobus fumarii 105 3.8 3.8 39 81 rAP Desulfotomaculum acetoxidans 30 30.5 29.5 42 82 rAP " " 30 28.5 43 83 rAP Desulfobacterium autotrophicum 28 39.3 24.3 16.7 26 84 rAP " " 28 38.2 26 85 rAP " " 30 10 42 86 rAP " " 9.6 43 87 rAP Archaeoglobus fulgidus 85 2.7 4.3 39 88 rAP " " 85 5.8 39 89 rAP Archaeoglobus lithotrophicus 85 8 8.0 39 90 rAP Ferroglobus placidus 85 3.5 3.5 39 91 rAP Acetobacterium woodii 28 22.2 22.3 6.6 26 92 rAP " " 28 29 26 93 rAP " " 28 15.8 26 94 rAP M.bacterium thermoautotrophicum 65 12.7 25.9 9.9 44 95 rAP " " 65 26.6 44 96 rAP " " 65 43.8 44 97 rAP " " 65 46 44 98 rAP " " 65 24.5 44 99 rAP " " 65 21.9 44 100 rAP " " 65 23.1 44 101 rAP " " 65 15 39 102 rAP " " 65 19.1 26 103 rAP " " 56 27 44 104 rAP " " 56 26.6 44 105 rAP " " 66 27.4 44 106 rAP " " 34 44 107 rAP " " 65 15 39 108 rAP Methanobacterium formicicum 34 36.1 36.4 1.9 44 109 rAP " " 34 38.4 44 110 rAP " " 34 34.7 44 111 rAP Methanobacterium sp. 37 25.1 22.9 2.8 26 112 rAP " " 37 23.2 26 113 rAP " " 46 18.8 26

22
114 rAP " " 46 24.5 26 115 rAP M.bacterium sp. strain Ivanov 37 25.2 22.8 3.0 44 116 rAP " " 37 23.2 44 117 rAP " " 46 18.5 44 118 rAP " " 46 24.3 44 119 rAP M.bacterium strain M.o.H. 40 11.5 11.5 44 120 rAP M.caldococcus jannaschii 85 6.2 12.1 4.9 39 121 rAP " " 85 17.7 39 122 rAP " " 85 10.7 39 123 rAP " " 85 13.7 39 124 rAP Methanococcus igneus 85 20.2 21.5 39 125 rAP M.coccus thermolithotrophicus 65 22.7 18.6 7.6 39 126 rAP " " 65 25.8 39 127 rAP " " 65 26.7 39 128 rAP " " 41 7.4 39 129 rAP " " 51 13.5 39 130 rAP " " 60 19.7 39 131 rAP " " 65 24.8 39 132 rAP " " 65 26 39 133 rAP " " 70 24.9 39 134 rAP " " 65 8.7 39 135 rAP " " 45 20.5 39 136 rAP " " 45 13.4 39 137 rAP " " 45 4.8 39 138 rAP " " 65 22 39 139 rAP Methanopyrus kandleri 100 20.3 16.5 39 140 rAP " " 100 12.7 39 141 rAP Methanosarcina barkeri 37 19.5 16.3 2.3 39 142 rAP " " 40 14.8 44 143 rAP " " 37 14.6 44 144 rAP " " 37 16.3 44 145 rAP Methanothermus fervidus 85 13.1 13.1 39

23
Table S7. Mean δ13C-isotopic fractionations from CO2 to cell biomass (εCO2-cells) in microbes using the reductive acetyl CoA pathway, calculated from compiled data in table S6.
εCO2-cells (‰) Taxon Energy metabolism mean SD Ref. Desulfotomaculum acetoxidans SO4
2- reducer, H2/CO2 29.5 42-43 Desulfobacterium autotrophicum SO4
2- reducer, H2/CO2 24.3 16.7 26, 42-43 Archaeoglobus fulgidus SO4
2- reducer, H2/CO2 4.3 39 Archaeoglobus lithotrophicus SO4
2- reducer, H2/CO2 8.0 39 Ferroglobus placidus Fe3+, NO3
-, S2O32- reducer 3.5 39
Acetobacterium woodii acetogenesis, H2/CO2 22.3 6.6 26, 42-43 M.bacterium thermoautotrophicum methanogenesis, H2/CO2 25.9 9.9 26, 39, 44 Methanobacterium formicicum methanogenesis, H2/CO2 36.4 1.9 44 Methanobacterium sp. methanogenesis, H2/CO2 22.9 2.8 26 Methanobacterium sp. strain Ivanov methanogenesis, H2/CO2 22.8 3.0 44 Methanobacterium strain M.o.H. methanogenesis, H2/CO2 11.5 44 Methanocaldococcus jannaschii methanogenesis, H2/CO2 12.1 4.9 39 Methanococcus igneus methanogenesis, H2/CO2 21.5 39

24
Table S8. Media composition for initial enrichment and transfer. The composition, including the trace element and vitamin solutions, follows the methanogenic Medium 141 (DSMZ) except where indicated in bold. 2 atm headspace pressure of 80% H2: 20% CO2 were applied. The final pH was adjusted to 8.0. All incubations were at 65°C.
Initial Enrichment Transfer Ingredients of Medium Quantity L-1 Quantity L-1 KCl 0.34 g 0.34 g MgCl2 x 6 H2O 4.0 g 6.85 g MgSO4 x 7 H2O 3.45 g omitted NH4Cl 0.25 g 0.25 g CaCl2 x 2 H2O 0.14 g 0.14 g K2HPO4 0.14 g 0.14 g NaCl 18.0 g 18.0 g Fe(NH4)2(SO4)2 x 7 H2O 2 mg 2 mg NaHCO3 2.5 g (29.8 mM) 2.500 g (29.8 mM) Na-acetate 0.082 g (1 mM) 0.164 g (2 mM) Methanol stock (300 mM) 0.17 mL (50 µM) 1 mL (300 µM) Dimethyl sulfide stock (30 mM) 1.67 mL (50 µM) 10 mL (300 µM) Yeast extract (Difco) 0.20 g 0.200 g Trypticase (BBL) 2.00 g 2.00 g Resazurin 1 mg 1 mg Cysteine-HCl x H2O 0.50 g 0.50 g Na2S x 9 H2O 0.50 g 0.50 g Trace elements 10 mL 10 mL Vitamin solution 10 mL 10 mL Distilled water, added to: 1000 mL 1000 mL

25
Table S9. Basalt media composition after 7 years (initial) and 5 years (1st transfer) of incubation. bd = below detection; δ13C-values in ‰ vs. VPDB.
1) initial concentration: 15.3 mM in original enrichment medium, 1.3 mM in transfer medium. 2) initial concentration: 2.1 mM 3) initial concentration: ≥29.8 mM 4) average of duplicate measurements with precision of ± 1.5‰.
Aqueous concentrations δ13C (‰)
Core ID Replicate enrichment CH4 (µM)
SO42-
(mM)1 H2S
(mM)2 DIC
(mM)3 CH4 1R-1-79 A initial 0.0 17.0 bd 20.1 -62 1R-1-79 B initial 0.0 17.3 bd 26.9 -64 14R-1-11 A initial 0.1 ± 0.0 17.4 bd 27.4 -52 1R-1-79 A 1st transfer 0.7 ± 0.3 8.0 bd 1.4 -54 1R-1-79 B 1st transfer 1.6 ± 0.3 8.4 bd 2.4 -624 14R-1-11 A 1st transfer 1.5 7.4 bd 2.2 -624 23R-2-21 A 1st transfer 0.7 ± 0.5 7.7 bd 3.3 -65

26
Table S10. (A) Mean molar content of the potential electron donors Fe(II), S (AVS+CRS), and OC per liter of basalt. (B) Mean molar content of the potential electron acceptors Fe(III), SO4, and IC per liter of basalt. All molar contents were calculated from mean weight percentages of Fe, S, and C fractions in host rock, and are from this study (Tables S2, S4, S13) except where indicated by footnotes. Molar contents of bulk data were converted from per gram to per liter assuming a basalt density of 2,750 g L-1, which is the mean bulk density of basalt at U1301B (calculated from (9)). Molar contents of aqueous species (DOC, sulfate (aq), DIC) were calculated assuming a porosity of 5.3%, which is the mean porosity at U1301B (calculated from (9)), by multiplying mean concentrations from basement fluids sampled from boreholes or BBS by a factor of 0.053. These values are rough estimates since they assume that concentrations of basement fluids from boreholes or BBS fully reflect those within veins and basaltic pore space. CRS was assumed to be 100% pyrite (FeS2). Abbreviations: FTT = Fischer-Tropsch-type, SR = sulfate reduction, MG = methanogenesis, AG = acetogenesis, Fe-red = Fe(III) reduction, FMT = fermentation, ND = not determined, N/A = not applicable (sample size < 3). (A)
mol L-1 basalt e--donor Mean SD
Potential energy-yielding reactions
Fe(II)1 2.5E+00 2.5E-01 Olivine1,2 9.1E-01 1.2E+00
Indirect; biotic SR, MG, AG, Fe-red from (a) H2 produced by serpentinization and/or (b) small organic molecules produced by FTT synthesis
S (AVS+CRS) 3.3E-02 2.7E-02 AVS 7.1E-03 1.2E-02 CRS 2.6E-02 2.3E-02
Indirect; biotic S0 disproportionation of S species, e.g. produced by abiotic S2- oxidation with Fe(III)
TOC 6.2E-02 2.4E-02 Biotic SR, MG, AG; AOM, FMT DOC3 6.6E-7 N/A Biotic SR, MG, AG; AOM, FMT
(B)
mol L-1 basalt Potential energy-yielding reactions e--acceptor Mean SD
Fe(III)1 1.1E+00 3.7E-01 Abiotic Fe(III) reduction by reactions with S2- may restore bioavailable inorganic S species; biotic Fe-red
Sulfate (total) 9.5E-03 8.0E-03 Biotic SR, AOM Sulfate (aq)4 1.0E-03 N/A Biotic SR, AOM
IC ND ND Biotic MG, AG DIC5 2.0E-06 N/A Biotic MG, AG
1individual values (in wt %) shown in Table S11. 2averaged from 9. 3assumes 12.5 µM concentration, which is the average from 1026B and BBS (6). 4assumes 17.6 mM, which is value measured in U1301A borehole fluid (11). 5assumes 37.5 µM, which is the average from 1026B and BBS (10).

27
Table S11. Fe2+, Fe2+-olivine, Fe3+, and FeTotal (FeT) content in host rock and halos (halos in parentheses) at borehole U1301B. All data from this study, except Fe2+-olivine data, which was calculated from bulk olivine measurements published in reference 9.
weight %
Sample ID
Depth (mbsf) Fe2+
Fe2+-olivine Fe3+ FeT
1R-1-14 351.3 bd 1R-1-79 352 4.8 3.5 8.3 1R-1-118 352.4 trace 2R-1-4 357.1 0.7 2R-2-98 359.6 5.4 2.3 7.7 4R-4-7 371.2 5.3 2.5 7.8 5R-1-22 377.5 5.4 1.9 7.4 6R-2-129 388.8 4.1 (5.1) 2.0 (4.5) 6.1 (9.6) 12R-1-31 429.2 5.5 14R-1-11 434.1 5.6 (5.7) 1.7 (3.5) 7.3 (9.2) 15R-4-66 448.8 trace 16R-1-83 454.0 2.2 17R-1-70 462.1 4.4 (5.5) 2.2 (3.8) 6.5 (9.3) 18R-2-92 473.2 7.7 19R-1-41 476.5 5.2 (5.1) 1.8 (3.7) 6.9 (8.9) 19R-1-132 477.4 1.7 20R-1-57 481.2 5.0 3.7 8.7 21R-2-126 493.0 0.9 23R-2-21 501.6 4.8 (5.9) 1.5 (1.8) 6.3 (7.8) 26R-1-41 515.9 1.1 26R-1-76 516.3 5.8 (6.1) 1.5 (2.3) 7.3 (8.4) 35R-2-107 566.1 0.8 36R-2-102 575.7 1.7

28
Table S12. List of dsrAB/dsrB primers tested in study. xdsrB = xenologous dsrB, rdsrB = reverse dsrB.
Primer Sequence (5’ – 3’) Target groups Reference Dsr-1F ACS CAC TGG AAG CAC G
General 50
14 Dsr-4R GTG TAG CAG TTA CCG CA
General 14
Dsr 1F1 CAG GAY GAR CTK CAC CG General 20 Dsr 1R1 CCC TGG GTR TGR AYR AT General 20 Del1075R GYT CVC GGT TCT TDC δ Proteobacteria 45 Arch1830F TGC TGT CNA ACA TG Archaeoglobales 45 AG dsrF GAG AGA GGA GCA ACR
AT Archaeoglobales This study
AG-FC dsrR TCG TCC CAC CAS TCC CA Archaeoglobales, Firmicutes This study dsrB F1a CAC ACC CAG GGC TGG General except xdsrB This study dsrB F1b CAT ACT CAG GGC TGG General except xdsrB This study dsrB F1c CAT ACC CAG GGC TGG General except xdsrB This study dsrB F1d CAC ACT CAA GGT TGG General except xdsrB This study dsrB F1e CAC ACA CAG GGA TGG General except xdsrB This study dsrB F1f CAC ACG CAG GGA TGG General except xdsrB This study dsrB F1g CAC ACG CAG GGG TGG General except xdsrB This study dsrB F1h CAT ACG CAA GGT TGG General except xdsrB This study dsrB F2a CGT CCA CAC CCA GGG xdsrB This study dsrB F2b TGT GCA TAC CCA GGG xdsrB This study dsrB F2c CAT TCA TAC CCA GGG xdsrB This study dsrB F2d TGT TCA CAC CCA GGG xdsrB This study dsrB F2e CGT GCA CAC GCA GGG xdsrB This study dsrB F2f CGT TCA TAC ACA GGG xdsrB This study dsrB F2g TGT CCA CAC TCA GGG xdsrB This study dsrB F2h CGT GCA TAC GCA GGG xdsrB This study dsrB F2i CAT CCA TAC TCA GGG xdsrB This study dsrB 4RSI1a CAG TTA CCG CAG TAC AT General except xdsrB & rdsrB This study dsrB 4RSI1b CAG TTA CCG CAG AAC AT General except rdsrB This study dsrB 4RSI1c CAG TTG CCG CAG TAC AT General except xdsrB & rdsrB This study dsrB 4RSI1d CAG TTT CCG CAG TAC AT General except xdsrB & rdsrB This study dsrB 4RSI1e CAG TTG CCG CAG AAC AT General except rdsrB This study dsrB 4RSI1f CAG TTT CCA CAG AAC AT General except xdsrB & rdsrB This study dsrB 4RSI2a CAG GCG CCG CAG CAG AT rdsrB This study dsrB 4RSI2b CAG GCG CCG CAG CAC AC rdsrB This study dsrB 4RSI2c CAT GCT CCG CAG CAG AT rdsrB This study dsrB 4RSI2d CAC GCG CCG CAA GCC AC rdsrB This study dsrB 4RSI2e CAT GCA CCA CAA CAA AT rdsrB This study dsrB 4RSI2f CAG GCA CCA CAG CAG AT rdsrB This study dsrB 4RSI2g CAG GCT CCG CAG CAG AT rdsrB This study dsrB 4RSI2h
CAG GCG CCG CAG TAC AT rdsrB This study

29
Table S13. PCR primer combination, target group, fragment size, and DNA extracts tested. For pure cultures, 40 amplification cycles were used except where indicated. Since 4 of the original 10 sample DNA extracts from Hole U1301B had been used up for mcrA amplifications, only 6 DNA extracts could be checked for dsr presence. Due to low remaining volumes of DNA extract, we first amplified residual basalt DNA extracts with the DSR1F / 4R primer pair in a 50µL-PCR-reaction volume for 40 PCR cycles, and then used subsamples (2µL) for reamplifications in 40 cycles with the DSR1F / 4R primer pair, or nested PCR using other primer combinations. [Dsv. = Desulfovibrio, Dsm. = Desulfotomaculum, Ag. = Archaeoglobus.]].
1 negative PCR result after 25 amplification cycles
2 Isolate provided by Flemming Mønsted Christensen. 3 Isolated from black rust deposit on borehole observatory at ODP Site 1026 (46). No published dsrAB sequence
Primer Combination Target Group Size (bp)
Dsv. ocea-nii
Dsm. spp. Eth22
Ag. fulgi-dus
Ag. sulfati-callidus3
U1301B
Dsr-1F / Dsr-4R General ~1,900 + + + - - Dsr-1F1 / Dsr-1R1 General ~1,000 + + nd
nd
nd - Dsr-1F / Del1075R δ Proteobacteria ~940 + nd nd nd - Arch1830F / Dsr4R Archaeoglobales ~350 nd
nd
- - - AG dsrF / Dsr4R Archaeoglobales ~1,100 nd
nd
+ - - Dsr-1F / AG-FC dsrR
Archaeoglobales, xdsrB
~900 nd
nd
+ + -
dsrB F1a-h / 4RSI1a-f
General except xdsrB & rdsrB
~350 -1 nd + + +
dsrB F2a-i / 4RSI1b,e xdsrB ~350 nd + nd nd - dsrB F1a-h /4RSI2a-h rdsrB ~350 nd nd nd nd -

30
References 1. W. Bach, K. J. Edwards, Iron and sulfide oxidation within the basaltic ocean crust:
implications for chemolithoautotrophic microbial biomass production. Geochim. Cosmochim. Acta 67, 3871 (2003). doi:10.1016/S0016-7037(03)00304-1
2. K. J. Edwards, T. M. McCollom, H. Konishi, P. R. Buseck, Seafloor bioalteration of sulfide minerals: results from in situ incubation studies. Geochim. Cosmochim. Acta 67, 2843 (2003). doi:10.1016/S0016-7037(03)00089-9
3. C. M. Santelli et al., Abundance and diversity of microbial life in ocean crust. Nature 453, 653 (2008). doi:10.1038/nature06899 Medline
4. M. R. Fisk, S. J. Giovannoni, I. H. Thorseth, Alteration of oceanic volcanic glass: textural evidence of microbial activity. Science 281, 978 (1998). doi:10.1126/science.281.5379.978 Medline
5. O. Rouxel, S. Ono, J. Alt, D. Rumble, J. Ludden, Sulfur isotope evidence for microbial sulfate reduction in altered oceanic basalts at ODP Site 801. Earth Planet. Sci. Lett. 268, 110 (2008). doi:10.1016/j.epsl.2008.01.010
6. M. D. McCarthy et al., Chemosynthetic origin of 14C-depleted dissolved organic matter in a ridge-flank hydrothermal system. Nat. Geosci. 4, 32 (2011). doi:10.1038/ngeo1015
7. J. P. Cowen et al., Fluids from aging ocean crust that support microbial life. Science 299, 120 (2003). doi:10.1126/science.1075653 Medline
8. B. N. Orcutt et al., Colonization of subsurface microbial observatories deployed in young ocean crust. ISME J. 5, 692 (2011). doi:10.1038/ismej.2010.157 Medline
9. A. T. Fisher, T. Urabe, A. Klaus, Expedition 301 Scientists, Proc. IODP 301 (2005).
10. B. D. Walker, M. D. McCarthy, A. T. Fisher, T. P. Guilderson, Dissolved inorganic carbon isotopic composition of low-temperature axial and ridge-flank hydrothermal fluids of the Juan de Fuca Ridge. Mar. Chem. 108, 123 (2008). doi:10.1016/j.marchem.2007.11.002
11. C. G. Wheat et al., Subseafloor seawater-basalt-microbe reactions: Continuous sampling of borehole fluids in a ridge flank environment. Geochem. Geophys. Geosyst. 11, Q07011 (2010). doi:10.1029/2010GC003057
12. A. Schippers, B. B. Jørgensen, Biogeochemistry of pyrite and iron sulfide oxidation in marine sediments. Geochim. Cosmochim. Acta 66, 85 (2002). doi:10.1016/S0016-7037(01)00745-1
13. M. W. Friedrich, Methyl-coenzyme M reductase genes: unique functional markers for methanogenic and anaerobic methane-oxidizing Archaea. Methods Enzymol. 397, 428 (2005). doi:10.1016/S0076-6879(05)97026-2 Medline
14. M. Wagner, A. J. Roger, J. L. Flax, G. A. Brusseau, D. A. Stahl, Appl. Environ. Microbiol. 75, 7086 (1998).
15. T. Lueders, K.-J. Chin, R. Conrad, M. Friedrich, Molecular analyses of methyl-coenzyme M reductase alpha-subunit (mcrA) genes in rice field soil and enrichment cultures reveal the methanogenic phenotype of a novel archaeal lineage. Environ. Microbiol. 3, 194 (2001). doi:10.1046/j.1462-2920.2001.00179.x Medline
31
16. G. Zhang et al., Methanogen community in Zoige wetland of Tibetan plateau and phenotypic characterization of a dominant uncultured methanogen cluster ZC-I. Environ. Microbiol. 10, 1850 (2008). doi:10.1111/j.1462-2920.2008.01606.x Medline
17. F. Wang et al., GeoChip-based analysis of metabolic diversity of microbial communities at the Juan de Fuca Ridge hydrothermal vent. Proc. Natl. Acad. Sci. U.S.A. 106, 4840 (2009). doi:10.1073/pnas.0810418106 Medline
18. O. U. Mason et al., Prokaryotic diversity, distribution, and insights into their role in biogeochemical cycling in marine basalts. ISME J. 3, 231 (2009). doi:10.1038/ismej.2008.92 Medline
19. K. Knittel, A. Boetius, Anaerobic oxidation of methane: progress with an unknown process. Annu. Rev. Microbiol. 63, 311 (2009). doi:10.1146/annurev.micro.61.080706.093130 Medline
20. A. Dhillon, A. Teske, J. Dillon, D. A. Stahl, M. L. Sogin, Molecular characterization of sulfate-reducing bacteria in the Guaymas Basin. Appl. Environ. Microbiol. 69, 2765 (2003). doi:10.1128/AEM.69.5.2765-2772.2003 Medline
21. G. Webster et al., Prokaryotic community composition and biogeochemical processes in deep subseafloor sediments from the Peru Margin. FEMS Microbiol. Ecol. 58, 65 (2006). doi:10.1111/j.1574-6941.2006.00147.x Medline
22. S. Ono, N. S. Keller, O. Rouxel, J. C. Alt, Sulfur-33 constraints on the origin of secondary pyrite in altered oceanic basement. Geochim. Cosmochim. Acta 87, 323 (2012). doi:10.1016/j.gca.2012.04.016
23. M. D. Rudnicki, H. Elderfield, B. Spiro, Fractionation of sulfur isotopes during bacterial sulfate reduction in deep ocean sediments at elevated temperatures. Geochim. Cosmochim. Acta 65, 777 (2001). doi:10.1016/S0016-7037(00)00579-2
24. M. S. Sim, T. Bosak, S. Ono, Large sulfur isotope fractionation does not require disproportionation. Science 333, 74 (2011). doi:10.1126/science.1205103 Medline
25. D. E. Canfield, B. Thamdrup, The production of 34S-depleted sulfide during bacterial disproportionation of elemental sulfur. Science 266, 1973 (1994). doi:10.1126/science.11540246 Medline
26. A. L. Zerkle, C. H. House, S. L. Brantley, Biogeochemical signatures through time as inferred from whole microbial genomes. Am. J. Sci. 305, 467 (2005). doi:10.2475/ajs.305.6-8.467
27. H.-T. Lin, J. P. Cowen, E. J. Olson, J. P. Amend, M. D. Lilley, Inorganic chemistry, gas compositions and dissolved organic carbon in fluids from sedimented young basaltic crust on the Juan de Fuca Ridge flanks. Geochim. Cosmochim. Acta 85, 213 (2012). doi:10.1016/j.gca.2012.02.017
28. W. B. Whitman, T. L. Bowen, D. R. Boone, The Methanogenic Bacteria. The Prokaryotes 3, 165 (2006). doi:10.1007/0-387-30743-5_9
29. M. A. Lever et al., Acetogenesis in Deep Subseafloor Sediments of The Juan de Fuca Ridge Flank: A Synthesis of Geochemical, Thermodynamic, and Gene-based Evidence. Geomicrobiol. J. 27, 183 (2010). doi:10.1080/01490450903456681

32
30. T. M. McCollom, J. S. Seewald, Abiotic synthesis of organic compounds in deep-sea hydrothermal environments. Chem. Rev. 107, 382 (2007). doi:10.1021/cr0503660 Medline
31. M. A. Lever et al., Trends in Basalt and Sediment Core Contamination During IODP Expedition 301. Geomicrobiol. J. 23, 517 (2006). doi:10.1080/01490450600897245
32. J. F. Biddle et al., Heterotrophic Archaea dominate sedimentary subsurface ecosystems off Peru. Proc. Natl. Acad. Sci. U.S.A. 103, 3846 (2006). doi:10.1073/pnas.0600035103 Medline
33. M. A. Lever, Ph. D. Dissertation, University of North Carolina at Chapel Hill, Chapel Hill, NC (2008).
34. W. Ludwig et al., ARB: A software environment for sequence data. Nucleic Acids Res. 32, 1363 (2004). doi:10.1093/nar/gkh293 Medline
35. E. M. Ripley et al., Analytical Methods for Sulfur Determination in Glasses, Rocks, Minerals and Fluid Inclusions. Rev. Mineral. Geochem. 73, 9 (2011). doi:10.2138/rmg.2011.73.2
36. P. Craddock, O. Rouxel, L. Ball, W. Bach, Sulfur isotope measurement of sulfate and sulfide by high-resolution MC-ICP-MS. Chem. Geol. 253, 102 (2008). doi:10.1016/j.chemgeo.2008.04.017
37. A. Delacour, G. L. Früh-Green, S. M. Bernasconi, P. Schaeffer, D. S. Kelley, Carbon geochemistry of serpentinites in the Lost City Hydrothermal System (30°N, MAR). Geochim. Cosmochim. Acta 72, 3681 (2008). doi:10.1016/j.gca.2008.04.039
38. B. N. Popp, F. J. Sansone, T. M. Rust, D. A. Merritt, Determination of Concentration and Carbon Isotopic Composition of Dissolved Methane in Sediments and Nearshore Waters. Anal. Chem. 67, 405 (1995). doi:10.1021/ac00098a028
39. C. H. House, J. W. Schopf, K. O. Stetter, Carbon isotopic fractionation by Archaeans and other thermophilic prokaryotes. Org. Geochem. 34, 345 (2003). doi:10.1016/S0146-6380(02)00237-1
40. S. Sakata, J. M. Hayes, M. Rohmer, A. B. Hooper, M. Seemann, Stable carbon-isotopic compositions of lipids isolated from the ammonia-oxidizing chemoautotroph Nitrosomonas europaea. Org. Geochem. 39, 1725 (2008). doi:10.1016/j.orggeochem.2008.08.005
41. M. Könneke, J. S. Lipp, K.-U. Hinrichs, Carbon isotope fractionation by the marine ammonia-oxidizing archaeon Nitrosopumilus maritimus. Org. Geochem. 48, 21 (2012). doi:10.1016/j.orggeochem.2012.04.007
42. K. L. Londry, D. J. Des Marais, Stable carbon isotope fractionation by sulfate-reducing bacteria. Appl. Environ. Microbiol. 69, 2942 (2003). doi:10.1128/AEM.69.5.2942-2949.2003 Medline
43. K. L. Londry, L. L. Jahnke, D. J. Des Marais, Stable carbon isotope ratios of lipid biomarkers of sulfate-reducing bacteria. Appl. Environ. Microbiol. 70, 745 (2004). doi:10.1128/AEM.70.2.745-751.2004 Medline
33
44. M. J. Alperin, T. M. Hoehler, Anaerobic methane oxidation by archaea/sulfate-reducing bacteria aggregates: 2. Isotopic constraints. Am. J. Sci. 309, 958 (2009). doi:10.2475/10.2009.02
45. A. Gittel, K. B. Sørensen, T. L. Skovhus, K. Ingvorsen, A. Schramm, Prokaryotic community structure and sulfate reducer activity in water from high-temperature oil reservoirs with and without nitrate treatment. Appl. Environ. Microbiol. 75, 7086 (2009). doi:10.1128/AEM.01123-09 Medline
46. B. O. Steinsbu et al., Archaeoglobus sulfaticallidus sp. nov., a thermophilic and facultatively lithoautotrophic sulfate-reducer isolated from black rust exposed to hot ridge flank crustal fluids. Int. J. Syst. Evol. Microbiol. 60, 2745 (2010). doi:10.1099/ijs.0.016105-0 Medline