supplementary materials for - sciencescience.sciencemag.org/highwire/filestream/687974/field... ·...
TRANSCRIPT

www.sciencemag.org/cgi/content/full/science.aah7111/DC1
Supplementary Materials for
CRISPRi-based genome-scale identification of functional long
noncoding RNA loci in human cells
S. John Liu,* Max A. Horlbeck,* Seung Woo Cho, Harjus S. Birk, Martina Malatesta, Daniel He, Frank J. Attenello, Jacqueline E. Villalta, Min Y. Cho, Yuwen Chen,
Mohammad A. Mandegar, Michael P. Olvera, Luke A. Gilbert, Bruce R. Conklin, Howard Y. Chang, Jonathan S. Weissman,†‡ Daniel A. Lim†‡
*These authors contributed equally to this work. †These authors contributed equally to this work. ‡Corresponding author. Email: [email protected] (D.A.L.); [email protected] (J.S.W.)
Published 15 December 2016 on Science First Release DOI: 10.1126/science.aah7111
This PDF file includes: Materials and Methods
Author Contributions
Figs. S1 to S12
Captions for tables S1 to S11
References
Other supplementary material for this manuscript includes: Tables S1 to S11 (Excel format)

2
Materials and Methods lncRNA CRISPRi library design lncRNA target selection LncRNA annotations were retrieved from Ensembl build 75 (using the biotypes lincRNA, antisense, 3 prime overlapping ncRNA, processed transcript, sense intronic, sense overlapping) (39), the Broad human lincRNA catalog (37), the MiTranscriptome (38) , and a set of human brain specific lncRNAs (42). Annotations were merged using the cuffmerge command in Cufflinks v2.2.1 (62). LncRNAs that were transcribed in at least one of the 7 cell lines in this study were identified by quantifying the expression of lncRNAs using RNA-seq data. RNA-seq data were obtained from ENCODE and other sources: HEK293T (GSE56010), HeLa (GSE30567, GSE33480, GSE23316), K562 (GSE30567, GSE33480, GSE23316), MCF7 (GSE30567, GSE33480), MDAMB231 (GSE73526, GSE45732), iPS (clone PCBC15hsi2012040401 (63)), HFF (GSE69906). RNA-seq was performed in-house for U87 cells, using the illumina TruSeq Stranded mRNA kit. Reads were quality trimmed using seqtk v1.0 and aligned to the human genome (GRCh37) with tophat v2.0.10, using the merged transcriptome reference as the transcriptome index, the prefilter-multihits flag, and strand specific flag when appropriate. Transcript abundance estimation was performed using Cufflinks v2.2.1. For each gene, the median FPKM value of the replicate samples were obtained. For each cell line, a minimum expression threshold was set between 0.25-0.50 FPKM in order to screen as many genes as possible, given cell culture scale limitations. 21,578 lncRNAs were identified. Generating lncRNA TSS annotations From these 21,578 transcripts passing the expression filter, an initial set of 17,740 TSSs were obtained from transcripts belonging to the same gene and with 5’ ends within 100bp of each other. These TSS annotations were further refined using the FANTOM cap analysis of gene expression (CAGE)-based TSS annotations as previously described (35) with adjustments. LncRNA TSS annotations could not be directly matched to FANTOM “p1@gene” CAGE peaks, and instead were matched to any same-stranded CAGE peak within 400bp labeled as “p1” or “p2,” and annotation support was labeled as “CAGE, primary peaks.” If no primary peaks were found, annotations could instead be refined by robust or permissive peaks within 200bp of the starting annotation, and were labeled as “CAGE, robust peak” or “CAGE, permissive peak,” respectively. Where no CAGE peaks were found (due to the cell type-specific nature of lncRNA expression only 30% of TSS annotations were refined with CAGE peaks), the TSS as determined by the annotation sets above was used and labeled “Annotation.” 66 of the original TSSs were assigned the same start site by this method, reducing the total number targeted to 17,674. This annotation is included as Table S1. As detailed below, a further 692 TSSs could not be uniquely targeted, reducing the total TSSs to 16,982. Finally, to avoid redundant information from different TSSs located in close proximity, TSSs within 100bp of each other were assigned to a single gene ID (designated LHnnn in Tables S1-6,8) for a total of 16,401 distinct lncRNA target loci.

3
sgRNA selection All potential sgRNAs within 25bp upstream and 500bp downstream of the refined lncRNA TSS annotations were scored for predicted activity using the hCRISPRi-v2.1 algorithm, scored for off-target sites near TSSs and in the genome using weighted Bowtie v1.0.0 (64), and filtered for required restriction sites (BstXI, BlpI, and SbfI) and overlap with higher-ranking sgRNAs as previously described (35). For 692 TSSs, 10 sgRNAs passing all filters could not be found and were discarded. 87.5% of sgRNAs accepted into the library passed the highest off-target stringency threshold, while 10.9% passed at the second-highest stringency. Non-targeting control sgRNAs were generated randomly weighted by the per-base nucleotide frequencies of the targeting sgRNAs in the library, and filtered for no target sites in the genome. sgRNAs targeting lncRNA genes specifically expressed in a subset of cell types were assigned to the appropriate hierarchical sublibrary (along with a proportional number of non-targeting controls) to enable screening only the desired gene sets (Figure S2A). Sublibraries were designed as the intersection of genes expressed in the cell lines indicated in Figure S2A, and then the full set of genes for a given cell line could be generated by combining sublibraries as follows: iPSC = Common + (iPSC, HFF) + iPSC HFF (not screened in this study) = Common + (iPSC, HFF) + iPSC U87 = Common + Cancer common + (U87, HEK293T) + U87 HEK293T = Common + Cancer common + (U87, HEK293T) + HEK293T K562* = Common + Cancer common + (K562, HeLa, MCF7) + (K562, HeLa) + K562 HeLa = Common + Cancer common + (K562, HeLa, MCF7) + (K562, HeLa) + HeLa MCF7/MDA-MB-231 = Common + Cancer common + (K562, HeLa, MCF7) + MCF7 *all 13 sublibraries were screened in K562s to validate the cell line expression sublibrary strategy; see Figure 5C Oligonucleotide pools were designed with flanking cloning and PCR sites as described, synthesized by Agilent Technologies (Santa Clara, CA), and cloned into the library sgRNA expression vector pCRISPRia-v2 (23,35). For the PVT1 tiling library, all possible sgRNAs from 25bp upstream of the PVT1 locus to 25bp downstream that passed the second-highest off-target stringency filter and restriction site filters were included. Non-targeting sgRNAs matching this design in base composition and off-target stringency were included, and oligonucleotide pools were synthesized and cloned as above. CRISPRi screens Growth screens Several cell lines expressing dCas9-KRAB were obtained from previous publications: HEK293T(22), HeLa(22), K562 (23), iPSCs (WTC-CRISPRi Gen IC)(33), and U87(42). MCF7 and MDA-MB-231 were generated for this study by infecting lentivirus expressing dCas9-KRAB-BFP (Addgene #46911; (22)) and sorting for single cell clones stably expressing high BFP. Replicates for these cell lines were performed in different clones. All cell lines except iPSCs were infected in duplicate with sgRNA the sublibraries described above or the PVT1 tiling library, packaged with TransIT-LT1 (Mirus, Madison,

4
WI) transfection in HEK293T cells (not expressing dCas9-KRAB), at an initial infection rate of 30-50% (300-500x coverage of the library). Cells were cultured for two days following infection, treated for two days with 0.75-1.00 µg/mL puromycin, allowed to recover for one day, and then cultured at a minimum coverage of 1000x for 12 days (K562, HEK293T, U87, HeLa) or 20 days (MCF7, MDA-MB-231) starting from this “T0.” K562 cells were passaged daily, while adherent cells were split on alternate days. iPSCs were infected at ~15% infection (with double the starting cell population to yield 300x coverage), grown for 3 days, selected with 1.5 µg/mL puromycin for 9 days, and allowed to recover for 3 days. iPSCs were then divided into two independent replicates and treated daily with 2µM doxycycline starting from this T0 and for the following 18 days (with primary endpoint at 12 days used here unless otherwise specified). Cells with a minimum of 1000x library coverage were harvested the day following puromycin recovery (T0) and at the endpoint, and processed for sequencing on Illumina HiSeq 2500 or 4000 as previously described(23,35). Sequencing reads were aligned to the expected CRiNCL library sequences, counted, and quantified using the ScreenProcessing pipeline (https://github.com/mhorlbeck/ScreenProcessing; (35)) Negative control genes were generated by randomly sampling (with replacement) ~10 non-targeting sgRNAs per negative control gene to match the true gene TSSs targeted by the library, and then scoring the negative control genes for effect size and Mann-Whitney p-value as was done for the true genes. Genes (LHnnn) with multiple TSSs were collapsed to a single score by selecting the one with the lowest Mann-Whitney p-value. In order to call hit genes from screens, we defined a “screen score” incorporating both the effect size and the p-values of genes in each screen. The screen score was calculated as | γ z-score from negative control gene distribution | x –log10 p-value, and for all screens a threshold of greater than or equal to 7 was applied to call hits. Neighbor hits were classified by first calculating the distance between the each lncRNA TSS and the TSS of the closest protein coding gene (TSS-pc distance). LncRNAs whose TSS-pc distance was less than 1000 bp, and whose neighboring protein coding gene was 1) scored as essential in our previous screen in K562 cells (23), 2) expressed in the cell type in consideration, and 3) had the same phenotype direction as the lncRNA, were then classified as neighbor hits. Hits that did not meet these criteria were left as lncRNA hits. OCT4 FACS-based screen iPSCs were harvested 9 days post-doxycycline addition from the growth screen samples above and fixed with 4% paraformaldehyde for 10 minutes at room temperature followed by PBS wash. 9 days was chosen to balance the longer duration of continuous target gene knockdown with dropout of cells containing sgRNAs conferring a negative growth phenotype. Cells were permeablized with 0.5% saponin (Sigma) in PBS with 4% FBS and 2mM EDTA, stained with 1:100 mouse monoclonal α-OCT3/4 antibody (sc-5279, Santa Cruz Biotechnology), washed with permeablization buffer, and stained with 1:200 Goat α-Mouse IgG-488 (A11029, Invitrogen) (33). Cells in the top and bottom 30% of OCT4 signal as measured on the FITC-A channel were sorted for purity on a FACS

5
AriaII custom. Sorted cells were then harvested for de-crosslinked genomic DNA using QIAamp DNA Formalin Fixed Paraffin Embedded Tissue kit (QIAGEN) following manufacturer’s instructions but omitting paraffin removal steps, using one column per million sorted cells. Genomic DNA was directly amplified for Illumina sequencing using Q5 DNA polymerase (New England Biolabs) and sequenced on a HiSeq 4000. Sequencing data was analyzed as described above. A screen for protein-coding genes required for robust growth in iPSCs was performed as with the iPSC lncRNA screen, with an endpoint at 14 days post-doxycycline addition. The screen was performed using the hCRISPRi-v2 H1 Drug Targets, Kinases, and Phosphatases sublibrary with 5 sgRNAs/gene (35), and was analyzed as above. sgRNA Validation sgRNAs for individual validation were cloned by annealing oligo pairs containing the sgRNA protospacer and flanking BstXI and BlpI cloning sites and ligating the resulting fragment into the sgRNA expression vector pU6-sgRNA EF1Alpha-puro-T2A-BFP (Addgene #60955). Internally controlled growth assays were performed by infecting cells with sgRNA lentiviruses at MOI < 1.0 and measuring the sgRNA+ fraction by BFP using flow cytometry on an LSRII (BD). Experiments were performed in biological triplicates from the infection step. RT-qPCR Cells were puromycin selected for 4 d (1 µg/mL) and subjected to 1 d recovery. K562 cells were infected for 48 hr, followed by 2 d puromycin treatment (3 µg/mL) and 2 d recovery. RNA was harvested with TRIzol and purified using the Direct-zol MiniPrep RNA purification kits (Zymo Research) with the on-column DNAse digestion step. cDNA were prepared with Transcriptor First Strand cDNA Synthesis Kit (Roche) using the oligo-dT protocol, and RT-qPCR was performed using LightCycler 480 SYBR Green I Master Mix (Roche) on a LightCycler 480 instrument (Roche). Experiments were performed in biological triplicates from the infection step. sgRNA protospacer sequences and RT-qPCR primers are listed in Table S11. RNA-seq sample preparation and data analysis following CRISPRi Cells were infected with sgRNA lentiviruses for 48 hr, followed by 4 d puromycin treatment (1 µg/mL) and 1 d recovery. K562 cells were infected for 48 hr, followed by 2 d puromycin treatment (3 µg/mL) and 2 d recovery. RNA was harvested using TRIzol and purified using the Direct-zol MiniPrep RNA purification kits (Zymo Research) with the on-column DNAse digestion step. RNA integrity was confirmed using the Agilent 2200 RNA ScreenTape. RNA-seq libraries were generated using TruSeq HT Stranded mRNA kit according to manufacturer’s protocol (illumina). cDNA was validated using the Agilent 2200 DNA 1000 ScreenTape, Qubit 2.0 Fluorometer (Life Technologies), and ddPCR (Bio-Rad). Cluster generation and sequencing was performed on a HiSeq 4000, using the single end 50 read protocol. Reads were aligned to the human genome (GRCh37) using the spliced read aligner HISAT2 v2.0.3 (65) against an index containing SNP and transcript information (genome_snp_tran). Quantification of Ensembl build 75 genes was carried out with featureCounts (66) using only uniquely mapped reads.

6
Library complexity was calculated by counting the number of genes with greater than 2 reads, and knockdown efficiency was calculated by normalizing gene Transcripts per Million (TPM) for the experimental samples with the mean TPM of the control knockdown samples. Samples with fewer than 11,000 genes detected and weaker than 40% lncRNA knockdown were filtered. Pairwise Pearson correlations between RNA-seq samples were obtained using the sets of genes exhibiting significant variation within each cell type using the likelihood ratio test in DESeq2 (67) with an adjusted p value threshold of 0.001. Differential expression analysis for individual lncRNA knockdowns was performed using the Wald test in DESeq2 with an adjusted p value threshold of 0.05, using unique sgRNAs against the same lncRNA TSS as biological replicates. For hierarchical clustering of co-expressed genes across multiple samples, we first grouped cells by cell type and then by the direction of phenotype of the sgRNA. Within each subgroup, we obtained the set of variable genes using the likelihood ratio test in DESeq2 (67) with an adjusted p value threshold of 0.001. These genes were then used for complete linkage hierarchical clustering using Pearson correlation coefficients as the distance metric. Sequencing data are deposited in GSE85011. ChIP-seq sample preparation and data analysis Cells were infected with sgRNA lentiviruses for 48 hr, followed by 4 d puromycin treatment (1 ug/mL) and 1 d recovery. Genome-wide histone modifications were determined by ChIP against H3K9me3 (Abcam ab8898) on 5 million cells as described in (68). Cells were cross-linked by adding 37% formaldehyde to a final concentration of 1% into culture medium and gently shaking for 10 min at room temperature. Reaction was quenched with glycine, and cells were then washed twice with ice-cold PBS containing protease inhibitors (1mM PMSF, 1X Roche cOmplete EDTA-free cocktail). Cells were scraped off of the plate using a cell lifter and pelleted for 5 min at 2,000 rpm at 4°C. Pellet was snap-frozen in liquid nitrogen and stored at −80°C. Pellet was then thawed and resuspended in Cell Lysis Buffer (5 mM PIPES pH 8, 85 mM KCl, freshly added 1% IGEPAL) with protease inhibitors (Pierce Halt Protease Inhibitor Cocktail). Cells were then homogenized using a type B glass dounce homogenizer, pelleted, and resuspended in Nuclei Lysis Buffer (50 mM Tris-HCl pH 8, 10 mM EDTA, 1% SDS). Chromatin was sonicated in Diagenode TPX tubes using the Diagenode Bioruptor for 20 cycles and DNA was ranged from 150–700 bps as determined by gel electrophoresis. Debris was pelleted and discarded, and an aliquot was removed for Input DNA sequencing from the sonicated chromatin within the supernatant. Sonicated chromatin was then diluted 5-fold in IP Dilution Buffer (50 mM Tris–HCl pH 7.4, 150 mM NaCl, 1% IGEPAL, 0.25% deoxycholic acid, 1 mM EDTA pH 8) with protease inhibitors and pre-cleared with Life Technologies Protein G Dynabeads for 2 hr at 4°C. 5 µg of antibody was added per million cells, and samples were incubated overnight at 4°C. Antibody-bound chromatin was then collected using Life Technologies Protein G Dynabeads and washed twice with IP Dilution Buffer, twice with IP Wash Buffer 2 (100 mM Tris–HCl pH 9, 500 mM LiCl, 1% IGEPAL, 1% deoxycholic acid), and once with IP Wash Buffer 3 (100 mM Tris–HCl pH 9, 500 mM LiCl, 150 mM NaCl, 1% IGEPAL, 1% deoxycholic acid). Precipitated chromatin was then eluted for 30 min at 65°C with Elution Buffer (1% SDS, 50 mM NaHCO3). ChIP and Input DNA crosslinks

7
were reversed by adding 5 M NaCl and heating at 65°C overnight. The following day, 10 mg/ml RNase A was added to precipitated chromatin, and chromatin was incubated for 30 min at 37°C. DNA was then recovered using Agencourt AMPure XP Beads and quantified using the Life Technologies Qubit Fluorometer. ChIP DNA was then used for library preparation using the Kapa HyperPlus library preparation kit. 100ng of ChIP DNA was used for end repair and A-tailing. Illumina adapters were then ligated to the end-repair products. The library was amplified for 6 cycles before post-amplification cleanup using SPRI beads. Libraries were then quantified with the Life Technologies Qubit Fluorometer, and library size was confirmed using Agilent TapeStation 2200. ChIP-seq libraries were sequenced on a HiSeq 4000, 50 read single end. Reads were aligned to the human genome (GRCh37) using bowtie v2.2.8 (69). Enrichment at promoter regions, which were defined as +/- 1kb of each TSS and generated from Ensembl GRCh37 build 75, were quantified using featureCounts v1.5.0-p2 (66). Signal was visualized using deepTools2 bamCoverage (70), normalizing reads to 1x sequencing depth. Differential H3K9me3 enrichment was analyzed using DESeq2 (67) , treating distinct sgRNAs against the same lncRNA TSS as replicate samples. Sequencing data are deposited in GSE85011. Antisense oligonucleotide knockdown and proliferation assay Antisense locked nucleic acid gapmers were designed against LINC00263 using the Exiqon web server. Cells were transfected with the specified ASOs including negative control “A” at a final concentration of 50nM using Lipofectamine RNAimax Reagent (Invitrogen) according to the manufacturer's instructions. After 48 hours of transfection cells were seeded in duplicate. In order to maintain gene depletion, cells were transfected for a second time 7 days after the first transfection. Cell counting was performed every 2 days using Countess Automated Cell Counter (Invitrogen). Flow cytometry for cell cycle analysis Cells were transfected with the specified ASOs as described above. After 72 hours of transfection cells were pulsed with 33 µM bromodeoxyuridine (BrdU) for 20 min, and afterwards fixed in 70% ethanol. Subsequently cells were stained with primary anti-BrdU antibody (Clone B44; BD Biosciences) for 1 h, followed by 1 h incubation with Alexa Fluor 488 anti-mouse IgG (Invitrogen). DNA was counterstained by 0.1 mg/ml propidium iodide supplemented with RNase for 1 h at 37°C. Analysis was performed on a FACSCalibur using CellQuest software (BD). Quantification and analysis of cell-cycle profiles were obtained using FlowJo (Tree Star, Inc). Machine learning of lncRNA properties Genomic features were obtained from multiple sources. RNA-seq data were the same as used above for sgRNA library generation. Enhancer maps were obtained from the Fantom 5 Transcribed Enhancer Atlas (48), and VISTA Enhancer Browser set of experimentally confirmed human enhancers (49). Cell type-specific enhancer and super-enhancer maps for HeLa, U87, K562, and MCF7 cells were obtained from (51).

8
LncRNA loci were considered near a (super)enhancer if it overlapped with or was within 1kb of a mapped enhancer. Cancer associated SNPs from the NHGRI GWAS Catalog were obtained from (50) and noted if any were within 5 kb of a lncRNA locus. Cell type-specific copy number variation data for HEK293T, HeLa, K562, U87, and MCF7 cells were obtained from ENCODE (GSE40698) and intersected with lncRNA loci. ChIA-pet data for HeLa, K562, and MCF7 cell lines were obtained from ENCODE (GSE39495). LncRNA loci that were overlapped completely by a Pol2 or CTCF loop with a score of at least 400 were noted. LncRNAs with mouse orthologs were identified using Slncky (52). To generate machine learning models, lncRNAs phenotypes were binarized as hit (1) or non-hit (0) and used as the response variable. Categorical variables were assigned as either 1 or 0. Missing data, e.g. super-enhancer or CNV information for cell lines for which data were not available, were assigned the value of 0. Predictor variables were then centered to the mean and z standardized. Expression levels were log transformed. To avoid confounding by nearby protein coding genes, only lncRNAs whose TSS were > 1kb from a protein coding TSS were considered. Several classes of models were generated and tested, using the R package caret on randomly sampled training (75% of data) and testing (25% of data) sets from our screen results. Logistic regression outperformed both support vector machines (least squares, polynomial kernel, radial kernel) and random forests in accurately classifying test sets of lncRNAs as hits or non-hit. Therefore, we used logistic regression to identify significant predictors of lncRNA hits. 100 iterations of ten-fold cross validation was performed by randomly withholding 10% of the dataset and training logistic regression models using the remaining data. Those predictors that repeatedly scored as significant (p < 0.01) were noted as reliable.

9
Author Contributions
M.A.H., S.J.L., J.S.W., D.A.L., and H.Y.C. conceived the project, interpreted the data, and wrote the manuscript. M.A.H. and S.J.L designed sgRNA library, performed RNA-seq, qPCR, growth assays, and analyzed data. S.J.L. performed screens in U87 and HeLa cells, 4C-seq, and machine learning. M.A.H. performed screens in K562, HEK293T, and iPS cells. S.W.C. performed screens and validation experiments in MCF7 and MDA-MB-231 cells. H.S.B., M.M., and F.J.A. performed qPCR, growth assays, and ASO experiments. D.H. performed ChIP-seq. J.E.V. cloned sgRNA libraries. M.Y.C. and Y.C. performed validation experiments. M.A.M., M.P.O., and B.R.C. contributed to iPSC experiments and performed iPSC protein-coding screens. L.A.G. contributed to data interpretation and project conception.

0
1
2
log2(T
PM
+ 1
)
log2(TPM + 1)
K562
iPSC
U87
HEK293T
MDAM
B231
HeLa
MCF7
Figure S1. Expression levels of lncRNAs targeted in the CRiNCL library. Rows correspond to those used in Figure 1A. TPM, transcripts per million.

-1.2-1.0-0.8-0.6-0.4-0.2-0.00.2
HeLa U87 K562
-1.2 -1.0 -0.8 -0.6 -0.4 -0.2 -0.0 0.2
-1.2-1.0-0.8-0.6-0.4-0.2-0.00.2 iPSC
-1.2 -1.0 -0.8 -0.6 -0.4 -0.2 -0.0 0.2
MCF7
-1.2 -1.0 -0.8 -0.6 -0.4 -0.2 -0.0 0.2
MDA-MB-231
Common to all 7 cell lines
1,329 genes
K562
2,831
HeLa
2,337
U87
2,307
HEK293T
2,253
K562, HeLa
1,051 genes
MCF7
2,913
K562, HeLa, MCF7
875 genes
U87, HEK293T
1,443 genes
iPSC
2,965
HFF
4,103
iPSC and HFF
1,269 genes
Common to all 5 cancer cell lines
675 genes
A
C
D
B
0.0
0.2
0.4
0.6
0.8
1.0
0 2 4 6 8 10 12 14 16 18
Days post library Infection
sgR
NA
+ fra
ction
U87, rep1
U87, rep2
HeLa, rep1
HeLa, rep2
puromycin
sgRNA γ , replicate 1
sg
RN
A γ
, rep
licate
2
lncRNA targeting sgRNAs
non-targeting sgRNAs
0
25
50
75
100
125
150
Screen
sco
re, rep
licate
2
HeLa U87 K562
0 25 50 75 100 125 150
0
25
50
75
100
125
150iPSC
0 25 50 75 100 125 150Screen score, replicate 1
MCF7
0 25 50 75 100 125 150
MDA-MB-231

Figure S2. CRISPRi growth screens performed in seven cell lines. A) Schematic of sublibrary divisions of the CRiNCL library. The library was divided into 13 sublibraries based on expression in 7 cell lines to facilitate library cloning and allow for targeted screens. Combinations of sublibraries were selected for screening in each cell line studied as described in Methods. B) Fraction of cells containing the sgRNA library over the course of the U87 and HeLa screens. sgRNA-containing fraction measured as the fraction of high-BFP-expressing cells by flow cytometry. C) sgRNA γ for replicate screens performed in 6 cell lines, as in Figure 1C. Only one replicate was performed for HEK293T. D) Screen scores from replicate screens for individual lncRNA loci. Screen scores were calculated as described in Methods.

0 5 10 15 20 25 30
Screen score
0.0
0.1
0.2
0.3
0.4
0.5
Negative c
ontr
ol hits / tota
l hits
over
thre
shold
HeLa
U87
K562
HEK293T
iPS
MCF7
MDAMB231
C
5% false discovery rate
Screen score
threshold used Distance to nearest essentialprotein-coding gene TSS
lncRNA hitspassing threshold
1.0kb
2.5kb
5.0kb
10.0kb
499
490
485
480
D
gene γ (average of top 3 sgRNAs)
-log1
0 M
ann-
Whi
tney
p-v
alue
-0.4 -0.2 0.0
0
1
2
3
4
5
6
7
8
HeLa
-0.4 -0.2 0.0
U87
-0.4 -0.2 0.0
K562
-0.2 0.0
HEK293T
-1.0 -0.8 -0.6 -0.4 -0.2 -0.0
0
1
2
3
4
5
6
7
8iPSC
-0.4 -0.2 0.0
MCF7
-0.4 -0.2 0.0 0.2
MDA-MB-231
> 1kblncRNA
essential
mRNA
lncRNA
essential
mRNA< 1kb
BlncRNA hit
neighbor hit
lncRNA
< 1kb
essential
mRNA
neighbor hit
gene
Neg Ctrl gene
lncRNA hit
neighbor hit
Neg Ctrl hit
A
combined
Figure S3. CRISPRi growth screen results and validation of thresholds used in screen analysis. A) Volcano plots for screens performed in 7 cell lines, as in Figure 1D. Hits that were
considered neighbor hits (see B) are labeled. B) Schematic of definitions of “lncRNA hit”
and “neighbor hit.” C) Fraction of negative control genes called as hits out of total
number of hits above the indicated screen score threshold, calculated for each cell line
and the combined dataset. D) Number of lncRNA hits classified after eliminating
neighbor hits within the indicated distance from any essential protein-coding gene. A
1.0kb threshold was used for all analysis.

Essential 10bp 100bp 1kb 10kb 100kbDistance to nearest essential gene
−1.0
−0.8
−0.6
−0.4
−0.2
0.0
All genes−1.0
−0.8
−0.6
−0.4
−0.2
0.0
Essential 10bp 100bp 1kb 10kb 100kbDistance to nearest essential gene
−0.6
−0.4
−0.2
0.0
0.2
All genes
−0.6
−0.4
−0.2
0.0
0.2
Essential 10bp 100bp 1kb 10kb 100kbDistance to nearest essential gene
−0.6−0.5−0.4−0.3−0.2−0.1
0.00.1
All genes−0.6−0.5−0.4−0.3−0.2−0.10.00.1
Essential 10bp 100bp 1kb 10kb 100kbDistance to nearest essential gene
−0.5
−0.4
−0.3
−0.2
−0.1
0.0
0.1
All genes−0.5
−0.4
−0.3
−0.2
−0.1
0.0
0.1
Essential 10bp 100bp 1kb 10kb 100kbDistance to nearest essential gene
−0.4
−0.3
−0.2
−0.1
0.0
0.1
0.2
All genes−0.4
−0.3
−0.2
−0.1
0.0
0.1
0.2
Essential 10bp 100bp 1kb 10kb 100kbDistance to nearest essential gene
−0.6−0.5−0.4−0.3−0.2−0.1
0.00.1
All genes−0.6−0.5−0.4−0.3−0.2−0.10.00.1
Gen
e γ
(ave
rage
of t
op 3
sgR
NAs
)
K562 protein-coding iPSC protein-coding
K562 lncRNA iPSC lncRNA
U87 lncRNA HeLa lncRNA
Gen
e γ
(ave
rage
of t
op 3
sgR
NAs
)
Figure S4. CRISPRi growth phenotypes relative to gold standard essential genes. Distribution of gene relative to the nearest gold standard essential protein-coding gene (44). Points indicate individual gene scores and blue shaded regions represent 5th, 25th, 50th, 75th, and 95th percentiles of all genes within 10-fold of the position. Screen data plotted are from the indicated protein-coding screens ((35) and Figure S4) or lncRNA screens.

102 1030
100
0
FITC fluorescence
intensity
% m
ax
2° antibody only
α-OCT3/4 antibody
sorted 5x10⁶ cells each
OCT4high
OCT4low
A
−0.8 −0.6 −0.4 −0.2 0.0 0.2gene γ, T18 (average of top 3 sgRNAs)
−6
−5
−4
−3
−2
−1
0
1
2
3
OC
T4 s
ignal enrichm
ent
(avera
ge o
f to
p 3
sgR
NA
s)
C
−4 −2 0 2
OCT4 signal enrichment (average of top 3 sgRNAs)
0
1
2
3
4
5
6
7
8
-log10 M
an
n-W
hitney p
-valu
eB
gene
Neg Control
lncRNA hit
Neg Control Hit
OCT4 neighbor
XLOC_042027
TAF6L neighbor
RP110727F15.11
Figure S5. A FACS-based screen for OCT4 expression identifies genes that modify iPSC differentiation. A) Representative FACS histogram of OCT4 staining of iPSCs, with high and low 30% fractions highlighted. 5x10⁶ cells from each fraction were sorted and processed for Illumina sequencing. OCT4 signal enrichment was calculated as the fraction of each sgRNA present in the high sample versus the low sample. B) Volcano plot of screen results, as in Figure 1D. C) Gene growth phenotypes from iPSC screen compared to OCT4 signal enrichment. The results suggests that all OCT4 screen hits also modify cell growth rates, but that most growth screen hits are not accompanied by changes in OCT4 expression.

0.0 0.2 0.4 0.6 0.8 1.0
Recall
0.0
0.2
0.4
0.6
0.8
1.0
Pre
cis
ion
Discrimination of essential genes
iPSC H1 sublibrary
K562 H1 sublibrary
K562 genome-wide
−0.5 −0.4 −0.3 −0.2 −0.1 0.0 0.1
gene γ (average of top 3 sgRNAs)
0.0
0.5
1.0
1.5
2.0
2.5
3.0
3.5
4.0
-log10 M
ann-W
hitney p
-valu
e
−0.6 −0.4 −0.2 0.0 0.2
K562 gene γ(average of top 3 sgRNAs)
−0.6
−0.4
−0.2
0.0
0.2
iPSC
gene γ
(ave
rage
of t
op 3
sgR
NAs
)
A
B C
Gene
Neg ControlHit gene
Neg Control Hit
Figure S6. A CRISPRi screen for protein-coding genes that modify growth in iPSC. A) Volcano plot for iPSC screen performed with the hCRISPRi-v2 H1 sublibrary, 5
sgRNAs/gene, displayed as in Figure 1D. Data are the average of two replicate screens.
B) Scatter plot of gene from growth screens performed in K562 (35) and iPSC. K562
screen was performed with the genome-wide hCRISPRi-v2 library and reanalyzed here
using only the H1 5 sgRNAs/gene sublibrary. C) Discrimination of gold-standard
essential genes from non-essential genes (44) for K562 and iPSC screens, ranked by gene
. K562 genome-wide and H1 data were analyzed using the 5 sgRNAs/gene sublibraries.

sgR
NA
γ
sgRNA tiling of PVT1 in U87
Upstream TSS
Exon
Intron
A
LINC00263
XLOC_14806
LINC00909
MIR29A
CTB-51J22.1
RP11-416I2.1
PVT1
0.0
0.5
1.0
1.5U87
Gal4sgRNA-1sgRNA-2
PVT1
SNHG1
RPPH1
RP11-96K19.5
EPB41L4A-AS1
LINC00680
LINC00263
LINC00909
0.0
0.5
1.0
1.5
Rel
ativ
e R
NA
abun
danc
e
MCF7Gal4sgRNA-1sgRNA-2
C
non-targeting sgRNA
targeting sgRNAs
ranked by predicted
activity
MINCRLOC100506710
LINC00467ERVK3
DANCR
2.0
1.5
0.5
1.0
0.0Rela
tive R
NA
abundance in U
87
B
Rel
ativ
e R
NA
abun
danc
e
Ensembl transcript TSSs
sgRNAs targeting:
0 50 100 150 200 250 300position relative to TSS (kb)
-0.60
-0.45
-0.30
-0.15
0.00
0.15 FANTOM enhancers
0 5 10position relative to TSS (kb)
-0.60
-0.45
-0.30
-0.15
0.00
0.15
sgR
NA
γ
Upstream TSS
Exon
Intron
Ensembl transcript TSSs
sgRNAs targeting:
FANTOM enhancers
Figure S7. lncRNA CRISPRi produces robust knockdown and is specific to the TSS. A) Relative RNA abundance of lncRNA hits upon knockdown with CRIPSRi. Bars
represent mean and standard deviation of 3 biological replicates. B) sgRNA growth
phenotypes from tiling screen of PVT1 in U87 cells by position. sgRNA position was
calculated as the genomic coordinate of the protospacer adjacent motif (PAM) relative to
the PVT1 p1 FANTOM TSS. sgRNA is the average of two replicates. TSS, exon, and
intron are defined as in Figure 2D. Green line represents median phenotype of all
sgRNAs within 250bp. C) Relative RNA abundance in U87 of lncRNA genes that were
not hits in any cell line, as with Figure F,G.

u87_PVT1up_1
u87_PVT1up_2
u87_RP11−126L15.4_1
u87_RP11−126L15.4_2
u87_PVT1_1
u87_PVT1_2
u87_XLOC
_010347_2
u87_LINC
00909_1
u87_LINC
00909_2
U87 Pro-growth
Translation 3.17E-37
DNA replication 2.01E-10Mitotic cell cycle 8.29E-09
Chromatin mod. 9.20E-11Endosomal transport 6.57E-09Posttanscriptional reg. 2.99E-08
GO Term p value
-2 -1 0 1 2
log2 Fold Change
hela_RP5−1148A21.3_1
hela_RP5−1148A21.3_2
hela_CTC
−428G20.6_2
hela_RP11−1094M
14.11_1hela_XLO
C_017263_2
hela_RP11−1094M
14.11_2hela_C
CAT1up_1
hela_CC
AT1up_2hela_XLO
C_017263_1
hela_CC
AT1_1hela_C
CAT1_2
hela_KB−1471A8.1_1hela_KB−1471A8.1_2hela_M
IR17H
G_2
hela_LAMTO
R5−AS1_1
hela_LAMTO
R5−AS1_2
HeLa Anti-growth
Integrin Signaling 4.25E-12p53 pathway 2.97E-04
ECM organization 9.51E-24
Lysosome 2.17E-08
Mitotic cell cycle 4.10E-39Ribosome 7.35E-18DNA replication 3.58E-06
GO Term p value
u8
7_
MIR
21
0H
G_
1u
87
_M
IR2
9A
_1
u8
7_
MIR
29
A_
2u
87
_E
PB
41
L4
A−
AS
1_2
u8
7_A
C0
16
83
1.7
_1
u8
7_
XL
OC
_0
40
56
6_2
u8
7_
CT
C−
42
8G
20
.6_1
u8
7_
CT
C−
42
8G
20
.6_2
u8
7_
XL
OC
_0
29
03
7_1
u8
7_
XL
OC
_0
51
50
9_1
u8
7_
XL
OC
_0
26
11
8_2
u8
7_
SN
HG
12
_1
u8
7_
SN
HG
12
_2
u8
7_
XL
OC
_0
54
06
8_1
u8
7_
SN
HG
1_
1u
87
_S
NH
G1
_2
u8
7_
LIN
C0
02
63
_2
u8
7_
RP
11
−9
6L
14
.7_1
u8
7_
RP
11
−9
6L
14
.7_2
u8
7_
XL
OC
_0
15
11
1_2
u8
7_
XL
OC
_0
54
06
8_2
u8
7_
XL
OC
_0
14
80
6_2
u8
7_
XL
OC
_0
14
80
6_1
u8
7_
XL
OC
_0
14
80
6up_2
u8
7_
LIN
C0
02
63
_1
u8
7_
RP
11
−7
34
K2
.4_1
u8
7_
XL
OC
_0
26
11
8_1
u8
7_
RP
11
−7
34
K2
.4_2
u8
7_
RP
11
−9
73
D8
.4_1
u8
7_
TR
AM
2−
AS
1_
2u
87
_L
INC
00
68
0_
1u
87
_L
INC
00
68
0_
2u
87
_E
PB
41
L4
A−
AS
1_1
u8
7_
MIR
21
0H
G_
2u
87
_X
LO
C_
01
48
06up_1
u8
7_A
C0
16
83
1.7
_2
u8
7_
RP
11
−1
09
4M
14.1
1_2
u8
7_
RP
11
−1
09
4M
14.1
1_1
u8
7_
XL
OC
_0
15
11
1_1
U87 Anti-growth
Translation 2.89E-31
Gene expression 3.84E-12Neg. reg. cell cycle 5.79E-08
Integrin Signaling 1.27E-03p53 pathway 2.89E-03VEGF signaling 6.01E-03PDGF signaling 8.09E-03
EGF signaling 1.91E-07
GO Term p value
k562_RP11−392P7.6_1
k562_LINC
00910_1k562_LIN
C00910_2
k562_EPB41L4A−AS1_1k562_XLO
C_038702_1
k562_LINC
00909_1k562_LIN
C00909_2
k562_XLOC
_042889_1k562_XLO
C_042889_2
k562_MIR
142_1k562_M
IR142_2
k562_XLOC
_018520_2k562_EPB41L4A−AS1_2k562_R
P11−347C12.10_1
K562 Anti-growthPlatelet degranulation 1.58E-05Phagocytosis 1.05E-04
Response to O2 levels 4.97E-05
Hematopoietic differentiation 1.58E-05Carbon metabolism 3.50E-04Biosynth. amino acids 5.01E-04
GO Term p value
A B
C
D
ATF3
CHAC1
SOST
SHH
DDIT4L
−2024
−2024
−2024
−2024
−2024
AC01
6831
.7_1
AC01
6831
.7_2
CTC
−428
G20
.6_1
CTC
−428
G20
.6_2
EPB4
1L4A
−AS1
_1EP
B41L
4A−A
S1_2
LIN
C00
263_
1LI
NC
0026
3_2
LIN
C00
680_
1LI
NC
0068
0_2
MIR
210H
G_1
MIR
210H
G_2
MIR
29A_
1M
IR29
A_2
RP1
1−10
94M
14.1
1_1
RP1
1−10
94M
14.1
1_2
RP1
1−73
4K2.
4_1
RP1
1−73
4K2.
4_2
RP1
1−96
L14.
7_1
RP1
1−96
L14.
7_2
RP1
1−97
3D8.
4_1
SNH
G1_
1SN
HG
1_2
SNH
G12
_1SN
HG
12_2
TRAM
2−AS
1_2
XLO
C_0
1480
6_1
XLO
C_0
1480
6_2
XLO
C_0
1480
6up_
1XL
OC
_014
806u
p_2
XLO
C_0
1511
1_1
XLO
C_0
1511
1_2
XLO
C_0
2611
8_1
XLO
C_0
2611
8_2
XLO
C_0
2903
7_1
XLO
C_0
4056
6_2
XLO
C_0
5150
9_1
XLO
C_0
5406
8_1
XLO
C_0
5406
8_2
sgRNA
log2
Fol
d C
hang
e
F
0
1
2
3
4
5
6
XLOC_0
1511
1
MIR29
A
PVT1_1
MIR21
0HG
LINC00
680
XLOC_0
5406
8
AC0168
31.7
RP11−1
26L1
5.4
XLOC_0
5150
9
XLOC_0
4056
6
TRAM2−AS1
XLOC_0
1034
7
LINC00
263
RP11−7
34K2.4
CTC−428
G20.6
RP11−9
73D8.4
XLOC_0
2611
8
PVT1_2
LINC00
909
EPB41L4
A−AS1
RP11−9
6L14
.7
SNHG1
RP11−1
094M
14.11
XLOC_0
1480
6_1
XLOC_0
2903
7
SNHG12
XLOC_0
1480
6_2
|log2
Fol
d C
hang
e|
0
1
2
3
4
5
6
XLOC_0
1726
3
KB−147
1A8.1
LINC00
263
RP5−11
48A21
.3PVT1
LINC00
909
RP11−1
094M
14.11
CCAT1_
2
LAMTO
R5−AS1
LINC00
680
CTC−428
G20.6
MIR17
HG
CCAT1_
1
|log2
Fol
d C
hang
e|
0
1
2
3
4
5
6
LINC00
910
LINC00
909_
k
LINC00
263
LINC00
680
EPB41L4
A−AS1
XLOC_0
1852
0
MIR14
2
RP11−3
47C12
.10
LINC00
909
XLOC_0
4288
9
|log2
Fol
d C
hang
e|
U87 RNA-seq
HeLa RNA-seq K562 RNA-seq
E
enrichment
3.15
3.913.27
2.282.921.95
enrichment
3.62
2.532.52
2.172.332.702.922.33
enrichment
5.086.315.75
14.7
7.449.0215.8
enrichment
28.936.5
5.76
17.912.511.4

Figure S8. lncRNA CRISPRi produces co-expressed transcriptome responses. Heatmaps of differentially expressed genes across samples segregated by (A) U87 pro-growth, (B) U87 anti-growth, (C) HeLa anti-growth, (D) K562 anti-growth. Significant gene ontology terms are indicated next to the clusters in which they are enriched, annotated with p value and enrichment. Fold changes are relative to non-targeting controls within the same cell type. E) Distributions of absolute value log2 fold changes for differentially expressed genes (adj. p < 0.05) for each lncRNA knockdown. F) Panel of genes consistently upregulated or downregulated across multiple CRISPRi samples in U87.

# of Differentially Expressed genes (adj p value < 0.05) at each Chromosome
AC016831.7 CTC−428G20.6 EPB41L4A−AS1 LINC00263 LINC00680
LINC00909 MIR210HG MIR29A PVT1_2 PVT1_1
RP11−1094M14.11 RP11−126L15.4 RP11−734K2.4 RP11−96L14.7 RP11−973D8.4
SNHG1 SNHG12 TRAM2−AS1 XLOC_010347 XLOC_014806_2
XLOC_014806_1 XLOC_015111 XLOC_026118 XLOC_029037 XLOC_040566
XLOC_051509 XLOC_054068
01234
0.00.51.01.52.0
01234
05
10
0.02.55.07.5
01020
0.00.51.01.52.0
0200400600
010203040
0100200300400
0.00.51.01.52.0
010203040
0.00.51.01.52.0
010203040
0481216
0204060
0306090
0.000.250.500.751.00
0306090
0123
0.000.250.500.751.00
0.000.250.500.751.00
0.000.250.500.751.00
0123
0.00.51.01.52.0
012345
0.00.51.01.52.0
1 10 11 12 13 14 15 16 17 18 19 2 20 21 22 3 4 5 6 7 8 9M
T X Y 1 10 11 12 13 14 15 16 17 18 19 2 20 21 22 3 4 5 6 7 8 9M
T X Y 1 10 11 12 13 14 15 16 17 18 19 2 20 21 22 3 4 5 6 7 8 9M
T X Y 1 10 11 12 13 14 15 16 17 18 19 2 20 21 22 3 4 5 6 7 8 9M
T X Y 1 10 11 12 13 14 15 16 17 18 19 2 20 21 22 3 4 5 6 7 8 9M
T X Y
1 10 11 12 13 14 15 16 17 18 19 2 20 21 22 3 4 5 6 7 8 9M
T X Y 1 10 11 12 13 14 15 16 17 18 19 2 20 21 22 3 4 5 6 7 8 9M
T X Y
# D
E ge
nes
# DE genes on trans chromosome
# DE genes on cis chromosome
CTC−428G20.6 LINC00263 LINC00680 LINC00909 RP11−1094M14.11
CCAT1_2 CCAT1_1 KB−1471A8.1 LAMTOR5−AS1 MIR17HG
RP5−1148A21.3 XLOC_017263 PVT1
0
1
2
3
0.00
0.25
0.50
0.75
1.00
012345
0.00
0.25
0.50
0.75
1.00
0.00
0.25
0.50
0.75
1.00
0
30
60
90
0.02.55.07.5
10.012.5
0.0
0.5
1.0
1.5
2.0
0.0
2.5
5.0
7.5
0.00
0.25
0.50
0.75
1.00
0.0
0.5
1.0
1.5
2.0
0.00
0.25
0.50
0.75
1.00
0
1
2
3
1 10 11 12 13 14 15 16 17 18 19 2 20 21 22 3 4 5 6 7 8 9M
T X Y 1 10 11 12 13 14 15 16 17 18 19 2 20 21 22 3 4 5 6 7 8 9M
T X Y 1 10 11 12 13 14 15 16 17 18 19 2 20 21 22 3 4 5 6 7 8 9M
T X Y 1 10 11 12 13 14 15 16 17 18 19 2 20 21 22 3 4 5 6 7 8 9M
T X Y 1 10 11 12 13 14 15 16 17 18 19 2 20 21 22 3 4 5 6 7 8 9M
T X Y
1 10 11 12 13 14 15 16 17 18 19 2 20 21 22 3 4 5 6 7 8 9M
T X Y 1 10 11 12 13 14 15 16 17 18 19 2 20 21 22 3 4 5 6 7 8 9M
T X Y 1 10 11 12 13 14 15 16 17 18 19 2 20 21 22 3 4 5 6 7 8 9M
T X Y
# D
E ge
nes
HeLa
EPB41L4A−AS1 LINC00263 LINC00680 LINC00909 LINC00909_k
LINC00910 MIR142 RP11−347C12.10 XLOC_018520 XLOC_042889
0.00
0.25
0.50
0.75
1.00
0.00
0.25
0.50
0.75
1.00
0.00
0.25
0.50
0.75
1.00
0
1
2
3
0.0
0.5
1.0
1.5
2.0
0.0
0.5
1.0
1.5
2.0
0.00
0.25
0.50
0.75
1.00
0.00
0.25
0.50
0.75
1.00
0
1
2
3
0
10
20
30
40
50
1 10 11 12 13 14 15 16 17 18 19 2 20 21 22 3 4 5 6 7 8 9M
T X Y 1 10 11 12 13 14 15 16 17 18 19 2 20 21 22 3 4 5 6 7 8 9M
T X Y 1 10 11 12 13 14 15 16 17 18 19 2 20 21 22 3 4 5 6 7 8 9M
T X Y 1 10 11 12 13 14 15 16 17 18 19 2 20 21 22 3 4 5 6 7 8 9M
T X Y 1 10 11 12 13 14 15 16 17 18 19 2 20 21 22 3 4 5 6 7 8 9M
T X Y
# D
E ge
nes
K562
U87

Figure S9. Chromosome distribution of differentially expressed genes after each lncRNA knockdown. Red bars indicate chromosomes harboring the lncRNAs of interest (cis). Gray bars represent chromosomes that do not contain the lncRNAs of interest (trans).
−2.0
−1.5
−1.0
−0.5
0.0TR
IB1
RN
7SL5
90P
RP1
1−13
6O12
.2R
P11−
65D
17.1
FAM84B
RP1
1−89
K10.
1R
P11−
89K1
0.2
PCAT
2PR
NC
R1
CAS
C19
CCAT
1C
ASC
8R
P11−
382A
18.3
RP1
1−38
2A18
.2PO
U5F
1BC
ASC
11M
YCPV
T1M
IR12
05R
NU
1−10
6PM
IR12
07
log2
Fol
d C
hang
eHeLa − CCAT1_2
−1.0
−0.5
0.0
REE
P5C
TC−4
87M
23.5
CTC
−487
M23
.7D
CP2
MC
CC
TD−2
201G
3.1
YTH
DC
2TR
IM36
CTC
−428
G20
.3PG
GT1
BC
TC−4
28G
20.6
CC
DC
112
HM
GN
1P15
CTN
NAP
1C
CT5
P1FE
M1C
TMED
7−TI
CAM
2TI
CAM
2AC
0102
26.4
TMED
7C
TC−5
05O
3.1
HeLa − CTC−428G20.6
−2
−1
0
EXT1
SAM
D12
RPS
26P3
5TN
FRSF
11B
MAL
2N
OV
ENPP
2TA
F2D
SCC
1R
N7S
L396
PKB
−147
1A8.
1D
EPTO
RR
P11−
760H
22.2
CO
L14A
1M
RPL
13M
TBP
SNTB
1R
P11−
713M
15.2
HAS
2H
AS2−
AS1
RP1
1−94
A24.
1
HeLa − KB−1471A8.1
−1.5−1.0−0.5
0.0
XXba
c−BP
GBP
G55
C20
.2G
USB
P4LI
NC
0068
0XX
bac−
BPG
55C
20.7
MTR
NR
2L9
FKBP
1CLG
SNR
P3−4
07E4
.3PT
P4A1
RPL
7AP3
4R
P5−1
148A
21.3
RPL
9P18
PHF3
EYS
RP1
1−59
D5_
_B.2
GC
NT1
P4AD
H5P
4N
UFI
P1P
LMBR
D1
NPM
1P37
CO
L9A1
log2
Fol
d C
hang
eHeLa − RP5−1148A21.3
−0.8
−0.4
0.0AC
1415
86.5
PDPK
2ER
VK13
−1KC
TD5
PRSS
27SR
RM
2−AS
1SR
RM
2TC
EB2
PRSS
33PR
SS21
XLO
C_0
1852
0LA
16c−
352F
10.1
ZG16
BPR
SS30
PPR
SS22
LA16
c−32
5D7.
2FL
YWC
H2
FLYW
CH
1LA
16c−
321D
4.1
KREM
EN2
PKM
YT1
K562 − XLOC_018520
−3
−2
−1
0
LIN
C01
010
RP1
1−55
7H15
.4R
P3−3
52A2
0.1
ALD
H8A
1H
BS1L
CTA
−212
D2.
2MYB
MYB
−AS1
AHI1
RP3
−388
E23.
2XL
OC
_042
889
Y_R
NA
LIN
C00
271
GAP
DH
P73
RP1
3−14
3G15
.3R
P13−
143G
15.4
MTF
R2
BCLA
F1R
P3−4
06A7
.7M
AP7
RP3
−406
A7.3
K562 − XLOC_042889
−1.0
−0.5
0.0
CTC
−487
M23
.5C
TC−4
87M
23.7
DC
P2M
CC
CTD
−220
1G3.
1YT
HD
C2
KCN
N2
TRIM
36C
TC−4
28G
20.3
PGG
T1B
CTC
−428
G20
.6C
CD
C11
2C
TNN
AP1
CC
T5P1
FEM
1CTI
CAM
2AC
0102
26.4
TMED
7C
DO
1AT
G12
AP3S
1
log2
Fol
d C
hang
e
U87 − CTC−428G20.6
−2.0
−1.5
−1.0
−0.5
0.0
DN
MBP
ERLI
N1
CH
UK
RP1
1−31
6M21
.6C
WF1
9L1
PHBP
9BL
OC
1S2
PKD
2L1
RP1
1−34
D15
.2SC
DLI
NC
0026
3SE
C31
BN
DU
FB8
HIF
1AN
RP1
1−17
9B2.
2FA
M17
8AR
P11−
108L
7.14
MR
PL43
SEM
A4G
RP1
1−10
8L7.
4C
10or
f2
U87 − LINC00263
−1
0
1
CPA
5C
PA1
CEP
41MES
Ths
a−m
ir−33
5C
OPG
2R
P11−
2E11
.9AC
0092
74.6
AC01
6831
.6AC
0168
31.7
MIR
29A
RP1
1−13
8A9.
1LI
NC
−PIN
TM
KLN
1AC
0093
62.2
MKL
N1−
ASR
P11−
180C
16.1
POD
XLAC
0931
06.7
AC09
3106
.4AC
0095
18.2
U87 − MIR29A
−3
−2
−1
0
AUN
IPR
P1−1
25I3
.2PAQR7
STM
N1
RP1
−125
I3.4
PAFA
H2
EXTL
1PD
IK1L
FAM
110D
ZNF5
93R
P11−
96L1
4.7
CN
KSR
1R
P11−
231P
20.2
CEP
85SH
3BG
RL3
UBX
N11
CD
52AI
M1L
DH
DD
SR
P3−4
76K8
.4R
P3−4
76K8
.3
U87 − RP11−96L14.7
−2
−1
0
1
FBXO
24PC
OLC
E−AS
1PC
OLC
EM
OSP
D3
TFR
2G
NB2
GIG
YF1
POP7
EPH
B4SL
C12
A9R
P11−
126L
15.4
TRIP
6SR
RT
UFS
P1AC
HE
MU
C3A
MU
C12
RP1
1−39
5B7.
4TR
IM56
RP1
1−39
5B7.
7SE
RPI
NE1
U87 − RP11−126L15.4
−3
−2
−1
0
CEP
290
RP1
1−47
4L23
.3TM
TC3
KITL
GR
P11−
13A1
.1D
USP
6R
P11−
1109
F11.
3R
P11−
1109
F11.
5PO
C1B
GAL
NT4
RP1
1−73
4K2.
4R
P11−
981P
6.1
ATP2
B1LI
NC
0093
6R
P11−
753N
8.1
LUM
DC
NR
P11−
587P
21.3
C12
orf7
9BT
G1
RP1
1−79
6E2.
4
log2
Fol
d C
hang
e
U87 − RP11−734K2.4
−1.5
−1.0
−0.5
0.0
RP1
1−30
2B13
.5C
CD
C65
FKBP
11Y_
RN
AAR
F3W
NT1
0BD
DN
RP1
1−38
6G11
.5PR
KAG
1KM
T2D
XLO
C_0
1034
7R
HEB
L1LM
BR1L
RP1
1−38
6G11
.10
TUBA
1BTU
BA1A
TUBA
1CR
P11−
977B
10.2
RP1
1−16
1H23
.5R
P11−
161H
23.9
PRPH
U87 − XLOC_010347
−3
−2
−1
0
RP1
1−10
84J3
.1AM
ACR
C1Q
TNF3
RP1
1−10
23L1
7.1
CTD
−202
4P10
.2R
AI14
CTD
−251
7O10
.6TT
C23
LR
AD1
BRIX
1XL
OC
_040
566
DN
AJC
21PR
LRSP
EF2
IL7R
CAP
SLLM
BRD
2SK
P2N
ADK2
RAN
BP3L
SLC
1A3
U87 − XLOC_040566
lncRNA Targeted
Differentially Expressed adj. p < 0.05
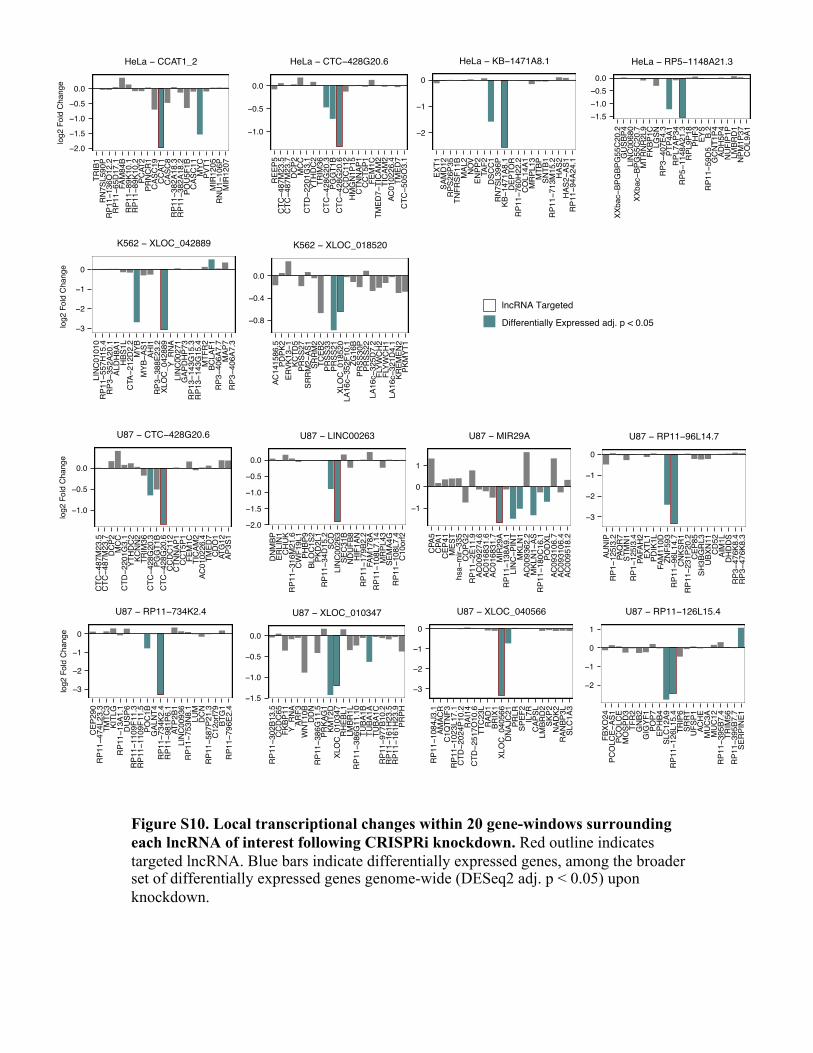
Figure S10. Local transcriptional changes within 20 gene-windows surrounding each lncRNA of interest following CRISPRi knockdown. Red outline indicates targeted lncRNA. Blue bars indicate differentially expressed genes, among the broader set of differentially expressed genes genome-wide (DESeq2 adj. p < 0.05) upon knockdown.

iPS MCF7 MDAMB231 U87 K562 HeLa HEK293T
0
50
100
150
iPS
MCF7
MDAM
B231
U87
K562
HeLa
HEK293T
iPS
MCF7
MDAM
B231
U87
K562
HeLa
HEK293T
iPS
MCF7
MDAM
B231
U87
K562
HeLa
HEK293T
iPS
MCF7
MDAM
B231
U87
K562
HeLa
HEK293T
iPS
MCF7
MDAM
B231
U87
K562
HeLa
HEK293T
iPS
MCF7
MDAM
B231
U87
K562
HeLa
HEK293T
iPS
MCF7
MDAM
B231
U87
K562
HeLa
HEK293T
Scre
en S
core
lncRNA Hits
iPS MCF7 MDAMB231 U87 K562 HeLa HEK293T
0
50
100
150
iPS
MCF7
MDAM
B231
U87
K562
HeLa
HEK293T
iPS
MCF7
MDAM
B231
U87
K562
HeLa
HEK293T
iPS
MCF7
MDAM
B231
U87
K562
HeLa
HEK293T
iPS
MCF7
MDAM
B231
U87
K562
HeLa
HEK293T
iPS
MCF7
MDAM
B231
U87
K562
HeLa
HEK293T
iPS
MCF7
MDAM
B231
U87
K562
HeLa
HEK293T
iPS
MCF7
MDAM
B231
U87
K562
HeLa
HEK293T
Scre
en S
core
Neighbor Hits
iPS Rep1 iPS Rep2 MCF7 Rep1 MCF7 Rep2 MDAMB231 Rep1 MDAMB231 Rep2 U87 Rep1 U87 Rep2 K562 Rep1 K562 Rep2 HeLa Rep1 HeLa Rep2
0
50
100
150
Rep1
Rep2
Rep1
Rep2
Rep1
Rep2
Rep1
Rep2
Rep1
Rep2
Rep1
Rep2
Rep1
Rep2
Rep1
Rep2
Rep1
Rep2
Rep1
Rep2
Rep1
Rep2
Rep1
Rep2
Scre
en S
core
Replicate Comparisons
A B C
D
E
F
829
533
437
344
279
239
145
120
103
75
74
71
70
68
64
62
61
56
55
49
49
40
39
39
26
25
24
24
23
19
11
0
250
500
750
Inte
rse
ctio
n S
ize
GBM HCT116
RPE1 DLD1 HeLa
010002000
Total Hits
Hart et al. 2015 Protein Coding Hits
cell type-unique
shared
shared between all
985
442
416
352
291
190
134
90
89
89
45
29
22
19
8
0
250
500
750
1000
Inte
rse
ctio
n S
ize
KBM7 Jiyoye Raji
K562
0
Total Hits
Wang et al. 2015 Protein Coding Hits
cell type-unique
shared
shared between all
44
3
22222
111111
0000000
2
4
Inte
rsection S
ize
iPSMCF7K562U87
HeLaMDAMB231
HEK293T
0510152025
Total Hits
Neighbor hits
common sublibrary
cell type-unique
shared
shared between all
2500

Figure S11. lncRNA hit specificity is greater than essential protein coding gene specificity. A) Numbers of protein coding gene hits for each set of cell types screened in Hart et al. 2015 and (B) Wang et al. 2015. Wang et al. genes were considered hits if they passed a 5% false discovery threshold set by precision-recall analysis (44). C) Numbers of hits in our study that share promoters with essential protein coding genes (neighbor hits). Blue bars indicate total number of hits in each cell type. D) Distributions of screen scores across all cell types, for lncRNAs and (E) “neighbors” that were called hits in each given cell type. F) Distributions of screen scores across both replicates of each cell type, for lncRNAs that would be called as hits in replicate 1 (left) and in replicate 2 (right).

B HeLa H3K9me3
r = 0.986
log2(RPKM + 0.1) sgRNA 1
log2(R
PK
M +
0.1
) sgR
NA
2
LINC00263
−2 0 2 4 6
−20
24
6
U87 H3K9me3
r = 0.996
log2(RPKM + 0.1) sgRNA 1
log2(R
PK
M +
0.1
) sgR
NA
2LINC00263
−2 0 2 4 6
−20
24
6
D 4941
12
112
1
3
172
2
63
29
1
10
100
1000
PV
T1
LIN
C0
02
63
LIN
C0
09
09
LIN
C0
06
80
# D
E G
en
es HeLa
K562
U87
Differentially Expressed Genes
adj. p < 0.05
0.0
2.5
5.0
7.5
10.0
−2 −1 0 1 2
log2 Fold Change
−log
10(a
dj p
valu
e)
LINC00263 KD − K562 3 − genes adj p < 0.05
RNA5−8S5
ARRDC3
E
A
-10
-5
0
Scre
en z
sco
re
LINC00263
U87
MDAMB231iPS
HEK293TMCF7
HeLaK56
20
10203040
Expr
essi
on (F
PKM
)
LINC00263
Unique SharedHit Type
HU87 lncRNA hitsASO knockdown
IF G
0.0
0.5
1.0
1.5
Rel
ativ
e C
ells
at 1
3d o
r 14d
NC sgRNA
ASO Ctrl
A
sgRNA 1
sgRNA 2
ASO 1
ASO 20.0
0.5
1.0
1.5
2.0
Rel
ativ
e R
NA
LINC00263ASO and sgRNA knockdown
LINC00263ASO and sgRNA phenotype
LOC64
6329
RP6-42F
4.1
CTC-338M
12.4
0.0
0.5
1.0
1.5
Rel
ativ
e R
NA
HeLa sgRNA 1
HeLa sgRNA 2
U87 sgRNA 1
U87 sgRNA 2
0.0
0.5
1.0
1.5
−5 −4 −3 −2 −1 0 1 2 3 4 5
Position Relative to TSS (kb)
Norm
alized
ChI
P−se
q si
gnal
H3K9me3
+/- Relative Enrichment
1kb 45.0 %
2kb 19.2 %
5kb 7.4 %
C
Ctrl A
LOC64
6329
-1
LOC64
6329
-2
RP6-42F
4.1-1
RP6-42F
4.1-2
CTC-338M
12.4-
1
CTC-338M
12.4-
20
10
20
30
40
50
% C
ell C
ycle
U87 lncRNA hitsASO cell cycle phenotype
SG2/M
Ctrl AASO 1ASO 2
NC sgRNA
ASO Ctrl
A
sgRNA 1
sgRNA 2
ASO 1
ASO 2

Figure S12. Cell type-specificity of LINC00263. A) Screen phenotype z scores (red) and expression values (blue) for LINC00263 across the 7 cell types. B) Reproducibility of H3K9me3 ChIP-seq between sgRNA 1 and sgRNA 2 targeting the TSS of LINC00263 in U87 (left) and HeLa (right) cells. C) ChIP-seq enrichment of H3K9me3 surrounding the TSS of LINC00263, comparing 2 independent sgRNAs in U87 and HeLa cells. Smoothed lines were obtained by applying a Gaussian kernel smoother against ChIP-seq coverage that had been background subtracted with coverage of H3K9me3 in cells infected with non-targeting control sgRNAs. Signal was then normalized to the peak of the highest smoothed line. Table summarizes relative enrichment of H3K9me3 at various distances beyond the TSS, obtained from the median value of the smoothed lines at each distance. D) Volcano plots for RNA-seq differential expression following infection of LINC00263 sgRNAs compared to infection of non-targeting sgRNAs in K562 cells. E) Numbers of differentially expressed genes (DESeq2 adj p < 0.05) following knockdown of lncRNAs in HeLa, K562, and U87 cells. For each gene, the same sgRNAs were used across the cell types. F) qPCR comparing LINC00263 knockdown using CRISPRi and ASO. G) Proportion of cells at 14 days post sgRNA infection, or 13 days post ASO transfection against LINC00263, relative to control sgRNA or control ASO, respectively. H) qPCR of ASO knockdown of additional lncRNA hits in U87 cells. I) Percentage of cells in S and G2/M phases following ASO knockdown of additional lncRNA hits in U87.

Supplementary Tables: Table S1 TSS Annotations Table S2 CRiNCL library sgRNAs Table S3 Growth screen sgRNA read counts and phenotypes Table S4 Growth screen gene phenotypes and p-values Table S5 OCT4 screen sgRNA read counts and phenotypes Table S6 OCT4 screen gene phenotypes and p-values Table S7 iPSC protein-coding screen sgRNA and gene phenotypes Table S8 PVT1 tiling library sgRNAs and phenotypes Table S9 Differential expression of genes following lncRNA CRISPRi Table S10 Genomic Properties of lncRNAs Table S11 Individually cloned sgRNAs and primer pairs used in this study

References
1. S. Djebali, C. A. Davis, A. Merkel, A. Dobin, T. Lassmann, A. Mortazavi, A. Tanzer, J. Lagarde, W. Lin, F. Schlesinger, C. Xue, G. K. Marinov, J. Khatun, B. A. Williams, C. Zaleski, J. Rozowsky, M. Röder, F. Kokocinski, R. F. Abdelhamid, T. Alioto, I. Antoshechkin, M. T. Baer, N. S. Bar, P. Batut, K. Bell, I. Bell, S. Chakrabortty, X. Chen, J. Chrast, J. Curado, T. Derrien, J. Drenkow, E. Dumais, J. Dumais, R. Duttagupta, E. Falconnet, M. Fastuca, K. Fejes-Toth, P. Ferreira, S. Foissac, M. J. Fullwood, H. Gao, D. Gonzalez, A. Gordon, H. Gunawardena, C. Howald, S. Jha, R. Johnson, P. Kapranov, B. King, C. Kingswood, O. J. Luo, E. Park, K. Persaud, J. B. Preall, P. Ribeca, B. Risk, D. Robyr, M. Sammeth, L. Schaffer, L.-H. See, A. Shahab, J. Skancke, A. M. Suzuki, H. Takahashi, H. Tilgner, D. Trout, N. Walters, H. Wang, J. Wrobel, Y. Yu, X. Ruan, Y. Hayashizaki, J. Harrow, M. Gerstein, T. Hubbard, A. Reymond, S. E. Antonarakis, G. Hannon, M. C. Giddings, Y. Ruan, B. Wold, P. Carninci, R. Guigó, T. R. Gingeras, Landscape of transcription in human cells. Nature 489, 101–108 (2012). doi:10.1038/nature11233
2. A. R. R. Forrest, H. Kawaji, M. Rehli, J. Kenneth Baillie, M. J. L. de Hoon, V. Haberle, T. Lassmann, I. V. Kulakovskiy, M. Lizio, M. Itoh, R. Andersson, C. J. Mungall, T. F. Meehan, S. Schmeier, N. Bertin, M. Jørgensen, E. Dimont, E. Arner, C. Schmidl, U. Schaefer, Y. A. Medvedeva, C. Plessy, M. Vitezic, J. Severin, C. A. Semple, Y. Ishizu, R. S. Young, M. Francescatto, I. Alam, D. Albanese, G. M. Altschuler, T. Arakawa, J. A. C. Archer, P. Arner, M. Babina, S. Rennie, P. J. Balwierz, A. G. Beckhouse, S. Pradhan-Bhatt, J. A. Blake, A. Blumenthal, B. Bodega, A. Bonetti, J. Briggs, F. Brombacher, A. Maxwell Burroughs, A. Califano, C. V. Cannistraci, D. Carbajo, Y. Chen, M. Chierici, Y. Ciani, H. C. Clevers, E. Dalla, C. A. Davis, M. Detmar, A. D. Diehl, T. Dohi, F. Drabløs, A. S. B. Edge, M. Edinger, K. Ekwall, M. Endoh, H. Enomoto, M. Fagiolini, L. Fairbairn, H. Fang, M. C. Farach-Carson, G. J. Faulkner, A. V. Favorov, M. E. Fisher, M. C. Frith, R. Fujita, S. Fukuda, C. Furlanello, M. Furuno, J. Furusawa, T. B. Geijtenbeek, A. P. Gibson, T. Gingeras, D. Goldowitz, J. Gough, S. Guhl, R. Guler, S. Gustincich, T. J. Ha, M. Hamaguchi, M. Hara, M. Harbers, J. Harshbarger, A. Hasegawa, Y. Hasegawa, T. Hashimoto, M. Herlyn, K. J. Hitchens, S. J. Ho Sui, O. M. Hofmann, I. Hoof, F. Hori, L. Huminiecki, K. Iida, T. Ikawa, B. R. Jankovic, H. Jia, A. Joshi, G. Jurman, B. Kaczkowski, C. Kai, K. Kaida, A. Kaiho, K. Kajiyama, M. Kanamori-Katayama, A. S. Kasianov, T. Kasukawa, S. Katayama, S. Kato, S. Kawaguchi, H. Kawamoto, Y. I. Kawamura, T. Kawashima, J. S. Kempfle, T. J. Kenna, J. Kere, L. M. Khachigian, T. Kitamura, S. Peter Klinken, A. J. Knox, M. Kojima, S. Kojima, N. Kondo, H. Koseki, S. Koyasu, S. Krampitz, A. Kubosaki, A. T. Kwon, J. F. J. Laros, W. Lee, A. Lennartsson, K. Li, B. Lilje, L. Lipovich, A. Mackay-sim, R. Manabe, J. C. Mar, B. Marchand, A. Mathelier, N. Mejhert, A. Meynert, Y. Mizuno, D. A. de Lima Morais, H. Morikawa, M. Morimoto, K. Moro, E. Motakis, H. Motohashi, C. L. Mummery, M. Murata, S. Nagao-

Sato, Y. Nakachi, F. Nakahara, T. Nakamura, Y. Nakamura, K. Nakazato, E. van Nimwegen, N. Ninomiya, H. Nishiyori, S. Noma, T. Nozaki, S. Ogishima, N. Ohkura, H. Ohmiya, H. Ohno, M. Ohshima, M. Okada-Hatakeyama, Y. Okazaki, V. Orlando, D. A. Ovchinnikov, A. Pain, R. Passier, M. Patrikakis, H. Persson, S. Piazza, J. G. D. Prendergast, O. J. L. Rackham, J. A. Ramilowski, M. Rashid, T. Ravasi, P. Rizzu, M. Roncador, S. Roy, M. B. Rye, E. Saijyo, A. Sajantila, A. Saka, S. Sakaguchi, M. Sakai, H. Sato, H. Satoh, S. Savvi, A. Saxena, C. Schneider, E. A. Schultes, G. G. Schulze-Tanzil, A. Schwegmann, T. Sengstag, G. Sheng, H. Shimoji, Y. Shimoni, J. W. Shin, C. Simon, D. Sugiyama, T. Sugiyama, M. Suzuki, N. Suzuki, R. K. Swoboda, P. A. C. ’t Hoen, M. Tagami, N. Takahashi, J. Takai, H. Tanaka, H. Tatsukawa, Z. Tatum, M. Thompson, H. Toyoda, T. Toyoda, E. Valen, M. van de Wetering, L. M. van den Berg, R. Verardo, D. Vijayan, I. E. Vorontsov, W. W. Wasserman, S. Watanabe, C. A. Wells, L. N. Winteringham, E. Wolvetang, E. J. Wood, Y. Yamaguchi, M. Yamamoto, M. Yoneda, Y. Yonekura, S. Yoshida, S. E. Zabierowski, P. G. Zhang, X. Zhao, S. Zucchelli, K. M. Summers, H. Suzuki, C. O. Daub, J. Kawai, P. Heutink, W. Hide, T. C. Freeman, B. Lenhard, V. B. Bajic, M. S. Taylor, V. J. Makeev, A. Sandelin, D. A. Hume, P. Carninci, Y. Hayashizaki, A promoter-level mammalian expression atlas. Nature 507, 462–470 (2014). doi:10.1038/nature13182
3. I. Ulitsky, D. P. Bartel, lincRNAs: Genomics, evolution, and mechanisms. Cell 154, 26–46 (2013). doi:10.1016/j.cell.2013.06.020
4. J. L. Rinn, H. Y. Chang, Genome regulation by long noncoding RNAs. Annu. Rev. Biochem. 81, 145–166 (2012). doi:10.1146/annurev-biochem-051410-092902
5. C. P. Ponting, P. L. Oliver, W. Reik, Evolution and functions of long noncoding RNAs. Cell 136, 629–641 (2009). doi:10.1016/j.cell.2009.02.006
6. A. R. Bassett, A. Akhtar, D. P. Barlow, A. P. Bird, N. Brockdorff, D. Duboule, A. Ephrussi, A. C. Ferguson-Smith, T. R. Gingeras, W. Haerty, D. R. Higgs, E. A. Miska, C. P. Ponting, Considerations when investigating lncRNA function in vivo. eLife 3, e03058 (2014). doi:10.7554/eLife.03058
7. M. Sauvageau, L. A. Goff, S. Lodato, B. Bonev, A. F. Groff, C. Gerhardinger, D. B. Sanchez-Gomez, E. Hacisuleyman, E. Li, M. Spence, S. C. Liapis, W. Mallard, M. Morse, M. R. Swerdel, M. F. D’Ecclessis, J. C. Moore, V. Lai, G. Gong, G. D. Yancopoulos, D. Frendewey, M. Kellis, R. P. Hart, D. M. Valenzuela, P. Arlotta, J. L. Rinn, Multiple knockout mouse models reveal lincRNAs are required for life and brain development. eLife 2, e01749 (2013). doi:10.7554/eLife.01749
8. V. H. Meller, B. P. Rattner, The roX genes encode redundant male-specific lethal transcripts required for targeting of the MSL complex. EMBO J. 21, 1084–1091 (2002). doi:10.1093/emboj/21.5.1084

9. E. Aparicio-Prat, C. Arnan, I. Sala, N. Bosch, R. Guigó, R. Johnson, DECKO: Single-oligo, dual-CRISPR deletion of genomic elements including long non-coding RNAs. BMC Genomics 16, 846 (2015). doi:10.1186/s12864-015-2086-z
10. T.-T. Ho, N. Zhou, J. Huang, P. Koirala, M. Xu, R. Fung, F. Wu, Y.-Y. Mo, Targeting non-coding RNAs with the CRISPR/Cas9 system in human cell lines. Nucleic Acids Res. 43, 10.1093/nar/gku1198 (2014). doi:10.1093/nar/gku1198
11. T. Wang, J. J. Wei, D. M. Sabatini, E. S. Lander, Genetic screens in human cells using the CRISPR-Cas9 system. Science 343, 80–84 (2014). doi:10.1126/science.1246981
12. O. Shalem, N. E. Sanjana, E. Hartenian, X. Shi, D. A. Scott, T. S. Mikkelsen, D. Heckl, B. L. Ebert, D. E. Root, J. G. Doench, F. Zhang, Genome-scale CRISPR-Cas9 knockout screening in human cells. Science 343, 84–87 (2014). doi:10.1126/science.1247005
13. J. Shi, E. Wang, J. P. Milazzo, Z. Wang, J. B. Kinney, C. R. Vakoc, Discovery of cancer drug targets by CRISPR-Cas9 screening of protein domains. Nat. Biotechnol. 33, 661–667 (2015). doi:10.1038/nbt.3235
14. Y. Yin, P. Yan, J. Lu, G. Song, Y. Zhu, Z. Li, Y. Zhao, B. Shen, X. Huang, H. Zhu, S. H. Orkin, X. Shen, Opposing roles for the lncRNA haunt and its genomic locus in regulating HOXA gene activation during embryonic stem cell differentiation. Cell Stem Cell 16, 504–516 (2015). doi:10.1016/j.stem.2015.03.007
15. V. R. Paralkar, C. C. Taborda, P. Huang, Y. Yao, A. V. Kossenkov, R. Prasad, J. Luan, J. O. J. Davies, J. R. Hughes, R. C. Hardison, G. A. Blobel, M. J. Weiss, Unlinking an lncRNA from its associated cis element. Mol. Cell 62, 104–110 (2016). doi:10.1016/j.molcel.2016.02.029
16. A. F. Groff, D. B. Sanchez-Gomez, M. M. L. Soruco, C. Gerhardinger, A. R. Barutcu, E. Li, L. Elcavage, O. Plana, L. V. Sanchez, J. C. Lee, M. Sauvageau, J. L. Rinn, In vivo characterization of Linc-p21 reveals functional cis-regulatory DNA elements. Cell Rep. 16, 2178–2186 (2016). doi:10.1016/j.celrep.2016.07.050
17. S. Zhu, W. Li, J. Liu, C.-H. Chen, Q. Liao, P. Xu, H. Xu, T. Xiao, Z. Cao, J. Peng, P. Yuan, M. Brown, X. S. Liu, W. Wei, Genome-scale deletion screening of human long non-coding RNAs using a paired-guide RNA CRISPR-Cas9 library. Nat. Biotechnol. 10.1038/nbt.3715 (2016). doi:10.1038/nbt.3715
18. M. Guttman, J. Donaghey, B. W. Carey, M. Garber, J. K. Grenier, G. Munson, G. Young, A. B. Lucas, R. Ach, L. Bruhn, X. Yang, I. Amit, A. Meissner, A. Regev, J. L. Rinn, D. E. Root, E. S. Lander, lincRNAs act in the circuitry controlling pluripotency and differentiation. Nature 477, 295–300 (2011). doi:10.1038/nature10398
19. N. Lin, K.-Y. Chang, Z. Li, K. Gates, Z. A. Rana, J. Dang, D. Zhang, T. Han, C.-S. Yang, T. J. Cunningham, S. R. Head, G. Duester, P. D. S. Dong, T. M. Rana, An evolutionarily
conserved long noncoding RNA TUNA controls pluripotency and neural lineage commitment. Mol. Cell 53, 1005–1019 (2014). doi:10.1016/j.molcel.2014.01.021
20. B. Adamson, A. Smogorzewska, F. D. Sigoillot, R. W. King, S. J. Elledge, A genome-wide homologous recombination screen identifies the RNA-binding protein RBMX as a component of the DNA-damage response. Nat. Cell Biol. 14, 318–328 (2012). doi:10.1038/ncb2426
21. Y. Zeng, B. R. Cullen, RNA interference in human cells is restricted to the cytoplasm. RNA 8, 855–860 (2002). doi:10.1017/S1355838202020071
22. L. A. Gilbert, M. H. Larson, L. Morsut, Z. Liu, G. A. Brar, S. E. Torres, N. Stern-Ginossar, O. Brandman, E. H. Whitehead, J. A. Doudna, W. A. Lim, J. S. Weissman, L. S. Qi, CRISPR-mediated modular RNA-guided regulation of transcription in eukaryotes. Cell 154, 442–451 (2013). doi:10.1016/j.cell.2013.06.044
23. L. A. Gilbert, M. A. Horlbeck, B. Adamson, J. E. Villalta, Y. Chen, E. H. Whitehead, C. Guimaraes, B. Panning, H. L. Ploegh, M. C. Bassik, L. S. Qi, M. Kampmann, J. S. Weissman, Genome-scale CRISPR-mediated control of gene repression and activation. Cell 159, 647–661 (2014). doi:10.1016/j.cell.2014.09.029
24. L. S. Qi, M. H. Larson, L. A. Gilbert, J. A. Doudna, J. S. Weissman, A. P. Arkin, W. A. Lim, Repurposing CRISPR as an RNA-guided platform for sequence-specific control of gene expression. Cell 152, 1173–1183 (2013). doi:10.1016/j.cell.2013.02.022
25. H. Nishimasu, L. Cong, W. X. Yan, F. A. Ran, B. Zetsche, Y. Li, A. Kurabayashi, R. Ishitani, F. Zhang, O. Nureki, Crystal structure of Staphylococcus aureus Cas9. Cell 162, 1113–1126 (2015). doi:10.1016/j.cell.2015.08.007
26. J. M. Engreitz, J. E. Haines, G. Munson, J. Chen, E. M. Perez, http://biorxiv.org/content/early/2016/04/28/050948 (2016).
27. A. E. Kornienko, P. M. Guenzl, D. P. Barlow, F. M. Pauler, Gene regulation by the act of long non-coding RNA transcription. BMC Biol. 11, 59 (2013). doi:10.1186/1741-7007-11-59
28. U. A. Ørom, T. Derrien, M. Beringer, K. Gumireddy, A. Gardini, G. Bussotti, F. Lai, M. Zytnicki, C. Notredame, Q. Huang, R. Guigo, R. Shiekhattar, Long noncoding RNAs with enhancer-like function in human cells. Cell 143, 46–58 (2010). doi:10.1016/j.cell.2010.09.001
29. W. Li, D. Notani, Q. Ma, B. Tanasa, E. Nunez, A. Y. Chen, D. Merkurjev, J. Zhang, K. Ohgi, X. Song, S. Oh, H.-S. Kim, C. K. Glass, M. G. Rosenfeld, Functional roles of enhancer RNAs for oestrogen-dependent transcriptional activation. Nature 498, 516–520 (2013). doi:10.1038/nature12210

30. C. P. Fulco, M. Munschauer, R. Anyoha, G. Munson, S. R. Grossman, E. M. Perez, M. Kane, B. Cleary, E. S. Lander, J. M. Engreitz, Systematic mapping of functional enhancer-promoter connections with CRISPR interference. Science 354, 769–773 (2016). doi:10.1126/science.aag2445
31. P. I. Thakore, A. M. D’Ippolito, L. Song, A. Safi, N. K. Shivakumar, A. M. Kabadi, T. E. Reddy, G. E. Crawford, C. A. Gersbach, Highly specific epigenome editing by CRISPR-Cas9 repressors for silencing of distal regulatory elements. Nat. Methods 12, 1143–1149 (2015). doi:10.1038/nmeth.3630
32. A. Amabile, A. Migliara, P. Capasso, M. Biffi, D. Cittaro, L. Naldini, A. Lombardo, Inheritable silencing of endogenous genes by hit-and-run targeted epigenetic editing. Cell 167, 219–232.e14 (2016). doi:10.1016/j.cell.2016.09.006
33. M. A. Mandegar, N. Huebsch, E. B. Frolov, E. Shin, A. Truong, M. P. Olvera, A. H. Chan, Y. Miyaoka, K. Holmes, C. I. Spencer, L. M. Judge, D. E. Gordon, T. V. Eskildsen, J. E. Villalta, M. A. Horlbeck, L. A. Gilbert, N. J. Krogan, S. P. Sheikh, J. S. Weissman, L. S. Qi, P.-L. So, B. R. Conklin, CRISPR interference efficiently induces specific and reversible gene silencing in human iPSCs. Cell Stem Cell 18, 541–553 (2016). doi:10.1016/j.stem.2016.01.022
34. C. J. Braun, P. M. Bruno, M. A. Horlbeck, L. A. Gilbert, J. S. Weissman, M. T. Hemann, Versatile in vivo regulation of tumor phenotypes by dCas9-mediated transcriptional perturbation. Proc. Natl. Acad. Sci. U.S.A. 113, E3892–E3900 (2016). doi:10.1073/pnas.1600582113
35. M. A. Horlbeck, L. A. Gilbert, J. E. Villalta, B. Adamson, R. A. Pak, Y. Chen, A. P. Fields, C. Y. Park, J. E. Corn, M. Kampmann, J. S. Weissman, Compact and highly active next-generation libraries for CRISPR-mediated gene repression and activation. eLife 5, e19760 (2016). doi:10.7554/eLife.19760
36. K. Takahashi, K. Tanabe, M. Ohnuki, M. Narita, T. Ichisaka, K. Tomoda, S. Yamanaka, Induction of pluripotent stem cells from adult human fibroblasts by defined factors. Cell 131, 861–872 (2007). doi:10.1016/j.cell.2007.11.019
37. M. N. Cabili, C. Trapnell, L. Goff, M. Koziol, B. Tazon-Vega, A. Regev, J. L. Rinn, Integrative annotation of human large intergenic noncoding RNAs reveals global properties and specific subclasses. Genes Dev. 25, 1915–1927 (2011). doi:10.1101/gad.17446611
38. M. K. Iyer, Y. S. Niknafs, R. Malik, U. Singhal, A. Sahu, Y. Hosono, T. R. Barrette, J. R. Prensner, J. R. Evans, S. Zhao, A. Poliakov, X. Cao, S. M. Dhanasekaran, Y.-M. Wu, D. R. Robinson, D. G. Beer, F. Y. Feng, H. K. Iyer, A. M. Chinnaiyan, The landscape of long noncoding RNAs in the human transcriptome. Nat. Genet. 47, 199–208 (2015). doi:10.1038/ng.3192

39. A. Yates, W. Akanni, M. R. Amode, D. Barrell, K. Billis, D. Carvalho-Silva, C. Cummins, P. Clapham, S. Fitzgerald, L. Gil, C. G. Girón, L. Gordon, T. Hourlier, S. E. Hunt, S. H. Janacek, N. Johnson, T. Juettemann, S. Keenan, I. Lavidas, F. J. Martin, T. Maurel, W. McLaren, D. N. Murphy, R. Nag, M. Nuhn, A. Parker, M. Patricio, M. Pignatelli, M. Rahtz, H. S. Riat, D. Sheppard, K. Taylor, A. Thormann, A. Vullo, S. P. Wilder, A. Zadissa, E. Birney, J. Harrow, M. Muffato, E. Perry, M. Ruffier, G. Spudich, S. J. Trevanion, F. Cunningham, B. L. Aken, D. R. Zerbino, P. Flicek, Ensembl 2016. Nucleic Acids Res. 44, D710–D716 (2015). doi:10.1093/nar/gkv1157
40. ENCODE Project Consortium, The ENCODE (ENCyclopedia Of DNA Elements) Project. Science 306, 636–640 (2004). doi:10.1126/science.1105136
41. F. R. Kreitzer et al., A robust method to derive functional neural crest cells from human pluripotent stem cells. Am. J. Stem Cells 2, 119–131 (2013).
42. S. J. Liu, T. J. Nowakowski, A. A. Pollen, J. H. Lui, M. A. Horlbeck, F. J. Attenello, D. He, J. S. Weissman, A. R. Kriegstein, A. A. Diaz, D. A. Lim, Single-cell analysis of long non-coding RNAs in the developing human neocortex. Genome Biol. 17, 67 (2016). doi:10.1186/s13059-016-0932-1
43. M. Kampmann, M. C. Bassik, J. S. Weissman, Integrated platform for genome-wide screening and construction of high-density genetic interaction maps in mammalian cells. Proc. Natl. Acad. Sci. U.S.A. 110, E2317–E2326 (2013). doi:10.1073/pnas.1307002110
44. T. Hart, K. R. Brown, F. Sircoulomb, R. Rottapel, J. Moffat, Measuring error rates in genomic perturbation screens: Gold standards for human functional genomics. Mol. Syst. Biol. 10, 733 (2014). doi:10.15252/msb.20145216
45. Y.-Y. Tseng et al., PVT1 dependence in cancer with MYC copy-number increase. Nature 512, 82–86 (2014).
46. T. Wang, K. Birsoy, N. W. Hughes, K. M. Krupczak, Y. Post, J. J. Wei, E. S. Lander, D. M. Sabatini, Identification and characterization of essential genes in the human genome. Science 350, 1096–1101 (2015). doi:10.1126/science.aac7041
47. T. Hart, M. Chandrashekhar, M. Aregger, Z. Steinhart, K. R. Brown, G. MacLeod, M. Mis, M. Zimmermann, A. Fradet-Turcotte, S. Sun, P. Mero, P. Dirks, S. Sidhu, F. P. Roth, O. S. Rissland, D. Durocher, S. Angers, J. Moffat, High-resolution CRISPR screens reveal fitness genes and genotype-specific cancer liabilities. Cell 163, 1515–1526 (2015). doi:10.1016/j.cell.2015.11.015
48. R. Andersson, C. Gebhard, I. Miguel-Escalada, I. Hoof, J. Bornholdt, M. Boyd, Y. Chen, X. Zhao, C. Schmidl, T. Suzuki, E. Ntini, E. Arner, E. Valen, K. Li, L. Schwarzfischer, D. Glatz, J. Raithel, B. Lilje, N. Rapin, F. O. Bagger, M. Jørgensen, P. R. Andersen, N. Bertin, O. Rackham, A. M. Burroughs, J. K. Baillie, Y. Ishizu, Y. Shimizu, E. Furuhata, S. Maeda, Y. Negishi, C. J. Mungall, T. F. Meehan, T. Lassmann, M. Itoh, H. Kawaji, N.

Kondo, J. Kawai, A. Lennartsson, C. O. Daub, P. Heutink, D. A. Hume, T. H. Jensen, H. Suzuki, Y. Hayashizaki, F. Müller, T. F. A. N. T. O. M. Consortium, A. R. R. Forrest, P. Carninci, M. Rehli, A. Sandelin, An atlas of active enhancers across human cell types and tissues. Nature 507, 455–461 (2014). doi:10.1038/nature12787
49. A. Visel, S. Minovitsky, I. Dubchak, L. A. Pennacchio, VISTA Enhancer Browser–a database of tissue-specific human enhancers. Nucleic Acids Res. 35, D88–D92 (2007). doi:10.1093/nar/gkl822
50. X. Yan, Z. Hu, Y. Feng, X. Hu, J. Yuan, S. D. Zhao, Y. Zhang, L. Yang, W. Shan, Q. He, L. Fan, L. E. Kandalaft, J. L. Tanyi, C. Li, C.-X. Yuan, D. Zhang, H. Yuan, K. Hua, Y. Lu, D. Katsaros, Q. Huang, K. Montone, Y. Fan, G. Coukos, J. Boyd, A. K. Sood, T. Rebbeck, G. B. Mills, C. V. Dang, L. Zhang, Comprehensive genomic characterization of long non-coding RNAs across human cancers. Cancer Cell 28, 529–540 (2015). doi:10.1016/j.ccell.2015.09.006
51. D. Hnisz, B. J. Abraham, T. I. Lee, A. Lau, V. Saint-André, A. A. Sigova, H. A. Hoke, R. A. Young, Super-enhancers in the control of cell identity and disease. Cell 155, 934–947 (2013). doi:10.1016/j.cell.2013.09.053
52. J. Chen, A. A. Shishkin, X. Zhu, S. Kadri, I. Maza, M. Guttman, J. H. Hanna, A. Regev, M. Garber, Evolutionary analysis across mammals reveals distinct classes of long non-coding RNAs. Genome Biol. 17, 19 (2016). doi:10.1186/s13059-016-0880-9
53. K. C. Wang, Y. W. Yang, B. Liu, A. Sanyal, R. Corces-Zimmerman, Y. Chen, B. R. Lajoie, A. Protacio, R. A. Flynn, R. A. Gupta, J. Wysocka, M. Lei, J. Dekker, J. A. Helms, H. Y. Chang, A long noncoding RNA maintains active chromatin to coordinate homeotic gene expression. Nature 472, 120–124 (2011). doi:10.1038/nature09819
54. W. Ma, F. Ay, C. Lee, G. Gulsoy, X. Deng, S. Cook, J. Hesson, C. Cavanaugh, C. B. Ware, A. Krumm, J. Shendure, C. A. Blau, C. M. Disteche, W. S. Noble, Z. Duan, Fine-scale chromatin interaction maps reveal the cis-regulatory landscape of human lincRNA genes. Nat. Methods 12, 71–78 (2015). doi:10.1038/nmeth.3205
55. J. M. Engreitz, A. Pandya-Jones, P. McDonel, A. Shishkin, K. Sirokman, C. Surka, S. Kadri, J. Xing, A. Goren, E. S. Lander, K. Plath, M. Guttman, The Xist lncRNA exploits three-dimensional genome architecture to spread across the X chromosome. Science 341, 1237973 (2013). doi:10.1126/science.1237973
56. A. Necsulea, M. Soumillon, M. Warnefors, A. Liechti, T. Daish, U. Zeller, J. C. Baker, F. Grützner, H. Kaessmann, The evolution of lncRNA repertoires and expression patterns in tetrapods. Nature 505, 635–640 (2014). doi:10.1038/nature12943
57. A. D. Ramos, R. E. Andersen, S. J. Liu, T. J. Nowakowski, S. J. Hong, C. C. Gertz, R. D. Salinas, H. Zarabi, A. R. Kriegstein, D. A. Lim, The long noncoding RNA Pnky regulates

neuronal differentiation of embryonic and postnatal neural stem cells. Cell Stem Cell 16, 439–447 (2015). doi:10.1016/j.stem.2015.02.007
58. M. Kretz, Z. Siprashvili, C. Chu, D. E. Webster, A. Zehnder, K. Qu, C. S. Lee, R. J. Flockhart, A. F. Groff, J. Chow, D. Johnston, G. E. Kim, R. C. Spitale, R. A. Flynn, G. X. Y. Zheng, S. Aiyer, A. Raj, J. L. Rinn, H. Y. Chang, P. A. Khavari, Control of somatic tissue differentiation by the long non-coding RNA TINCR. Nature 493, 231–235 (2013). doi:10.1038/nature11661
59. T. Gutschner, M. Hammerle, M. Eissmann, J. Hsu, Y. Kim, G. Hung, A. Revenko, G. Arun, M. Stentrup, M. Gross, M. Zornig, A. R. MacLeod, D. L. Spector, S. Diederichs, The noncoding RNA MALAT1 is a critical regulator of the metastasis phenotype of lung cancer cells. Cancer Res. 73, 1180–1189 (2013). doi:10.1158/0008-5472.CAN-12-2850
60. R. A. Gupta, N. Shah, K. C. Wang, J. Kim, H. M. Horlings, D. J. Wong, M.-C. Tsai, T. Hung, P. Argani, J. L. Rinn, Y. Wang, P. Brzoska, B. Kong, R. Li, R. B. West, M. J. van de Vijver, S. Sukumar, H. Y. Chang, Long non-coding RNA HOTAIR reprograms chromatinstate to promote cancer metastasis. Nature 464, 1071–1076 (2011). doi:10.1038/nature08975
61. J. A. Briggs, E. J. Wolvetang, J. S. Mattick, J. L. Rinn, G. Barry, Mechanisms of long non-coding RNAs in mammalian nervous system development, plasticity, disease, and evolution. Neuron 88, 861–877 (2015). doi:10.1016/j.neuron.2015.09.045
62. C. Trapnell, B. A. Williams, G. Pertea, A. Mortazavi, G. Kwan, M. J. van Baren, S. L. Salzberg, B. J. Wold, L. Pachter, Transcript assembly and quantification by RNA-Seq reveals unannotated transcripts and isoform switching during cell differentiation. Nat. Biotechnol. 28, 511–515 (2010). doi:10.1038/nbt.1621
63. N. Salomonis, P. J. Dexheimer, L. Omberg, R. Schroll, S. Bush, J. Huo, L. Schriml, S. Ho Sui, M. Keddache, C. Mayhew, S. K. Shanmukhappa, J. Wells, K. Daily, S. Hubler, Y. Wang, E. Zambidis, A. Margolin, W. Hide, A. K. Hatzopoulos, P. Malik, J. A. Cancelas, B. J. Aronow, C. Lutzko, Integrated genomic analysis of diverse induced pluripotent stem cells from the Progenitor Cell Biology Consortium. Stem Cell Rep. 7, 110–125 (2016). doi:10.1016/j.stemcr.2016.05.006
64. B. Langmead, C. Trapnell, M. Pop, S. L. Salzberg, Ultrafast and memory-efficient alignment of short DNA sequences to the human genome. Genome Biol. 10, R25 (2009). doi:10.1186/gb-2009-10-3-r25
65. D. Kim, B. Langmead, S. L. Salzberg, HISAT: A fast spliced aligner with low memory requirements. Nat. Methods 12, 357–360 (2015). doi:10.1038/nmeth.3317
66. Y. Liao, G. K. Smyth, W. Shi, featureCounts: An efficient general purpose program for assigning sequence reads to genomic features. Bioinformatics 30, 923–930 (2013). doi:10.1093/bioinformatics/btt656

67. S. Anders, W. Huber, Differential expression analysis for sequence count data. Genome Biol. 11, R106 (2010). doi:10.1186/gb-2010-11-10-r106
68. H. O’Geen, L. Echipare, P. J. Farnham, Using ChIP-seq technology to generate high-resolution profiles of histone modifications. Methods Mol. Biol. 791, 265–286 (2011). doi:10.1007/978-1-61779-316-5_20
69. B. Langmead, S. L. Salzberg, Fast gapped-read alignment with Bowtie 2. Nat. Methods 9, 357–359 (2012). doi:10.1038/nmeth.1923
70. F. Ramírez, D. P. Ryan, B. Grüning, V. Bhardwaj, F. Kilpert, A. S. Richter, S. Heyne, F. Dündar, T. Manke, deepTools2: A next generation web server for deep-sequencing data analysis. Nucleic Acids Res. 44, W160–W165 (2016). doi:10.1093/nar/gkw257