supplementary material the cerato-platanin protein epl-1 from … · 2015-12-09 ·...
TRANSCRIPT

Supplementary Material
The Cerato-Platanin protein Epl-1 from Trichoderma harzianum is involved in mycoparasitism, plant resistance induction and self cell wall protection Eriston Vieira Gomes1, Mariana do Nascimento Costa1, Renato Graciano de Paula1, Rafael Ricci de Azevedo2, Francilene Lopes da Silva3, Eliane F. Noronha3, Cirano José Ulhoa4, Valdirene Neves Monteiro5, Rosa Elena Cardoza6, Santiago Gutiérrez6, Roberto Nascimento Silva1*
1 - Department of Biochemistry and Immunology, Ribeirão Preto Medical School, University of São Paulo, Ribeirão Preto, SP, Brazil.
2 - Department of Molecular and Cellular Biology and Pathogenic Bioagents, Ribeirão Preto Medical School, University of São Paulo, Ribeirão Preto, SP, Brazil.
3 - Department of Cellular Biology, University of Brasilia, Brasília, Distrito Federal, Brazil.
4 - Department of Biochemistry and Cellular Biology, Biological Sciences Institute, Federal University of Goias, Goiânia, Goiás, Brazil.
5 - Department of Biochemistry, State University of Goias, Anápolis, Goiás, Brazil.
6 - Department of Microbiology, University School of Agricultural Engineers, University of León, Ponferrada, Spain.
*Correspondence:
Dr. Roberto do Nascimento Silva
University of São Paulo
Ribeirão Preto Medical School
Department of Biochemistry and Immunology
3900, Bandeirantes Av.
14049-900
Ribeirão Preto, SP

1 - Supplementary Figures:
Supplementary Figure 1: Analysis of potential O-glycosylation sites in T. harzianum
Epl-1 protein sequence. The red horizontal line indicates the threshold potential O-
glycosylation. The blue vertical lines indicate the position of the site in the protein
sequence. Sites with blue vertical lines which cross the red threshold line have potential
O-glycosylation.
Supplementary Figure 2: Analysis of potential O-β-N-Acetil-Glicosilation sites in T.
harzianum Epl-1 protein sequence. The horizontal blue line indicates the threshold
potential O-β-N-Acetyl glycosylation. The green vertical lines indicate the position of the
site in the protein sequence. Sites with green vertical lines exceeding the threshold blue
line have a potential of O-β-N-Acetyl glycosylation.

Supplementary Figure 3: Analysis of potential phosphorylation sites on T. harzianum
Epl-1 protein sequence. The horizontal gray line indicates the threshold phosphorylation
potential. The vertical colored lines indicate the potential amino acid; the position of the
potential amino acid in the protein sequence. Sites with vertical lines cross the threshold
line present potential phosphorylation.

Supplementary Figure 4: Representation of predicted regulatory motifs in the promoter
region of T. harzianum epl-1 gene. The numbers indicate the position relative to the ATG
translation start codon. Arrows indicate the orientation of the motif in the sense (5 '→ 3')
and antisense strands (5 '← 3') respectively. CAAT box and TATAA box – transcription
initiation sites; MYC-1 – Mycoparasitism Response Element -1; CreA – Carbon
response regulator; GCCARG – pH regulatory protein site; CCCCT – Stress response
elements; HGATAR – Global nitrogen regulation.
epl-‐ATG
5’
3’

Supplementary Figure 5: Transformants screening scheme. A – Schematic
representation of the genomic region containing the epl-1 gene and the respective
annealing sites of mutant screening primers set (MSEpl-1) (arrows). B – Mutant
screening: agarose gel electrophoresis of epl-1 gene PCR amplification. WT - T.
harzianum wild type (1090 bp); 1 – 12- Screening of mitotically stable ∆epl-1
transformants (3457bp). C - Mutant screening agarose gel electrophoresis of hph gene
PCR amplification. WT - T. harzianum wild type (no amplification); 1 – 12- Screening
A
B
C
of mitotically stable ∆epl-1 transformants (600bp). Individuals marked with orange
rectangle were selected for further analysis; (1kb) Molecular weight marker.
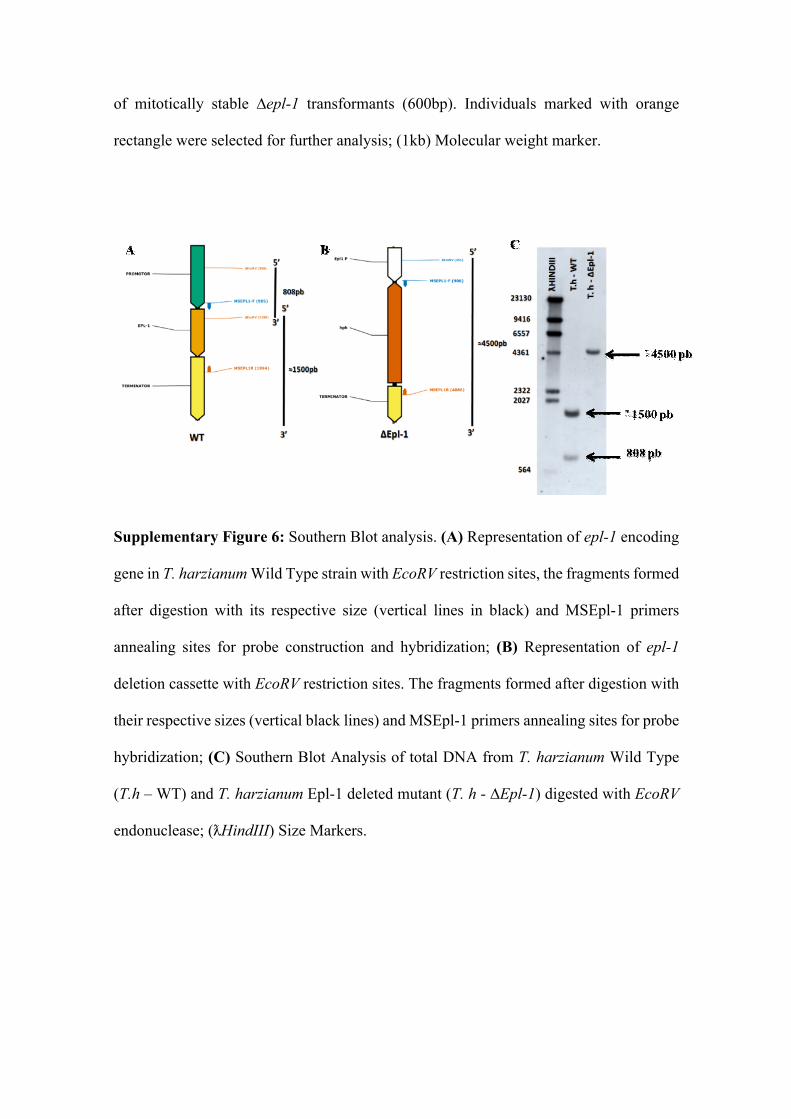
Supplementary Figure 6: Southern Blot analysis. (A) Representation of epl-1 encoding
gene in T. harzianum Wild Type strain with EcoRV restriction sites, the fragments formed
after digestion with its respective size (vertical lines in black) and MSEpl-1 primers
annealing sites for probe construction and hybridization; (B) Representation of epl-1
deletion cassette with EcoRV restriction sites. The fragments formed after digestion with
their respective sizes (vertical black lines) and MSEpl-1 primers annealing sites for probe
hybridization; (C) Southern Blot Analysis of total DNA from T. harzianum Wild Type
(T.h – WT) and T. harzianum Epl-1 deleted mutant (T. h - ∆Epl-1) digested with EcoRV
endonuclease; (ƛHindIII) Size Markers.
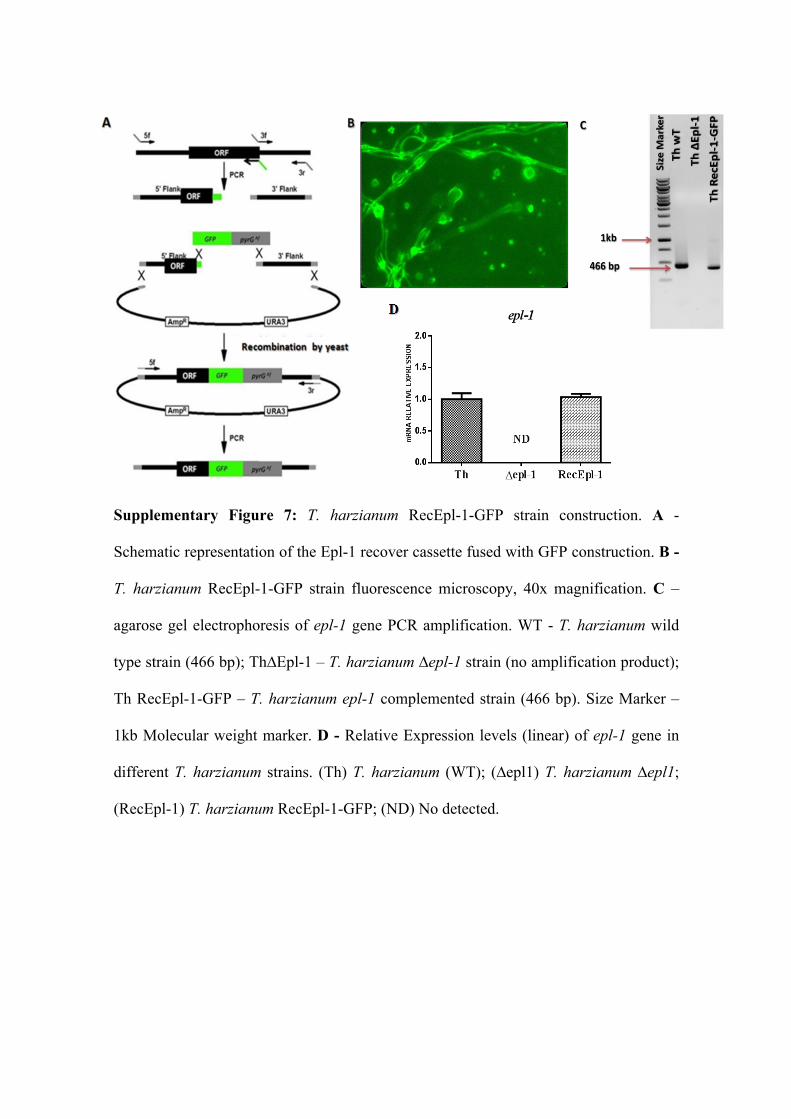
Supplementary Figure 7: T. harzianum RecEpl-1-GFP strain construction. A -
Schematic representation of the Epl-1 recover cassette fused with GFP construction. B -
T. harzianum RecEpl-1-GFP strain fluorescence microscopy, 40x magnification. C –
agarose gel electrophoresis of epl-1 gene PCR amplification. WT - T. harzianum wild
type strain (466 bp); Th∆Epl-1 – T. harzianum ∆epl-1 strain (no amplification product);
Th RecEpl-1-GFP – T. harzianum epl-1 complemented strain (466 bp). Size Marker –
1kb Molecular weight marker. D - Relative Expression levels (linear) of epl-1 gene in
different T. harzianum strains. (Th) T. harzianum (WT); (∆epl1) T. harzianum ∆epl1;
(RecEpl-1) T. harzianum RecEpl-1-GFP; (ND) No detected.
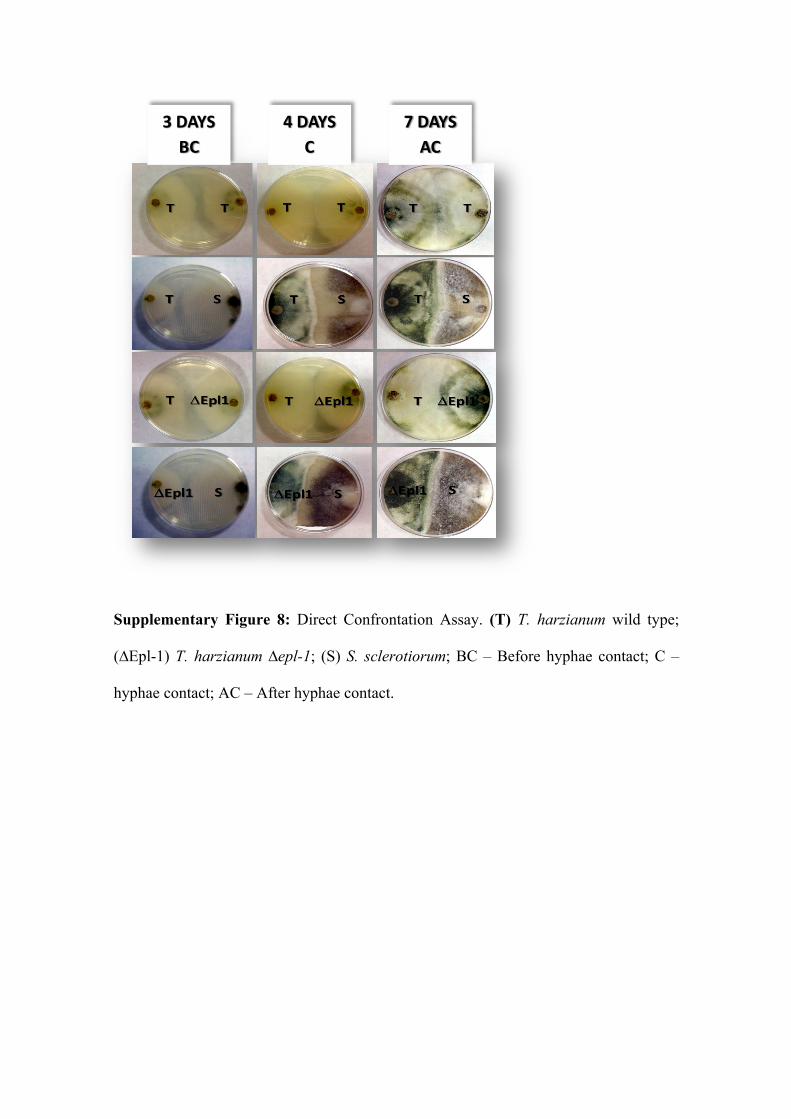
Supplementary Figure 8: Direct Confrontation Assay. (T) T. harzianum wild type;
(∆Epl-1) T. harzianum ∆epl-1; (S) S. sclerotiorum; BC – Before hyphae contact; C –
hyphae contact; AC – After hyphae contact.
3 DAYS BC
4 DAYS C
7 DAYS AC
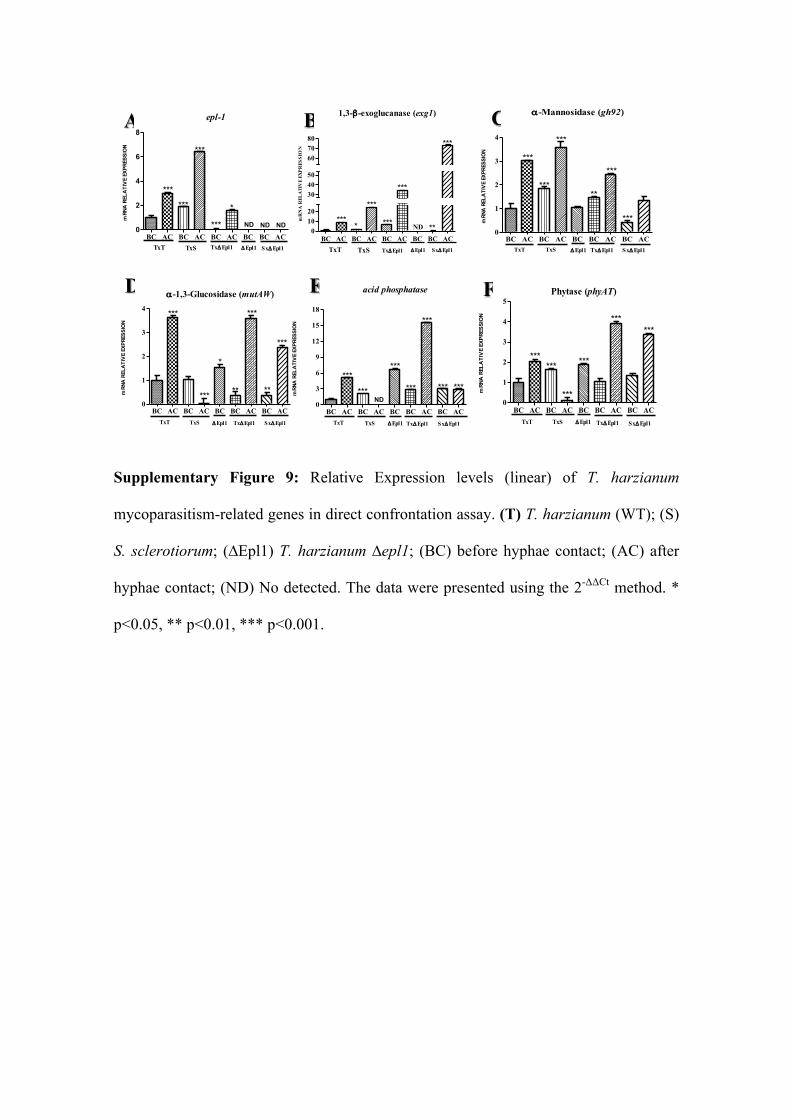
Supplementary Figure 9: Relative Expression levels (linear) of T. harzianum
mycoparasitism-related genes in direct confrontation assay. (T) T. harzianum (WT); (S)
S. sclerotiorum; (∆Epl1) T. harzianum ∆epl1; (BC) before hyphae contact; (AC) after
hyphae contact; (ND) No detected. The data were presented using the 2-ΔΔCt method. *
p<0.05, ** p<0.01, *** p<0.001.
epl-1
BC AC BC AC BC AC BC BC AC0
2
4
6
8mRNA RELATIVE EXPRESSION
*
******
***
*** ND
TxT TxS TxΔEpl1 SxΔEpl1ΔEpl1
ND ND
1,3-β-exoglucanase (exg1)
BC AC BC AC BC AC BC BC AC0
1020
304050
607080
mR
NA
REL
ATI
VE
EXPR
ESSI
ON
******
* ***
***
***
**
TxT TxS TxΔEpl1 SxΔEpl1
ND
ΔEpl1
α-Mannosidase (gh92)
BC AC BC AC BC BC AC BC AC0
1
2
3
4
mRNA RELATIVE EXPRESSION
TxT TxS TxΔEpl1 SxΔEpl1ΔEpl1
***
***
***
**
***
***
α-1,3-Glucosidase (mutAW)
BC AC BC AC BC BC AC BC AC0
1
2
3
4
mRNA RELATIVE EXPRESSION
TxT TxS TxΔEpl1 SxΔEpl1ΔEpl1
***
***
*
***** **
***
acid phosphatase
BC AC BC AC BC BC AC BC AC0
3
6
9
12
15
18
mRNA RELATIVE EXPRESSION
TxT TxS TxΔEpl1 SxΔEpl1ΔEpl1
*** ***
***
ND
***
*** ******
Phytase (phyAT)
BC AC BC AC BC BC AC BC AC0
1
2
3
4
5
mRNA RELATIVE EXPRESSION
TxT TxS TxΔEpl1 SxΔEpl1ΔEpl1
***
******
***
***
***
A B C
D E F

Supplementary Figure 10: Relative Expression of T. harzianum mycoparasitism-related
genes in direct confrontation assay. (T) T. harzianum (WT); (S) S. sclerotiorum; (∆Epl1)
T. harzianum ∆epl1; (NC) no hyphae contact; (C) with hyphae contact; (ND) No detected.
The data were presented using the 2-ΔΔCt method.* p<0.05, ** p<0.01, *** p<0.001.
A B C
D E F
Chitinase (nag1)
BC AC BC AC BC BC AC BC AC0123456789
10mRNA RELATIVE EXPRESSION
TxT TxS TxΔEpl1 SxΔEpl1ΔEpl1
***
***
***
***
***
Chitinase (chit33)
BC AC BC AC BC BC AC BC AC0
1
2
3
4
mRNA RELATIVE EXPRESSION
TxT TxS TxΔEpl1 SxΔEpl1ΔEpl1
*********
******
Chitinase (chit42)
BC AC BC AC BC BC AC BC AC0
2
4
6
mRNA RELATIVE EXPRESSION
TxT TxS TxΔEpl1 SxΔEpl1ΔEpl1
******
**
***
***
***
Aspartyl Protease (papA)
BC AC BC AC BC BC AC BC AC0
1
2
3
4
5
6
mRNA RELATIVE EXPRESSION
TxT TxS TxΔEpl1 SxΔEpl1ΔEpl1
******
***
***
*** ***
***
Trypsin-like Protease (PRA1)
BC AC BC AC BC BC AC BC AC02468
1012141618
mRNA RELATIVE EXPRESSION
TxT TxS TxΔEpl1 SxΔEpl1ΔEpl1
****** ***
******
***
***
Serine Protease (sprT)
BC AC BC AC BC BC AC BC AC0
3
630
35
40
mRNA RELATIVE EXPRESSION
TxT TxS TxΔEpl1 SxΔEpl1ΔEpl1
***
******
****
***

Supplementary Figure 11: Construction of Epl-1 deletion vector. A - pBluescript SK+
vector with selection hph-cassette (pBShph) with its respective restriction sites. B –
Complete pBShphEpl-1 deletion vector with promoter and terminator epl-1 region in its
respective cloning sites.
A B
A B

Supplementary Figure 12: Schematic Bell et al., 1982 modified method, to classify
Trichoderma strains in antagonistic activity assay in plate. TRIC. – T. harzianum strains.
PAT. – Pathogen strains.
2 - Supplementary Videos Legends:
Supplementary Video 1: Fluorescence microscopy of Trichoderma harzianum
RecEpl-1-GFP strain hyphae in 20x optical magnification.
Supplementary Video 2: Fluorescence microscopy of Trichoderma harzianum
RecEpl-1-GFP strain hyphae in 40x optical magnification.